Al Barsha Night Partner +0567686026 Call Girls Dubai
DEQO XASAN.docx
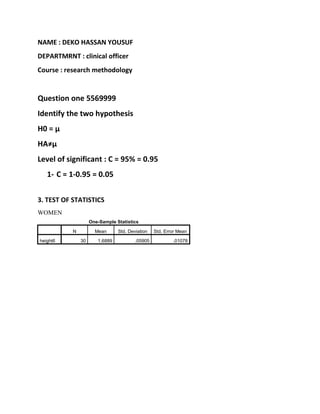
1. NAME : DEKO HASSAN YOUSUF
DEPARTMRNT : clinical officer
Course : research methodology
Question one 5569999
Identify the two hypothesis
H0 = µ
HA≠µ
Level of significant : C = 95% = 0.95
1- C = 1-0.95 = 0.05
3. TEST OF STATISTICS
WOMEN
One-Sample Statistics
N Mean Std. Deviation Std. Error Mean
height6 30 1.6889 .05905 .01078
2. One-Sample Test
6666666
6666666
6666662
2
Test Value = 159.5
t df Sig. (2-tailed) Mean Difference 95% Confidence I
nterval of the Difference
Lower Upper
height6 -14638.082 29 .000 -157.81113 -157.8332 -157.7891
MEN
height 30 1.7687 .07731 .01412
One-Sample Test
Test Value = 171
3. t df Sig. (2-tailed) Mean Difference 95% Confidence Interval of the
Difference
Lower Upper
height -11988.992 29 .000 -169.23133 -169.2602 -169.2025
Paired Samples Statistics
Mean N Std. Deviation Std. Error Mean
Pair 1
preop 38.5333 12 30.05868 8.67719
postop 56.6083 12 27.80011 8.02520
Paired Samples Correlations
N Correlation Sig.
Pair 1 preop & postop 12 .364 .245
--
Paired Samples Test
- Paired Differences t
Mean Std. Deviation Std. Error Mean 95% Confidence Interval of the
Difference
Lower Upper
Pair 1 preop - postop -18.07500 32.68169 9.43439 -38.83996 2.68996 -1.91
1] H0=U1-U2=O
HA=U1-U2 NOT =0
2} C=95% PVALUE= 0.05
3} TEST STATICS
4=FAILED TO REJCT HO
4. ANOVA
FETUS
Sum of Squares df Mean Square F Sig.
Between Groups 96.150 3 32.050 4.628 .016
Within Groups 110.800 16 6.925
Total 206.950 19
ANOVA
FETUS
Sum of Squares df Mean Square F Sig.
Between Groups 96.150 3 32.050 4.628 .016
Within Groups 110.800 16 6.925
Total 206.950 19
ANOVA
FETUS
Sum of Squares df Mean Square F Sig.
Between Groups 96.150 3 32.050 4.628 .016
Within Groups 110.800 16 6.925
Total 206.950 19
ANOVA
FETUS
Sum of Squares df Mean Square F Sig.
Between Groups 96.150 3 32.050 4.628 .016
Within Groups 110.800 16 6.925
Total 206.950 19
ANOVA
FETUS
Sum of Squares df Mean Square F Sig.
Between Groups 96.150 3 32.050 4.628 .016
Within Groups 110.800 16 6.925
5. Total 206.950 19
ANOVA
FETUS
Sum of Squares df Mean Square F Sig.
Between Groups 96.150 3 32.050 4.628 .016
Within Groups 110.800 16 6.925
Total 206.950 19
ANOVA
FETUS
Sum of Squares df Mean Square F Sig.
Between Groups 96.150 3 32.050 4.628 .016
Within Groups 110.800 16 6.925
Total 206.950 19
ANOVA
FETUS
Sum of Squares df Mean Square F Sig.
Between Groups 96.150 3 32.050 4.628 .016
Within Groups 110.800 16 6.925
Total 206.950 19
ANOVA
FETUS
Sum of Squares df Mean Square F Sig.
Between Groups 96.150 3 32.050 4.628 .016
Within Groups 110.800 16 6.925
Total 206.950 19
ANOVA
FETUS
Sum of Squares df Mean Square F Sig.
6. Between Groups 96.150 3 32.050 4.628 .016
Within Groups 110.800 16 6.925
Total 206.950 19
ANOVA
FETUS
Sum of Squares df Mean Square F Sig.
Between Groups 96.150 3 32.050 4.628 .016
Within Groups 110.800 16 6.925
Total 206.950 19
ANOVA
FETUS
Sum of Squares df Mean Square F Sig.
Between Groups 96.150 3 32.050 4.628 .016
Within Groups 110.800 16 6.925
Total 206.950 19
ANOVA
FETUS
Sum of Squares df Mean Square F Sig.
Between Groups 96.150 3 32.050 4.628 .016
Within Groups 110.800 16 6.925
Total 206.950 19
ANOVA
FETUS
Sum of Squares df Mean Square F Sig.
Between Groups 96.150 3 32.050 4.628 .016
Within Groups 110.800 16 6.925
Total 206.950 19
ANOVA
7. FETUS
Sum of Squares df Mean Square F Sig.
Between Groups 96.150 3 32.050 4.628 .016
Within Groups 110.800 16 6.925
Total 206.950 19
ANOVA
FETUS
Sum of Squares df Mean Square F Sig.
Between Groups 96.150 3 32.050 4.628 .016
Within Groups 110.800 16 6.925
Total 206.950 19
ANOVA
FETUS
Sum of Squares df Mean Square F Sig.
Between Groups 96.150 3 32.050 4.628 .016
Within Groups 110.800 16 6.925
Total 206.950 19
ANOVA
FETUS
Sum of Squares df Mean Square F Sig.
Between Groups 96.150 3 32.050 4.628 .016
Within Groups 110.800 16 6.925
Total 206.950 19
ANOVA
FETUS
Sum of Squares df Mean Square F Sig.
Between Groups 96.150 3 32.050 4.628 .016
Within Groups 110.800 16 6.925
Total 206.950 19
8. 1}HO=µ
HA ≠µ
2}C=95% PVALUE
3]TEST STASTICS
4]REJECT THE NULL HO
Group Statistics
MEASURMENT N Mean Std. Deviation Std. Error Mean
SMOKING
SMOKING 10 45.3300 20.83576 6.58885
NONSMOKING 12 32.5833 16.42204 4.74063
Independent Samples Test
Levene's Test for Equality of Variances
F Sig. t df Sig. (2-tailed
SMOKING
Equal variances assumed 1.693 .208 1.606 20 .1
Equal variances not assumed 1.570 17.002 .1
1}HO=µ
HA≠µ
2}C=95%=O.05
3]TEST OF STATISTIC
4]FAILED TO REJECT THE HO