1. BAHLAKOANA DANIEL KIKINE
ADVISOR: Assoc. Prof. Dr. Aynur Şensoy Şorman
HYDROELECTRICTY POTENTIAL INVESTIGATION
OF RUN-OF-RIVER HYDROPOWER PLANT-CASE
STUDY (A)
PROJE FUARI 2014
The renewable energy usage is becoming more
critical issue as the energy consumption and
correspondingly pollution rates rise each year. The
run-of-river hydropower plants provide clean energy
on any river with sufficient flow and head. Initially,
the flow duration curve, which states the frequency
of flow with respect to time probability, is derived.
Then the calculated Energy-Power curve is used to
determine the optimal capacity of the plant by
considering the marginal benefits versus the
marginal costs. The annual investment,
operation/maintenance cost are calculated for
different installed capacities. The optimal design
flow of 2.57 m3/s which belong to 10% of time
probability is determined with optimization study. In
the end, 2.1 MW/yr optimal turbine power using
Francis turbine with 92.2 m net head for 40 years
economical life and corresponding to 5172.55
MWh/yr energy are estimated. Afterwards, the cash
flow diagram is derived to determine the profit
breakeven point of the project. The calculations
were also conducted through RETScreen program,
and the profit breakeven point of 7 years is
determined. The one year energy production can
supply up to 1400 homes.
The marginal cost versus marginal benefit, and the
Income analysis were carried out to determinine
the optimal capacity of the plant. The calculations
were also run on the RETScreen sofware.
0.00
0.01
0.10
1.00
10.00
100.00
0 10 20 30 40 50 60 70 80 90 100
Discharge(m3/s)
time flow exceeded (%)
0
500
1000
1500
2000
2500
3000
3500
4000
0 10 20 30 40 50 60 70 80 90 100
Power(KW)
% Time
RETScreen is a clean energy project analysis software
tool, it helps decision makers determine the technical
and financial viability of potential renewable energy.
0
500
1000
1500
2000
2500
0
1000
2000
3000
4000
THOUSAND($)
Installed Capacity KW
Income
Cost
-0.4
-0.2
0.0
0.2
0.4
0.6
0.8
1.0
1.2
1.4
1.6
50
450
850
1250
1650
2050
2450
2850
3250
INSTALLED CAPACITY KW
marginal
cost
income
-2,000,000
-1,000,000
0
1,000,000
2,000,000
3,000,000
4,000,000
5,000,000
6,000,000
7,000,000
0 2 4 6 8 10 12 14 16 18 20 22 24 26 28 30 32 34 36 38 40
-1500
-1000
-500
0
500
1000
0 5 10 15 20 25 30 35 40 45
MILLIONS$
YEARS
For the run-of-river hydropower plant with the
40 years economical life the following design
parameters were determined;
Design flow of 2.57 m3/s
Francis turbine was selected
Optimal turbine power of 2.1 MW/yr
Energy estimation of 5173 MWh/yr
Firm energy 155.71 MWh7yr
Net head of 92.2 m
The profit breakeven of 7 years
From the project calculations, it is determined that
the estimated energy production for one year can
supply up to 1400 homes. The operational study
for the year 1990 yeilded 3328.45 MWh/yr energy.
In the run-of-river hydropower plant design the
main concern is the Turbinated flow. This is the
flow that will turn the turbines to generate the
electicity.
The satelite image of the design location shows
the area’s topography. Topography is an important
aspect in the design of a run-of-river hydropower
plant, it is used to determine the net head.
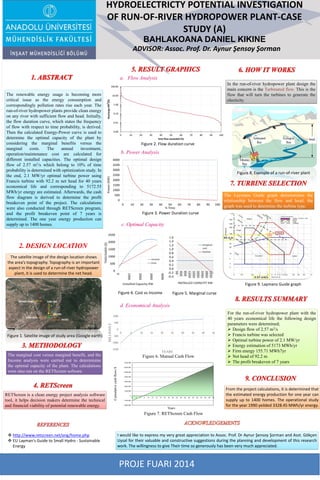
The Laymans Guide graph demonstrates the
relationship between the flow and head, the
graph was used to determine the turbine type.
Years
Cumulativecashflows$
http://www.retscreen.net/ang/home.php
EU Layman's Guide to Small Hydro - Sustainable
Energy
I would like to express my very great appreciation to Assoc. Prof. Dr Aynur Şensoy Şorman and Asst. Gökçen
Uysal for their valuable and constructive suggestions during the planning and development of this research
work. The willingness to give Their time so generously has been very much appreciated.
Figure 1. Satelite image of study area (Google earth)
Figure 2. Flow duration curve
a. Flow Analysis
b. Power Analysis
Figure 3. Power Duration curve
Figure 4. Cost vs Income Figure 5. Marginal curve
c. Optimal Capacity
Figure 6. Manual Cash Flow
Figure 7. RETScreen Cash Flow
d. Economical Analysis
Figure 8. Example of a run-of-river plant
Figure 9. Laymans Guide graph