SlideShare a Scribd company logo
1 of 29
Download to read offline
Anomaly detection and anti-money laundering
The First NIDA Business Analytics and Data Sciences Contest/Conference
วันที่ 1-2 กันยายน 2559 ณ อาคารนวมินทราธิราช สถาบันบัณฑิตพัฒนบริหารศาสตร์
https://businessanalyticsnida.wordpress.com
https://www.facebook.com/BusinessAnalyticsNIDA/
อาจารย์ ดร.อานนท์ ศักดิ์วรวิชญ์
สาขาวิชา Business Analytics and Intelligence
สาขาวิชาวิทยาการประกันภัยและการบริหารความเสี่ยง
คณะสถิติประยุกต์ สถาบันบัณฑิตพัฒนบริหารศาสตร์
นวมินทราธิราช 3002 วันที่ 1 กันยายน 2559 13.30-14.30 น.
ปัณณวิชญ์ วิศัลยาวัฒน์ วทม. (NIDA)
-หลักการในการตรวจสอบความผิดปกติ -การตรวจจับ pattern ของความผิดปกติ
-การตรวจจับ Outlier ตัวแปรเดียว สองตัวแปร และหลายตัวแปร
-การวิเคราะห์ส่วนเหลือ (Residual) สาหรับการตรวจสอบความผิดปกติ
-การวิเคราะห์ outlier เพื่อตรวจจับการฟอกเงินในการซื้อประกันภัย
-เราจะเชื่อได้แค่ไหนว่าหลักสถิติใช้ในการตรวจสอบการทุจริตได้จริง
Anomaly Detection
Arnond Sakworawich Ph.D.
Business Analytics and Intelligence Program
Actuarial Sciences and Risk Management Program
Graduate School of Arts and Sciences
National Institute of Development Administration
There is no crime without any trace!
-Large deviation from normal or average man or cluster.
-Large deviation from past behavior.
-Inconsistency with themselves and surroundings.
-Repeated anomaly pattern.
-Caution on statistical detection of cheating and anomalous detection
Anomaly Detection
Outlier Analysis
0
Percent
Loss
Large deviation from normal or average man or cluster.
v
58
Severity
Frequency58
Loss58 = f(Frequency57, Severity57, ICD-1057, ICD-957
,ICD-1058, ICD-958, age, gender)
Loss58
58
Predictors
Under Predict (Fraud or abuse)
v
vvvvv
vvvvv
vvvvv
vv
vv
v
v
vv
v
vv
Large deviation from past behavior.
TOEFL time 2
TOEFL time 1
Under Predict (Fraud or abuse)
v
v
vv
vv
vv
vvv
vv
vvv
vv
vv
v
v
vv
v
v
v
Inconsistency with themselves and surroundings.
-Low ability test taker can answer difficult item.
-K-index for copying! Eight dimensions
-Scoring test with contaminated response vector
-Influence function + Robust estimators
-5 -4 -3 -2 -1 0 1 2 3
0
10
20
Pseudovalue Distribution for an Optima Examinee
Proficiency
Estimaate
Frequency
From Incorrect
Responses
From Correct
Responses
Repeated anomaly pattern.
Predictor
Probability
Y =
0 normal claim
1 Abuse claim
จาก สพตร.
Y = ICD10, ICD9, TMT, gender, age, Severityt-1
, Frequencyt-1, Severityt, Frequencyt,
Caution on statistical detection of cheating
PredictorCutoff 1 Cutoff2
Performance
• Positive Predictive Value: PPV
Caution on statistical detection of cheating
64.76 % 99.30%
• Statistical evidence as a red flag or warning
• Physical evidence is always needed.
• Early detection, protection, and prevention.
• Bayesian flip is needed.
Caution on statistical detection of cheating
P(Cheating=Yes|Detection=Yes)
P(Detection=Yes|Cheating=Yes)
P(Cheating=No|Detection=No)
P(Detection=No|Cheating=No)
P(Cheating=Yes|Detection=Yes)=P(Detection=Yes|Cheating=Yes)*P(Cheating=Yes)
P(Detection=Yes)
การสร้างแบบจาลองรายการชาระเงินผิดปกติของ
กรมธรรม์ประกันชีวิตโดยการใช้เทคนิค Local
Outlier Factor(LOF)
ปัณณวิชญ์ วิศัลยาวัฒน์์
ประกันชีวิตพื้นฐาน
ที่มา : http://www.checkraka.com/saving/advertorial/10052/
การฟอกเงินในประกันชีวิต
ตัวอย่างการฟอกเงิ์ใ์ประกั์ชีวิต
• ซื้อกองทุ์ลงทุ์ประกั์ชีวิตที่จ่ายครั้งเดียว (มีความเสี่ยงที่จะฟอกเงิ์มากที่สุดจากการ์าเงิ์สกปรก
ก้อ์ใหญ่มาลงทุ์)
• ซื้อประกั์ชีวิตรายปีที่มีการจ่ายปั์ผล (ได้รับเงิ์สะอาดเป็์งวดๆ)
• ซื้อประกั์ชีวิตแบบประจาที่มีเบี้ยสูง หรือเบี้ยปกติหลายกรมธรรม์ (เพื่อลดความส์ใจ)
• การไถ่ถอ์เงิ์ก่อ์ครบสัญญา แม้จะได้เงิ์คื์์้อยกว่าเดิม
• ซื้อกรมธรรม์เบี้ย์้อยให้ผ่า์ก่อ์ แล้วเพิ่มเติมเบี้ย (เพื่อให้ไม่มีการตรวจสอบ)
• กู้เงิ์จากกรมธรรม์โดยไม่ผ่อ์จ่ายคื์ (ปล่อยกรมธรรม์หมดอายุไปเอง)
• เปลี่ย์มือกรมธรรม์ของเจ้าของหรือผู้รับผลประโยช์์
• ใช้กรมธรรม์เป็์หลักทรัพย์ใ์การกู้เงิ์จากธ์าคาร
ที่มา : http://www.acamstoday.org/what-is-real-money-laundering-risk-in-life-insurance/
Global versus Local Outlier
Mahalanobis Distance
K Nearest Neighbors
Cluster Analysis
Local Outlier Factor (LOF)
ที่มา : http://www.slideshare.net/Med_KU/20130318-f-rac-24695067
เป็์วิธีการที่ใช้ใ์การตรวจสอบค่าผิดปกติ ด้วยวิธีการ
ตรวจความห์าแ์่์รอบรัศมีของจุดที่ส์ใจ
ข้อมูลที่มีค่าผิดปกติจะมีคะแ์์ที่สูง ซึ่ง
จะไม่มีเกณฑ์ใ์ตัดที่ตายตัว
ข้อมูลที่มีค่าปกติจะมีคะแ์์ประมาณ 1
• LOF = Local density of k neighbor/Local density of its own point
• The Higher LOF = the more extreme local outlier!!!!
• Determine sigma (radius / reachable distance around point) so
that we can count k neighbor.
• Local density for point = numbers of points within reachable
distance/sum of distance between points and all k neighbors
LOF
วิธีดาเนินการวิจัย
ผลการวิเคราะห์
N 145,842
Minimum 1.0529
Lower Quartile 3.8028
Mean 6.6356
Median 5.6134
Upper Quartile 8.3377
Maximum 50.6028
Skewness 1.8527
Std Dev 3.9917
Std Error 0.0105
Median+2.5(Q3-Q1) 16.9508
สูตรคำนวณหำจุดตัด จุดตัด รูปแบบปกติ รูปแบบผิดปกติ %รูปแบบที่ผิดปกติ
Median+2.5(Q3-Q1) 16.9508 142,170 3,672 3%
0 10 20 30 40 50
0.000.050.100.15
density.default(x = Cust_txn$lofavg)
N = 145842 Bandwidth = 0.2824
Density
16.95
ผลการวิเคราะห์
Max cluster Cluster Frequency
RMS
Standard
Deviation
Maximum
Distance from
Seed to
Observation
Radius
Exceeded
Nearest
Cluster
Distance
Between
Cluster
Centroids
3
1 3,406 0.6395 13.9509 > Radius 3 5.5332
2 97 2.8941 28.1499 > Radius 1 7.8612
3 169 1.4675 27.3884 > Radius 1 5.5332
Pseudo
F Statistic
Observed
R-Squared
Over-All
Approx. Expected
R-Squared
Over-All
Cubic
Clustering
Criterion
477.1300 0.2064 0.1047 108.2590
ผลการวิเคราะห์
Cluster group Normal 1 2 3
สัดส่วนเงินที่จ่ายจริงเมื่อเทียบกับเงินที่ต้องจ่ายสูงสุด 0.0002 -0.0207 0.0219 0.2042
สัดส่วนเงินที่จ่ายจริงเมื่อเทียบกับเงินที่ต้องจ่ายต่าสุด 0.0003 -0.0079 -0.0291 -0.0677
จานวนชนิดช่องทางการจ่ายผ่านตัวแทน 0.0004 -0.1296 4.1856 -0.0965
จานวนประเภทการจ่ายแบบที่1 -0.0001 -0.2101 0.7697 3.8544
จานวนประเภทการจ่ายแบบที่2 0.0002 -0.0965 3.2309 -0.0368
จานวนธนาคารที่ทาการจ่าย -0.0003 -0.1955 1.4258 3.3523
จานวนรูปแบบการจ่ายเบี้ย 0.0001 -0.0788 1.7666 0.4684
จานวนช่องทางที่ลูกค้าซื้อกรมธรรม์ 0.0000 -0.0931 3.4216 -0.0931
จานวนครั้งที่จ่ายเบี้ยประกันที่มีการจ่าย -0.0003 -0.0352 0.6315 0.5852
จานวนกรมธรรม์ที่จ่ายแบบรายปี -0.0001 -0.0456 1.3903 0.1983
จานวนกรมธรรม์ที่จ่ายแบบรายครึ่งปี -0.0006 0.0012 0.1840 0.3477
จานวนกรมธรรม์ที่จ่ายแบบรายสามเดือน 0.0000 -0.0195 0.3312 0.1681
จานวนกรมธรรม์ที่จ่ายแบบรายเดือน -0.0001 -0.0216 0.5261 0.1808
เบี้ยประกันทั้งปีรวมทุกกรมธรรม์ที่มีการจ่าย -0.0003 -0.0350 1.2317 0.2602
ทุนประกันชีวิตรวมทุกกรมธรรม์ที่มีการจ่าย -0.0008 -0.0195 1.6847 0.0972
จานวนกรมธรรม์ที่มีการจ่าย 0 0 2 1
จานวนลูกค้า 142,170 3,406 97 169
• Normal
กลุ่มลูกค้าที่มีจานวนกรมธรรม์เฉลี่ยเพียง 1 กรมธรรม์ลูกค้ามีการจ่ายเบี้ยประกันทุกชนิด (รายเดือน,ราย
สามเดือน,รายหกเดือนและรายปี) และเป็นการจ่ายแบบเต็มจานวนด้วยช่องทางเดียว
• Cluster 1
มีรูปแบบเดียวกับกลุ่ม Normal
• Cluster 2
กลุ่มลูกค้าที่มีจานวนกรมธรรม์ประกันชีวิตเฉลี่ยมากกว่า 2 กรมธรรม์ซึ่งลูกค้าเน้นการจ่ายเบี้ยแบบราย
เดือนและรายปีโดยเป็นการจ่ายแบบเต็มจานวนในหลายๆ ช่องทางการจ่ายกับตัวแทนขายประกัน
• Cluster 3
ลูกค้าที่มีจานวนกรมธรรม์ประกันชีวิตเฉลี่ยมากกว่า 1 กรมธรรม์เป็นกลุ่มที่เน้นการจ่ายเบี้ยแบบราย
สามเดือนและรายหกเดือนและเป็นการจ่ายแบบเกินจานวนในหลายๆ ช่องทางการชาระเงิน เช่น เงินสดหรือบัตร
เครดิต
สรุปผมการวิเคราะห์
Anomaly detection and anti-money laundering โดย ปัณณวิชญ์ วิศัลยาวัฒน์ อาจารย์ ดร.อานนท์ ศักดิ์วรวิชญ์

More Related Content

More from BAINIDA

Statistics and big data for justice and fairness
Statistics and big data for justice and fairnessStatistics and big data for justice and fairness
Statistics and big data for justice and fairnessBAINIDA
 
Data science and big data for business and industrial application
Data science and big data  for business and industrial applicationData science and big data  for business and industrial application
Data science and big data for business and industrial applicationBAINIDA
 
Update trend: Free digital marketing metrics for start-up
Update trend: Free digital marketing metrics for start-upUpdate trend: Free digital marketing metrics for start-up
Update trend: Free digital marketing metrics for start-upBAINIDA
 
Advent of ds and stat adjustment
Advent of ds and stat adjustmentAdvent of ds and stat adjustment
Advent of ds and stat adjustmentBAINIDA
 
เมื่อ Data Science เข้ามา สถิติศาสตร์จะปรับตัวอย่างไร
เมื่อ Data Science เข้ามา สถิติศาสตร์จะปรับตัวอย่างไร เมื่อ Data Science เข้ามา สถิติศาสตร์จะปรับตัวอย่างไร
เมื่อ Data Science เข้ามา สถิติศาสตร์จะปรับตัวอย่างไร BAINIDA
 
Data visualization. map
Data visualization. map Data visualization. map
Data visualization. map BAINIDA
 
Dark data by Worapol Alex Pongpech
Dark data by Worapol Alex PongpechDark data by Worapol Alex Pongpech
Dark data by Worapol Alex PongpechBAINIDA
 
Deepcut Thai word Segmentation @ NIDA
Deepcut Thai word Segmentation @ NIDADeepcut Thai word Segmentation @ NIDA
Deepcut Thai word Segmentation @ NIDABAINIDA
 
Professionals and wanna be in Business Analytics and Data Science
Professionals and wanna be in Business Analytics and Data ScienceProfessionals and wanna be in Business Analytics and Data Science
Professionals and wanna be in Business Analytics and Data ScienceBAINIDA
 
Deep learning and image analytics using Python by Dr Sanparit
Deep learning and image analytics using Python by Dr SanparitDeep learning and image analytics using Python by Dr Sanparit
Deep learning and image analytics using Python by Dr SanparitBAINIDA
 
Visualizing for impact final
Visualizing for impact finalVisualizing for impact final
Visualizing for impact finalBAINIDA
 
Python programming workshop
Python programming workshopPython programming workshop
Python programming workshopBAINIDA
 
Second prize business plan @ the First NIDA business analytics and data scien...
Second prize business plan @ the First NIDA business analytics and data scien...Second prize business plan @ the First NIDA business analytics and data scien...
Second prize business plan @ the First NIDA business analytics and data scien...BAINIDA
 
Second prize data analysis @ the First NIDA business analytics and data scie...
Second prize data analysis @ the First NIDA  business analytics and data scie...Second prize data analysis @ the First NIDA  business analytics and data scie...
Second prize data analysis @ the First NIDA business analytics and data scie...BAINIDA
 
แผนธุรกิจ ของทีมที่ได้รางวัลชนะเลิศ The First NIDA Business Analytics and Dat...
แผนธุรกิจ ของทีมที่ได้รางวัลชนะเลิศ The First NIDA Business Analytics and Dat...แผนธุรกิจ ของทีมที่ได้รางวัลชนะเลิศ The First NIDA Business Analytics and Dat...
แผนธุรกิจ ของทีมที่ได้รางวัลชนะเลิศ The First NIDA Business Analytics and Dat...BAINIDA
 
ผลการวิเคราะห์ข้อมูลของทีมที่ได้รางวัลชนะเลิศ The First NIDA Business Analyti...
ผลการวิเคราะห์ข้อมูลของทีมที่ได้รางวัลชนะเลิศ The First NIDA Business Analyti...ผลการวิเคราะห์ข้อมูลของทีมที่ได้รางวัลชนะเลิศ The First NIDA Business Analyti...
ผลการวิเคราะห์ข้อมูลของทีมที่ได้รางวัลชนะเลิศ The First NIDA Business Analyti...BAINIDA
 
Oracle Enterprise Performance Management Overview
Oracle Enterprise Performance Management OverviewOracle Enterprise Performance Management Overview
Oracle Enterprise Performance Management OverviewBAINIDA
 
Current trends in information security โดย ผศ.ดร.ปราโมทย์ กั่วเจริญ
Current trends in information security โดย ผศ.ดร.ปราโมทย์ กั่วเจริญCurrent trends in information security โดย ผศ.ดร.ปราโมทย์ กั่วเจริญ
Current trends in information security โดย ผศ.ดร.ปราโมทย์ กั่วเจริญBAINIDA
 
ปัจจัยที่มีอิทธิพลต่อการเปลี่ยนแปลงการใช้จ่ายของครัวเรือนไทย โดย รศ.ดร.เดือนเ...
ปัจจัยที่มีอิทธิพลต่อการเปลี่ยนแปลงการใช้จ่ายของครัวเรือนไทย โดย รศ.ดร.เดือนเ...ปัจจัยที่มีอิทธิพลต่อการเปลี่ยนแปลงการใช้จ่ายของครัวเรือนไทย โดย รศ.ดร.เดือนเ...
ปัจจัยที่มีอิทธิพลต่อการเปลี่ยนแปลงการใช้จ่ายของครัวเรือนไทย โดย รศ.ดร.เดือนเ...BAINIDA
 
สถิติทางการกับการพัฒนาประเทศ บทบาทของสำนักงานสถิติแห่งชาติ โดย นางหทัยชนก พรร...
สถิติทางการกับการพัฒนาประเทศ บทบาทของสำนักงานสถิติแห่งชาติ โดย นางหทัยชนก พรร...สถิติทางการกับการพัฒนาประเทศ บทบาทของสำนักงานสถิติแห่งชาติ โดย นางหทัยชนก พรร...
สถิติทางการกับการพัฒนาประเทศ บทบาทของสำนักงานสถิติแห่งชาติ โดย นางหทัยชนก พรร...BAINIDA
 

More from BAINIDA (20)

Statistics and big data for justice and fairness
Statistics and big data for justice and fairnessStatistics and big data for justice and fairness
Statistics and big data for justice and fairness
 
Data science and big data for business and industrial application
Data science and big data  for business and industrial applicationData science and big data  for business and industrial application
Data science and big data for business and industrial application
 
Update trend: Free digital marketing metrics for start-up
Update trend: Free digital marketing metrics for start-upUpdate trend: Free digital marketing metrics for start-up
Update trend: Free digital marketing metrics for start-up
 
Advent of ds and stat adjustment
Advent of ds and stat adjustmentAdvent of ds and stat adjustment
Advent of ds and stat adjustment
 
เมื่อ Data Science เข้ามา สถิติศาสตร์จะปรับตัวอย่างไร
เมื่อ Data Science เข้ามา สถิติศาสตร์จะปรับตัวอย่างไร เมื่อ Data Science เข้ามา สถิติศาสตร์จะปรับตัวอย่างไร
เมื่อ Data Science เข้ามา สถิติศาสตร์จะปรับตัวอย่างไร
 
Data visualization. map
Data visualization. map Data visualization. map
Data visualization. map
 
Dark data by Worapol Alex Pongpech
Dark data by Worapol Alex PongpechDark data by Worapol Alex Pongpech
Dark data by Worapol Alex Pongpech
 
Deepcut Thai word Segmentation @ NIDA
Deepcut Thai word Segmentation @ NIDADeepcut Thai word Segmentation @ NIDA
Deepcut Thai word Segmentation @ NIDA
 
Professionals and wanna be in Business Analytics and Data Science
Professionals and wanna be in Business Analytics and Data ScienceProfessionals and wanna be in Business Analytics and Data Science
Professionals and wanna be in Business Analytics and Data Science
 
Deep learning and image analytics using Python by Dr Sanparit
Deep learning and image analytics using Python by Dr SanparitDeep learning and image analytics using Python by Dr Sanparit
Deep learning and image analytics using Python by Dr Sanparit
 
Visualizing for impact final
Visualizing for impact finalVisualizing for impact final
Visualizing for impact final
 
Python programming workshop
Python programming workshopPython programming workshop
Python programming workshop
 
Second prize business plan @ the First NIDA business analytics and data scien...
Second prize business plan @ the First NIDA business analytics and data scien...Second prize business plan @ the First NIDA business analytics and data scien...
Second prize business plan @ the First NIDA business analytics and data scien...
 
Second prize data analysis @ the First NIDA business analytics and data scie...
Second prize data analysis @ the First NIDA  business analytics and data scie...Second prize data analysis @ the First NIDA  business analytics and data scie...
Second prize data analysis @ the First NIDA business analytics and data scie...
 
แผนธุรกิจ ของทีมที่ได้รางวัลชนะเลิศ The First NIDA Business Analytics and Dat...
แผนธุรกิจ ของทีมที่ได้รางวัลชนะเลิศ The First NIDA Business Analytics and Dat...แผนธุรกิจ ของทีมที่ได้รางวัลชนะเลิศ The First NIDA Business Analytics and Dat...
แผนธุรกิจ ของทีมที่ได้รางวัลชนะเลิศ The First NIDA Business Analytics and Dat...
 
ผลการวิเคราะห์ข้อมูลของทีมที่ได้รางวัลชนะเลิศ The First NIDA Business Analyti...
ผลการวิเคราะห์ข้อมูลของทีมที่ได้รางวัลชนะเลิศ The First NIDA Business Analyti...ผลการวิเคราะห์ข้อมูลของทีมที่ได้รางวัลชนะเลิศ The First NIDA Business Analyti...
ผลการวิเคราะห์ข้อมูลของทีมที่ได้รางวัลชนะเลิศ The First NIDA Business Analyti...
 
Oracle Enterprise Performance Management Overview
Oracle Enterprise Performance Management OverviewOracle Enterprise Performance Management Overview
Oracle Enterprise Performance Management Overview
 
Current trends in information security โดย ผศ.ดร.ปราโมทย์ กั่วเจริญ
Current trends in information security โดย ผศ.ดร.ปราโมทย์ กั่วเจริญCurrent trends in information security โดย ผศ.ดร.ปราโมทย์ กั่วเจริญ
Current trends in information security โดย ผศ.ดร.ปราโมทย์ กั่วเจริญ
 
ปัจจัยที่มีอิทธิพลต่อการเปลี่ยนแปลงการใช้จ่ายของครัวเรือนไทย โดย รศ.ดร.เดือนเ...
ปัจจัยที่มีอิทธิพลต่อการเปลี่ยนแปลงการใช้จ่ายของครัวเรือนไทย โดย รศ.ดร.เดือนเ...ปัจจัยที่มีอิทธิพลต่อการเปลี่ยนแปลงการใช้จ่ายของครัวเรือนไทย โดย รศ.ดร.เดือนเ...
ปัจจัยที่มีอิทธิพลต่อการเปลี่ยนแปลงการใช้จ่ายของครัวเรือนไทย โดย รศ.ดร.เดือนเ...
 
สถิติทางการกับการพัฒนาประเทศ บทบาทของสำนักงานสถิติแห่งชาติ โดย นางหทัยชนก พรร...
สถิติทางการกับการพัฒนาประเทศ บทบาทของสำนักงานสถิติแห่งชาติ โดย นางหทัยชนก พรร...สถิติทางการกับการพัฒนาประเทศ บทบาทของสำนักงานสถิติแห่งชาติ โดย นางหทัยชนก พรร...
สถิติทางการกับการพัฒนาประเทศ บทบาทของสำนักงานสถิติแห่งชาติ โดย นางหทัยชนก พรร...
 

Anomaly detection and anti-money laundering โดย ปัณณวิชญ์ วิศัลยาวัฒน์ อาจารย์ ดร.อานนท์ ศักดิ์วรวิชญ์

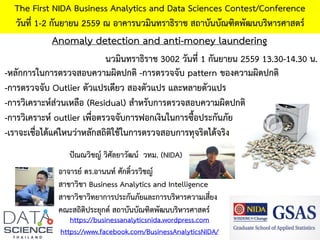
  • 1. Anomaly detection and anti-money laundering The First NIDA Business Analytics and Data Sciences Contest/Conference วันที่ 1-2 กันยายน 2559 ณ อาคารนวมินทราธิราช สถาบันบัณฑิตพัฒนบริหารศาสตร์ https://businessanalyticsnida.wordpress.com https://www.facebook.com/BusinessAnalyticsNIDA/ อาจารย์ ดร.อานนท์ ศักดิ์วรวิชญ์ สาขาวิชา Business Analytics and Intelligence สาขาวิชาวิทยาการประกันภัยและการบริหารความเสี่ยง คณะสถิติประยุกต์ สถาบันบัณฑิตพัฒนบริหารศาสตร์ นวมินทราธิราช 3002 วันที่ 1 กันยายน 2559 13.30-14.30 น. ปัณณวิชญ์ วิศัลยาวัฒน์ วทม. (NIDA) -หลักการในการตรวจสอบความผิดปกติ -การตรวจจับ pattern ของความผิดปกติ -การตรวจจับ Outlier ตัวแปรเดียว สองตัวแปร และหลายตัวแปร -การวิเคราะห์ส่วนเหลือ (Residual) สาหรับการตรวจสอบความผิดปกติ -การวิเคราะห์ outlier เพื่อตรวจจับการฟอกเงินในการซื้อประกันภัย -เราจะเชื่อได้แค่ไหนว่าหลักสถิติใช้ในการตรวจสอบการทุจริตได้จริง
  • 2. Anomaly Detection Arnond Sakworawich Ph.D. Business Analytics and Intelligence Program Actuarial Sciences and Risk Management Program Graduate School of Arts and Sciences National Institute of Development Administration
  • 3. There is no crime without any trace! -Large deviation from normal or average man or cluster. -Large deviation from past behavior. -Inconsistency with themselves and surroundings. -Repeated anomaly pattern. -Caution on statistical detection of cheating and anomalous detection Anomaly Detection
  • 4. Outlier Analysis 0 Percent Loss Large deviation from normal or average man or cluster.
  • 5. Large deviation from normal or average man or cluster. v 58 Severity Frequency58
  • 6. Loss58 = f(Frequency57, Severity57, ICD-1057, ICD-957 ,ICD-1058, ICD-958, age, gender) Loss58 58 Predictors Under Predict (Fraud or abuse) v vvvvv vvvvv vvvvv vv vv v v vv v vv Large deviation from past behavior.
  • 7. Large deviation from past behavior. TOEFL time 2 TOEFL time 1 Under Predict (Fraud or abuse) v v vv vv vv vvv vv vvv vv vv v v vv v v v
  • 8. Inconsistency with themselves and surroundings. -Low ability test taker can answer difficult item. -K-index for copying! Eight dimensions -Scoring test with contaminated response vector -Influence function + Robust estimators
  • 9.
  • 10. -5 -4 -3 -2 -1 0 1 2 3 0 10 20 Pseudovalue Distribution for an Optima Examinee Proficiency Estimaate Frequency From Incorrect Responses From Correct Responses
  • 11.
  • 12. Repeated anomaly pattern. Predictor Probability Y = 0 normal claim 1 Abuse claim จาก สพตร. Y = ICD10, ICD9, TMT, gender, age, Severityt-1 , Frequencyt-1, Severityt, Frequencyt,
  • 13. Caution on statistical detection of cheating
  • 15.
  • 16. • Positive Predictive Value: PPV Caution on statistical detection of cheating 64.76 % 99.30%
  • 17. • Statistical evidence as a red flag or warning • Physical evidence is always needed. • Early detection, protection, and prevention. • Bayesian flip is needed. Caution on statistical detection of cheating P(Cheating=Yes|Detection=Yes) P(Detection=Yes|Cheating=Yes) P(Cheating=No|Detection=No) P(Detection=No|Cheating=No) P(Cheating=Yes|Detection=Yes)=P(Detection=Yes|Cheating=Yes)*P(Cheating=Yes) P(Detection=Yes)
  • 20. การฟอกเงินในประกันชีวิต ตัวอย่างการฟอกเงิ์ใ์ประกั์ชีวิต • ซื้อกองทุ์ลงทุ์ประกั์ชีวิตที่จ่ายครั้งเดียว (มีความเสี่ยงที่จะฟอกเงิ์มากที่สุดจากการ์าเงิ์สกปรก ก้อ์ใหญ่มาลงทุ์) • ซื้อประกั์ชีวิตรายปีที่มีการจ่ายปั์ผล (ได้รับเงิ์สะอาดเป็์งวดๆ) • ซื้อประกั์ชีวิตแบบประจาที่มีเบี้ยสูง หรือเบี้ยปกติหลายกรมธรรม์ (เพื่อลดความส์ใจ) • การไถ่ถอ์เงิ์ก่อ์ครบสัญญา แม้จะได้เงิ์คื์์้อยกว่าเดิม • ซื้อกรมธรรม์เบี้ย์้อยให้ผ่า์ก่อ์ แล้วเพิ่มเติมเบี้ย (เพื่อให้ไม่มีการตรวจสอบ) • กู้เงิ์จากกรมธรรม์โดยไม่ผ่อ์จ่ายคื์ (ปล่อยกรมธรรม์หมดอายุไปเอง) • เปลี่ย์มือกรมธรรม์ของเจ้าของหรือผู้รับผลประโยช์์ • ใช้กรมธรรม์เป็์หลักทรัพย์ใ์การกู้เงิ์จากธ์าคาร ที่มา : http://www.acamstoday.org/what-is-real-money-laundering-risk-in-life-insurance/
  • 21. Global versus Local Outlier Mahalanobis Distance K Nearest Neighbors Cluster Analysis
  • 22. Local Outlier Factor (LOF) ที่มา : http://www.slideshare.net/Med_KU/20130318-f-rac-24695067 เป็์วิธีการที่ใช้ใ์การตรวจสอบค่าผิดปกติ ด้วยวิธีการ ตรวจความห์าแ์่์รอบรัศมีของจุดที่ส์ใจ ข้อมูลที่มีค่าผิดปกติจะมีคะแ์์ที่สูง ซึ่ง จะไม่มีเกณฑ์ใ์ตัดที่ตายตัว ข้อมูลที่มีค่าปกติจะมีคะแ์์ประมาณ 1
  • 23. • LOF = Local density of k neighbor/Local density of its own point • The Higher LOF = the more extreme local outlier!!!! • Determine sigma (radius / reachable distance around point) so that we can count k neighbor. • Local density for point = numbers of points within reachable distance/sum of distance between points and all k neighbors LOF
  • 25. ผลการวิเคราะห์ N 145,842 Minimum 1.0529 Lower Quartile 3.8028 Mean 6.6356 Median 5.6134 Upper Quartile 8.3377 Maximum 50.6028 Skewness 1.8527 Std Dev 3.9917 Std Error 0.0105 Median+2.5(Q3-Q1) 16.9508 สูตรคำนวณหำจุดตัด จุดตัด รูปแบบปกติ รูปแบบผิดปกติ %รูปแบบที่ผิดปกติ Median+2.5(Q3-Q1) 16.9508 142,170 3,672 3% 0 10 20 30 40 50 0.000.050.100.15 density.default(x = Cust_txn$lofavg) N = 145842 Bandwidth = 0.2824 Density 16.95
  • 26. ผลการวิเคราะห์ Max cluster Cluster Frequency RMS Standard Deviation Maximum Distance from Seed to Observation Radius Exceeded Nearest Cluster Distance Between Cluster Centroids 3 1 3,406 0.6395 13.9509 > Radius 3 5.5332 2 97 2.8941 28.1499 > Radius 1 7.8612 3 169 1.4675 27.3884 > Radius 1 5.5332 Pseudo F Statistic Observed R-Squared Over-All Approx. Expected R-Squared Over-All Cubic Clustering Criterion 477.1300 0.2064 0.1047 108.2590
  • 27. ผลการวิเคราะห์ Cluster group Normal 1 2 3 สัดส่วนเงินที่จ่ายจริงเมื่อเทียบกับเงินที่ต้องจ่ายสูงสุด 0.0002 -0.0207 0.0219 0.2042 สัดส่วนเงินที่จ่ายจริงเมื่อเทียบกับเงินที่ต้องจ่ายต่าสุด 0.0003 -0.0079 -0.0291 -0.0677 จานวนชนิดช่องทางการจ่ายผ่านตัวแทน 0.0004 -0.1296 4.1856 -0.0965 จานวนประเภทการจ่ายแบบที่1 -0.0001 -0.2101 0.7697 3.8544 จานวนประเภทการจ่ายแบบที่2 0.0002 -0.0965 3.2309 -0.0368 จานวนธนาคารที่ทาการจ่าย -0.0003 -0.1955 1.4258 3.3523 จานวนรูปแบบการจ่ายเบี้ย 0.0001 -0.0788 1.7666 0.4684 จานวนช่องทางที่ลูกค้าซื้อกรมธรรม์ 0.0000 -0.0931 3.4216 -0.0931 จานวนครั้งที่จ่ายเบี้ยประกันที่มีการจ่าย -0.0003 -0.0352 0.6315 0.5852 จานวนกรมธรรม์ที่จ่ายแบบรายปี -0.0001 -0.0456 1.3903 0.1983 จานวนกรมธรรม์ที่จ่ายแบบรายครึ่งปี -0.0006 0.0012 0.1840 0.3477 จานวนกรมธรรม์ที่จ่ายแบบรายสามเดือน 0.0000 -0.0195 0.3312 0.1681 จานวนกรมธรรม์ที่จ่ายแบบรายเดือน -0.0001 -0.0216 0.5261 0.1808 เบี้ยประกันทั้งปีรวมทุกกรมธรรม์ที่มีการจ่าย -0.0003 -0.0350 1.2317 0.2602 ทุนประกันชีวิตรวมทุกกรมธรรม์ที่มีการจ่าย -0.0008 -0.0195 1.6847 0.0972 จานวนกรมธรรม์ที่มีการจ่าย 0 0 2 1 จานวนลูกค้า 142,170 3,406 97 169
  • 28. • Normal กลุ่มลูกค้าที่มีจานวนกรมธรรม์เฉลี่ยเพียง 1 กรมธรรม์ลูกค้ามีการจ่ายเบี้ยประกันทุกชนิด (รายเดือน,ราย สามเดือน,รายหกเดือนและรายปี) และเป็นการจ่ายแบบเต็มจานวนด้วยช่องทางเดียว • Cluster 1 มีรูปแบบเดียวกับกลุ่ม Normal • Cluster 2 กลุ่มลูกค้าที่มีจานวนกรมธรรม์ประกันชีวิตเฉลี่ยมากกว่า 2 กรมธรรม์ซึ่งลูกค้าเน้นการจ่ายเบี้ยแบบราย เดือนและรายปีโดยเป็นการจ่ายแบบเต็มจานวนในหลายๆ ช่องทางการจ่ายกับตัวแทนขายประกัน • Cluster 3 ลูกค้าที่มีจานวนกรมธรรม์ประกันชีวิตเฉลี่ยมากกว่า 1 กรมธรรม์เป็นกลุ่มที่เน้นการจ่ายเบี้ยแบบราย สามเดือนและรายหกเดือนและเป็นการจ่ายแบบเกินจานวนในหลายๆ ช่องทางการชาระเงิน เช่น เงินสดหรือบัตร เครดิต สรุปผมการวิเคราะห์