Daily Technical Report:15 May 2019
•
0 likes•7 views

Axis Direct presents daily derivatives report presenting recommendations based on technical analysis. For trading in derivatives visit https://simplehai.axisdirect.in/offerings/products/derivatives

Recommended
More Related Content
What's hot
What's hot (20)
Similar to Daily Technical Report:15 May 2019
Similar to Daily Technical Report:15 May 2019 (20)
More from Axis Direct
More from Axis Direct (20)
Recently uploaded
Recently uploaded (20)
Daily Technical Report:15 May 2019
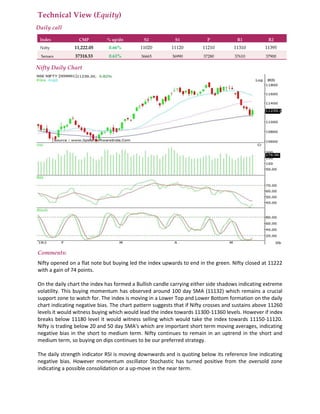
- 1. Technical View (Equity) Daily call Index CMP % up/dn S2 S1 P R1 R2 Nifty 11,222.05 0.66% 11020 11120 11210 11310 11395 Sensex 37318.53 0.61% 36665 36990 37280 37610 37900 Nifty Daily Chart Comments: Nifty opened on a flat note but buying led the index upwards to end in the green. Nifty closed at 11222 with a gain of 74 points. On the daily chart the index has formed a Bullish candle carrying either side shadows indicating extreme volatility. This buying momentum has observed around 100 day SMA (11132) which remains a crucial support zone to watch for. The index is moving in a Lower Top and Lower Bottom formation on the daily chart indicating negative bias. The chart pattern suggests that if Nifty crosses and sustains above 11260 levels it would witness buying which would lead the index towards 11300-11360 levels. However if index breaks below 11180 level it would witness selling which would take the index towards 11150-11120. Nifty is trading below 20 and 50 day SMA's which are important short term moving averages, indicating negative bias in the short to medium term. Nifty continues to remain in an uptrend in the short and medium term, so buying on dips continues to be our preferred strategy. The daily strength indicator RSI is moving downwards and is quoting below its reference line indicating negative bias. However momentum oscillator Stochastic has turned positive from the oversold zone indicating a possible consolidation or a up-move in the near term.
- 2. The trend deciding level for the day is 11210. If NIFTY trades above this level then we may witness a further rally up to 11310-11395-11495 levels. However, if NIFTY trades below 11210 levels then we may see some profit booking initiating in the market, which may correct up to 11120-11020-10935 levels STOCKS IDEAS FOR THE DAY Company Name BUY/SELL RANGE Stop Loss Target TITAN BUY 1160 1146 1175-1185 INDUSINDBK BUY ABOVE 1442 1430 1455-1463 Note- Stocks Ideas are based on previous day’s close and are activated only if they trade in buy/sell range.