JVM memory metrics and rules for detecting possible OOM caused crash
•
0 likes•154 views

The document describes memory usage pattern in JVM at OOM, and identifies rules for an early detection system which can alert about impending OOM error, and hence a crash.

Recommended
Recommended
More Related Content
Similar to JVM memory metrics and rules for detecting possible OOM caused crash
Similar to JVM memory metrics and rules for detecting possible OOM caused crash (20)
Recently uploaded
Recently uploaded (20)
JVM memory metrics and rules for detecting possible OOM caused crash
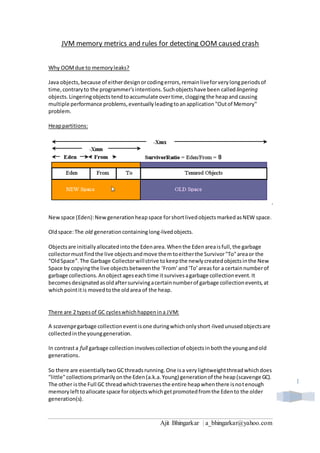
- 1. Ajit Bhingarkar | a_bhingarkar@yahoo.com 1 JVM memory metrics and rules for detecting OOM caused crash Why OOM due to memory leaks? Java objects, because of either design or coding errors, remain live for very long periods of time, contrary to the programmer's intentions. Such objects have been called lingering objects. Lingering objects tend to accumulate over time, clogging the heap and causing multiple performance problems, eventually leading to an application "Out of Memory" problem. Heap partitions: . New space (Eden): New generation heap space for short lived objects marked as NEW space. Old space: The old generation containing long-lived objects. Objects are initially allocated into the Eden area. When the Eden area is full, the garbage collector must find the live objects and move them to either the Survivor "To" area or the “Old Space”. The Garbage Collector will strive to keep the newly created objects in the New Space by copying the live objects between the ‘From’ and ‘To’ areas for a certain number of garbage collections. An object ages each time it survives a garbage collection event. It becomes designated as old after surviving a certain number of garbage collection events, at which point it is moved to the old area of the heap. There are 2 types of GC cycles which happen in a JVM: A scavenge garbage collection event is one during which only short-lived unused objects are collected in the young generation. In contrast a full garbage collection involves collection of objects in both the young and old generations. So there are essentially two GC threads running. One is a very lightweight thread which does "little" collections primarily on the Eden (a.k.a. Young) generation of the heap (scavenge GC). The other is the Full GC thread which traverses the entire heap when there is not enough memory left to allocate space for objects which get promoted from the Eden to the older generation(s).
- 2. Ajit Bhingarkar | a_bhingarkar@yahoo.com 2 Pattern seen before OOM crash due to memory leaks: If there is a memory leak or inadequate heap allocated, eventually the older generation will start to run out of room causing the Full GC thread to run (nearly) continuously. Since this process "stops the world" i.e. JVM suspends application execution completely, application is freeze with requests piling up. Ideally, the GC log should contain many scavenge GCs and few full GCs. However when long living objects fill up the old space of the heap; very few scavenge GC cycles happen and frequent full GC cycle start happening without resulting in any free heap. One of the side effects of the full GC cycle is that all survivors from the young generation are moved to the old generation, which further fills up the old space. Memory leaks are primary cause of this symptom. Algorithm for alerts: Normal case: Number of active threads goes up -> memory usage goes up If memory utilization stays above 60% - check 1. # of active threads or CPU usage 2. Track tenured memory (long lived objects) over a period 3. If old space is above a threshold and # of active threads has not increased – raise first alarm – check GC logs to compare scavenge cycle Vs full GC cycle frequency – if scavenge cycles are below a threshold raise the second alarm – if full GC cycle frequency exceeds a threshold raise final SOS alarm Following graph describes the GC cycles just before a crash due to OOM, which also supports the algorithm above. Note: Code (with a running demo) is available for sharing if requested.