Recommended

Recommended
More Related Content
Similar to Sugarcane Ash and Sugarcane Ash-Derived Silica Nanoparticles Alter Cellular Metabolism and Mitochondrial Function in Human Proximal Tubular Kidney Cells
Similar to Sugarcane Ash and Sugarcane Ash-Derived Silica Nanoparticles Alter Cellular Metabolism and Mitochondrial Function in Human Proximal Tubular Kidney Cells (20)
More from Arthur Stem
More from Arthur Stem (11)
Recently uploaded
Recently uploaded (20)
Sugarcane Ash and Sugarcane Ash-Derived Silica Nanoparticles Alter Cellular Metabolism and Mitochondrial Function in Human Proximal Tubular Kidney Cells
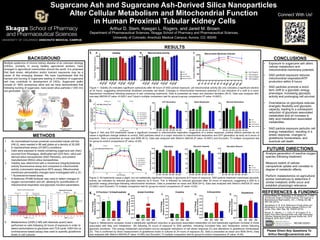
- 1. Sugarcane Ash and Sugarcane Ash-Derived Silica Nanoparticles Alter Cellular Metabolism and Mitochondrial Function in Human Proximal Tubular Kidney Cells Arthur D. Stem, Keegan L. Rogers, and Jared M. Brown Department of Pharmaceutical Sciences, Skaggs School of Pharmacy and Pharmaceutical Sciences, University of Colorado, Anschutz Medical Campus, Aurora, CO, 80045 Connect With Us! BACKGROUND METHODS Multiple epidemics of chronic kidney disease of an unknown etiology (CKDu), primarily in young healthy agricultural workers, have emerged in agricultural communities around the world. It is proposed that heat stress, dehydration and/or toxicant exposures may be a cause of this emerging disease. We have hypothesized that the harvest and burning of sugarcane leading to inhalation of sugarcane ash may contribute to development of CKDu. Sugarcane stalks consist of ~80% amorphous silica and we have demonstrated that following burning of sugarcane, nano-sized silica particles (~200 nm) are generated. 1. An immortalized human proximal convoluted tubule cell line (HK-2), were seeded in 96 well plates at a density of 20,000 in standard/heat stress (37/39ºC) conditions. 2. Cells were exposed to media containing sugarcane ash (Ash) sourced from Nicaragua, desilicated ash (D/S Ash), silica ash derived silica nanoparticles (SAD Particles), and pristine manufactured 200nm silica nanoparticles. 3. Viability was determined with a membrane integrity/esterase activity fluorescence assay and compared to mitochondrial activity (colorimetric tetrazolium MTS assay). Mitochondrial membrane permeability changes were investigated with a JC- 1 fluorescence-based assay. 4. A Seahorse XFe96 Analyzer was used to detect changes to oxygen concentration and pH, allowing for quantification of mitochondrial respiration and glycolytic function parameters. 5. Metabolomics (UHPLC-MS with Absolute quant) were performed on cells following 24 hours of exposure in order to detect perturbations to glycolysis and TCA cycle. GSH-Glo (a luminescence-based assay) was used to quantify glutathione levels in cell cultures. • Exposure to sugarcane ash alters cellular metabolism and mitochondrial membrane potential. • SAD particle exposure reduces mitochondrial respiration/ATP production within 6 hours. • SAD particles promote a short- term shift to a glycolytic energy phenotype, increasing glycolytic activity and prolonging cell survival. • Overreliance on glycolysis reduces energetic flexibility and glycolytic capacity, leading to a subsequent reduction of glycolysis associated metabolites and an increase in fatty acid metabolism associated metabolites. • SAD particle exposure perturbs cell energy metabolism, resulting in a stress response, changes to glutathione homeostasis, and eventual cell death. CONCLUSIONS FUTURE DIRECTIONS R01DK125351 REFERENCES & FUNDING Analyze generation of reactive oxygen species following treatment. Measure extent of cellular nanoparticle uptake and correlate to degree of metabolic effects. Perform metabolomics on agricultural worker biomatrices to determine if similar metabolic shifts occur and establish physiologic relevance. Correa-Rotter, R., Wesseling, C. & Johnson, R. J. CKD of Unknown Origin in Central America: The Case for a Mesoamerican Nephropathy. Am. J. Kidney Dis. 63, 506–520 (2014). Jayasekara, K. B. et al. Relevance of heat stress and dehydration to chronic kidney disease (CKDu) in Sri Lanka. Prev. Med. Rep. 15, 100928 (2019). Rovani, S., Santos, J. J., Corio, P. & Fungaro, D. A. Highly Pure Silica Nanoparticles with High Adsorption Capacity Obtained from Sugarcane Waste Ash. ACS Omega 3, 2618–2627 (2018). Please Direct Any Questions To Arthur.Stem@cuanschutz.edu Figure 3: All treatments cause a slight, but not statistically significant increase in glycolysis at 6 hours of exposure. SAD particle treatment maximized glycolytic activity (as indicated by reduced glycolytic reserve) by 6 hours. This is followed by reduced glycolysis after 24 hours of exposure, suggesting a shift to a glycolytic energy phenotype following mitochondrial shutdown. Data is presented as mean and SEM (N=3). Data was analyzed with Welch’s ANOVA (P value <0.0001) and Dunnett’s T3 multiple comparison test for group-to-control comparisons (P value <0.05). Figure 2: Ash and D/S treatments cause a significant increase in mitochondrial respiration suggestive of a stress response, pristine 200nm particles do not cause a significant change relative to control, SAD particles result in a major reduction to mitochondrial respiration and ATP generation as early as 6 hours of exposure. Data is presented as mean and SEM (N=3). Data was analyzed with Welch’s ANOVA (P value <0.0001) and Dunnett’s T3 multiple comparison test for group-to-control comparisons (P value <0.05). RESULTS 6 h r 2 4 h r 4 8 h r 6 h r 2 4 h r 4 8 h r 6 h r 2 4 h r 4 8 h r 6 h r 2 4 h r 4 8 h r 0 50 100 **** **** Mitochondrial Activity 6 h r 2 4 h r 4 8 h r 6 h r 2 4 h r 4 8 h r 6 h r 2 4 h r 4 8 h r 6 h r 2 4 h r 4 8 h r 0 50 100 **** Percent Relative toControl Viability 0 20 40 60 80 0 20 40 60 80 Time (minutes) Glucose Oligomycin 2-DG Ash 25µg/mL D/S 25µg/mL SAD 2.5µg/mL 200 25µg/mL Control 24hr Glycolysis Stress Test Extra Cellular Acidification Rate (mpH/min/10,000 cells) 0 20 40 60 80 0 20 40 60 80 100 120 Time (minutes) Ash 25µg/mL D/S 25µg/mL SAD 2.5µg/mL 200 25µg/mL Control Oligomycin FCCP Rot/AA 24hr Mito Stress Test Oxygen Consumption Rate (pmol/min/10,000 cells) Figure 1: Viability (A) indicates significant cytotoxicity after 48 hours of SAD particle exposure, yet mitochondrial activity (B) only indicates a significant decline at 24 hours, suggesting mitochondrial shutdown proceeds cell death. Changes to mitochondrial membrane potential (C) are indicative of a shift to a more depolarized membrane following exposure to ash containing treatments. Data is presented as mean and standard deviation (N=3). Data was analyzed with one-way ANOVA (P value <0.0001) and Tukey’s multiple comparison test for group-to-group comparisons (P value <0.0001). A. B. C. 1. 2. 3. 6hr 24hr 6hr 24hr 6hr 24hr 6hr 24hr 0 50 100 150 ATP Generation Percent Relative to Control *** ** **** **** 6hr 24hr 6hr 24hr 6hr 24hr 6hr 24hr 0 50 100 150 Maximal Respiration **** **** * * 6hr 24hr 6hr 24hr 6hr 24hr 6hr 24hr 0 25 50 75 100 125 Glycolysis Percent Relative to Control * 6hr 24hr 6hr 24hr 6hr 24hr 6hr 24hr 0 25 50 75 100 125 Glycolytic Reserve **** **** 0 h r 1 h r 2 h r 3 h r 4 h r 5 h r 6 h r 7 h r 8 h r 40 60 80 100 120 2 4 h r 3 0 h r 3 6 h r 4 2 h r 4 8 h r Percent Relative to Control Ash 25µg/mL D/S 25µg/mL SAD 2.5µg/mL 200 25µg/mL Mitochondrial Membrane Potential 6hr 24hr 6hr 24hr 6hr 24hr 6hr 24hr 0 50 100 150 Basal Respiration * ** **** **** 6hr 24hr 6hr 24hr 6hr 24hr 6hr 24hr 0 25 50 75 100 125 Glycolytic Capacity ** * *** Ash D/S SAD 200 0.0 0.5 1.0 1.5 D-Fructose 1-6-bisphosphate Fold Change Relative to Control * 4. Ash D/S SAD 200 0.0 0.5 1.0 4.0 4.5 5.0 5.5 6.0 Acetyl-Carnitine Fold Change Relative to Control ** Ash D/S SAD 200 0.0 0.5 1.0 1.5 2.0 2.5 3.0 3.5 Creatine Fold Change Relative to Control ** Ash D/S SAD 200 0.0 0.5 1.0 1.5 2.0 2.5 3.0 3.5 5-Oxoproline Fold Change Relative to Control ** Ash D/S SAD 200 0.0 0.5 1.0 1.5 Fold Change Relative to Control Glutathione ** * * Figure 4: Metabolomic analyses reveal a statistically significant reduction to glycolysis associated metabolites (A) and statistically significant increase in those associated with fatty acid metabolism (B) following 24 hours of exposure to SAD particles, indicating increased fatty acid metabolism activity following glycolytic shutdown. This energy metabolism perturbation occurs alongside indications of cell stress response (C) and alterations to glutathione homeostasis (D). This is confirmed by direct measurement of glutathione levels in cultures at 24 hours of exposure (E). Data is presented as mean and SEM (N=4). Data was analyzed with Welch’s ANOVA (P value <0.005) and Dunnett’s T3 multiple comparison test for group-to-control comparisons (P value <0.05). A. B. C. D. E.