1. Preparing Everyone for Disasters:
The Relationship Between Demographics and Emergency Preparedness
Archana Anandakrishnan, Caroline Moore, Ilana Petrescu, and Meagan Sweeney
Objectives
● To evaluate the effectiveness of the Red Cross’s emergency
preparedness presentations.
● To examine relationships between emergency preparedness
behaviors and demographic variables.
● To determine if improvements are needed to increase emergency
preparedness behaviors for all types of individuals.
Hypotheses
● Individuals with ethnic minority status, females, and renters
will report fewer preparedness behaviors than whites, males,
and homeowners.
● There may be pre-presentation differences among participants
in different locations, for example, members of a DC business
organization, a Virginia church, and a Maryland senior center.
● Differences in emergency preparedness between subgroups
will be less significant post-presentation after individuals have
learned more about ways to prepare for disasters.
Method
This study was approved by the GWU Institutional Review Board and the
American Red Cross National Office.
Participants (to date) (see Table 1)
● Attendees at National Capital Area Red Cross’s Emergency
Preparedness Presentations -- a DC business club (n=19), a Virginia
Church (n=117), and Maryland Senior Living Center (n=21).
● Participants were diverse and included 116 African Americans, 26
Whites, and 8 members of other ethnic groups. There were 56 males
and 98 females. Some rented (45%) while others owned homes (55%).
Procedure
● Attendees of the Red Cross’s Emergency Preparedness Presentations
were briefed before the presentation began about the study and could
choose to participate
● A pre-survey was administered before the presentation began
● A post-survey was administered after the presentation was completed
● Participants were compensated $5 for the successful completion of both
the pre- and post-surveys
Measures
● Demographic questions
● Emergency Preparedness Behaviors:
20 items recommended by FEMA and the Red Cross in three
domains – “Build a kit,” “make a plan,” and “be informed.” Before the
presentation, participants noted how many preparedness behaviors
they had already completed. After the presentation, they noted how
many preparedness behaviors they intended to complete in the next 30
days.
e.g., I have necessary medications for sheltering in place.
I have practiced my evacuation plan.
Introduction
Emergency preparedness can play a large role in mitigating the damage inflicted by natural and human made disasters. Certain groups, however, can be disproportionately impacted by such disasters. For example, women,
individuals with fewer resources, and those of ethnic minority status have shown increased maladaptive responses to terrorist events and natural disasters compared to others (Perilla, Norris, & Lavizzo, (2002). In addition, individuals
with those demographic characteristics have also shown less preparedness for disasters. For example, in a study of individuals with disabilities, female, non-white, younger, and urban individuals were less prepared for disasters than
male, white, older, and suburban individuals (Smith & Notaro, 2009). Across these groups, a lack of resources may be an important factor in predicting emergency preparedness behaviors.
The Red Cross regularly sends trained volunteers to speak with community organizations about steps that can be taken to prepare for disasters, hoping to reach a wide range of individuals. The presentations aim to increase
emergency preparedness behaviors of individuals and families, which would subsequently improve psychological outcomes, physical health, and resilience following emergency situations. This study examines differences in emergency
preparedness for individuals with specific demographic characteristics (e.g., ethnicity, gender, living situation, location) and whether those differences decrease following emergency preparedness presentations.
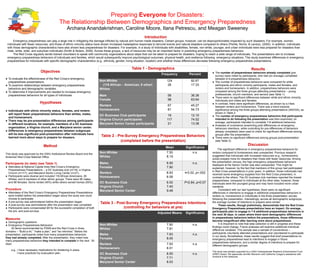
Table 2 - Pre-Survey Emergency Preparedness Behaviors
(completed before the presentation)
Mean Significance
Non-Whites
Whites
7.50
8.19
n.s.
Males
Females
6.95
7.90
n.s.
Renters
Homeowners
8.93
6.58
t=3.02, p<.002
DC Business Club
Virginia Church
Maryland Senior Center
6.00
7.40
9.48
F=2.84, p<0.07
Table 3 - Post-Survey Emergency Preparedness Intentions
(controlling for behaviors at pre)
Adjusted Means Significance
Non-Whites
Whites
7.90
7.81
n.s.
Males
Females
7.93
8.05
n.s.
Renters
Homeowners
7.93
8.01
n.s.
DC Business Club
Virginia Church
Maryland Senior Center
8.55
7.71
8.03
n.s.
Table 1 - Demographics
Frequency Percent
Non-Whites
(116 African – American; 8 other)
Whites
124
26
82.67
17.33
Male
Female
56
98
36.36
63.64
Renters
Homeowners
67
81
45.27
54.73
DC Business Club participants
Virginia Church participants
Maryland Senior Center participants
19
117
21
12.10
74.52
13.38
Results
● The number of preparedness behaviors already completed (pre
survey) were noted by participants, who had (on average) completed
between 6-9 preparedness behaviors.
● The number of preparedness behaviors were compared for white
participants and ethnic minority participants, males and females, and
renters and homeowners. In addition, preparedness behaviors were
compared among the three groups attending presentations – young
professionals, church members, and seniors (see Table 1).
● There were no significant differences between white and ethnic minority
individuals and males and females.
● In contrast, there were significant differences, as shown by a t-test,
between renters and homeowners. There was a trend towards
significance among the three groups attending presentations (ANOVA), as
shown in Table 2.
● The number of emergency preparedness behaviors that participants
intended to do following the presentation was then examined; on
average, participants intended to complete 7-8 additional behaviors.
● Analyses of covariance (examining post differences on emergency
behaviors intentions, while controlling for pre-differences of behaviors
already completed) were used to check for significant differences among
groups after the presentation.
● There were no significant differences among groups post-presentation
(see Table 3).
Discussion
The significant difference in emergency preparedness behaviors for
renters compared to homeowners was unexpected. Previous research
suggested that individuals with increased resources (e.g., homeowners)
would prepare more for disasters than those with fewer resources. Among
the presentation venues, the high emergency preparedness behaviors
displayed at the Senior Center was also unexpected. This might be
explained, however, by the fact that members of this group had participated
in Red Cross presentations in prior years. In addition, those individuals had
received some emergency supplies from the Red Cross presenters, in
contrast to the others. The DC business club members reported the lowest
preparedness, compared to individuals at the other sites; however, those
individuals were the youngest group and may have included more urban
residents.
Consistent with our last hypothesis, there were no significant
differences in intentions to engage in additional preparedness behaviors in
renters vs. homeowners or individuals in the three presentation venues
following the presentation. Interestingly, across all demographic subgroups,
the average number of intentions to prepare were similar.
These results, though preliminary, demonstrate that the Red Cross
Emergency Preparedness presentations have an impact. On average,
participants plan to engage in 7-8 additional preparedness behaviors in
the next 30 days. In cases where there were demographic differences
in preparedness behaviors before the presentations, those differences
become insignificant after learning more about preparedness.
It is important to note that data collection is still in progress and these
findings could change. Future analyses will examine additional individual
difference variables. This sample was a sample of convenience –
participants voluntarily attended presentations and volunteered to participate
in our study. Nonetheless, these results suggest that brief presentations on
emergency preparedness lead to intentions to engage in future
preparedness behaviors, and a similar degree of intentions to prepare for
different demographic groups.
This study was partially supported by a GWU Undergraduate Research Enhancement Fund
(UREF) Award. We appreciate Jennifer Marceron and Catherine Coogan’s assistance with
revisions to the measures.