SlideShare a Scribd company logo
1 of 3
Download to read offline
DATOS PROVISIONALES DE FACTURACIÓN DE RECETAS MÉDICAS
                                                         DEL SISTEMA NACIONAL DE SALUD
                                                                   JUNIO - 2009


      COMUNIDAD                                                        RECETAS FACTURADAS DEL SISTEMA NACIONAL DE SALUD
      AUTÓNOMA                            DATOS MENSUALES                             ACUMULADO ENERO - JUNIO               ACUMULADO INTERANUAL
                                   2009          2008                  %09/08       2009         2008        %09/08    JUL 08-JUN 09 JUL 07-JUN 08   %∆
ANDALUCIA                          14.405.303    13.104.293                 9,93    87.154.372    82.489.738      5,65     167.895.182   157.993.356  6,27
ARAGON                              2.430.441     2.234.303                 8,78    14.179.989    13.615.300      4,15      27.761.813    26.617.688  4,30
ASTURIAS                            2.043.899     1.900.713                 7,53    12.253.360    11.919.769      2,80      24.118.758    23.267.976  3,66
BALEARES                            1.293.186     1.236.385                 4,59     7.801.228     7.723.324      1,01      15.377.264    14.995.457  2,55
CANTABRIA                             946.791       886.016                 6,86     5.753.859     5.552.291      3,63      11.397.852    10.936.357  4,22
CASTILLA LA MANCHA                  3.664.325     3.420.574                 7,13    22.082.280    20.947.698      5,42      43.184.522    40.840.366  5,74
CASTILLA LEON                       4.314.671     4.086.078                 5,59    25.283.248    24.449.242      3,41      50.240.060    48.222.128  4,18
CATALUÑA                           11.972.685    11.389.380                 5,12    73.579.981    73.246.631      0,46     143.384.305   140.511.965  2,04
CANARIAS                            3.401.657     3.167.544                 7,39    19.984.048    19.145.785      4,38      39.082.065    36.664.215  6,59
EXTREMADURA                         2.115.331     1.911.997                10,63    12.729.746    11.917.346      6,82      24.506.865    23.228.440  5,50
GALICIA                             5.103.827     4.807.716                 6,16    31.003.688    29.975.208      3,43      61.146.467    58.508.621  4,51
MADRID                              9.100.516     8.541.316                 6,55    53.192.112    50.475.076      5,38     100.702.384    95.463.459  5,49
MURCIA                              2.379.932     2.306.167                 3,20    15.045.461    14.330.695      4,99      28.962.574    27.456.627  5,48
NAVARRA                             1.010.100       929.767                 8,64     5.948.368     5.723.286      3,93      11.566.991    11.077.540  4,42
C. VALENCIANA                       9.419.233     8.739.640                 7,78    55.741.849    53.667.422      3,87     109.044.421   103.819.043  5,03
PAIS VASCO                          3.535.132     3.282.008                 7,71    21.162.051    20.486.760      3,30      41.028.946    39.425.000  4,07
LA RIOJA                              501.259       460.761                 8,79     3.041.844     2.886.657      5,38       5.980.680     5.662.794  5,61
CEUTA                                  95.793        89.259                 7,32       586.827       574.213      2,20       1.116.425     1.083.363  3,05
MELILLA                                80.258        75.855                 5,80       503.394       478.372      5,23         959.830       912.336  5,21
      NACIONAL                     77.814.339    72.569.772                 7,23   467.027.705  449.604.813       3,88     907.457.404   866.686.731  4,70


NOTA: Los datos aportados no deben usarse en términos comparativos entre CC.AA. dado que, entre otras razones, no consideran variaciones poblacionales acaecidas en las respectivas CC.AA.


  FUENTE DE DATOS: SERVICIOS DE SALUD                                                                                                                                          27/07/2009
  MINISTERIO DE SANIDAD Y POLITICA SOCIAL.- D.G. FARMACIA Y PRODUCTOS SANITARIOS.-S.G. DE CALIDAD DE MEDICAMENTOS Y PRODUCTOS SANITARIOS
DATOS PROVISIONALES DE FACTURACIÓN DE RECETAS MÉDICAS
                                                         DEL SISTEMA NACIONAL DE SALUD
                                                                   JUNIO - 2009


      COMUNIDAD                                GASTO FARMACÉUTICO A TRAVÉS DE RECETA OFICIAL DEL SISTEMA NACIONAL DE SALUD
      AUTÓNOMA                             DATOS MENSUALES                   ACUMULADO ENERO - JUNIO               ACUMULADO INTERANUAL
                                    2009           2008       %09/08       2009         2008        %09/08    JUL 08-JUN 09 JUL 07-JUN 08    %∆
ANDALUCIA                          174.317.131    155.395.560     12,18 1.034.643.383   984.531.729      5,09   2.006.059.754  1.893.553.646  5,94
ARAGON                              35.195.578     32.531.886      8,19   203.569.341   195.326.488      4,22     399.562.182    377.136.358  5,95
ASTURIAS                            29.371.131     27.148.327      8,19   176.164.665   168.668.303      4,44     346.012.447    327.267.491  5,73
BALEARES                            18.665.129     17.172.372      8,69   111.668.756   105.296.870      6,05     217.779.954    204.403.878  6,54
CANTABRIA                           13.000.249     12.153.269      6,97    79.491.526    75.726.198      4,97     157.605.045    148.532.238  6,11
CASTILLA LA MANCHA                  51.756.112     47.789.244      8,30   308.035.814   288.298.139      6,85     603.707.742    560.394.974  7,73
CASTILLA LEON                       62.333.877     58.032.017      7,41   365.119.925   345.976.047      5,53     723.620.167    681.225.563  6,22
CATALUÑA                           153.951.741    147.379.029      4,46   943.571.449   939.199.496      0,47   1.845.539.608  1.800.758.021  2,49
CANARIAS                            48.138.421     44.501.214      8,17   279.669.930   264.400.281      5,78     546.845.416    506.730.591  7,92
EXTREMADURA                         29.950.848     26.594.928     12,62   177.584.133   164.241.759      8,12     342.769.841    319.434.584  7,31
GALICIA                             74.483.154     69.720.295      6,83   452.960.800   430.297.610      5,27     892.104.075    838.126.280  6,44
MADRID                             115.859.336    108.300.909      6,98   671.714.464   647.386.137      3,76   1.277.481.555  1.225.252.275  4,26
MURCIA                              33.748.944     34.545.048     -2,30   207.883.611   208.937.660     -0,50     415.037.657    400.103.918  3,73
NAVARRA                             14.276.604     13.108.044      8,91    84.148.702    80.670.979      4,31     163.620.112    156.172.734  4,77
C. VALENCIANA                      136.055.789    130.488.261      4,27   802.655.962   784.858.645      2,27   1.575.073.699  1.509.159.950  4,37
PAIS VASCO                          49.703.042     46.266.765      7,43   298.153.034   284.873.904      4,66     576.316.422    547.471.643  5,27
LA RIOJA                             7.384.455      6.684.102     10,48    44.507.566    41.339.396      7,66      87.396.279     80.400.810  8,70
CEUTA                                1.275.044      1.174.463      8,56     7.648.550     7.358.693      3,94      14.637.701     13.870.930  5,53
MELILLA                                975.858        937.461      4,10     6.203.256     5.731.512      8,23      12.060.813     10.868.965 10,97
      NACIONAL                   1.050.442.443    979.923.195      7,20 6.255.394.868 6.023.119.846      3,86  12.203.230.468 11.600.864.851  5,19


NOTA: Los datos aportados no deben usarse en términos comparativos entre CC.AA. dado que, entre otras razones, no consideran variaciones poblacionales acaecidas en las respectivas CC.AA.


  FUENTE DE DATOS: SERVICIOS DE SALUD                                                                                                                                          27/07/2009
  MINISTERIO DE SANIDAD Y POLITICA SOCIAL.- D.G. FARMACIA Y PRODUCTOS SANITARIOS.-S.G. DE CALIDAD DE MEDICAMENTOS Y PRODUCTOS SANITARIOS
DATOS PROVISIONALES DE FACTURACIÓN DE RECETAS MÉDICAS
                                                         DEL SISTEMA NACIONAL DE SALUD
                                                                   JUNIO - 2009


      COMUNIDAD                                      GASTO MEDIO POR RECETA FACTURADA DEL SISTEMA NACIONAL DE SALUD
      AUTÓNOMA                           DATOS MENSUALES                  ACUMULADO ENERO - JUNIO              ACUMULADO INTERANUAL
                                   2009         2008        %09/08      2009        2008        %09/08    JUL 08-JUN 09 JUL 07-JUN 08  %∆
ANDALUCIA                               12,10        11,86       2,05        11,87       11,94      -0,53          11,95         11,99  -0,31
ARAGON                                  14,48        14,56      -0,54        14,36       14,35       0,07          14,39         14,17   1,58
ASTURIAS                                14,37        14,28       0,61        14,38       14,15       1,60          14,35         14,07   2,00
BALEARES                                14,43        13,89       3,92        14,31       13,63       4,99          14,16         13,63   3,90
CANTABRIA                               13,73        13,72       0,10        13,82       13,64       1,29          13,83         13,58   1,81
CASTILLA LA MANCHA                      14,12        13,97       1,10        13,95       13,76       1,36          13,98         13,72   1,88
CASTILLA LEON                           14,45        14,20       1,72        14,44       14,15       2,05          14,40         14,13   1,96
CATALUÑA                                12,86        12,94      -0,63        12,82       12,82       0,01          12,87         12,82   0,43
CANARIAS                                14,15        14,05       0,73        13,99       13,81       1,34          13,99         13,82   1,24
EXTREMADURA                             14,16        13,91       1,79        13,95       13,78       1,22          13,99         13,75   1,71
GALICIA                                 14,59        14,50       0,63        14,61       14,36       1,77          14,59         14,32   1,85
MADRID                                  12,73        12,68       0,41        12,63       12,83      -1,54          12,69         12,83  -1,16
MURCIA                                  14,18        14,98      -5,33        13,82       14,58      -5,23          14,33         14,57  -1,66
NAVARRA                                 14,13        14,10       0,25        14,15       14,10       0,36          14,15         14,10   0,34
C. VALENCIANA                           14,44        14,93      -3,26        14,40       14,62      -1,54          14,44         14,54  -0,63
PAIS VASCO                              14,06        14,10      -0,26        14,09       13,91       1,32          14,05         13,89   1,15
LA RIOJA                                14,73        14,51       1,55        14,63       14,32       2,17          14,61         14,20   2,92
CEUTA                                   13,31        13,16       1,16        13,03       12,82       1,70          13,11         12,80   2,40
MELILLA                                 12,16        12,36      -1,61        12,32       11,98       2,85          12,57         11,91   5,47
      NACIONAL                          13,50        13,50      -0,03        13,39       13,40      -0,02          13,45         13,39   0,47


NOTA: Los datos aportados no deben usarse en términos comparativos entre CC.AA. dado que, entre otras razones, no consideran variaciones poblacionales acaecidas en las respectivas CC.AA.


  FUENTE DE DATOS: SERVICIOS DE SALUD                                                                                                                                          27/07/2009
  MINISTERIO DE SANIDAD Y POLITICA SOCIAL.- D.G. FARMACIA Y PRODUCTOS SANITARIOS.-S.G. DE CALIDAD DE MEDICAMENTOS Y PRODUCTOS SANITARIOS

More Related Content

Viewers also liked

Contexto HistóRico
Contexto HistóRicoContexto HistóRico
Contexto HistóRico
Manulourenzo
 
Etapas De La Lirica Medieval
Etapas De La Lirica MedievalEtapas De La Lirica Medieval
Etapas De La Lirica Medieval
Manulourenzo
 
Tok Violence And Games 2
Tok   Violence And Games 2Tok   Violence And Games 2
Tok Violence And Games 2
guest631c26
 
Why the unexpected becomes the new normal
Why the unexpected becomes the new normalWhy the unexpected becomes the new normal
Why the unexpected becomes the new normal
Jean-Yves Huwart
 

Viewers also liked (20)

Cincinnati Plumber Marketing & SEO
Cincinnati Plumber Marketing & SEOCincinnati Plumber Marketing & SEO
Cincinnati Plumber Marketing & SEO
 
Dutch Denim Exploring The Opportunities For A Sustainable Denim Production ...
Dutch Denim   Exploring The Opportunities For A Sustainable Denim Production ...Dutch Denim   Exploring The Opportunities For A Sustainable Denim Production ...
Dutch Denim Exploring The Opportunities For A Sustainable Denim Production ...
 
IAD Summit review from the conference chair
IAD Summit review from the conference chairIAD Summit review from the conference chair
IAD Summit review from the conference chair
 
Correspondencia
CorrespondenciaCorrespondencia
Correspondencia
 
Contexto HistóRico
Contexto HistóRicoContexto HistóRico
Contexto HistóRico
 
Etapas
EtapasEtapas
Etapas
 
Social networking small 2010
Social networking small 2010Social networking small 2010
Social networking small 2010
 
Etapas De La Lirica Medieval
Etapas De La Lirica MedievalEtapas De La Lirica Medieval
Etapas De La Lirica Medieval
 
Paralinguaxe
ParalinguaxeParalinguaxe
Paralinguaxe
 
Tok Violence And Games 2
Tok   Violence And Games 2Tok   Violence And Games 2
Tok Violence And Games 2
 
IAD Summit qick review
IAD Summit qick reviewIAD Summit qick review
IAD Summit qick review
 
Crm Webinar
Crm WebinarCrm Webinar
Crm Webinar
 
Prueba
PruebaPrueba
Prueba
 
Cincinnati Dentist Marketing & SEO
Cincinnati Dentist Marketing & SEOCincinnati Dentist Marketing & SEO
Cincinnati Dentist Marketing & SEO
 
Salary Increment
Salary IncrementSalary Increment
Salary Increment
 
Foss Support Webinar0108
Foss Support Webinar0108Foss Support Webinar0108
Foss Support Webinar0108
 
#boarding: a way to get in touch with travelers in airports
#boarding: a way to get in touch with travelers in airports#boarding: a way to get in touch with travelers in airports
#boarding: a way to get in touch with travelers in airports
 
Office Nomads presentation at coworking Europe 2010
Office Nomads presentation at coworking Europe 2010Office Nomads presentation at coworking Europe 2010
Office Nomads presentation at coworking Europe 2010
 
SEM strategies for the classified sector - ICMA GM Miami 2008
SEM strategies for the classified sector - ICMA GM Miami 2008SEM strategies for the classified sector - ICMA GM Miami 2008
SEM strategies for the classified sector - ICMA GM Miami 2008
 
Why the unexpected becomes the new normal
Why the unexpected becomes the new normalWhy the unexpected becomes the new normal
Why the unexpected becomes the new normal
 

Similar to Gasto farmacéutico Junio 09

Similar to Gasto farmacéutico Junio 09 (20)

Informe paro Jaén registrado octubre 2019
Informe paro Jaén registrado octubre 2019Informe paro Jaén registrado octubre 2019
Informe paro Jaén registrado octubre 2019
 
Informe paro registrado mayo 2019
Informe paro registrado mayo 2019Informe paro registrado mayo 2019
Informe paro registrado mayo 2019
 
Informe paro Jaén septiembre 2019
Informe paro Jaén septiembre 2019Informe paro Jaén septiembre 2019
Informe paro Jaén septiembre 2019
 
Informe paro registrado febrero 2019
Informe paro registrado febrero 2019Informe paro registrado febrero 2019
Informe paro registrado febrero 2019
 
Informe paro Jaén enero 2019
Informe paro Jaén enero 2019Informe paro Jaén enero 2019
Informe paro Jaén enero 2019
 
Informe paro Jaén diciembre 2019
Informe paro Jaén diciembre 2019 Informe paro Jaén diciembre 2019
Informe paro Jaén diciembre 2019
 
Situación comparativa de los Ferrocarriles en el mundo y en Colombia
Situación comparativa de los Ferrocarriles en el mundo y en ColombiaSituación comparativa de los Ferrocarriles en el mundo y en Colombia
Situación comparativa de los Ferrocarriles en el mundo y en Colombia
 
Informe paro Jaen noviembre 2019
Informe paro Jaen noviembre 2019Informe paro Jaen noviembre 2019
Informe paro Jaen noviembre 2019
 
Informe paro registrado Jaén agosto 2020
Informe paro registrado  Jaén agosto 2020Informe paro registrado  Jaén agosto 2020
Informe paro registrado Jaén agosto 2020
 
Informe paro registrado Jaén octubre 2021
Informe paro registrado Jaén octubre 2021Informe paro registrado Jaén octubre 2021
Informe paro registrado Jaén octubre 2021
 
Informe paro jaen junio 2021
Informe paro jaen junio 2021Informe paro jaen junio 2021
Informe paro jaen junio 2021
 
Espac2
Espac2Espac2
Espac2
 
Espac2
Espac2Espac2
Espac2
 
Paro septiembre Jaén
Paro septiembre JaénParo septiembre Jaén
Paro septiembre Jaén
 
Informe paro Jaén enero 2020
Informe paro Jaén enero 2020Informe paro Jaén enero 2020
Informe paro Jaén enero 2020
 
Servicios de la deuda de Mendoza
Servicios de la deuda de MendozaServicios de la deuda de Mendoza
Servicios de la deuda de Mendoza
 
Informe paro registrado febrero 2021
Informe paro registrado febrero 2021Informe paro registrado febrero 2021
Informe paro registrado febrero 2021
 
Informe paro registrado octubre 2018
Informe paro registrado octubre 2018Informe paro registrado octubre 2018
Informe paro registrado octubre 2018
 
Proyecciones 2020 p arte 4
Proyecciones 2020 p arte  4Proyecciones 2020 p arte  4
Proyecciones 2020 p arte 4
 
Informe paro registrado septiembre 2020
Informe paro registrado septiembre 2020Informe paro registrado septiembre 2020
Informe paro registrado septiembre 2020
 

More from Antonio Villafaina

Presentación 1 protocolo seguridad en ir
Presentación 1 protocolo seguridad en irPresentación 1 protocolo seguridad en ir
Presentación 1 protocolo seguridad en ir
Antonio Villafaina
 
¿Quién se aclara con los medicamentos?
¿Quién se aclara con los medicamentos?¿Quién se aclara con los medicamentos?
¿Quién se aclara con los medicamentos?
Antonio Villafaina
 
Presentacion Novedades del programa
Presentacion Novedades del programaPresentacion Novedades del programa
Presentacion Novedades del programa
Antonio Villafaina
 
La atencion Farmacéutica Aqui allí y ahora
La atencion Farmacéutica Aqui allí y ahoraLa atencion Farmacéutica Aqui allí y ahora
La atencion Farmacéutica Aqui allí y ahora
Antonio Villafaina
 
Respuestas del Gobierno al sistema de farmacias
Respuestas del Gobierno al sistema de farmaciasRespuestas del Gobierno al sistema de farmacias
Respuestas del Gobierno al sistema de farmacias
Antonio Villafaina
 

More from Antonio Villafaina (15)

Presentación 1 protocolo seguridad en ir
Presentación 1 protocolo seguridad en irPresentación 1 protocolo seguridad en ir
Presentación 1 protocolo seguridad en ir
 
C:\Documents And Settings\Antonio Villafaina\Escritorio\Proyecto Seguridad3
C:\Documents And Settings\Antonio Villafaina\Escritorio\Proyecto Seguridad3C:\Documents And Settings\Antonio Villafaina\Escritorio\Proyecto Seguridad3
C:\Documents And Settings\Antonio Villafaina\Escritorio\Proyecto Seguridad3
 
Proyecto Seguridad3
Proyecto Seguridad3Proyecto Seguridad3
Proyecto Seguridad3
 
Proyecto Seguridad3
Proyecto Seguridad3Proyecto Seguridad3
Proyecto Seguridad3
 
Proyecto Seguridad3
Proyecto Seguridad3Proyecto Seguridad3
Proyecto Seguridad3
 
Proyecto Seguridad3
Proyecto Seguridad3Proyecto Seguridad3
Proyecto Seguridad3
 
Programa de mejora de la seguridad del paciente en relación a su medicación.
Programa de mejora de la seguridad del paciente en relación a su medicación.Programa de mejora de la seguridad del paciente en relación a su medicación.
Programa de mejora de la seguridad del paciente en relación a su medicación.
 
¿Quién se aclara con los medicamentos?
¿Quién se aclara con los medicamentos?¿Quién se aclara con los medicamentos?
¿Quién se aclara con los medicamentos?
 
Presentacion Novedades del programa
Presentacion Novedades del programaPresentacion Novedades del programa
Presentacion Novedades del programa
 
Memor Ia Iv Encuentro
Memor Ia Iv EncuentroMemor Ia Iv Encuentro
Memor Ia Iv Encuentro
 
La atencion Farmacéutica Aqui allí y ahora
La atencion Farmacéutica Aqui allí y ahoraLa atencion Farmacéutica Aqui allí y ahora
La atencion Farmacéutica Aqui allí y ahora
 
Funciones Trabajador social
Funciones Trabajador social Funciones Trabajador social
Funciones Trabajador social
 
Respuestas del Gobierno al sistema de farmacias
Respuestas del Gobierno al sistema de farmaciasRespuestas del Gobierno al sistema de farmacias
Respuestas del Gobierno al sistema de farmacias
 
Resolucion Competencia
Resolucion CompetenciaResolucion Competencia
Resolucion Competencia
 
Convenio COF Caceres
Convenio COF CaceresConvenio COF Caceres
Convenio COF Caceres
 

Gasto farmacéutico Junio 09

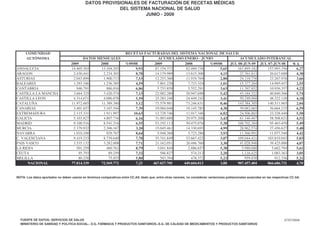
  • 1. DATOS PROVISIONALES DE FACTURACIÓN DE RECETAS MÉDICAS DEL SISTEMA NACIONAL DE SALUD JUNIO - 2009 COMUNIDAD RECETAS FACTURADAS DEL SISTEMA NACIONAL DE SALUD AUTÓNOMA DATOS MENSUALES ACUMULADO ENERO - JUNIO ACUMULADO INTERANUAL 2009 2008 %09/08 2009 2008 %09/08 JUL 08-JUN 09 JUL 07-JUN 08 %∆ ANDALUCIA 14.405.303 13.104.293 9,93 87.154.372 82.489.738 5,65 167.895.182 157.993.356 6,27 ARAGON 2.430.441 2.234.303 8,78 14.179.989 13.615.300 4,15 27.761.813 26.617.688 4,30 ASTURIAS 2.043.899 1.900.713 7,53 12.253.360 11.919.769 2,80 24.118.758 23.267.976 3,66 BALEARES 1.293.186 1.236.385 4,59 7.801.228 7.723.324 1,01 15.377.264 14.995.457 2,55 CANTABRIA 946.791 886.016 6,86 5.753.859 5.552.291 3,63 11.397.852 10.936.357 4,22 CASTILLA LA MANCHA 3.664.325 3.420.574 7,13 22.082.280 20.947.698 5,42 43.184.522 40.840.366 5,74 CASTILLA LEON 4.314.671 4.086.078 5,59 25.283.248 24.449.242 3,41 50.240.060 48.222.128 4,18 CATALUÑA 11.972.685 11.389.380 5,12 73.579.981 73.246.631 0,46 143.384.305 140.511.965 2,04 CANARIAS 3.401.657 3.167.544 7,39 19.984.048 19.145.785 4,38 39.082.065 36.664.215 6,59 EXTREMADURA 2.115.331 1.911.997 10,63 12.729.746 11.917.346 6,82 24.506.865 23.228.440 5,50 GALICIA 5.103.827 4.807.716 6,16 31.003.688 29.975.208 3,43 61.146.467 58.508.621 4,51 MADRID 9.100.516 8.541.316 6,55 53.192.112 50.475.076 5,38 100.702.384 95.463.459 5,49 MURCIA 2.379.932 2.306.167 3,20 15.045.461 14.330.695 4,99 28.962.574 27.456.627 5,48 NAVARRA 1.010.100 929.767 8,64 5.948.368 5.723.286 3,93 11.566.991 11.077.540 4,42 C. VALENCIANA 9.419.233 8.739.640 7,78 55.741.849 53.667.422 3,87 109.044.421 103.819.043 5,03 PAIS VASCO 3.535.132 3.282.008 7,71 21.162.051 20.486.760 3,30 41.028.946 39.425.000 4,07 LA RIOJA 501.259 460.761 8,79 3.041.844 2.886.657 5,38 5.980.680 5.662.794 5,61 CEUTA 95.793 89.259 7,32 586.827 574.213 2,20 1.116.425 1.083.363 3,05 MELILLA 80.258 75.855 5,80 503.394 478.372 5,23 959.830 912.336 5,21 NACIONAL 77.814.339 72.569.772 7,23 467.027.705 449.604.813 3,88 907.457.404 866.686.731 4,70 NOTA: Los datos aportados no deben usarse en términos comparativos entre CC.AA. dado que, entre otras razones, no consideran variaciones poblacionales acaecidas en las respectivas CC.AA. FUENTE DE DATOS: SERVICIOS DE SALUD 27/07/2009 MINISTERIO DE SANIDAD Y POLITICA SOCIAL.- D.G. FARMACIA Y PRODUCTOS SANITARIOS.-S.G. DE CALIDAD DE MEDICAMENTOS Y PRODUCTOS SANITARIOS
  • 2. DATOS PROVISIONALES DE FACTURACIÓN DE RECETAS MÉDICAS DEL SISTEMA NACIONAL DE SALUD JUNIO - 2009 COMUNIDAD GASTO FARMACÉUTICO A TRAVÉS DE RECETA OFICIAL DEL SISTEMA NACIONAL DE SALUD AUTÓNOMA DATOS MENSUALES ACUMULADO ENERO - JUNIO ACUMULADO INTERANUAL 2009 2008 %09/08 2009 2008 %09/08 JUL 08-JUN 09 JUL 07-JUN 08 %∆ ANDALUCIA 174.317.131 155.395.560 12,18 1.034.643.383 984.531.729 5,09 2.006.059.754 1.893.553.646 5,94 ARAGON 35.195.578 32.531.886 8,19 203.569.341 195.326.488 4,22 399.562.182 377.136.358 5,95 ASTURIAS 29.371.131 27.148.327 8,19 176.164.665 168.668.303 4,44 346.012.447 327.267.491 5,73 BALEARES 18.665.129 17.172.372 8,69 111.668.756 105.296.870 6,05 217.779.954 204.403.878 6,54 CANTABRIA 13.000.249 12.153.269 6,97 79.491.526 75.726.198 4,97 157.605.045 148.532.238 6,11 CASTILLA LA MANCHA 51.756.112 47.789.244 8,30 308.035.814 288.298.139 6,85 603.707.742 560.394.974 7,73 CASTILLA LEON 62.333.877 58.032.017 7,41 365.119.925 345.976.047 5,53 723.620.167 681.225.563 6,22 CATALUÑA 153.951.741 147.379.029 4,46 943.571.449 939.199.496 0,47 1.845.539.608 1.800.758.021 2,49 CANARIAS 48.138.421 44.501.214 8,17 279.669.930 264.400.281 5,78 546.845.416 506.730.591 7,92 EXTREMADURA 29.950.848 26.594.928 12,62 177.584.133 164.241.759 8,12 342.769.841 319.434.584 7,31 GALICIA 74.483.154 69.720.295 6,83 452.960.800 430.297.610 5,27 892.104.075 838.126.280 6,44 MADRID 115.859.336 108.300.909 6,98 671.714.464 647.386.137 3,76 1.277.481.555 1.225.252.275 4,26 MURCIA 33.748.944 34.545.048 -2,30 207.883.611 208.937.660 -0,50 415.037.657 400.103.918 3,73 NAVARRA 14.276.604 13.108.044 8,91 84.148.702 80.670.979 4,31 163.620.112 156.172.734 4,77 C. VALENCIANA 136.055.789 130.488.261 4,27 802.655.962 784.858.645 2,27 1.575.073.699 1.509.159.950 4,37 PAIS VASCO 49.703.042 46.266.765 7,43 298.153.034 284.873.904 4,66 576.316.422 547.471.643 5,27 LA RIOJA 7.384.455 6.684.102 10,48 44.507.566 41.339.396 7,66 87.396.279 80.400.810 8,70 CEUTA 1.275.044 1.174.463 8,56 7.648.550 7.358.693 3,94 14.637.701 13.870.930 5,53 MELILLA 975.858 937.461 4,10 6.203.256 5.731.512 8,23 12.060.813 10.868.965 10,97 NACIONAL 1.050.442.443 979.923.195 7,20 6.255.394.868 6.023.119.846 3,86 12.203.230.468 11.600.864.851 5,19 NOTA: Los datos aportados no deben usarse en términos comparativos entre CC.AA. dado que, entre otras razones, no consideran variaciones poblacionales acaecidas en las respectivas CC.AA. FUENTE DE DATOS: SERVICIOS DE SALUD 27/07/2009 MINISTERIO DE SANIDAD Y POLITICA SOCIAL.- D.G. FARMACIA Y PRODUCTOS SANITARIOS.-S.G. DE CALIDAD DE MEDICAMENTOS Y PRODUCTOS SANITARIOS
  • 3. DATOS PROVISIONALES DE FACTURACIÓN DE RECETAS MÉDICAS DEL SISTEMA NACIONAL DE SALUD JUNIO - 2009 COMUNIDAD GASTO MEDIO POR RECETA FACTURADA DEL SISTEMA NACIONAL DE SALUD AUTÓNOMA DATOS MENSUALES ACUMULADO ENERO - JUNIO ACUMULADO INTERANUAL 2009 2008 %09/08 2009 2008 %09/08 JUL 08-JUN 09 JUL 07-JUN 08 %∆ ANDALUCIA 12,10 11,86 2,05 11,87 11,94 -0,53 11,95 11,99 -0,31 ARAGON 14,48 14,56 -0,54 14,36 14,35 0,07 14,39 14,17 1,58 ASTURIAS 14,37 14,28 0,61 14,38 14,15 1,60 14,35 14,07 2,00 BALEARES 14,43 13,89 3,92 14,31 13,63 4,99 14,16 13,63 3,90 CANTABRIA 13,73 13,72 0,10 13,82 13,64 1,29 13,83 13,58 1,81 CASTILLA LA MANCHA 14,12 13,97 1,10 13,95 13,76 1,36 13,98 13,72 1,88 CASTILLA LEON 14,45 14,20 1,72 14,44 14,15 2,05 14,40 14,13 1,96 CATALUÑA 12,86 12,94 -0,63 12,82 12,82 0,01 12,87 12,82 0,43 CANARIAS 14,15 14,05 0,73 13,99 13,81 1,34 13,99 13,82 1,24 EXTREMADURA 14,16 13,91 1,79 13,95 13,78 1,22 13,99 13,75 1,71 GALICIA 14,59 14,50 0,63 14,61 14,36 1,77 14,59 14,32 1,85 MADRID 12,73 12,68 0,41 12,63 12,83 -1,54 12,69 12,83 -1,16 MURCIA 14,18 14,98 -5,33 13,82 14,58 -5,23 14,33 14,57 -1,66 NAVARRA 14,13 14,10 0,25 14,15 14,10 0,36 14,15 14,10 0,34 C. VALENCIANA 14,44 14,93 -3,26 14,40 14,62 -1,54 14,44 14,54 -0,63 PAIS VASCO 14,06 14,10 -0,26 14,09 13,91 1,32 14,05 13,89 1,15 LA RIOJA 14,73 14,51 1,55 14,63 14,32 2,17 14,61 14,20 2,92 CEUTA 13,31 13,16 1,16 13,03 12,82 1,70 13,11 12,80 2,40 MELILLA 12,16 12,36 -1,61 12,32 11,98 2,85 12,57 11,91 5,47 NACIONAL 13,50 13,50 -0,03 13,39 13,40 -0,02 13,45 13,39 0,47 NOTA: Los datos aportados no deben usarse en términos comparativos entre CC.AA. dado que, entre otras razones, no consideran variaciones poblacionales acaecidas en las respectivas CC.AA. FUENTE DE DATOS: SERVICIOS DE SALUD 27/07/2009 MINISTERIO DE SANIDAD Y POLITICA SOCIAL.- D.G. FARMACIA Y PRODUCTOS SANITARIOS.-S.G. DE CALIDAD DE MEDICAMENTOS Y PRODUCTOS SANITARIOS