
Recommended
More Related Content
What's hot
Viewers also liked
Similar to Data 2.0: North Port - Section Three - Local Efforts & Innovations
Similar to Data 2.0: North Port - Section Three - Local Efforts & Innovations (20)
Recently uploaded
Recently uploaded (20)
Data 2.0: North Port - Section Three - Local Efforts & Innovations
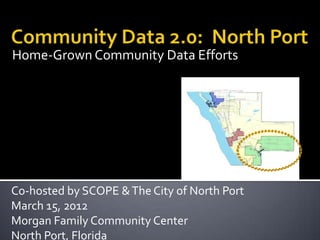
- 1. Home-Grown Community Data Efforts Co-hosted by SCOPE & The City of North Port March 15, 2012 Morgan Family Community Center North Port, Florida
- 2. A Decade of Investment North Port I&T / GIS Resources SCOPE Composite Map Online Community Platform
- 3. 6 Community Report Cards 8 Study Reports (Demographics) ◦ Aging: The Possibilities (2009) Civic Participation ◦ Race & Cultural Relations (2008) Culture & Recreation ◦ Community Change: Economy • Redevelopment & Infill (2004) Health ◦ Family Violence (2004) Learning ◦ Mental Health (2003) Natural Environment ◦ School Dropout (2003) (Built Environment) ◦ Affordable Housing (2002) Social Environment ◦ Traffic Flow & Congestion (2002) Transportation 2 People Count Reports ◦ People Count ◦ People Count: Race & Ethnicity
- 4. Animal Welfare Advisory Council (AWAC) • Nokomis Revitalization Advisory Committee Bicycle/Pedestrian/Trail Advisory Committee Parks Advisory and Recreation Council Board of Zoning Appeals Planning Commission Building Code Board of Adjustments & Appeals Citizen Tax Oversight Committee Public Facilities Financing Advisory Board Citizens Advisory Committee for Public Transportation Sarasota County Health Facilities Authority and Coastal Advisory Committee Industrial Development Revenue Bond Citizens Community Action Agency Board Advisory Committee Development Services Advisory Committee Emergency Medical Services Advisory Board Sarasota Tree Advisory Council Englewood Community Redevelopment Area Advisory Bd Seniors Advisory Council Environmental Policy Task Force SHIP Affordable Housing Advisory Committee Environmentally Sensitive Lands Oversight Committee Stormwater Environmental Utility Advisory Fire Rescue District Advisory Board General Contractors Licensing & Examining Board Committee Health Planning Council of SW Florida Tourism and Economic Development Board Historic Preservation Board (TEDB) Historical Commission Tourist Development Council Human Services Advisory Council Integrated Pest Management Advisory Board Traffic Advisory Council Keep Sarasota County Beautiful Advisory Board Water and Sewer Advisory Council Library Advisory Board Waterways Advisory Council Mechanical Contractors Licensing & Examining Board Well Drilling Advisory Board Metropolitan Planning Organization Citizens' Advisory Committee Neighborhood Initiative Grant Advisory Committee
- 5. Art Advisory Board Audit Committee Beautification and Tree/Scenic Highway Committee Business and Economic Development Advisory Board Charter Review Advisory Board Citizens Tax Oversight Committee Code Enforcement Board Contractor's Licensing Board Joint Management Advisory Board Loan Administration Committee Municipal Firefighters Pension Trust Fund Board of Trustees Municipal Police Officers' Pension Trust Fund Board of Trustees Naming Committee Parks & Recreation Advisory Board Planning & Zoning Advisory Board Public Utility Advisory Board Sister City Committee Tamiami Trail Appearance Advisory Board Transportation Advisory Board Zoning Board of Appeals
- 6. Vision North Port North Port CHAT Economic Development Corporation Sarasota County Green Map Community Alliance Continuing the Conversation
- 7. Domain # of indicators Demographics 12 Civic Participation 17 Culture & Recreation 9 Economy 30 Health 30 Learning 21 Natural Environment 15 Built Environment 5 Social Environment 27 Transportation 18 184
- 10. Boundaries: Assets: • Census Tract / Block Group / Block • Libraries • Zip Codes • Houses of Worship • School Attendance Zones • Firehouses • Voting Precincts • Parks • Neighborhood & Homeowner’s • Schools Associations • Businesses • Neighbor-Identified Assets Demographics: • Total # Indicators of Well-Being: • Age: Over 65 Years, Under 18 • Civic Participation Years, Under 5 Years • Culture & Recreation • Race / Ethnicity: Black / African- • Economy American, Hispanic / Latino, White • Health • Households: Owners/Renters, with • Learning Kids, with Single Individuals • Environment • Social
- 29. How could you make the most of these innovations, as a resident and as a professional? What other local community data innovations do you know about?
Editor's Notes
- So now that you’ve had the opportunity to hear about all of these different data collection efforts and technologies, I am going to talk with you a bit about the composite map that SCOPE has been developing over the past few years. As efforts around community data have been evolving, we noticed that there is a lot of data being collected, but it is not all connected in one place.The composite map incorporates shapefiles from different places and organizations, layers them on top of each other, and creates “ultimate mash-ups” of data for us. This is helpful when learning about our community and seeking to implement positive change.
- So we have pulled a few different pieces of data for North Port, to create a North Port specific map. We used the school attendance zone boundary system I referred to earlier, layered that with indicators of well-being specific to learning, demographics, and some assets.
- Within the county we have six different highschool attendance zones, and the North Port city boundaries envelop three of these. We then layered the data about 10th grade reading achievement to look at the different rates within the city. We noticed that within the city, the Venice High Area is doing pretty well (48%-53%), while Lemon Bay is right around (39-47%), and North Port High is between (37-39%). Well that is interesting, but what do we do about it?
- There are so many assets in North Port that we decided to zoom in on a particular area of North Port in order to see things better.
- One asset might be older adults, since many of them are retired and might therefore have more time to tutor or read with kids.Each of these dots stands for the proportion of older adults in an area- the bigger the dot, the more the older adults. We can see there are quite a few living in this area!
- Another asset would be libraries, as a place for kids to go and read. There is one library here, centrally located.
- Another asset for kids are churches; the communities often have ways of rallying around a cause and figuring out how to solve a problem. Each of these green dots represents a place of worship- we can see that there are quite a few in this area.
- North Port has a wealth of Parks & Natural Lands- these spaces are places where kids can go and spend time with other people, creating community.
- Firestations are another asset, since the nature of a firefighter’s work allows him/her to be available (while waiting for fires). They have extra time and could serve as a resource for kids learning to read.
- Schools are another (more obvious) asset for kids learning to read; each of these points represents a school and there are quite a few of them around.
- Finally, the last asset I will talk about today are neighborhoods. Neighborhoods are a community where residents can ban together and help one another out. This community could serve as another resource for students.So I’ve talked about older adults, libraries, houses of worship, parks, firestations, schools, and neighborhoods as assets for kids in a neighborhood. This is just one example of mashing up various datasets, and how the composite map becomes a tool for community change. Thanks.