Clinical Diagnostic evaluation Statistics.pdf
•
0 likes•136 views

Statistical Test for Clinical Diagnostic Screening Tests.
Report
Share
Report
Share
Download to read offline

Recommended
Presented at the Third Annual Barsan Emergency Medicine Research ForumCan Comprehensive Respiratory Pathogen Panels Be Used to Exclude Pertussis In...
Can Comprehensive Respiratory Pathogen Panels Be Used to Exclude Pertussis In...University of Michigan Department of Emergency Medicine
Pharma co kinetics includes 1:Renal excretion (Major )
2:Biliary Excretion
3:Pulmonary Excretion
4:Salivary Excretion
5:Sweat Excretion
6:Mamamry Excretion
Pharma Co Kinetics Filtration by Kidney
Pharma Co Kinetics Filtration by KidneyPKLI University- Institute of Nursing and Allied Health Sciences Lahore , Pakistan.
More Related Content
Similar to Clinical Diagnostic evaluation Statistics.pdf
Presented at the Third Annual Barsan Emergency Medicine Research ForumCan Comprehensive Respiratory Pathogen Panels Be Used to Exclude Pertussis In...
Can Comprehensive Respiratory Pathogen Panels Be Used to Exclude Pertussis In...University of Michigan Department of Emergency Medicine
Similar to Clinical Diagnostic evaluation Statistics.pdf (20)
Epidemiological Approaches for Evaluation of diagnostic tests.pptx
Epidemiological Approaches for Evaluation of diagnostic tests.pptx
Can Comprehensive Respiratory Pathogen Panels Be Used to Exclude Pertussis In...
Can Comprehensive Respiratory Pathogen Panels Be Used to Exclude Pertussis In...
[Workshop] The science of screening in Psycho-oncology (Oct10)
[Workshop] The science of screening in Psycho-oncology (Oct10)
Quantitative methods of Signal detection on spontaneous reporting systems - S...
Quantitative methods of Signal detection on spontaneous reporting systems - S...
IMPROVING PERFORMANCE OF ALGORITHMS TO POWER UNMET NEED AND EFFECTIVENESS IN ...
IMPROVING PERFORMANCE OF ALGORITHMS TO POWER UNMET NEED AND EFFECTIVENESS IN ...
More from PKLI University- Institute of Nursing and Allied Health Sciences Lahore , Pakistan.
Pharma co kinetics includes 1:Renal excretion (Major )
2:Biliary Excretion
3:Pulmonary Excretion
4:Salivary Excretion
5:Sweat Excretion
6:Mamamry Excretion
Pharma Co Kinetics Filtration by Kidney
Pharma Co Kinetics Filtration by KidneyPKLI University- Institute of Nursing and Allied Health Sciences Lahore , Pakistan.
Mathematics for nurse Ration and Proportion Concept.Mathematics for Nurses Ratio and Proportion.pptx
Mathematics for Nurses Ratio and Proportion.pptxPKLI University- Institute of Nursing and Allied Health Sciences Lahore , Pakistan.
Introduction to basic Mathematics , multiplication, division, addition and subtraction with concept of BODMAS .Basic operations fractions , decimals and percentage.Mathematics Basic operations, fractions decimals and percentage.pptx
Mathematics Basic operations, fractions decimals and percentage.pptxPKLI University- Institute of Nursing and Allied Health Sciences Lahore , Pakistan.
H.A Regional examination Unit#02,Chapter#04 full chapter H.A Regional examination Unit#02,Chapter#04.pptx
H.A Regional examination Unit#02,Chapter#04.pptxPKLI University- Institute of Nursing and Allied Health Sciences Lahore , Pakistan.
UNIT#02
Regional Examinations
C H A P T E R#04 (Part 1)
Beginning the Physical Examination:
General Survey, Vital Signs, and Pain
H.A Regional examination Unit#02,Chapter#04.pptx
H.A Regional examination Unit#02,Chapter#04.pptxPKLI University- Institute of Nursing and Allied Health Sciences Lahore , Pakistan.
These slide are extracted from Bates Guide to physical examination Unit #01, Chapter#03 for interviewing techniques. H.A Interviewing and the Health History Chapter#03 Bates.pptx
H.A Interviewing and the Health History Chapter#03 Bates.pptxPKLI University- Institute of Nursing and Allied Health Sciences Lahore , Pakistan.
Introduction to Mathematics Preliminary Knowledge about Number system.Mathematics for nurses Introduction to Nmber system Cahp#01.pptx
Mathematics for nurses Introduction to Nmber system Cahp#01.pptxPKLI University- Institute of Nursing and Allied Health Sciences Lahore , Pakistan.
More from PKLI University- Institute of Nursing and Allied Health Sciences Lahore , Pakistan. (14)
Health Assessment Findings on Skin Assessment.pptx
Health Assessment Findings on Skin Assessment.pptx
Mathematics Basic operations, fractions decimals and percentage.pptx
Mathematics Basic operations, fractions decimals and percentage.pptx
H.A Interviewing and the Health History Chapter#03 Bates.pptx
H.A Interviewing and the Health History Chapter#03 Bates.pptx
Mathematics for nurses Introduction to Nmber system Cahp#01.pptx
Mathematics for nurses Introduction to Nmber system Cahp#01.pptx
Recently uploaded
Independent Call Girls Hyderabad 💋 9352988975 💋 Genuine WhatsApp Number for Real Meet
WHATSAPP On Here: 9352988975
Today call girl service available 24X7*▬█⓿▀█▀ 𝐈𝐍𝐃𝐄𝐏𝐄𝐍𝐃𝐄𝐍𝐓 CALL 𝐆𝐈𝐑𝐋 𝐕𝐈𝐏 𝐄𝐒𝐂𝐎𝐑𝐓 SERVICE ✅
⭐➡️HOT & SEXY MODELS // COLLEGE GIRLS
AVAILABLE FOR COMPLETE ENJOYMENT WITH HIGH PROFILE INDIAN MODEL AVAILABLE HOTEL & HOME
★ SAFE AND SECURE HIGH CLASS SERVICE AFFORDABLE RATE
★ 100% SATISFACTION,UNLIMITED ENJOYMENT.
★ All Meetings are confidential and no information is provided to any one at any cost.
★ EXCLUSIVE PROFILes Are Safe and Consensual with Most Limits Respected
★ Service Available In: - HOME & HOTEL 24x7 :: 3 * 5 *7 *Star Hotel Service .In Call & Out call SeRvIcEs :
★ A-Level (5 star escort)
★ Strip-tease
★ BBBJ (Bareback Blowjob)Receive advanced sexual techniques in different mode make their life more pleasurable #G05.
★ Spending time in hotel rooms
★ BJ (Blowjob Without a Condom)
★ Completion (Oral to completion)
★ Covered (Covered blowjob Without condom
100% SAFE AND SECURE 24 HOURS SERVICE AVAILABLE HOME AND HOTEL SERVICESIndependent Call Girls Hyderabad 💋 9352988975 💋 Genuine WhatsApp Number for R...
Independent Call Girls Hyderabad 💋 9352988975 💋 Genuine WhatsApp Number for R...Ahmedabad Call Girls
Hello, Guys welcome to Manalifun Goa Escort service. Are you want Top call girls in Goa at just ₹10000 then no further anywhere because we have a large number of local beautiful girls. We are a genuine platform to provide unlimited classification escort ads service without any commission. 9316020077
Here many Goa Independent call girls and ladies, publish their ads. Our call girl in Goa is well-known for real sexual fun in Goa. We are not allow any prostitute to work here without checking the details, Firstly all ads check by our team then we publish them here. So don’t hesitate to book Low rate call girls in Goa. 9316020077
Goa call girls: A real wonder in Goa
Who are the best Goa Escort Service provider for Goa call girls
High-Class call girls in Goa escort service for 100% Satisfaction
Choose a trusted call girl service in Goa with Us +91-9316020077
Goa Escorts Provide 100% Client Satisfaction
How Our Goa Call Girls Are Perfect For Instant Satisfaction
100% Guaranteed Goa call girls will make you excited
How to Find Cheap Call Girls in Goa
Our Reliable Escort Service in Goa Local Areas
Goa Escorts (cheap escort service in Goa)
Rate Chart of Goa call girls, (call girl Rate in Goa)
5-star hotel For Goa call girls service
Call girls in Goa are the ideal sex partner for you
BOOK YOUR FAVORITE Goa CALL GIRLS SERVICE WITH US CALL! US NOW~ 9316020077
Best way to Hire call girls in Goa
What’s the cost of escort service in Goa
North Goa Call Girls
Location :-
Baga , Caclangute , Candolim , Anjuna , Panaji Arpora , Vagator , Morjim , Siolim , Mandrem , Arambol , etc.
Vasco , Bambolim , Madgaon, Colva , Etc9316020077📞Goa Call Girls Numbers, Call Girls Whatsapp Numbers Goa
9316020077📞Goa Call Girls Numbers, Call Girls Whatsapp Numbers Goarussian goa call girl and escorts service
Recently uploaded (20)
nagpur Call Girls 👙 6297143586 👙 Genuine WhatsApp Number for Real Meet
nagpur Call Girls 👙 6297143586 👙 Genuine WhatsApp Number for Real Meet
Jalna Call Girls 👙 6297143586 👙 Genuine WhatsApp Number for Real Meet
Jalna Call Girls 👙 6297143586 👙 Genuine WhatsApp Number for Real Meet
Nanded Call Girls 👙 6297143586 👙 Genuine WhatsApp Number for Real Meet
Nanded Call Girls 👙 6297143586 👙 Genuine WhatsApp Number for Real Meet
Sambalpur Call Girls 👙 6297143586 👙 Genuine WhatsApp Number for Real Meet
Sambalpur Call Girls 👙 6297143586 👙 Genuine WhatsApp Number for Real Meet
Patna Call Girls 👙 6297143586 👙 Genuine WhatsApp Number for Real Meet
Patna Call Girls 👙 6297143586 👙 Genuine WhatsApp Number for Real Meet
💚 Punjabi Call Girls In Chandigarh 💯Lucky 🔝8868886958🔝Call Girl In Chandigarh
💚 Punjabi Call Girls In Chandigarh 💯Lucky 🔝8868886958🔝Call Girl In Chandigarh
Jaipur Call Girls 9257276172 Call Girl in Jaipur Rajasthan
Jaipur Call Girls 9257276172 Call Girl in Jaipur Rajasthan
palanpur Call Girls 👙 6297143586 👙 Genuine WhatsApp Number for Real Meet
palanpur Call Girls 👙 6297143586 👙 Genuine WhatsApp Number for Real Meet
Best Lahore Escorts 😮💨03250114445 || VIP escorts in Lahore
Best Lahore Escorts 😮💨03250114445 || VIP escorts in Lahore
Kolkata Call Girls Miss Inaaya ❤️ at @30% discount Everyday Call girl
Kolkata Call Girls Miss Inaaya ❤️ at @30% discount Everyday Call girl
Russian Call Girls Kota * 8250192130 Service starts from just ₹9999 ✅
Russian Call Girls Kota * 8250192130 Service starts from just ₹9999 ✅
Muzaffarpur Call Girls 👙 6297143586 👙 Genuine WhatsApp Number for Real Meet
Muzaffarpur Call Girls 👙 6297143586 👙 Genuine WhatsApp Number for Real Meet
Independent Call Girls Hyderabad 💋 9352988975 💋 Genuine WhatsApp Number for R...
Independent Call Girls Hyderabad 💋 9352988975 💋 Genuine WhatsApp Number for R...
Mangalore Call Girls 👙 6297143586 👙 Genuine WhatsApp Number for Real Meet
Mangalore Call Girls 👙 6297143586 👙 Genuine WhatsApp Number for Real Meet
9316020077📞Goa Call Girls Numbers, Call Girls Whatsapp Numbers Goa
9316020077📞Goa Call Girls Numbers, Call Girls Whatsapp Numbers Goa
ooty Call Girls 👙 6297143586 👙 Genuine WhatsApp Number for Real Meet
ooty Call Girls 👙 6297143586 👙 Genuine WhatsApp Number for Real Meet
Tirupati Call Girls 👙 6297143586 👙 Genuine WhatsApp Number for Real Meet
Tirupati Call Girls 👙 6297143586 👙 Genuine WhatsApp Number for Real Meet
Dehradun Call Girls 8854095900 Call Girl in Dehradun Uttrakhand
Dehradun Call Girls 8854095900 Call Girl in Dehradun Uttrakhand
bhopal Call Girls 👙 6297143586 👙 Genuine WhatsApp Number for Real Meet
bhopal Call Girls 👙 6297143586 👙 Genuine WhatsApp Number for Real Meet
Clinical Diagnostic evaluation Statistics.pdf
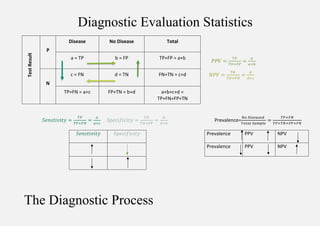
- 1. Diagnostic Evaluation Statistics 𝑃𝑃𝑉 = 𝑇𝑃 𝑇𝑂+𝐹𝑃 = 𝑎 𝑎+𝑏 𝑁𝑃𝑉 = 𝑇𝑁 𝑇𝑁+𝐹𝑁 = 𝑑 𝑑+𝑐 𝑆𝑒𝑛𝑠𝑡𝑖𝑣𝑖𝑡𝑦 = 𝑇𝑃 𝑇𝑃+𝐹𝑁 = 𝑎 𝑎+𝑐 𝑆𝑝𝑒𝑐𝑖𝑓𝑖𝑐𝑖𝑡𝑦 = 𝑇𝑁 𝑇𝑁+𝐹𝑃 = 𝑑 𝑑+𝑏 Prevalence= 𝑁𝑜 𝐷𝑖𝑠𝑒𝑎𝑠𝑒𝑑 𝑇𝑜𝑡𝑎𝑙 𝑆𝑎𝑚𝑝𝑙𝑒 = 𝑇𝑃+𝐹𝑁 𝑇𝑃+𝑇𝑁+𝐹𝑃+𝐹𝑁 𝑆𝑒𝑛𝑠𝑡𝑖𝑣𝑖𝑡𝑦 𝑆𝑝𝑒𝑐𝑖𝑓𝑖𝑐𝑖𝑡𝑦 Prevalence PPV NPV Prevalence PPV NPV The Diagnostic Process Test Result P Disease No Disease Total a = TP b = FP TP+FP = a+b N c = FN d = TN FN+TN = c+d TP+FN = a+c FP+TN = b+d a+b+c+d = TP+FN+FP+TN
- 2. Bayes Theorem Fagan Nomogram Natural frequencies Bayes' theorem converts the results from your test into the real probability of the event. The Fagan Nomogram is a graphical tool for estimation how much result on a diagnostic test changes the probability that a person has a disease. Natural frequencies represent the joint frequencies in 2 events such as the number of patients number who will have a positive test result with disease and the Likelihood Ratio Example Patient has signs nad symptoms Differential Diagnosis Advice Diagnostic Test Interpret and Act On Test Results Pre-Test Probibility Test Characteristics Post-Test Probibility
- 3. A new state of the art blood pressure cuff with a SN of 80% and a SP of 95% was developed. Assume that someone's chance of having blood pressure in the general population who's completely asymptomatic is 20%. Pretest probability = 20% (unless if there are risk factors, symptoms, etc...) LR+=0.8/0.05 = 16 LR=-0.2/0.95 = 0.211 Pretest Odds = 0.2/0.8 = 0.25 +ve Posttest Odds = 0.25 x 16=44/5 = 80% -ve Posttest Odds = 0.25 x 0.211 = 0.0527 0.0527/1.0527 = 0.05 → 5% Cohen's kappa coefficient is a statistic that is used to measure inter-rater reliability for qualitative items.
- 5. Available on Slide share: https://www.slideshare.net/AfzaMalik1/clinical-diagnostic-evaluation-statisticsdocx