1. Documentation for EPSA-HyperStudy Interface Weidlinger Associates, Inc.
Applied Science Division
1
Documentation for EPSA-HyperStudy Interface
This document is intended as a guide for those trying to interface a solver with HyperStudy. It is
intended to provide a conceptual overview of the process. For implementation details, the
reader should refer to the HyperStudy Help Files, which are often well-written and helpful.
Table of Contents:
HyperStudy’s Fundamental Algorithm………………………………………………………………….2
Study Setup……………………………………………………………………………………………….3
Design of Experiments……….……………………………………………………….........................12
Optimization……………………………………………………………………………........................16
Appendix A: Sample Study File………………………………………………………………………..20
August 31, 2005
Adam Cone
cone@wai.com
2. Documentation for EPSA-HyperStudy Interface Weidlinger Associates, Inc.
Applied Science Division
2
HyperStudy’s Fundamental Algorithm
Figure 1: Schematic of HyperStudy’s Fundamental Algorithm
HyperStudy is a tool for repeated, automated calling of a user-specified solver1
and can perform
3 types of studies:
• Design of Experiments (DOE)
• Optimization
• Stochastic2
HyperStudy orchestrates these studies by iterating the following algorithm
a) call solver with particular parameter set
b) analyze the resulting response set
c) call the solver with different parameter set OR end study
1
Blue phrases in this document refer to names and phrases with HyperStudy-specific interpretations. A
phrase with both HyperStudy and non-HyperStudy interpretations will be blue if and only if the
HyperStudy meaning is intended. Appendix A contains a glossary of all blue phrases.
2
I will not deal with Stochastic Studies in this paper.
3. Documentation for EPSA-HyperStudy Interface Weidlinger Associates, Inc.
Applied Science Division
3
Figure 2: Schematic representations of prescribed (left) and dynamic (right) analysis algorithms
There are two types of analysis algorithms: prescribed and dynamic.3
A prescribed analysis
algorithm outputs a parameter set exclusively as a function of iteration: the ‘analysis’ consists
exclusively of storing the responses, and initiating the next solver-call. It references a list of
designs that must be tested, sequentially tests these designs, and concurrently records the
generated responses. When it has tested all the specified designs, the study terminates. A
dynamic analysis algorithm constructs the next parameter set based on the set of responses it
has gathered so far. If you want to know what design a prescribed analysis algorithm will run on
the 6th
iteration, you need only reference the list of designs it references itself. The only way to
know what design a dynamic analysis algorithm will run on the 6th
iteration is to actually run the
algorithm.4
The study types are manifested in the analysis algorithm, and are procedurally disjoint
from the mechanics of solver-calling (see Figure 1). Therefore, the user must configure the
interface between the solver and HyperStudy before any of these studies are carried out (see
Figure 2). This configuration process is called the Study Setup.
Figure 3: Schematic of HyperStudy layout
3
“Prescribed” and “dynamic” are not used in this sense in HyperStudy.
4
A boxer using a prescribed analysis algorithm would decide, before a round started, what sequence of
punches to throw, and would not deviate from that sequence. A boxer using a dynamic analysis algorithm
would choose his next punch based on how his opponent responded to previous punches.
4. Documentation for EPSA-HyperStudy Interface Weidlinger Associates, Inc.
Applied Science Division
4
Study Setup
Conceptually, the Study Setup is the process by which the user configures the solver-calling
algorithm. Figure 3 is a schematic that will be referenced throughout the Study Setup section
to indicate which configuration phases correspond to which conceptual processes.
Figure 4: Schematic representation of information flow in solver-calling routine. Later in the paper,
this figure is referenced as an indicator of where each phase of the Study Setup fits into the
general picture.
The phases of the Study Setup are:
1. Create Studies (data storage algorithm)
2. Create Models (model input formatting)
3. Create DVs (parameter classification)
4. Do Nominal Run (solver-HyperStudy communication protocol)
5. Create Responses (response definition)5
The order is important: the user must complete the nth
phase before proceeding to the (n+1)th
phase. We will review each of these phases, both in general terms and in EPSA-specific terms.
5
The list format is: actual HyperStudy name (descriptive label).
5. Documentation for EPSA-HyperStudy Interface Weidlinger Associates, Inc.
Applied Science Division
5
1. Create Studies (data storage algorithm)
Figure 5: GUI Screen for Create Studies phase of Study Setup
a) create a study file
To use HyperStudy, the user defines various study specifications and characteristics (e.g.
what solver to use, what to optimize over, what the responses are, etc….). Although the user
enters this information via a graphical user interface (GUI), HyperStudy stores the information in
an ASCII-text file called the study file, which has a .stdy extension. You must create such a
study file so that HyperStudy can save and read the study information. Although not functionally
necessary, it is instructive to view the study file in text form by simply opening it as a text file
(See Appendix A for an example of a .stdy file), after you create it. When you save your study,
which you can do in any phase by clicking the disk icon in the upper-left of the HyperStudy
window, the changes are reflected in the study file.
b) define a study directory
During the course of the study, HyperStudy will reference text files, write text files, and
interface with the solver. The study directory is where HyperStudy will seek text files it needs to
reference, store text-files it writes, and look for the solver. For example, the study file is saved in
the study directory. The study is, in a sense, “contained” in the study directory.
2. Create Models (model input formatting)
6. Documentation for EPSA-HyperStudy Interface Weidlinger Associates, Inc.
Applied Science Division
6
Figure 6: GUI Screen for Create Models phase of Study Setup
a) What is a model?
In HyperStudy, a model can be conceptualized as an
algorithm for generating predictions about a specific physical
process. The design in the Figure 6 involves several, quite
diverse physical processes. In order to simulate the behavior
of the apparatus as a whole, we need to simulate all these
processes, each of which may require a different model. For
example, we may want to use a fluid-dynamics solver,
SPLASH, for (G), when water exits the cup, and a projectile-
motion solver, BANG, for (K), when the bullet is fired. Our
study will coordinate all these models to simulate the behavior of the overall design. Often a
study will have only 1 model.
7. Documentation for EPSA-HyperStudy Interface Weidlinger Associates, Inc.
Applied Science Division
7
Figure 7: Illustration of the potential diversity of physical phenomena in a study
6
For each model, the user specifies which solver to use, the solver input, what responses to
record, etc…. We’ll get to these issues later.
b) What is a template?
Solvers in general, and EPSA in particular, input parameters such as temperature,
thickness, shape, etc… that define the specifics of the physical phenomenon they simulate.
These parameters are written in the solver input file, which the solver reads while it performs
calculations. However, the solver can not read these parameters in an arbitrary format. For
example, SOLVER_1 may require the input parameters ambient temperature, beam length, and
elasticity coefficient, in the following format:
-------------------
TEMP 200
LENG 3.01
ELAS 4.00E5
-------------------
If, instead, our text file looked like
-----------------------------------
TEMP LENG ELAS
200 3.01 4.00E5
-----------------------------------
Or like
---------------------------------------------------------------------
Temperature 200 Length 3.01 Elasticity 4.00E5
---------------------------------------------------------------------
then the solver’s data extraction algorithm will syntactically fail, and the solver will not run. The
text file must be in the correct format for the solver to properly interpret the input parameters.
According to www.m-w.com, a template is something that establishes or serves as a
pattern. That is precisely what a HyperStudy template does: it establishes a pattern (in this
6
Cartoon obtained from http://www.coe.berkeley.edu/labnotes/0102history1_big.gif
8. Documentation for EPSA-HyperStudy Interface Weidlinger Associates, Inc.
Applied Science Division
8
case, a format) for the solver input file, the ASCII-text file that HyperStudy will ultimately use as
input to the solver. HyperStudy queries the solver by using the parameters and the user-defined
template to generate a solver input file, which has the format of the template, but with the
parameter values that HyperStudy is testing.
For each parameter set, HyperStudy writes a text file with the appropriate format for the
solver to interpret. The template is a text file with the proper solver-input format, which
HyperStudy references in order to create an operable solver input file. The template also
includes information about which locations in the text file correspond to the parameters the user
plans to vary during the study. This information is included in the text file as Templex7
statements, along with statements about a given parameter’s upper and lower bounds, and its
nominal value (discussed later). Without a template, HyperStudy would not know how to write a
solver input file in the proper format, and could not run the solver. I recommend saving the
template in the study directory, defined in the Create Study phase. For more information on
Templex and templates, see HyperStudy help files: Altair HyperWorks/Templex.
3. Create DVs (parameter classification)
Figure 8: GUI Screen for Create Design Variables phase of Study Setup
Design variables (DVs) are quantities like ambient temperature, air pressure, wheel diameter,
Young’s modulus, etc… that characterize a specific design. They are also referred to as
parameters. There are both controlled parameters (e.g. construction material, thickness of a
plate) and uncontrolled parameters (ambient temperature, gravity). At this stage of the study,
7
Templex is a C-like language internal to HyperWorks.
9. Documentation for EPSA-HyperStudy Interface Weidlinger Associates, Inc.
Applied Science Division
9
the distinction between controlled and uncontrolled parameters is immaterial (although it
becomes important in DOE studies).
There are two ways of describing the HyperStudy perspective of a solver:
Analytical: The solver S is a map from the design space D, the product space of the individual
design variable spaces, to the response space R. S is composed of the set of controlled
parameters CP and the set of uncontrolled parameters UP. In other words:
S: D R
CP U UP = D
CP UP =
Computational: The solver is a function that inputs a file of a particular format in which the
design variables for a given run are specified, and outputs an ASCII-text file containing
quantities that will be used to build responses.
HyperStudy is not concerned with the mechanics of the solver; just its inputs and outputs. The
solver itself is a black box, as far as HyperStudy is concerned.
The design variables were defined in the template, along with some other information.
Namely, for a given design variable X, the template has already defined
a) upper bound
b) lower bound
c) nominal value
The upper and lower bounds are, respectively, the maximum and
minimum values the design variable can attain during the study.
The nominal value is some value in between the upper and lower
bounds (inclusive) that is used for a nominal solver run, or test
run, which we’ll discuss shortly. HyperStudy has this information about each design variable
from the template. There is more to specify, however, about each design variable.
a) real or integer?
If a design variable can only attain integer values (e.g. the number of jellybeans in a jar, the
population of Kenya), select integer from the pull-down menu. Otherwise (e.g. beam length,
angle of intersection), select real.
b) continuous or discrete?
If a design variable can take any value between the upper and lower bounds (inclusive), the
select continuous. If it can only take a discrete subset of the values between the upper and
lower bounds, select discrete. Notice that {integer, continuous} and {real, discrete} are both valid
selections. In the former case, for instance, you could select upper bound = 10, lower bound =
3, so the design variable could be anything in the set {3, 4, 5, 6, 7, 8, 9, 10}. In the latter case,
for instance, you could select, upper bound = 6.5, lower bound = 1.1, and then restrict the levels
to the set {1.1, 1.8, 2.6, 4.0, 6.5}.
c) number of values; value table
If you have designated a design variable as a discrete variable, then you must specify which
values the variable can take. You do this in the value table. For instance, suppose a factory only
makes 3/16in, 1/4in. and 1/2in. thickness plates. Then you would enter 3 in the number of
values field, and 3/16, ¼, and ½, in the value table.
Now that the design variables are specified, we can move onto specifying and running the
solver.
10. Documentation for EPSA-HyperStudy Interface Weidlinger Associates, Inc.
Applied Science Division
10
4. Do Nominal Run (solver-HyperStudy communication protocol)
Figure 9: GUI Screen for Do nominal run phase of Study Setup
Let us recap: what information does HyperStudy have, as of right now?
(a) where to store study settings (study file)
(b) folder all study files should be looked for and saved in (study directory)
(c) a model of the physical phenomenon
(d) what format to use for the solver input (template)
(e) what the design variables are (template, Create Design Variables)
(f) design variable ranges, nominal values, and designations (Create Design Variables)
What information does HyperStudy still require?
(a) solver input file (it isn’t the template)
(b) solver identity/location
(c) solver output format
(d) response-building algorithms
This next phase, Do Nominal Run, directly addresses (a) and
(b), and sets up the answers to (c) and (d).
11. Documentation for EPSA-HyperStudy Interface Weidlinger Associates, Inc.
Applied Science Division
11
(a) For the nominal run, HyperStudy uses the nominal value for each design variable specified
earlier, and the standard template for the model to create a solver input file. The solver input
file is, functionally, the parameter-to-solver delivery device.
Why do a nominal run?
1) To check that the process so far is functional. If the nominal run successfully generates
solver output, the interface is in good shape, though not yet complete. If the nominal run
fails to generate output, something is wrong, and this is a convenient place to stop and
backtrack.
2) If successful, the nominal run produces corresponding nominal solver output. We can
then specify, in a concrete manner, how HyperStudy should use the solver output to
generate responses. I characterize the manner as “concrete” because we could, in theory,
tell HyperStudy what output to expect, and then how to interpret that output. The currently-
implemented method uses actual solver output as a kind of 2nd
template from which to build
actual responses.
b) This may sound like an odd piece of information to be missing at this point, since we
designed the template specifically to be used with our solver, and since we defined our
parameters with the solver in mind. However, we never actually informed HyperStudy which
particular solver we planned to use.
HyperStudy is not concerned with the solver’s exact mechanics, it just knows that the
solver is something that inputs the solver input file and generates solver output files (there are,
in general, multiple files) in formats known to HyperStudy. For interfacing with HyperStudy, the
solver must be in executable (.exe or .bat) format. Furthermore, HyperStudy must recognize the
solver. This is achieved by registering the solver script (see the help file Altair
HyperWorks/HyperStudy/User’s Guide/Using HyperStudy/Customizing HyperStudy/Adding
Solver Scripts to HyperStudy for instructions on how to register a solver script). The solver
output files have a particular format depending on the solver’s particular mechanics. HyperStudy
must be given a protocol for how to interpret the solver output format so that it may extract the
relevant solver output data. There are two ways to go about this:
1) Program an interpretation protocol using Import, a HyperWorks language especially designed
for this purpose. After you program a protocol in Import, you must register the protocol with
HyperStudy. Documentation on Import is slim, but you can find some by going to Help, selecting
Index, and typing “Import Template” in the field. My experience was that Import was limited,
difficult to use, and came with too little documentation.
2) HyperStudy is pre-programmed with several solver-output-
file-interpretation protocols, which it attempts to use until it finds
one that is syntactically appropriate, or until it is out of protocols
(in which case the data extraction process will fail). One of these
protocols just reads numbers separated by newlines, and
constructs a vector out of them. Therefore, if you can somehow
make your solver output in this form, this pre-programmed
protocol will properly interpret the output for HyperStudy.
Although the solver may be just one .exe file (e.g.
epsa_hull.exe), you can make the solver that HyperStudy deals with a .bat file that calls the
actual solver. To distinguish between the actual solver and the solver-like object that actually
HyperStudy deals with, denote the former the executable solver the former the batch solver.8
In
8
“Solver”, in blue refers to the batch solver.
12. Documentation for EPSA-HyperStudy Interface Weidlinger Associates, Inc.
Applied Science Division
12
the batch solver you can include several C or Fortran scripts that transform the executable
solver output into a sequence of numbers separated by spaces, tabs, and/or newlines. These
scripts are called post-processing scripts. A typical batch solver might look like this:
Executable_solver.exe
Post-processing_1.exe
Post-processting_2.exe
…
Post-processing_n.exe
This batch solver can write a single batch solver output file, which HyperStudy would consider
just the solver output file, since it will not distinguish between the executable solver and the
batch solver. The batch solver output file can be interpreted by one of the pre-programmed
protocols. This approach obviates the need to write new interpretation protocols in Import.
Once all these issues are addressed, we are ready to perform the nominal run. To do this, click
Write/Execute. This runs the (batch) solver with the nominal values, and generates the solver
output file, whose name and location will be determined either by the executable solver or the
post-processing scripts.
5. Create Responses (response definition)
Figure 10: GUI Screen for Create Responses phase of Study Setup
13. Documentation for EPSA-HyperStudy Interface Weidlinger Associates, Inc.
Applied Science Division
13
What are responses? Suppose you are modeling the dynamics of a falling stone, you are
interested in the stone’s kinetic energy in the final time-step and your solver computes the initial
stone velocity and force on the stone at each time-step. The output file contains the force at
each time-step, but the quantity of interest, the response, requires further computation. You
must provide an algorithm for HyperStudy to compute this response from quantities found in the
solver output file. As it reads the solver output file, HyperStudy constructs a vector of output
values. It is from these output values that the responses are built. For information on how to
build responses from the solver output values vector, refer to Altair
HyperWorks/HyperStudy/User’s Guide/Using HyperStudy/Study Setup/Create Responses.
When these phases are successfully completed, the EPSA-HyperStudy interface is configured
and you can begin one of the 3 types of study.
Design of Experiments
Suppose that
• you want to perform an optimization over a 10-dimensional design space
• each design variable has 10 levels
• your solver takes 1 day for each run
Evaluating the response function for every design would take over 27 million years. Even
evaluating 30 designs would take a month, but represents less than 1.2*10-6
of the total design
space. The optimization looks hopeless. However, what if we know that only changes in 2 of the
design variables actually have a “significant”9
effect on the response function? If we disregard
the other 8 dimensions, our design space shrinks from 10 billion designs, to 100 designs, which
we can test 10% of in just 10 days. Suddenly, this optimization seems reasonable. Such a
dimension-reduction method seems unlikely, because, in order to claim that variations in a
design variable are insignificant, you need the full response surface, which, in the above case,
takes over 27 million years to obtain – hardly a time-saver. A Design of Experiments (DOE)
study can suggest such dimension reductions without computing the entire response surface.
The more specific goal of DOE is to determine the “sensitivity” of a given response to
changes in each design variable (to each dimension of the design space). These “sensitivities”
are computed based on a specific formula, of course, but nowhere did I see the formula
explicitly stated; I had to derive it myself.
Suppose we have a a response R that is a function of n design variables D1,…,Dn. Let Dj
have Nj levels (in ascending order), and let Dj(A) be the Ath
level of the design variable Dj. Let
1≤k≤ n. Consider the quantity
[k,B] = [N1*…*Nk-1*Nk+1*…*Nn]-1
R(D1(A1),…, Dk-1(Ak-1), Dk(B), Dk+1(Ak+1),…,Dn(An)),
where 1 ≤ B ≤ Nk, and the sum is taken over all 1 ≤ Aj ≤ Nj.
9
Phrases in quotes are not precisely defined.
14. Documentation for EPSA-HyperStudy Interface Weidlinger Associates, Inc.
Applied Science Division
14
Figure 11: “Sensitivity” of a response R to Dn; “insensitivity” to Dk.
[k,B] is a response average over all the designs at level B in dimension k. For each k,
this is a function of B, and we can represent it graphically. Functionally, we have collapsed an n-
dimensional domain (the design space) to a 1-dimensional domain by averaging over n-1
dimensions. I have never seen “sensitivity” precisely defined, but my impression is that the
“sensitivity” of R on the kth
design variable is related to the “variation” of [k,·]. The more [k,·]
“varies” over the collapsed domain, the more “sensitive” R is to changes in the kth
design
variable. If [k,·] is “nearly constant” on the domain, then R is “insensitive” to changes in the kth
design variable, and DOE suggests that it can be held constant in optimization (Figure 11).
There is another twist to this issue. Ethanol combustion in oxygen has the molar ratio
1:3. That is, every mole of ethanol requires 3 moles of oxygen to fully combust.
Ethanol (moles) Oxygen (moles) Combustion Energy (kJ)
1 3 1235.0
2 3 1235.0
1 6 1235.0
2 6 2470.0
Figure 12: Table of ethanol-oxygen combustion energy.
Based on the first three rows of Figure 12, a DOE analysis suggests that combustion energy is
insensitive to both the ethanol quantity and oxygen quantity. This is because, based on the first
three rows, changing either of these quantities does not effect the combustion energy. In fact,
such a DOE study would suggest ignoring these design variables. However, the 4th
row
indicates that, when both ethanol and oxygen quantities are increased simultaneously, an
increase in combustion energy is observed. In DOE terminology, this phenomenon is called an
interaction. Interactions between some set of variables occur when changing the design
15. Documentation for EPSA-HyperStudy Interface Weidlinger Associates, Inc.
Applied Science Division
15
variables simultaneously results in a different response value than what is suggested by
changing them individually. Therefore, oxygen and ethanol cannot be ignored, since their
interaction is significant. A full DOE study accounts for both individual and interaction
sensitivities, and does not suggest that a design variable is ignored unless it does not contribute
to any significant interactions. Any combination of design variables can interact. An nth
-degree
interaction involves n different design variables.10
2nd
-degree interactions are graphically
represented by plotting the response vs. one of the design variables, when the other design
variable is held constant. This is done for multiple values of the first design variable (Figure 13).
If the gradients of each of these plots are similar, then the two design variables do not interact.
If, however, the gradients of the plots differ significantly, the two design variables do interact.
Figure 13: R is a response. D1 and D2 interact; D1 and D3 do not.
For example, plotting our ethanol-oxygen combustion data confirms that these two design
variables do indeed interact (Figure 13), since the two functions have different gradients.
Figure 14: Combustion Energy vs. Oxygen for two different Ethanol quantities
10
Note that an individual sensitivity is a 1
st
-degree interaction.
16. Documentation for EPSA-HyperStudy Interface Weidlinger Associates, Inc.
Applied Science Division
16
Since “sensitivity”, “variation”, and “nearly constant” are not precisely defined, there
appears to be little content in the above analysis. DOE can only suggest what design variables
to discount from an optimization. The response surface is required to obtain certainty.
Computing the response surface, however, obviates the need for any dimension reduction
methods. So if it’s certainty about a dimension reduction method that you’re after, you’re in a
catch 22.
Recall that the Study Setup was designed to configure the solver-calling algorithm
(Figure 1). This algorithm inputs parameters and outputs responses based on the solver. Recall
also that different DOE, Optimization, and Stochastic studies result in different analysis
algorithms, which input responses and either a) output parameters, or b) end the study. DOE
analysis is prescribed, not dynamic: outputted parameters for each iteration of HyperStudy’s
Fundamental Algorithm are specified before the study even begins. They are chosen based on
which “sensitivities” the user wants to investigate. There are several methods of choosing
designs for a DOE study, which are described in Altair HyperWorks/HyperStudy/User’s
Guide/Design of Experiments. The general idea is to minimize the number of designs necessary
to convincingly investigate dimension-reduction schemes.
Optimization
Suppose we have a particular response defined on a given design space, and we want
to find the design that minimizes (or maximizes) this response. This is called an optimization
problem, and the response to be minimized is called the optimization’s objective function.
Sometimes only designs meeting a set of certain conditions, called constraints, are acceptable,
and the search is only performed over the designs that comply with this constraint. The space of
such designs is called the feasible design space, and such the problem is called a constrained
optimization problem.
With a finite feasible design space (a finite number of designs to choose from), the best
approach is to evaluate the objective function for each feasible design, and choose the feasible
design that yields the smallest objective function value. This approach is often impractical
because the required time to test all feasible designs is too long. It can be literally impossible to
minimize the objective function if there are an infinite number of feasible designs, which can
happen if one of the design variables is a continuous quantity (e.g. thickness). If we do not
evaluate every feasible design in the feasible design space, we cannot claim to have truly
minimized the objective function. Therefore, the practical goal of most constrained optimizations
is to find the smallest objective function value possible with the computational resources
available.
17. Documentation for EPSA-HyperStudy Interface Weidlinger Associates, Inc.
Applied Science Division
17
Figure 15: A response surface with computed designs (light blue) shown. The absolute minimum
objective function is achieved at a design that has not been computed (red). Is the obtained
minimum (circled) “good enough”?
Ideally, this obtained, practical minimum is close to the actual, absolute minimum. The
quintessential optimization conundrum is this: since the actual minimum is unknown, how can
we characterize any feasible design as “acceptable”? In other words, how can we determine
whether a given feasible design is “good enough”, or whether there is a “much” smaller
minimum in the feasible design space? Many optimization algorithms employ a convergence
test to answer this question. These optimization algorithms are dynamic, and attempt to
generate each new design so that it yields a smaller objective function value than its
predecessor. As long as there are “significant” decreases in objective function values, the
algorithm assumes there’s a “much” better design out there, and continues to search the design
space. When the objective function differences between consecutive designs become
“insignificant”, however, the algorithm assumes that there are not “significantly” better designs in
the design space, and terminates. The method of generating improving designs, and the precise
interpretations of “acceptable”, “good enough”, “significant”, and “much” are what distinguish
optimization schemes.
HyperStudy gives the user 3 optimization options:
• Sequential Response Surface Method
• Method of Feasible Directions
• user-defined optimization scheme
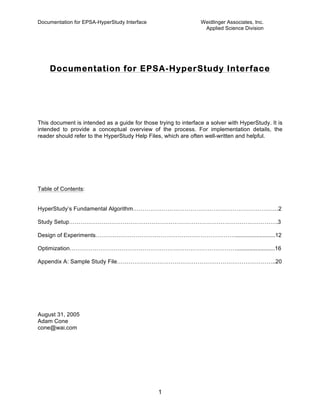
Sequential Response Surface Method
The Sequential Response Surface Method (SRSM) involves generating successive
approximations to the response surface, and basing the next design on the minimum of that
approximation (Figure 16). The approximation is a multi-dimensional 2nd
-degree polynomial
whose coefficients are determined using a least-squares approximation.
18. Documentation for EPSA-HyperStudy Interface Weidlinger Associates, Inc.
Applied Science Division
18
Figure 16: Schematic of sequential surface response analysis algorithm
Method of Feasible Directions
Figure 17: MFD schematic. The center of the intersecting arrows is the previously tested design.
This is the reference point from which the new search begins.
19. Documentation for EPSA-HyperStudy Interface Weidlinger Associates, Inc.
Applied Science Division
19
The Method of Feasible Directions (MFD) uses a more geometric approach to find the next
design. From the last tested design, the analysis algorithm asks “Where, in the phase space,
should I go next?” It breaks this question down into 2 subquestions:
• What direction should I move in?
• How far should I go in that direction?
Based on collected response data, the algorithm computes which direction is most likely to yield
smaller objective function values. Once it has determined this direction, it performs a line search
to determine how far to move in that direction (Figure 17). In this manner, MFD explores the
design space until it converges on a particular design.
User-Defined Optimization
The user can also specify an optimization algorithm. This algorithm will determine:
• What design to start with
• How to explore the design space
• When to stop the optimization
Figure 18: Anthropomorphized schematic of user-defined optimization
HyperOpt translates instructions from the optimization algorithm to the solver-calling algorithm,
and translates results from the solver-calling algorithm back to the optimization algorithm. See
the help files for details on how to write and register your own optimization algorithm