Weekly Projects Update - w/e 7th April
•
1 like•682 views

AcuComm's weekly projects update - w/e 7th April. For more information on our latest projects, head here.. http://ow.ly/10ru2H

Recommended
Recommended
More Related Content
More from AcuComm
More from AcuComm (20)
Recently uploaded
Recently uploaded (20)
Weekly Projects Update - w/e 7th April
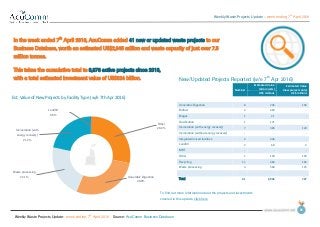
- 1. Weekly Waste Projects Update – week ending 7 th April 2016 Weekly Waste Projects Update: week ending 7 th April 2016 Source: AcuComm Business Database 01 New/Updated Projects Reported (w/e 7th Apr 2016) Number Estimated Value (all projects) Estimated Value (new projects only) US$ millionsUS$ millions Anaerobic Digestion 8 236 158 Biofuel 4 418 - Biogas 1 21 - Gasification 1 171 - Incineration (with energy recovery) 7 383 120 Incineration (without energy recovery) - - - Integrated/mixed facilities 2 436 - Landfill 3 68 3 MBT - - - Other 1 159 159 Recycling 11 484 163 Waste processing 3 569 125 Total 41 2,945 727 In the week ended 7th April 2016, AcuComm added 41 new or updated waste projects to our Business Database, worth an estimated US$2,945 million and waste capacity of just over 7.5 million tonnes. This takes the cumulative total to 3,976 active projects since 2013, with a total estimated investment value of US$324 billion. Other 28.2% Anaerobic Digestion 28.0% Waste processing 22.1% Incineration (with energy recovery) 21.2% Landfill 0.5% Est. Value of New Projects by Facility Type (w/e 7th Apr 2016) To find out more information about the projects and investments covered in this update, click here
- 2. Weekly Waste Projects Update – week ending 7 th April 2016 Weekly Waste Projects Update: week ending 7 th April 2016 Source: AcuComm Business Database 02 New/Updated Projects Reported (w/e 7th Apr 2016) Number Capacity (tonnes) MW Anaerobic Digestion 8 645,136 26 Biofuel 4 2,862,709 215 Biogas 1 28,800 3 Gasification 1 150,000 15 Incineration (with energy recovery) 7 1,349,128 187 Incineration (without energy recovery) - - - Integrated/mixed facilities 2 390,275 179 Landfill 3 717,901 22 MBT - - - Other 1 - 34 Recycling 11 1,011,160 0 Waste processing 3 356,779 - Total 41 7,511,887 681 The total estimated waste capacity of projects reported on in the past week is just over 7.5 million tonnes. Biofuel was the largest category, accounting for just under 2.9 million tonnes. The total estimated power generation from these projects was 681 MW. Biofuel was the largest category, accounting for 215 MW. Biofuel 38.1% Incineration (with energy recovery) 18.0% Recycling 13.5% Others 30.5% Reported Capacity of Projects by Facility Type (w/e 7th Apr 2016) To find out more information about the projects and investments covered in this update, click here
- 3. Weekly Waste Projects Update – week ending 7 th April 2016 Weekly Waste Projects Update: week ending 7 th April 2016 Source: AcuComm Business Database 03 New Projects Reported by Waste Types (w/e 7th Apr 2016) Number Capacity (tonnes) MW Animal 3 66,536 8 Clinical - - - Construction/Demolition - - - e-Waste - - - Food 2 214,784 8 Gas 2 - 56 Glass 1 124,518 - Hazardous - - - Heat 3 411,788 0 Industrial 2 281,064 15 Metals - - - MSW 10 1,735,730 83 Oil 1 45,652 - Organic (general/unspecified) 3 477,570 70 Other 1 40,000 - Paper 1 55,503 - Plant biomass (non-waste) 1 748,324 33 Plant biomass (waste) 6 2,771,354 245 Plastics - - - Radioactive 1 267 - Rubber - - - Sewage/wastewater 3 276,271 4 Wood 1 262,525 160 Total 41 7,511,887 681 Plant biomass and Municipal Solid Waste were the leading feedstocks in the past week, accounting for 2.8 million tonnes and 1.7 million tonnes respectively. Plant biomass (waste) 36.9% MSW 23.1% Plant biomass (non- waste) 10.0% Others 30.0% Reported Capacity of Projects by Waste Type (w/e 7th Apr 2016) To find out more information about the projects and investments covered in this update, click here
- 4. Weekly Waste Projects Update – week ending 7 th April 2016 Weekly Waste Projects Update: week ending 7 th April 2016 Source: AcuComm Business Database 04 New/Updated Projects, Country Coverage, (w/e 7th Apr 2016) Projects USA 12 UK 7 France 3 China 2 Germany 2 India 2 Others 13 Total 41 The leading countries in the past week were the USA with 12 projects, and the UK with seven. 12 7 3 2 2 2 13 0 2 4 6 8 10 12 14 USA UK France China Germany India Others Reported Projects by Country (w/e 7th Apr 2016) To find out more information about the projects and investments covered in this update, click here
- 5. Weekly Waste Projects Update – week ending 7 th April 2016 Weekly Waste Projects Update: week ending 7 th April 2016 Source: AcuComm Business Database 05 Average Project Values by Facility Type US$ millions Anaerobic Digestion 23 Biofuel 122 Biogas 27 Gasification 157 Incineration (with energy recovery) 106 Incineration (without energy recovery) 67 Integrated/mixed facilities 183 Landfill 22 MBT 67 Other 247 Recycling 26 Waste processing 68 All Projects 81 Average Project Values by Feedstock Type US$ millions Animal 18 Clinical 34 Construction/Demolition 9 e-Waste 26 Food 18 Gas 177 Glass 14 Hazardous 83 Heat 25 Industrial 99 Metals 42 MSW 93 Oil 49 Organic (general/unspecified) 82 Other 71 Paper 84 Plant biomass (non-waste) 105 Plant biomass (waste) 79 Plastics 21 Radioactive 564 Rubber 38 Sewage/wastewater 43 Wood 86 All Projects 81 The average active waste project is worth US$81 million. There are naturally wide variations in average project value, due to the size, duration and complexity of different types of project. The figures on this page represent our latest estimates, based on data from 2013 to the current week. To find out more information about the projects and investments covered in this update, click here
- 6. Weekly Waste Projects Update – week ending 7 th April 2016 Weekly Waste Projects Update: week ending 7 th April 2016 Source: AcuComm Business Database 06 Top Five Projects, week ending 7th April 2016, by Estimated Value (US$ millions) Click the flag for more information on each project 1 USA 444 Construction of the world’s largest radioactive waste treatment plant. 2 Sweden 433 Development of a biomass and anaerobic digestion complex. 3 USA 260 Construction of a paper recycling plant. 4 UK 171 Construction of WtE gasification plant. 5 Finland 159 Construction of a waste gas-to-sulphuric acid plant. Top Five Projects, week ending 7th April 2016, by Reported Waste Capacity (tonnes) 1 China 324,500 Construction of a 30 MW biomass plant. 2 China 265,800 Construction of a 30 MW biomass plant. 3 UK 160,000 Construction of an AD plant supplied by food waste. 4 UK 150,000 Construction of WtE gasification plant. 5 India 127,750 Development of 350 tpd waste management facility. Top Five Projects, week ending 7th April 2016, by Reported Power Generation (MW) 1 Sweden 160 Development of a biomass and anaerobic digestion complex. 2 China 30 Construction of a 30 MW biomass plant. 3 China 30 Construction of a 30 MW biomass plant. 4 USA 22 Construction of a renewable energy plant at a landfill. 5 UK 15 Construction of WtE gasification plant.