
Recommended
Recommended
More Related Content
Similar to Assessing Ethiopia's potential for groundwater irrigation
Similar to Assessing Ethiopia's potential for groundwater irrigation (20)
More from AbdirahmanJibril4
Recently uploaded
Recently uploaded (20)
Assessing Ethiopia's potential for groundwater irrigation
- 1. Assessing potential land suitable for surface irrigation using groundwater in Ethiopia Abeyou W. Worqlul a, * , Jaehak Jeong a , Yihun T. Dile b , Javier Osorio a , Petra Schmitter c , Thomas Gerik a , R. Srinivasan b , Neville Clark d a Texas AgriLife Research, Temple, TX, USA b Texas A&M University, College Station, TX, USA c The International Water Management Institute, Nile Basin and East Africa Office, Addis Ababa, Ethiopia d The Norman Borlaug Institute for International Agriculture, Texas A&M AgriLife Research, College Station, TX, USA a r t i c l e i n f o Article history: Received 2 November 2016 Received in revised form 3 May 2017 Accepted 23 May 2017 Available online 29 May 2017 Keywords: Land suitability Borehole yield Groundwater Groundwater depth Multi-criteria Ethiopia a b s t r a c t Although Ethiopia has abundant land for irrigation, only a fraction of its potential land is being utilized. This study evaluates suitability of lands for irrigation using groundwater in Ethiopia using GIS-based Multi-Criteria Evaluation (MCE) techniques in order to enhance the country's agricultural industry. Key factors that significantly affect irrigation suitability evaluated in this study include physical land features (land use, soil, and slope), climate (rainfall and evapotranspiration), and market access (prox- imity to roads and access to market). These factors were weighted using a pair-wise comparison matrix, then reclassified and overlaid to identify suitable areas for groundwater irrigation using a 1-km grid. Groundwater data from the British Geological Survey were used to estimate the groundwater potential, which indicates the corresponding irrigation potential for major crops. Results indicated that more than 6 million ha of land are suitable for irrigation in Ethiopia. A large portion of the irrigable land is located in the Abbay, Rift Valley, Omo Ghibe, and Awash River basins. These basins have access to shallow groundwater (i.e., depth of groundwater less than 20 m from the surface) making it easier to extract. The comparison between available groundwater and total crop water requirements indicate that ground- water alone may not be sufficient to supply all suitable land. The study estimates that only 8% of the suitable land can be irrigated with the available shallow groundwater. However, groundwater is a viable option for supplementing surface water resources for irrigation in several basins in the country. Published by Elsevier Ltd. This is an open access article under the CC BY-NC-ND license (http:// creativecommons.org/licenses/by-nc-nd/4.0/). 1. Introduction Agriculture plays a key role in the economies of most African countries (IFAD, 2011). For example, Ethiopia's agricultural sector employs about 80% of the labor force on a formal and informal basis, and accounts for approximately 45e50% of the gross do- mestic product (GDP) and 85% of export earnings (Araya & Stroosnijder, 2011; Berry, 2003; Bewket & Conway, 2007; Worqlul, Collick, Rossiter, Langan, & Steenhuis, 2015). However, the agriculture industry in Ethiopia is traditionally subsistence based and rainfed, which frequently suffers from rainfall variability (Seleshi & Camberlin, 2006). Rainfall variability compounded with lack of appropriate soil fertility management contribute to lower crop yield. For example, the country receives 70e90% of its rainfall in a short rainfall season, mainly from June to September. Moreover, approximately 90e95% of the total annual food production in the country is produced during the rainy season (Funk et al., 2003; Mario, James, & Prisca, 2010). Reliance on rainfed agriculture sys- tems contributes to major food shortages throughout the country (Pankhurst & Johnson, 1988). Various studies (Awulachew et al., 2007; You et al., 2011) have indicated that the country has a large potential of arable land. However, less than 5% of this potential is irrigated, due to lack of water storage facilities and infrastructure systems (e.g., pumps, water conveyance structures, etc.). Recently, the agriculture sector has received a particular emphasis to transition towards a more comprehensive agricultural production system known as Agricul- ture Development Led Industrialization. Use of irrigation could substantially transform the agriculture sector, which is currently * Corresponding author. Tel.: þ1 254 774 6020. E-mail address: abeyou_wale@yahoo.com (A.W. Worqlul). Contents lists available at ScienceDirect Applied Geography journal homepage: www.elsevier.com/locate/apgeog http://dx.doi.org/10.1016/j.apgeog.2017.05.010 0143-6228/Published by Elsevier Ltd. This is an open access article under the CC BY-NC-ND license (http://creativecommons.org/licenses/by-nc-nd/4.0/). Applied Geography 85 (2017) 1e13
- 2. dominated by single cropping rainfed crops (Awulachew & Ayana, 2011). The Ethiopian Ministry of Water Resources MoWR (1999) and Awulachew et al. (2007) reported that the country has significant surface water potential from its twelve major river basins, but there is high spatial and temporal variability (Worqlul et al., 2015). Although there is no detailed study on groundwater resources potential in Ethiopia, a recent study by MacDonald, Bonsor, Dochartaigh, and Taylor (2012) indicates that Africa has substan- tial groundwater storage. They estimate that the annual ground- water storage in Africa has 100 times more than the annual renewable freshwater resources. As Ethiopia is described as the “water-tower” of Africa (Birkett, Murtugudde, & Allan, 1999; Hammond, 2013; Swain, 1997), it may be fair to assume that Ethiopia may have the lion's share of this groundwater potential. Groundwater will remain the ultimate source of freshwater while surface water sources has been depleted. Groundwater is more suitable for irrigation than surface water since it has a slow response to climate variability and requires less treatment (Siebert et al., 2010). Much progress is achieved in using groundwater for cultivation in Asia (Siebert et al. (2010). Use of groundwater for irrigation has significantly affected agricultural growth in Asia, for example, especially after the green revolution. Groundwater played a critical role to support the agriculture industry (Altchenko & Villholth, 2014; Giordano, 2006). However, in Africa groundwater is less utilized resource. For example, in Ethiopia, groundwater is not adequately used due to higher development and operational cost and lack of understanding of the resource dynamics (Awulachew, Erkossa, & Namara, 2010). The groundwater in Ethiopia is mainly used for domestic water use. There may be limited cases where the groundwater is used for irrigation and other purposes. Despite some gross estimates (MoWR, 1999) and large-scale assessments of groundwater irrigation potential (MacDonald et al., 2012), there is little quantitative study on the groundwater resource potential for irrigation and other none do- mestic water uses. The aim of this study is, therefore, to estimate the potential suitable land for groundwater irrigation using a multi- criteria evaluation technique in a GIS environment. Several studies have applied multi-criteria evaluation method for various applications including; potential land suitability map- ping for irrigation using groundwater (Adhikary, Chandrasekharan, Trivedi, & Dash, 2015; Jha, Chowdary, & Chowdhury, 2010; Latinopoulos, Theodossiou, & Latinopoulos, 2011), irrigation area suitability mapping using surface water (Akıncı, € Ozalp, & Turgut, 2013; Worqlul et al., 2015), to identify solid waste disposal site (Ceballos-Silva & Lopez-Blanco, 2003; Şener, Şener, Nas, & Kar- agüzel, 2010), mapping of erosion-prone areas (Assefa et al., 2015; Rahman, Shi, & Chongfa, 2009; Setegn, Srinivasan, Dargahi, & Melesse, 2009), and for financial decision-making (Steuer & Na, 2003). Multi-criteria evaluation approach combines several fac- tors to form a single indexed output. There are a number methods of combining factors which includes weighted linear combination (Miller, Collins, Steiner, & Cook, 1998), analytical network process (ANP) (Gencer & Gürpinar, 2007), multi-attribute utility theory (MAUT), weighted sum model (WSM) and analytical hierarchy process (AHP) (Saaty & Erdener, 1979; Saaty, 2008). This study applied the AHP method, which is widely used in the area of water resource management (Y. Chen, Yu, & Khan, 2010; Mendas & Delali, 2012; Steuer & Na, 2003). 2. Materials and methods 2.1. Study area This study was carried out in the Federal Democratic Republic of Ethiopia, which is located between 3000 to 15000 N and 32000 to 4800’ E in the eastern part of Africa (Fig. 1). The country has the second largest population in Africa after Nigeria, and is the most populated landlocked country in the world with a total area of 1.1 million km2 . The elevation of the study site ranges from 160 to 4530 m (i.e., meters above mean sea level); approximately 35% of the country is considered as a highland located at an altitude of 1500 m or above. Rainfall in Ethiopia is highly variable (Seleshi Camberlin, 2005). Generally, there are three climate seasons in Ethiopia. These include Kremt, which is the main rainfall season from June to August; Belg, which is the small rainfall season from September to November; and Bega, which is the dry season from December through May. The highland receives moderate annual rainfall of about 1200 mm with minimal temperature variation, while the lowland (e.g., in the Afar and Somali region) receives an annual rainfall of less than 500 mm with a much greater temper- ature variation. 2.2. Factors used to map land suitability for irrigation Factors that affect the suitability of an area for surface irrigation were identified based on literature and expert opinion (Akıncı et al., 2013; Y.; Chen et al., 2010; Mendas Delali, 2012; Worqlul et al., 2015). Studied factors include biophysical (e.g., climate, soil char- acteristics, land use type, and topography) and socio-economic (e.g., market access such as proximity to a road and population density). Table 1 presents studied factors including the source of the data and their respective spatial resolutions. 2.2.1. Rainfall deficit Climate factors such as rainfall and potential evapotranspiration are among the crucial factors that affect the suitability of an area for irrigation. Rainfall data from 509 weather stations (Fig. 1) were obtained from the Ethiopian National Meteorological Services Agency (ENMSA) for the period 2000 to 2010. ENMSA has divided the country into eight homogenous rainfall regimes (Diro, Grimes, Black, O'Neill, Pardo-Iguzquiza, 2009; Gissila, Black, Grimes, Slingo, 2004; Korecha Sorteberg, 2013). The classification was based on typical rain producing system affecting the regional sys- tem in terms of spatial and temporal rainfall distribution. The lowland area, northern half and northeastern, receives small amount of rainfall with small rainfall variability. The long-term monthly rainfall data was aggregated to annual. The annual rain- fall was interpolated using the Inverse Distance Weighting inter- polation (IDW) method using standard neighborhood to estimate the spatial rainfall in the country (Fig. 2a). The interpolation pro- vided spatial rainfall at 1 km resolution. Potential and actual evapotranspiration data were collected from MODIS global evapo- transpiration (ET) products (Mu, Zhao, Running, 2011). The MODIS ET dataset covers the period from 2000 to 2010 at an 8-day time step with a 1 km by 1 km resolution. The long-term average annual potential evapotranspiration was estimated by aggregating the 8-day MODIS ET (Fig. 2b). 2.2.2. Soil Soil is a key factor in determining the suitability of an area for agriculture in general and irrigation in particular as is discussed in section 2.3.1. The soil data was obtained from the Africa Soil In- formation System (AfSIS, Vågen, et al., 2010). The AfSIS dataset was developed to bridge the soil information gap in Africa by collecting soil samples for over 28,000 locations distributed in 40 African countries from 2008 to 2014 (Hengl et al., 2015). The AfSIS soil data has a 250 m by 250 resolution for six layers (i.e., 0e5 cm, 5e15 cm, 15e30 cm, 30e60 cm, 60e100 cm and 100e200 cm); each layer contains soil texture, organic carbon content, bulk density and A.W. Worqlul et al. / Applied Geography 85 (2017) 1e13 2
- 3. drainage class. The soil texture of the five layers representing the maximum root depth of the major crops growing in the area (100 cm) were aggregated by weighted average and the soil texture was classified into twelve classes (Fig. 2c) using the USDA soil texture classification method. The soil classification resulted in ten soil classes for Ethiopia. 2.2.3. Land use Land use data helps to identify the productivity of an area for irrigation. This study combines the land use data from FAO Geo- Network (Bai, Dent, Olsson, Schaepman, 2008) with the Spatial Production Allocation Model (SPAM) (HarvestChoice, 2014) crop distribution database. The FAO GeoNetwork is a global land use map (Land Use Systems of the world (LUS) Version 1.1) which was developed by combining more than ten global datasets. FAO land use data has a spatial resolution of 10 km (Fig. 2d). The SPAM dataset has a spatial resolution of 1 km and presents detailed crop production and area of cultivation information pixel by pixel. The SPAM database dealt only agricultural land use types and was developed by combining national, district or country-level agri- cultural information. The FAO land use data was combined with the SPAM dataset to disaggregate the generic agricultural land use into different spatially explicit crop types. The final land use map was produced at 1 km resolution. Fig. 1. Map of Ethiopia showing lakes, major river basins, and rainfall stations with a background digital elevation model of 30 m resolution. Table 1 Factors considered for the land suitability analysis including their source and spatial resolution. Data Source Spatial resolution (m) Land use Land use Database of the World (LADA) from Food and Agriculture Organization (FAO), 2010 10,000 Land use Spatial Production Allocation Model (SPAM), 2014 1000 Soil Africa Soil Information Service (AfSIS), 2015 250 Digital Elevation Model (DEM) Enhanced Shuttle Land Elevation Data from the United States Geological Survey (USGS), 2000, released in 2015 30 Population density Global Gridded Population Database, 2000 1000 Road network Ethiopian Road Authority (ERA), 2006 e MODIS potential evaporation (mm) MOD16 Global Terrestrial Evapotranspiration Data Set (2000e2010) 1000 Rainfall (mm/year) Ethiopian National Meteorological Agency (ENMA) from 2000 to 2010 e Groundwater depth (m) British Geological Survey (BGS), 2012 5000 Potential borehole yield (l/s) British Geological Survey (BGS), 2012 5000 Groundwater storage (mm) British Geological Survey (BGS), 2012 5000 Groundwater recharge (mm/year) Ethiopian agricultural transformation agency (ATA), 2013 e A.W. Worqlul et al. / Applied Geography 85 (2017) 1e13 3
- 4. 2.2.4. Slope Slope of the land affects the suitability of an area in terms of land preparation for irrigation and irrigation operation. The slope of the land was estimated using 30 m resolution Digital Elevation Model (DEM) data from the Shuttle Radar Topography Mission (SRTM, http://www2.jpl.nasa.gov/srtm/cbanddataproducts.html) (Fig. 3a). Voids of the 30 m DEM were filled using the predecessor e 90 m SRTM DEM data (Jarvis, Reuter, Nelson, Guevara, 2008). 2.2.5. Population density Implementation of irrigation requires access to the market to purchase agricultural inputs and to sell agricultural outputs. Access to market was represented by population density and distance to major paved roads. The population density for the year 2000 was collected from Global Gridded Population Database from the Center for International Earth Science Network (CIESIN) at Columbia University and International Center for Tropical Agriculture (CIAT) (CIAT, 2005). The population density map indicated that over 85% of the Ethiopian population live in the highlands, which accounts for 35% of the Ethiopian landmass (Fig. 3b). 2.2.6. Road proximity Road proximity is another factor that represents market access. Vector data showing asphalt and gravel road network for the entire country was collected from the Ethiopian Road Authority (ERA) (Fig. 3c). A distance map from asphalt and gravel road was calcu- lated using Euclidean distance at 1 km grid. 2.2.7. Groundwater depth and yield Groundwater is a potential resource for irrigation in Ethiopia. This study used groundwater data from the British Geological Survey (BGS) and Ethiopian Agricultural Transformation Agency (ATA) to assess the potential irrigable land using groundwater. The BGS published the first quantitative maps that show potential borehole yield and groundwater depth data at a spatial resolution of 5 km for the entire continent of Africa (MacDonald et al., 2012). They used existing hydrogeological maps, literature and publicly available data to estimate the total groundwater storage and po- tential yield of boreholes. Fig. 3d presents the total groundwater storage of Ethiopia. The Ethiopian Agricultural Transformation Agency (ATA) in collaboration with the Radar Technologies Inter- national (RTI) and Addis Ababa University studied the groundwater recharge of the central part of Ethiopia using remote sensing and field measurements. Their study focused on 39 woredas (districts) in the Oromia and Southern Nations and Nationalities and People's (SNNP) region. The groundwater recharge data from the Ethiopian ATA was used to validate the contented scale potential borehole yield estimate from BGS using root mean square error as a perfor- mance statistics. Fig. 2. Factors used to assess the land suitability for irrigation using groundwater. a) long-term annual average rainfall (mm) for the period 2000 to 2010, b) long-term average potential evapotranspiration (mm) for the period 2000 to 2010, c) soil texture, d) land use. A.W. Worqlul et al. / Applied Geography 85 (2017) 1e13 4
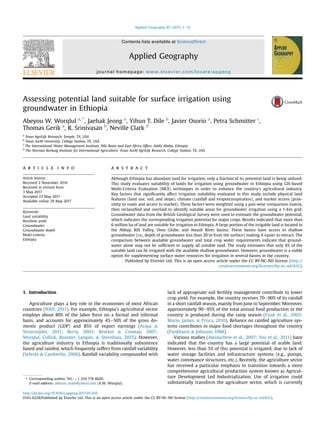
- 5. 2.3. Framework of suitability mapping The potential land areas suitable for irrigation were identified using a GIS-based Multi-Criteria Evaluation (MCE) technique. The multi-criteria evaluation was implemented in a GIS environment to combine several criteria to make a single indexed output (Y. Chen et al., 2010; Pohekar Ramachandran, 2004). The available groundwater was quantified based on data from the British Geological Survey. The land suitable for surface irrigation was determined by assigning weights to the factors that affect the irrigation potential of a certain land. The factors were weighted, reclassified and overlaid to identify the most suitable areas for surface irrigation. Since the factors used for the analysis have different spatial resolution, the overlay analysis of land suitability was accomplished by resampling all the data to a 30 m resolution. The method used for the resampling is called nearest neighbor method, where the new pixels preserve the original values. The framework for the land suitability analysis using groundwater is presented as in Fig. 4. 2.3.1. Classification of land suitability factors The factors that affect the suitability of land for surface irrigation were collected as gridded and vector data formats. The gridded datasets include soil, land use, population density, elevation, and potential evapotranspiration. The vector datasets include point rainfall and road network. The land use and soil data were reclassified into four classes of agricultural land suitability for irrigation according to the FAO framework (FAO, 1976, 1985, 1989; Walker, 1989). The land use map has eight types which includes wetland, water body, urban, shrubs, grassland, forest, bare land and agricultural land. The land use group were classified into four classes ranging from highly suitable (class S1) to not suitable (Class S4). Table 2 presents the FAO framework of land suitability classification. Agricultural land use types were classified as highly suitable (S1) and grassland, which requires land clearing and leveling, as moderately suitable (S2). Shrub land and bare land, which require higher initial investment for land preparation, were reclassified as marginally suitable (S3). Forest, water, urban and wetland land use types were reclassified as not suitable (S4). The AfSIS soil infromation of the first five layers from 0 to 100 cm was aggregated by weighted depth. The soil texture was also classified into 12 classes of soil groups using the USDA soil texture classification method. The reclassified soil map indicated that clay, clay loam, and sandy clay loam soils were the most dominant soil groups, with approximate coverage of 37%, 35%, and Fig. 3. Factors used to assess the land suitability for irrigation using groundwater. a) slope (%), b) population density, c) distance to major paved roads (km) and d) groundwater storage (million m3 /km2 ). A.W. Worqlul et al. / Applied Geography 85 (2017) 1e13 5
- 6. 25%, respectively. The relative suitability of soil for irrigation was rated by the revised Storie Index (SI) developed by the USDA Na- tional Resource Conservation Service (O'Geen, 2008; Storie, 1978). The SI assesses land suitability for irrigation considering informa- tion on surface soil texture, soil drainage, soil depth and organic carbon content. The amount of water that the soil can store is highly affected by soil texture, soil drainage and organic carbon content (Saxton Rawls, 2006). The soil texture was classified into four groups based on the soil water holding capacity, namely very high holding capacity (e.g. silt, silt loam and silty clay loam), high ca- pacity (e.g. silty clay, and clay), low capacity (e.g. loamy sands), and very low (e.g. sands, and loamy sands). The soil drainage represents the rate at which water drains into the soil, lower drainage rates will pond water on the soil surface while in well drained soils water is removed readily but not rapidly. The soil drainage map collected from AfSIS has seven classes: excessively drained, somewhat excessively drained, well drained, moderately well drained, some- what poorly drained and very poorly drained (Bell, Cunningham, Havens, 1992). The soil depth map from AfSIS indicated a depth varying from zero to 175 cm with an average value of 115 cm. The average organic carbon content (over the five layers up to one meter) varies from zero to 90 permilles. The slope map computed from a 30 m resolution DEM was classified into five levels of land suitability, as indicated by Worqlul et al. (2015). Slopes from 0 to 2% were classified as highly suitable, 2e8% as moderately suitable, 8e12% as marginally suitable,12e20% as less suitable and above 30% was classified as not suitable. The major road networks were used to determine market access by estimating the distance between each pixel and the nearby road network. Due to higher variability, the road proximity map was reclassified into eight classes of suitability using an equal interval ranging technique. The road proximity map indicates that the farthest point (Fig. 3c) is located at 119 km away from the paved road, on average from a given point there is a paved road at a dis- tance of 19 km. The suitability of the climate for irrigation was estimated by Land use Soil Road network Population density Meteorological DEM Euclidian distance Rainfall Slope MODIS evaporation Reclassify Overlaying weighted factors Rainfall deficit Weighting by pairwise comparison Selecting optimal sites Irrigation area suitability map Fraction of irrigable area Net irrigation requirement (NIR) over the growing period Groundwater depth (m) Potential borehole yield (l/s) Fraction irrigable area vs. potential suitable area Potential borehole yield Fig. 4. Schematic diagram of potential irrigable area and groundwater irrigation potential mapping. Table 2 Framework of land suitability classification of FAO (FAO, 1976; Worqlul et al., 2015). Class Land Description Class S1: Highly suitable Land without significant limitations. This land is the best possible and does not reduce productivity or require increased inputs. Class S2: Moderately suitable Land that is clearly suitable but has limitations that either reduce productivity or require an increase of inputs to sustain productivity compared with those needed on S1 land. Class S3: Marginally suitable Land with limitations so severe that benefits are reduced and/or the inputs required to sustain production need to be increased so that this cost is only marginally justified. Class S4 (N1): Currently not suitable Land that cannot support the particular land use on a sustained basis or land on which benefits do not justify inputs A.W. Worqlul et al. / Applied Geography 85 (2017) 1e13 6
- 7. calculating the monthly rainfall deficit (i.e., rainfall minus potential evapotranspiration) (Worqlul et al., 2015). The daily rainfall and eight days MODIS potential evapotranspiration were aggregated to monthly values, and thereby the monthly data was used to estimate the rainfall deficit. Then it was aggregated to annual average rainfall deficit. A positive monthly rainfall deficit value indicates no irri- gation requirement, while the negative values suggest irrigation requirement; the higher the negative value, the higher irrigation requirement. Similar to road proximity, rainfall deficit was reclas- sified into eight classes of suitability using an equal interval ranging technique. The population density ranges from 0 to 69,350 persons per square kilometer (Fig. 3b). Since the population density has high variability, similar to that of road proximity and rainfall deficit, it was classified into eight classes using the equal intervals ranging technique. 2.3.2. Weighting of factors and preliminary suitability mapping The weighting of factors was accomplished by applying a pair- wise comparison matrix (Saaty, 1977). In a pair-wise weighting approach, each factor was compared one-to-one, and a comparison matrix was prepared using the Saaty table indicating the relative importance of one factor over the other. The level of importance is scaled from values of 1e9 (Table 3). The highest value (9) corre- sponds to absolute importance, and the reciprocal of all scaled ra- tios were entered in the transpose position (i.e., 1/9 shows an absolute triviality) (Worqlul et al., 2015). The relative importance was computed by normalizing the eigenvalue vector of the factors by the cumulative sum. The overall weights of the factor maps were distributed to the suitability classes by an equal interval ranges technique. Finally, using the Weighted Overlay tool of the ArcGIS Spatial Analyst Tool, a preliminary land suitability map was compiled. The preliminary suitability map was multiplied by a constraint map, which contains zero and one values. A zero value represents land use types that limit the suitability of land for sur- face irrigation such as water bodies, wetlands, urban areas, forest, and protected areas. 2.3.3. Groundwater depth and availability The quantitative groundwater map of Africa developed by the British Geological Survey was developed by combining information from 1:5 million-scale Africa geological maps, published national and regional hydrological maps, and available quantitative aquifer studies. Aquifer productivity was used to quantify the groundwater availability and accessibility. Northern African countries (Libya, Algeria, Sudan and Egypt) with large sedimentary aquifers contain the considerable proportion of Africa's groundwater. In those re- gions, the groundwater storage can be as much as 75 m in depth. However, those areas are not actively recharged. They were recharged 5000 years ago when the climate of the area was wetter (MacDonald et al., 2012; Scanlon et al., 2006). The groundwater data obtained from the British Geological Survey includes groundwater depth (m), storage (mm) and potential borehole yield (liters/second) in ASCII file format. The ASCII file was converted to a grid format of 5 km resolution. More detailed information on the dataset can be found in MacDonald et al. (2012). The groundwater recharge estimate from the Ethiopian Agricultural Transformation Agency (ATA) in the central part of Ethiopia was used to validate the potential borehole yield estimate of BGS. After validating the con- tinental BGS potential borehole yield, BGS potential borehole yield data was then used to determine the annual groundwater available for irrigation, and the groundwater depth map was used to identify the plausible water lifting technologies that can be adopted. 2.3.4. Irrigation potential of the groundwater The BGS potential borehole yield data was used to estimate the available annual groundwater for irrigation. The irrigation potential of the groundwater was estimated as the quotient of the potential average borehole yield and the total crop water requirement (CWR) of the dominant crop in the area for the growing season. The dominant crops growing in the major basins were extracted from the SPAM land use map. SPAM data indicated that teff is the dominant crop in the Abbay, Awash, Mereb and Omo-Ghibe Basins. Root vegetables such as onions, carrots and potatoes commonly grow in Awash, Rift valley and Omo-Ghibe. The common crops grown in the major basins were cereal crops including sorghum, maize, wheat and barley. The list of dominant crops growing in the major river basins is presented in Table 4. The crop coefficients for the initial, mid and late seasons and growing period were extracted from the FAO - 56 manual (Allen, Pereira, Raes, Smith, 1998). According to this manual, most of the cereal crops have a close crop coefficient of 0.3, 1.15 and 0.4 for initial, mid, and late growing seasons, respectively. The growing period of the irrigated crops ranges between 130 and 140 days. The rainfed crops which are planted in the summer season (Meher) are harvested between September and December (Funk et al., 2003). Irrigated crops were planted in the dry season from December to April. The net irrigation requirement (NIR) is the difference between crop water requirement (CWR) and effective rainfall (ER) (Eq. (1)). The crop water requirement depends on the prevailing climate condition, crop type, stage of crop growth and soil properties. The crop water requirement (CWR) was calculated as the sum of crop evapotranspiration (ETc), water application loss (La), conveyance loss (Lc) and special needs (Ls, e.g., land preparation and leaching) Table 3 Pair-wise comparison scale and definitions (Saaty, 1977). Intensity of importance Definition Description 1 Equal importance Two factors contribute equally to the suitability for surface irrigation 3 Somewhat more important Experience and judgement slightly favour one over the other 5 Much more important Experience and judgement strongly favour one over the other. 7 Very much more important Experience and judgement very strongly favour one over the other. Its importance is demonstrated in practice. 9. Absolutely more important The evidence favouring one over the other is of the highest possible validity. 2,4,6,8 Intermediate values When compromise is needed Table 4 Commonly cultivated crops in the major river basins of Ethiopia. River basins Major crops Abbay Sorghum, wheat and maize Awash Sorghum, wheat, maize, and fiber crops Aysha Maize Baro-Akobo Sorghum, oil seeds, and maize Afar/Denakil Barley and wheat Genale-Dawa Wheat, barley, and root vegetables Mereb Barley, sorghum and millet Ogaden Maize and wheat Omo-Ghibe Root vegetables, wheat, maize, and sorghum Rift Valley Wheat, maize, and barley Tekeze Sorghum, wheat, barley, and sesame Wabi-Shebelle Sorghum, barley, and wheat A.W. Worqlul et al. / Applied Geography 85 (2017) 1e13 7
- 8. (Eq. (2)). NIR ¼ CWR ER (1) CWR ¼ ETc þ La þ Lc þ Ls (2) Generally, the crop water requirement (CWR) is calculated as a product of the potential evapotranspiration (ETo) and the crop coefficient (Kc) (Allen et al., 1998). ETc ¼ Kc ETo (3) The total crop water requirement was computed with a 60% irrigation inefficiency of water application and water requirement for special needs such as land preparation and leaching (Altchenko Villholth, 2014; Yohannes Tadesse, 1998). NIR ¼ 1:6Kc ETo ER (4) Mu et al. (2011) evaluated the performance of MODIS ETo using 46 AmeriFlux eddy covariance flux. They developed an improved MODIS ETo version that showed a reasonable performance by capturing 86% of the variation and with mean absolute error ranging between 10 and 30%; this improved version was used in our study. The source of irrigation water was represented by the potential borehole yield (liters/second) from BGS. The potential borehole yield was aggregated over the growing period to match the crop water requirement over the season. The irrigation potential of the groundwater (IPG, Eq (5)) was estimated by dividing the cumula- tive potential borehole yield (CBY, mm) by the net irrigation requirement (NIR, mm) throughout the growing period. Finally, the groundwater irrigation potential was compared with the potential suitable land. IPG ¼ CBY NIR (5) where IPG is irrigation potential of the groundwater, CBY is cumu- lative potential borehole yield and NIR is net irrigation requirement. 3. Results and discussion 3.1. Weighting of factors for surface irrigation suitability mapping The pair-wise comparison matrix was used to weight the fac- tors. Six of the major factors were compared one-to-one and scored using a scale from Saaty (1977). The eigenvector was calculated as the product of the row matrix and the weights of each factor were calculated by normalizing the respective eigenvector by the cu- mulative vector. Slope and rainfall deficit were the most important factors for determining the suitability of an area for irrigation fol- lowed by population density and soil. Land use and road proximity were listed as less important. Table 5 presents the results of the pair-wise comparison matrix and weights of factors. The credibility of the pairwise matrix consistency was evaluated using consistency ratio. The result was found to be trustworthy with a consistency ratio of 0.2 (Byun, 2001; L.; Chen, Chan, Lee, Chung, Lai, 2014; Koczkodaj et al., 2016). 3.2. Preliminary land suitability for surface irrigation The weights of the factors were distributed to the different levels of suitability classes by an equal interval ranging technique. Fig. 5 indicates the reclassified factors affecting land suitability for surface irrigation. The preliminary land suitable area was computed using the Weighted Overlay analysis tool of the ArcGIS Spatial Analyst tool (Fig. 6). The preliminary suitability map value ranges from 30 to 97%, where 30% indicates the least suitable land and 97% is the most suitable land. A constraint map with a value of zero and one was used to exclude the none-suitable areas from the preliminary suitable land. The suitable land was extracted for a variable threshold from 80% to 93% (with a 1% increment) from the pre- liminary suitability map and the respective area above the threshold were plotted (Fig. 7). For example, at a threshold of 85%, there were thousands of suitable land pixels with area ranging from 1 km2 to 500 km2 . At 85% threshold, nearly 5.3% of the landmass (about 60,000 km2 ) was suitable for surface irrigation and at 80% threshold; nearly 10.8% of the land is suitable for agriculture. Using 85% as the suitability scale, the suitable areas in the major twelve river basins of the country were calculated. Table 6 presents the area of the basins and their respective potential suitable land for surface irrigation. Upper Blue Nile Basin (locally called Abbay) has the largest area of suitable land for irrigation, which is approximately 21,186 km2 while Rift Valley basin has the largest percentage of suitable land for irrigation. 3.3. Groundwater availability The groundwater study from the BGS was aggregated to 39 ATA groundwater recharge study sites for comparison. The comparison between the BGS groundwater data and data from ATA showed a reasonable agreement for 80% of the districts with a root mean square error of 20 mm/year. The groundwater storage volume in Ethiopia is highly variable, ranging from 1 to 50 million m3 km2 (1000 to 50,000 mm water depth) (Fig. 3d) with a depth varying from 7 to 250 m below the surface (Fig. 8a). The storage map in- dicates that 43% and 37% of the country has storage of 1e10 m3 km2 and 10e25 m3 km2 , respectively. However, only a fraction of this groundwater is available for extraction through wells, which would be less than the effective porosity of the soil. The aquifer productivity map (Fig. 8b) indicates that the borehole potential yield in the country ranges from 0.1 to 20 l/s. A large portion of the country (47%) has aquifer potential yield between 1 and 5 l/s while 14% of the land has the highest aquifer potential yield between 5 and 20 l/s. The potential borehole yield in Ethiopia is very low for large- scale irrigation, which requires more than 20 l/s of water. Such an attempt would deplete the aquifer storage quickly; consequently, the environment and people who depend on it will be affected. However, the groundwater could be used for small-scale irrigation using hand pumps that prevent the water from being depleted at a higher rate than recharge. The groundwater depth map indicates that approximately 20% of the land has a very shallow groundwater access up to 7 m from the surface. The majority of the land has a groundwater access from 7 to 25 m below the ground surface (Fig. 8a). The average groundwater storage, yield, and depth were extracted for the major 12 river basins (Table 7). The western part of the country has a relatively shallow groundwater access in the Abbay, Baro-Akobo, Omo Ghibe and Rift Valley river basins. The eastern part of the country is composed of a lowland and the thick unconsolidated sediments aquifers have higher groundwater stor- age but at a larger depth from the surface. Water lifting technology choice for irrigation depends on the depth to groundwater and crop watering equipment. Abbay, Baro Akobo, Omo Ghibe and Rift Valley river basins have a shallow groundwater (20 m) with a moderate yield (2.0e4.6 l/s) which makes them favorable for small-scale groundwater irrigation. A.W. Worqlul et al. / Applied Geography 85 (2017) 1e13 8
- 9. Table 5 Pair-wise comparison matrix and weights of factors. Factors Soil Land use Population density Road proximity Rain deficit Slope Weight (%) Soil 1 2 1/3 1/2 2 1/3 12.8 Land use 1/2 1 1/4 2 1/5 1/3 7.3 Population density 3 4 1 3 1/4 1/2 18.4 Road proximity 2 1/2 1/3 1 1/5 1/3 7.6 Rainfall deficit 1/2 5 4 5 1 1/2 24.5 Slope 3 3 2 3 2 1 29.4 Fig. 5. Reclassified factor maps: a) land use, b) slope, c) population density, d) road proximity, e) rainfall deficit and f) constraints. A.W. Worqlul et al. / Applied Geography 85 (2017) 1e13 9
- 10. 3.4. Areas suitable for irrigation versus groundwater availability The monthly rainfall and potential evapotranspiration indicates that for the major part of the country, rainfall is larger than po- tential evaporation during the rainy season. This suggests that there is no need of irrigation during the rainy season. However, supple- mentary irrigation may be necessary in case of unexpected dry spells and droughts (Barron Okwach, 2005; Oweis Hachum, 2006). The average daily potential evapotranspiration computed for the country from the MODIS global evapotranspiration indi- cated that evapotranspiration (ET) ranges between 7.3 and 9.8 mm/ day for the growing season from December to April. The net irri- gation requirement (NIR) over the growing period could be be- tween 830 and 1630 mm/year (Fig. 9a). The net irrigation requirement is very high in the lowland area where the tempera- ture is higher for the growing period. The highland and western part of the country have a relatively lower net irrigation require- ment. The potential borehole yield was aggregated over the growing period (Fig. 9b). The borehole potential volume for the growing season computed has a volume ranging from 1950 to 243,650 m3 /km2 (Fig. 9b). The irrigation potential of the borehole yield was calculated as the quotient of the potential borehole yield volume and the net irrigation requirement for the growing season. Fig. 8 presents the fraction of the irrigable area. The analysis assumes that 90% of the area is used for planting crops while the remaining area is used for agricultural infrastructural use. We found that the groundwater might irrigate 1.6e30% of the area within a pixel (Fig. 10). The Fig. 6. A preliminary suitable land for irrigation; 97% shows the most suitable area for irrigation while 30% shows the least suitable land. 0 40 80 120 80 82 84 86 88 90 92 94 Suitable area (1000km 2 ) Percent threshold (%) (suitability level) Fig. 7. Suitable irrigation area (in 1000 km2 ) at different suitability level. For example, 60,000 km2 land is suitable at a suitability level of 85% and 96,000 km2 land is suitable at a suitability level of 82%. A.W. Worqlul et al. / Applied Geography 85 (2017) 1e13 10
- 11. fraction irrigable area extracted for the suitable land indicated that, on average, the groundwater can irrigate 8% of the suitable po- tential land. However, if lateral flow occurs between the 5 km grids, the irrigation potential of the groundwater could increase signifi- cantly. River basin-scale analysis indicated that the average fraction of irrigable area in the Abbay, Tekeze, Omo Ghibe and Rift Valley Basins varied from 7.5 to 12.4% of the potential suitable land. 4. Conclusions This study is the first of its kind to provide a spatially explicit groundwater irrigation area suitability map for Ethiopia. The find- ings indicate that there is modest amount of land suitable for irri- gation using groundwater. A large portion of the suitable land is located in Upper Blue Nile, Rift Valley, Omo Ghibe and Awash River Table 6 Potential suitable land area in the major river basins of Ethiopia. River basin Basin area (km2 ) Potential irrigable land (km2 ) Percent potential Abbay 198,891 21,186 11 Afar/Denakil 63,853 523 1 Awash 110,439 7331 7 Aysha 4321 e e Baro-Akobo 76,203 2603 3 Genale-Dawa 172,133 2056 1 Mereb 5965 208 3 Ogaden 80,009 720 1 Omo-Ghibe 78,189 8235 11 Rift Valley 51,989 10,512 20 Tekeze 86,455 1782 2 Wabi-Shebelle 202,219 4868 2 Total 1,130,666 60,024 5.3 Fig. 8. Aquifer productivity and depth of groundwater from the surface in Ethiopia. Table 7 Average groundwater storage, yield, and depth for the major river basins of Ethiopia. River Basin Groundwater storage (mm) Aquifer productivity yield (l/s) Groundwater depth (m) Abbay 5706 3.8 13.7 Afar/Denakil 7663 5.7 82.4 Awash 11,847 5.6 38.8 Aysha 12,611 6.6 71.2 Baro Akobo 11,070 2.0 13.2 Genale Dawa 15,245 3.2 35.7 Mereb 2519 1.8 24.8 Ogaden 17,837 1.0 83.0 Omo Ghibe 7321 4.4 17.9 Rift Valley 7087 4.6 19.6 Tekeze 4793 4.1 23.4 Wabi Shebelle 16,624 1.6 49.2 A.W. Worqlul et al. / Applied Geography 85 (2017) 1e13 11
- 12. basins. Abbay, Omo Ghibe and Rift Valley River basins have a shallow groundwater (25 m) access with a moderate borehole yield (2.0e4.6 l/s), which makes them favorable for small-scale groundwater irrigation. Comparison between available ground- water and total crop water requirement indicated that there is not sufficient amount of groundwater in these basins to sufficiently irrigate all the suitable lands in the basins. The available ground- water would only irrigate ~8% of the suitable land. However, if lateral flow exist within the aquifers (which are not considered in this study), the irrigation potential of the groundwater may in- crease significantly. The irrigation potential of the groundwater could also increase if the water is applied efficiently using drip and/ or sprinkler irrigation. This study assumes static land use type use condition and results may be a bit different with changed land use types in the future. We hope this study will provide valuable in- formation to decision makers, practitioners and investors to intensify irrigation using groundwater in Ethiopia. This study will also open new frontiers on groundwater research in Ethiopia. Acknowledgements This publication was made possible through support provided by Feed the Future through the U.S. Agency for International Development, under the terms of Contract No. AID-OAA-A-13- 0005. The opinions expressed herein are those of the author(s) and do not necessarily reflect the views of the U.S. Agency for Inter- national Development. We would like also to acknowledge the National Meteorological Agency Services of Ethiopia, British Geological Survey, United States Geological Survey, African Soil Information Service and International Food Policy Research Insti- tute for providing us with quality data. The editor and the three anonymous reviewers gratefully acknowledged for their valuable comments on our manuscript. References Adhikary, P. P., Chandrasekharan, H., Trivedi, S., Dash, C. J. (2015). GIS applicability to assess spatio-temporal variation of groundwater quality and sustainable use for irrigation. Arabian Journal of Geosciences, 8(5), 2699e2711. Akıncı, H., € Ozalp, A. Y., Turgut, B. (2013). Agricultural land use suitability analysis using GIS and AHP technique. Computers and Electronics in Agriculture, 97, 71e82. Allen, R. G., Pereira, L., Raes, D., Smith, M. (1998). FAO Irrigation and drainage paper No. 56. Rome: Food and Agriculture Organization of the United Nations, 56, 97e156. Altchenko, Y., Villholth, K. (2014). Mapping irrigation potential from renewable groundwater in Africaea quantitative hydrological approach. Hydrology Earth System Sciences Discussions, 11(6). Araya, A., Stroosnijder, L. (2011). Assessing drought risk and irrigation need in northern Ethiopia. Agricultural and Forest Meteorology, 151(4), 425e436. Assefa, T. T., Jha, M. K., Tilahun, S. A., Yetbarek, E., Adem, A. A., Wale, A. (2015). Identification of erosion hotspot area using GIS and MCE technique for koga watershed in the upper blue Nile Basin, Ethiopia. American Journal of Environ- mental Sciences, 11(4), 245. Awulachew, S. B., Ayana, M. (2011). Performance of irrigation: An assessment at different scales in Ethiopia. Experimental Agriculture, 47(S1), 57e69. Awulachew, S. B., Erkossa, T., Namara, R. (2010). Irrigation potential in Ethiopia: Constraints and opportunities for enhancing the system (Unpublished Report to the Bill and Melinda Gates Foundation). Awulachew, S. B., Yilma, A. D., Loulseged, M., Loiskandl, W., Ayana, M., Alamirew, T. (2007). Water resources and irrigation development in Ethiopia (Vol. 123). Iwmi. Bai, Z., Dent, D., Olsson, L., Schaepman, M. (2008). Global assessment of land Fig. 9. Total crop water requirement (TCWR) and potential borehole groundwater yield. NIR refers the net irrigation requirement. Fig. 10. Fraction of irrigable land using borehole potential yield within the pixels. A.W. Worqlul et al. / Applied Geography 85 (2017) 1e13 12
- 13. degradation and improvement 1: Identification by remote sensing. Report 2008/01. Rome/Wageningen: FAO/ISRIC. Barron, J., Okwach, G. (2005). Run-off water harvesting for dry spell mitigation in maize (Zea mays L.): Results from on-farm research in semi-arid Kenya. Agri- cultural Water Management, 74(1), 1e21. Bell, J. C., Cunningham, R. L., Havens, M. W. (1992). Calibration and validation of a soil-landscape model for predicting soil drainage class. Soil Science Society of America Journal, 56(6), 1860e1866. Berry, L. (2003). Land degradation in Ethiopia: Its extent and impact (Commissioned by the GM with WB support). Bewket, W., Conway, D. (2007). A note on the temporal and spatial variability of rainfall in the drought-prone Amhara region of Ethiopia. International Journal of Climatology, 27(11), 1467e1477. Birkett, C., Murtugudde, R., Allan, T. (1999). Indian Ocean climate event brings floods to East Africa's lakes and the Sudd Marsh. Geophysical Research Letters, 26(8), 1031e1034. Byun, D.-H. (2001). The AHP approach for selecting an automobile purchase model. Information Management, 38(5), 289e297. Ceballos-Silva, A., Lopez-Blanco, J. (2003). Delineation of suitable areas for crops using a multi-criteria evaluation approach and land use/cover mapping: A case study in Central Mexico. Agricultural Systems, 77(2), 117e136. Chen, L., Chan, C.-M., Lee, H.-C., Chung, Y., Lai, F. (2014). Development of a decision support engine to assist patients with hospital selection. Journal of Medical Systems, 38(6), 59. Chen, Y., Yu, J., Khan, S. (2010). Spatial sensitivity analysis of multi-criteria weights in GIS-based land suitability evaluation. Environmental Modelling Software, 25(12), 1582e1591. CIAT C a. (2005). Gridded population of the world, version 3 (GPWv3): Population density grid. Palisades, NY: NASA Socioeconomic Data and Applications Center (SEDAC). Diro, G., Grimes, D., Black, E., O'Neill, A., Pardo-Iguzquiza, E. (2009). Evaluation of reanalysis rainfall estimates over Ethiopia. International Journal of Climatology, 29(1), 67e78. FAO. (1976). A framework for land evaluation. In Soils bulletin (Vol. 32) (Rome). FAO. (1985). Guidelines: Land evaluation for irrigated agriculture. Soils Bulletin, 55. Via delle Terme di Caracalla, 00100 Rome, Italy. FAO. (1989). Guidelines for designing and evaluating surface irrigation systems (FAO irrigation and drainage paper). Via delle Terme di Caracalla, 00100 Rome, Italy. Funk, C., Asfaw, A., Steffen, P., Senay, G., Rowland, J., Verdin, J. (2003). Estimating Meher crop production using rainfall in the ‘long cycle’region of Ethiopia (FEWS NET Rpecial Report). Gencer, C., Gürpinar, D. (2007). Analytic network process in supplier selection: A case study in an electronic firm. Applied Mathematical Modelling, 31(11), 2475e2486. Giordano, M. (2006). Agricultural groundwater use and rural livelihoods in sub- Saharan Africa: A first-cut assessment. Hydrogeology Journal, 14(3), 310e318. Gissila, T., Black, E., Grimes, D., Slingo, J. (2004). Seasonal forecasting of the Ethiopian summer rains. International Journal of Climatology, 24(11), 1345e1358. Hammond, M. (2013). Global Water Forum Discussion paper. The grand ethiopian renaissance dam and the Blue Nile: Implications for transboundary water gover- nance (Vol. 1307). HarvestChoice. (2014). Crop production: SPAM. International Food Policy Research Institute. Available online at: http://harvestchoice.org/node/9716 (Washington, DC., and University of Minnesota, St. Paul, MN). Hengl, T., Heuvelink, G. B., Kempen, B., Leenaars, J. G., Walsh, M. G., Shepherd, K. D., et al. (2015). Mapping soil properties of Africa at 250 m resolution: Random forests significantly improve current predictions. PloS One, 10(6), e0125814. IFAD. (2011). Rural poverty Report: New realities new Challenges: New opportu- nities for tomorrow's generation. In IFAD (Ed.), Rural poverty report (p. 322) (Rome, Italy). Jarvis, A., Reuter, H. I., Nelson, A., Guevara, E. (2008). Hole-filled SRTM for the globe version 4. available from: the CGIAR-CSI SRTM 90m Database http://srtm.csi. cgiar.org. Jha, M. K., Chowdary, V., Chowdhury, A. (2010). Groundwater assessment in Salboni Block, West Bengal (India) using remote sensing, geographical infor- mation system and multi-criteria decision analysis techniques. Hydrogeology Journal, 18(7), 1713e1728. Koczkodaj, W. W., Mikhailov, L., Redlarski, G., Soltys, M., Szybowski, J., Tamazian, G., et al. (2016). Important facts and observations about pairwise comparisons (the special issue edition). Fundamenta Informaticae, 144(3e4), 291e307. Korecha, D., Sorteberg, A. (2013). Validation of operational seasonal rainfall forecast in Ethiopia. Water Resources Research, 49(11), 7681e7697. Latinopoulos, D., Theodossiou, N., Latinopoulos, P. (2011). Combined use of groundwater simulation and multi-criteria analysis within a spatial decision- making framework for optimal allocation of irrigation water. Spanish Journal of Agricultural Research, 9(4), 1105e1119. MacDonald, A., Bonsor, H., Dochartaigh, B. E. O., Taylor, R. (2012). Quantitative maps of groundwater resources in Africa. Environmental Research Letters, 7(2), 024009. Mario, Z., James, B., Prisca, K. (2010). Special report: FAO/WFP crop and food security assessment mission to Ethiopia. Rome: Publication of Food and Agriculture Or- ganization of the United Nations, and World Food Programme. Mendas, A., Delali, A. (2012). Integration of MultiCriteria Decision Analysis in GIS to develop land suitability for agriculture: Application to durum wheat culti- vation in the region of Mleta in Algeria. Computers and Electronics in Agriculture, 83, 117e126. Miller, W., Collins, M. G., Steiner, F. R., Cook, E. (1998). An approach for greenway suitability analysis. Landscape and Urban Planning, 42(2), 91e105. MoWR. (1999). In E. M. o. W. Resources (Ed.), Water resource management policy (WRMP). Addis Ababa, Ethiopia: Ethiopian Ministry of Water Resources. Mu, Q., Zhao, M., Running, S. W. (2011). Improvements to a MODIS global terrestrial evapotranspiration algorithm. Remote Sensing of Environment, 115(8), 1781e1800. O'Geen, A. T. (2008). A revised storie index for use with digital soils information. UCANR Publications. Oweis, T., Hachum, A. (2006). Water harvesting and supplemental irrigation for improved water productivity of dry farming systems in West Asia and North Africa. Agricultural Water Management, 80(1), 57e73. Pankhurst, R., Johnson, D. H. (1988). The great drought and famine of 1888-92 in northeast Africa. The Ecology of Survival: Case Studies from Northeast African History, 47e72. Pohekar, S., Ramachandran, M. (2004). Application of multi-criteria decision making to sustainable energy planningda review. Renewable and Sustainable Energy Reviews, 8(4), 365e381. Rahman, M. R., Shi, Z., Chongfa, C. (2009). Soil erosion hazard evaluationdan integrated use of remote sensing, GIS and statistical approaches with bio- physical parameters towards management strategies. Ecological Modelling, 220(13), 1724e1734. Saaty, T. L. (1977). A scaling method for priorities in hierarchical structures. Journal of Mathematical Psychology, 15(3), 234e281. Saaty, T. L. (2008). Decision making with the analytic hierarchy process. Interna- tional Journal of Services Sciences, 1(1), 83e98. Saaty, T. L., Erdener, E. (1979). A new approach to performance measurement the analytic hierarchy process. Design Methods and Theories, 13(2), 62e68. Saxton, K., Rawls, W. (2006). Soil water characteristic estimates by texture and organic matter for hydrologic solutions. Soil Science Society of America Journal, 70(5), 1569e1578. Scanlon, B. R., Keese, K. E., Flint, A. L., Flint, L. E., Gaye, C. B., Edmunds, W. M., et al. (2006). Global synthesis of groundwater recharge in semiarid and arid regions. Hydrological Processes, 20(15), 3335e3370. Seleshi, Y., Camberlin, P. (2005). Recent changes in dry spell and extreme rainfall events in Ethiopia. Theoretical and Applied Climatology, 83, 181e191. http:// dx.doi.org/10.1007/s00704-005-0134-3. Seleshi, Y., Camberlin, P. (2006). Recent changes in dry spell and extreme rainfall events in Ethiopia. Theoretical and Applied Climatology, 83(1), 181e191. Şener, Ş., Şener, E., Nas, B., Karagüzel, R. (2010). Combining AHP with GIS for landfill site selection: A case study in the lake Beyşehir catchment area (Konya, Turkey). Waste Management, 30(11), 2037e2046. Setegn, S. G., Srinivasan, R., Dargahi, B., Melesse, A. M. (2009). Spatial delineation of soil erosion vulnerability in the Lake Tana Basin, Ethiopia. Hydrological Pro- cesses, 23(26), 3738e3750. Siebert, S., Burke, J., Faures, J.-M., Frenken, K., Hoogeveen, J., D€ oll, P., et al. (2010). Groundwater use for irrigationea global inventory. Hydrology and Earth System Sciences, 14(10), 1863e1880. Steuer, R. E., Na, P. (2003). Multiple criteria decision making combined with finance: A categorized bibliographic study. European Journal of Operational Research, 150(3), 496e515. Storie, R. E. (1978). Storie index soil rating (Vol. 3203). Division of Agricultural Sci- ences University of California. Swain, A. (1997). Ethiopia, the Sudan, and Egypt: The Nile River Dispute. The Journal of Modern African Studies, 35(04), 675e694. Vågen, T.-G., Shepherd, K. D., Walsh, M. G., Winowiecki, L., Desta, L. T., Tondoh, J. E. (2010). AfSIS technical specifications: Soil health surveillance. Nairobi, Kenya: World Agroforestry Centre. Walker, W. R. (1989). Guidelines for designing and evaluating surface irrigation systems. Worqlul, A. W., Collick, A. S., Rossiter, D. G., Langan, S., Steenhuis, T. S. (2015). Assessment of surface water irrigation potential in the Ethiopian highlands: The Lake Tana Basin. Catena, 129, 76e85. Yohannes, F., Tadesse, T. (1998). Effect of drip and furrow irrigation and plant spacing on yield of tomato at Dire Dawa, Ethiopia. Agricultural Water Manage- ment, 35(3), 201e207. You, L., Ringler, C., Wood-Sichra, U., Robertson, R., Wood, S., Zhu, T., et al. (2011). What is the irrigation potential for Africa? A combined biophysical and socio- economic approach. Food Policy, 36(6), 770e782. A.W. Worqlul et al. / Applied Geography 85 (2017) 1e13 13