1. Employment vs. unemployment rate: Detroit
Industry employment stratification: Detroit
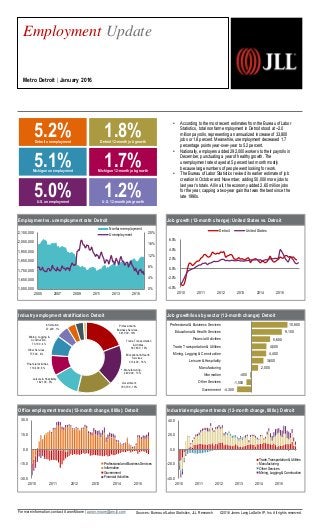
Office employment trends (12-month change, 000s): Detroit
For more information, contact: Aaron Moore | aaron.moore@am.jll.com ©2016 Jones Lang LaSalle IP, Inc. All rights reserved.Sources: Bureau of Labor Statistics, JLL Research
Employment Update
Metro Detroit | January 2016
Job growth (12-month change): United States vs. Detroit
Job growth/loss by sector (12-month change): Detroit
Industrial employment trends (12-month change, 000s): Detroit
5.0%U.S. unemployment
1.2%U.S. 12-month job growth
5.2%Detroit unemployment
1.8%Detroit 12-month job growth
5.1%Michigan unemployment
1.7%Michigan 12-month job growth
-4,300
-1,500
-400
2,000
3,600
4,400
4,500
5,600
9,100
10,800
-6,000 -2,000 2,000 6,000 10,000
Government
Other Services
Information
Manufacturing
Leisure & Hospitality
Mining, Logging & Construction
Trade, Transportation & Utilities
Financial Activities
Educational & Health Services
Professional & Business Services
-40.0
-20.0
0.0
20.0
40.0
2010 2011 2012 2013 2014 2015
Trade,Transportation & Utilities
Manufacturing
Other Services
Mining, Logging & Construction
-30.0
-15.0
0.0
15.0
30.0
2010 2011 2012 2013 2014 2015
Professional and Business Services
Information
Government
Financial Activities
0%
4%
8%
12%
16%
20%
1,550,000
1,650,000
1,750,000
1,850,000
1,950,000
2,050,000
2,150,000
2005 2007 2009 2011 2013 2015
Nonfarm employment
Unemployment
• According to the most recent estimates from the Bureau of Labor
Statistics, total nonfarm employment in Detroit stood at ~2.0
million payrolls, representing an annualized increase of 33,800
jobs or 1.8 percent. Meanwhile, unemployment decreased 1.7
percentage points year-over-year to 5.2 percent.
• Nationally, employers added 292,000 workers to their payrolls in
December, punctuating a year of healthy growth. The
unemployment rate stayed at 5 percent last month mostly
because large numbers of people went looking for work.
• The Bureau of Labor Statistics revised its earlier estimate of job
creation in October and November, adding 50,000 more jobs to
last year’s totals. All in all, the economy added 2.65 million jobs
for the year, capping a two-year gain that was the best since the
late 1990s.
-4.0%
-2.0%
0.0%
2.0%
4.0%
6.0%
2010 2011 2012 2013 2014 2015
Detroit United States
Professional &
Business Services,
381,000 , 19%
Trade, Transportation
& Utilities,
367,800 , 19%
Educational & Health
Services,
313,400 , 16%
Manufacturing,
249,000 , 13%
Government,
183,700 , 10%
Leisure & Hospitality,
182,100 , 9%
Financial Activities,
110,400 , 6%
Other Services,
77,500 , 4%
Mining, Logging &
Construction,
73,100 , 4%
Information,
27,200 , 1%