Download to read offline

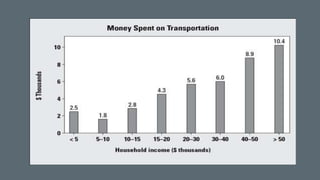


The document summarizes a bar graph showing transportation expenditures by household income in the United States. [1] It shows that as household income increases, the amount spent on transportation also increases. [2] However, the percentage of income spent on transportation is higher for lower-income households - those making less than $5,000 per year spend 50% of their income on transportation, while those making $30,000-$40,000 per year spend 15-20%. [3] The bar graph categories are not equivalent, making true comparisons between groups more difficult.


