Call Girls in Gomti Nagar - 7388211116 - With room Service
Sector pulse june 2013
1. Banner
Banner
Qatar Development Bank
June 2013
Contact:
Economics@qdb.qa
Qatar’s plastic cluster—which includes
plastic raw materials, plates/sheets/film,
plastic pipes and fittings, builders’ plastics,
bags/packing products, fiberglass products
and other minor plastic products—has
come of age over the last five years. In
effect, Qatar’s construction boom has
expanded demand for plastics inputs
allowing the sector to grow beyond its
historic product lines dating back almost
thirty years. Further preparations for the
2022 World Cup bode well for sector as
demand for plastic-based products is
expected to increase further until 2016 to
level off after that. This will allow the
cluster to consolidate its presence in Qatar,
as well as expand its footing in regional
markets.
Qatar’s plastics value-chain originates in its
raw materials sector (ISIC code 201300)
which, in turn, uses downstream inputs
from the local refinery sector. The sub-
sector is, by far, the biggest component
throughout the value chain with investments
of QR 11.1 bn as at 2012 and 3,570
employees (98 and 47 per cent of the
cluster’s overall figures respectively). The
industry, however, is not entirely self-
sufficient as many inputs still need to be
imported from Saudi Arabia, UAE and the
U.S., accounting for 61.6% of total imported
inputs in 2011.
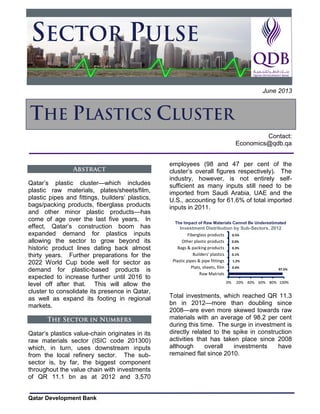
Total investments, which reached QR 11.3
bn in 2012—more than doubling since
2008—are even more skewed towards raw
materials with an average of 98.2 per cent
during this time. The surge in investment is
directly related to the spike in construction
activities that has taken place since 2008
although overall investments have
remained flat since 2010.
97.5%0.4%
1.2%
0.1%
0.3%
0.0%
0.5%
0% 20% 40% 60% 80% 100%
Raw Matrials
Plats, sheets, film
Plastic pipes & pipe fittings
Builders' plastics
Bags & packing products
Other plastic products
Fiberglass products
The Impact of Raw Materials Cannot Be Underestimated
Investment Distribution by Sub-Sectors, 2012
2. Sector Review The Plastics Industry in Qatar
Qatar Development Bank 2
Sector growth came to a near halt in 2010
in response to the slowdown in construction
at the time. Since then, basic raw
materials—the biggest recipient of new
investment into the sector—has shown
remarkably little dynamism. Last year,
investment growth shifted towards sectors
further down the value-chain such as bags
(110%) and construction-related materials
(125%), as construction in Qatar turned the
corner.
Investment growth during 2008-2010, which
was also dominated by raw materials, came
to a near stop in 2011. Overall sector
investment almost doubled in 2009 as raw
materials supported 98 per cent of the
increase with a similar performance in
2010. Since then, however, investment
growth slowed down dramatically in
response to the decline in construction
activities. During 2011-2012, investment
growth remained at near zero per cent.
The construction slowdown of 2010-2011
also revealed the sector’s maturity curve.
Heavy initial investments in the raw
materials sector posited the value-chain to
develop downstream sectors (building
materials, packaging, etc.) that by now are
linked to construction and final consumption
activities. As a result the recent
construction cycle had a direct and
immediate impact on plastic manufacturing,
which, in turn created a cycle in the plastics
sector.
The raw materials subsector also
dominates trade flows. Total plastic exports
captured 2.2 per cent of overall Qatari
exports in 2011 (0.04 per cent when raw
materials are excluded) with imports
showing a similar trend (2.3 per cent of total
imports, 1.4 per cent when raw materials
are excluded).
46.5 %
18.7 %
15.6 % 13.6 %
5.1 %
.4 %
%
10 %
20 %
30 %
40 %
50 %
Plastic
pipes &
pipe
fittings
Fiberglass
products
Plates,
sheets,
film
Bags &
packing
products
Builders'
plastics
Other
plastic
products
Source: QDB Staff calculations based on QSA and GOIC data
Investment's Distribution by Sub-Sector, 2012
(Excluding Raw Materials)
-100%
-50%
0%
50%
100%
150%
200%
2009 2010 2011 2012
Raw Materials Plats, sheets, film
Plastic pipes & pipe fittings Builders' plastics
Bags & packing products Fiberglass products
The Construction Slowdown Had a Big Impact on Plastics
Investment Growth by Sub-Sectors
-0.20%
-0.10%
0.00%
0.10%
0.20%
0.30%
0.40%
0.50%
2009 2010 2011 2012
Plates, sheets, film
Plastic pipes & pipe fittings
Builders' plastics
Bags & packing products
Fiberglass products
Source: QDB calculations based on QSA and GOIC data
Contribution to Overall Investment Growth
(Excluding Raw Materials), 2009-2012
The Industry is Maturing
98.1%
96.3%
96.8%
95.6%
98.2%
94.0%
95.0%
96.0%
97.0%
98.0%
99.0%
0%
1%
2%
3%
2007 2008 2009 2010 2011
Plates, sheets & films Pipes and pipes fittings Bags and packing products
Fiberglass products Primary forms
Source: QDB Staff calculations based on QSA and GOIC data
Structure of Plastic Exports , 2007-2011
Export Share (%)
Raw Materials Dominate Plastics Exports
3. Sector Review The Plastics Industry in Qatar
Qatar Development Bank 3
Indeed, overall plastics exports in 2011
totaled QAR 8.8 billion, 98 per cent of which
were raw material. With so little exports
besides raw materials, the plastics cluster’s
development continues to be directly linked
to domestic demand for construction inputs,
packaging material and some retailing
products. Imports, on the other hand,
totaled QAR 1.8 billion during 2011, 37.2
per cent of them in the form of raw
materials.
The fiber-glass subsector, in particular,
shows an interesting pattern of import-
substitution. As can be seen, its share of
imports declined consistently from 18.9 per
cent in 2008 to around half of that in 2011.
This was accompanied by a more than
seven-fold increase in investment during
the last five years (totaling US$ 54.3 million
in 2012). As a result, the number of
operating plants increased from 10 in 2007
to 16 in 2012. Clearly, the fiber-glass
subsector expanded to supply domestic
demand, most of it supported by the boost
in construction activities during 2007-2010.
Overall plastics exports significantly
outweighed imports during 2007-2011 due
to the size of (low value-added) raw
material exports (especially in 2011, which
saw a 61.2 per cent increase compared to
2010). In 2011, most of these exports
headed to China (19 per cent), India (10.9
per cent), UAE (6 per cent), Saudi Arabia
(5.2 per cent), Thailand, Turkey and France
(all of them with less than 4 per cent).
It should be noted that, notwithstanding the
impact of raw materials, plastics imports
outweighed non-raw plastics materials,
suggesting that the industry is far from
being self-sufficient. In 2011, the main
export markets of final plastic products to
Qatar were China, Saudi Arabia, UAE and
the U.S. (in that order).
Accordingly, the trade balance is largely
impacted by activity in the raw materials
subsector. In fact, the overall trade balance
averaged QAR 3,885 million during 2007-
2012 but, when raw materials were
excluded, the balance turned negative (an
average of QAR 1,149 million). That is, a
QAR 5,034 million average swing.
0%
5%
10%
15%
20%
25%
30%
35%
2007 2008 2009 2010 2011
Primary forms Plates, sheets & films Pipes and pipes fittings
Builders' plastics Bags and packing products Fiberglass products
Other plastic products
Source: QDB calculations based on QSA and GOIC data
Structure of Plastic Imports , 2007-2011
Import Share (%)
...But Not So Much Amongst Imports
0
1,000
2,000
3,000
4,000
5,000
6,000
7,000
8,000
9,000
10,000
0
1,000
2,000
3,000
4,000
5,000
6,000
7,000
8,000
9,000
10,000
2007 2008 2009 2010 2011
Millions
Import Export
Source: QDB calculations based on QSA and GOIC
data
Qatar's Overall Plastics Trade, 2007-2011
QAR mn. QAR mn.
The Impact of Raw Material Exports on the Trade Balance is Significant
0
200
400
600
800
1,000
1,200
1,400
1,600
1,800
2,000
2007 2008 2009 2010 2011
Import Export
Source: QDB calculations based on QSA and GOIC data
Qatar's Overall Plastics Trade (Excluding Raw
Materials), 2007-2011
QAR mn.
Downstream Sub-Sectors Still Rely on Imports