1. ZacheryGreer
Physics
p. 7
Effect of Temperature on Aluminum Tuning Fork
In thisexperiment,atuningforkwasplacedinvarioustemperaturestosee if achange in
frequencywouldoccurwhenstruckwitharubberstopper. The changesof frequencywillbe based
on the Youngsmodulus,whichstatesthatdifferentmetalshave differentflexibilitiesat different
temperatures. OccurringtoYoung’sModulus,the heatingof differentmetalscausesthe
intermolecularbondstobe weakened,causingthe metal tobecome more flexible.
Wavesare transfersof energythroughspace andtime. Theycause the atoms to vibrate
whichcausesenergytopass fromone molecule tothe next. The wave lengthof awave is
determinedbywhenone phase of the wave isrepeated;forexample the wave lengthcanbe
measuredby the distance betweenthe firstcrestof a wave to the secondcrest. The frequencyof a
wave isdefined ashowmanywavesare producedover a certainperiodof time. The frequencyof a
wave ismeasuredinHertz(Hz). The formulausedto findHertzis seenbelow with f representing
frequencyand Trepresentsthe periodof the wave.
𝑓 =
1
𝑇
Equation1:
Tuningforksare made to produce resonance at a certainfrequencysomusicianscantune
theirinstruments. The frequencyof eachtuningforkdependsonitsdimensionsandthe material
that the tuningforkis made outof. The formulausedto findthe frequencyof the tuningforkisseen
belowwith f isthe frequencythe forkvibratesatinhertz,A isthe cross-sectional areaof the prongs
(tines) in square metres,listhe lengthof the prongsin metres,Eis the Young'smodulus of the
material the forkismade from in pascals,ρ isthe densityof the material the forkismade fromin
kilogrammespercubicmetre Risthe radiusof the prongs inmetres(Wikipedia).
Equation2:
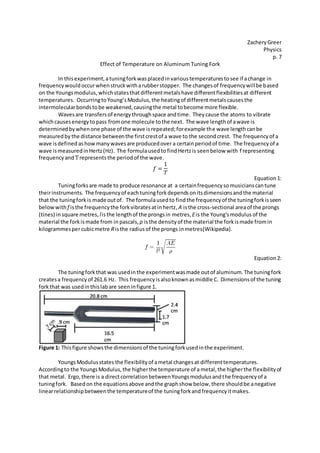
The tuningforkthat was usedinthe experimentwasmade outof aluminum.The tuningfork
createsa frequencyof 261.6 Hz. This frequencyisalsoknownasmiddle C. Dimensionsof the tuning
forkthat was usedinthislabare seeninfigure 1.
Figure 1: Thisfigure showsthe dimensionsof the tuningforkusedinthe experiment.
YoungsModulusstates the flexibilityof ametal changesat differenttemperatures.
Accordingto the YoungsModulus,the higherthe temperature of a metal,the higherthe flexibilityof
that metal. Ergo,there is a directcorrelationbetweenYoungsmodulusandthe frequencyof a
tuningfork. Basedon the equationsabove andthe graphshow below,there shouldbe anegative
linearrelationshipbetweenthe temperatureof the tuningforkandfrequencyitmakes.
2. Figure 2: Thisis a graph that showsYoung’sModulusonmanydifferenttemperatures.
Design
Procedures:
A piece of tape wasput on a 261.6 Hz tuningforkat the handle sothe person’sbodyheat
wouldnothave an effectonthe experiment. The tuningforkwasthenputintoa plasticbag.
Ethanol was thenaddedtoa beaker,anddryice was mixedin. A thermocouple wasplacedinside
the ethanol torecord the temperature. Once the temperaturegotclose to -50 ˚C,the tuningfork
and the bag were putintothe dry ice ethanol bath. The bag andtuningforkwere place inthe
ethanol foraround5 minutesandthenthe tuningforkwastakenout andimmediatelyhitbya
rubberstopperinfrontof a microphone thatrecordedthe frequency. Thiswasrepeated3other
times. Waterwas thenaddedtothe ethanol dryice bath,causingthe temperature decrease. Once
the temperature rose toaround -25˚C, the tuningforkwas takenoutof the bag and hitwitha
rubberstopperimmediately. Thiswasdone 3 timesand eachtime the data and temperature was
recorded. More waterwasthenaddeduntil the temperature decreased toaround -10˚C. The
tuningforkwas takenoutfrom the bag andhit 3 timesand eachtime the data and temperature was
recorded. The bag and the tuningforkwere thentakenoutof thatbeakerand putintoa beakerthat
containedwater. The tuningforkwasleftinthe bag that was inthe room temperature water,which
was around25˚C. The tuningforkwas takenoutfrom the bag and hit3 timesandeachtime the
data and temperature wasrecorded. Once the temperaturewasaround10˚C, the tuningforkwas
takenout fromthe bag and hit3 timesandeach time the data andtemperature wasrecorded.
Around800ml of waterwas thenputintoa waterheater andheatedupto around 50˚C. The tuning
forkand the bag were putinto the waterfor around5 minutes. The tuningforkwastakenoutfrom
the bag and hit3 timesandeach time the data andtemperature wasrecorded. Thisprocesswas
repeatedonce more whenthe temperatureof the waterwasaround81˚C
The temperature variable wasmeasuredusingathermocouple. The temperature during
each trial wascarefullywatchedtomake sure that itdidnot change. The temperature valuewas
takeneach time the tuningforkwashit. The frequencyof eachtrial wasmeasuredusinga
microphone. The frequencywasrecordedeachtime the tuning forkwashitwiththe rubber
stopper. The tuningforkwas hit3 timesateach temperature. The range forthisexperimentwas
130˚ C, rangingfrom -49˚ to 81˚C.
3. Variables:
Independent:The temperature of the tuningfork
DependentVariable: The frequencyof the tuningfork
Control:
-TuningFork
-Microphone usedtorecordfrequency
- Same plasticbagsused
Data Collection
Table 1: This table showsthe resultsof the experiment
Frequency of Tuning Forks (±.5 Hz)
Temperatue (± .5
˚C) Trial 1 Trial 2 Trial 3 Average
−49˚C 265.5 264.9 264.9 265.1
−26˚C 263.0 263.0 263.0 263.0
−10˚C 262.5 262.5 262.5 262.5
10˚C 262.5 262.5 262.5 262.5
25˚C 261.8 261.8 261.8 261.8
50˚C 261.2 260.6 260.6 260.8
81˚C 258.8 258.8 258.2 258.6
Figure 3: Sample FFTusedto findthe frequency
Figure 4: Thisgraph showsthe resultsof the experimentinthe formof a graph
4. Conclusion
The resultsfromthe experimentshow thatthere isa negative linearcorrelationbetween
the temperature of the tuningforktothe frequencyitproduceswhenhitwitharubberstopper. The
negative linerrelationshipissimilartothe relationshipfoundinYoung’sModulus. Since the Young’s
Modulusisusedinequationone tofindthe frequencyof atuning forkwhenit is struck,and the
temperature effectsYoung’smodulus,thereisadirectnegative linearrelationship betweenthe two,
whichisproveninfigure4. Withf equalingthe frequencyinHertz, andT equalingtemperature in
degreesCelsius,the equationusedtofindthe frequencyof the tuningforkatdifferentdegrees in
Celsiusisseenbelow.
f= (-0.0434 T ±.005Hz) + 262.5Hz± .5
Equation3
Evaluation:
The resultsin the data couldhave errors for multiple reasons. Duringthe experiment,the
tuningforkwas notput intoeachliquidforthe same amountof time. However,the tuningforkwas
believedtobe leftineachliquidforalongenoughtime sothat the tuningforkcouldreach its
correct temperature. Anotherissue inthe datawasthat the exacttemperature of the tuningfork
was nevermeasured,onlythe liquidstemperaturewasmeasured. The lastmajorflaw inthis
experimentwasthatwhenthe tuningforkwastakenoutof the bag that was putintothe liquid,
there wascondensationonthe tuningfork,whichcouldhave affectedthe frequencyitproduced
whenthe tuningforkwas hit withthe rubberstopper. Basedoff of these issuesthatwere discussed
above andthe uncertaintiesthatwere recorded,there isafairlevel of certaintythatthe resultsof
thisexperimentare accurate. Thisisalso due to the fact that the line of bestfitdidnotgo perfectly
thougheach point,insteaditwentthrougheachpointwithuncertainties.
Limitations:
The data for thisexperimentislimitedtoaluminumtuningforkswithafrequencyof 261.6.
Thisis because if a tuningforkismade out of a differentmaterial,thenitsflexibilityatdifferent
temperatureschanges. If a tuningforkisat a differentfrequency,thenthe change infrequencymay
vary. However,evenif atuningforkisat a differentfrequencyormade of a differenttemperature,
the resultsfromthisexperimentshouldbe similar. There shouldstill be anegative linearcorrelation
betweenthe temperature of the tuningforkand the frequencyitproduceswhenhitwitharubber
stoppernomatter whatmetal isbeingusedorwhat the original frequencyof the tuningforkis.
FurtherResearch:
In thisfieldthere couldbe more researchdone byusinghigherandlowertemperaturesto
testthe frequencyof stucktuningforks. Furtherresearchshouldalsobe done byrepeatingthis
experimentwithatuningforkmade froma differentmetal orusinga tuningforkwitha different
room temperature frequency.
Work Cited:
“TuningFork.”Wikipedia.October17, 2010. . October17, 2010.
<http://en.wikipedia.org/wiki/Tuning_fork>