High Class Call Girls Nagpur Grishma Call 7001035870 Meet With Nagpur Escorts
Nirma Limited Working Capital Management
1. NIRMA LIMITED-Working Capital Management
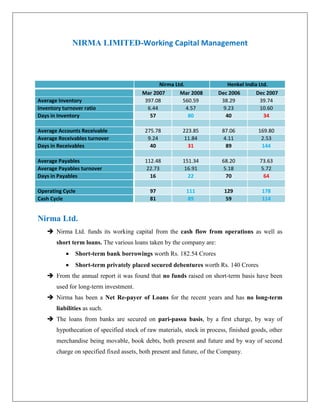
Nirma Ltd. Henkel India Ltd.
Mar 2007 Mar 2008 Dec 2006 Dec 2007
Average Inventory 397.08 560.59 38.29 39.74
Inventory turnover ratio 6.44 4.57 9.23 10.60
Days in Inventory 57 80 40 34
Average Accounts Receivable 275.78 223.85 87.06 169.80
Average Receivables turnover 9.24 11.84 4.11 2.53
Days in Receivables 40 31 89 144
Average Payables 112.48 151.34 68.20 73.63
Average Payables turnover 22.73 16.91 5.18 5.72
Days in Payables 16 22 70 64
Operating Cycle 97 111 129 178
Cash Cycle 81 89 59 114
Nirma Ltd.
Nirma Ltd. funds its working capital from the cash flow from operations as well as
short term loans. The various loans taken by the company are:
Short-term bank borrowings worth Rs. 182.54 Crores
Short-term privately placed secured debentures worth Rs. 140 Crores
From the annual report it was found that no funds raised on short-term basis have been
used for long-term investment.
Nirma has been a Net Re-payer of Loans for the recent years and has no long-term
liabilities as such.
The loans from banks are secured on pari-passu basis, by a first charge, by way of
hypothecation of specified stock of raw materials, stock in process, finished goods, other
merchandise being movable, book debts, both present and future and by way of second
charge on specified fixed assets, both present and future, of the Company.
2. Comments:
1. The days in inventory has increased from 2007 to 2008. The company is taking a lot of
time for converting its raw material to finished goods.
2. The days in receivables have decreased by 9 days which is good. The company
received payments from debtors earlier.
3. The days in payables have increased by 6 days from 2007 to 2008. This is good as the
company deferred payments for 22 days.
4. The operating cycle has increased from 96 days to 111 days. The main reason for this is
the increase in the days in inventory.
5. The cash cycle has also increased. The company would have to look out for funds for
these 89 days.
Thus we have the following:
Days in Inventory -
Days in Receivables +
Days in Payables +
Operating Cycle -
Cash Cycle -
Henkel India:
The working capital requirements of Henkel Ltd. are financed by :
o State Bank Of India
o Standard Chartered Bank
o Deutsche Bank A G
o Citibank N A.
The company’s annual report states that the company has had enhanced working capital
requirements in this fiscal year.
The Company has not received any Long Term Loan other than working capital loan.
Interest costs have shown an increase due to the higher working capital requirements
(110% increase as compared to last year).
3. Average debt continued to show an increasing trend due to the high working capital
requirements.
The company has reduced short term loans from banks from Rs. 15.55 Crores to Rs.
10.18 Crores in Dec. 2007 as compared to Dec. 2006.
However, the unsecured loans from banks have increased form Rs. 171.12 Crores to
Rs. 282.10 Crores in Dec. 2007 as compared to Dec. 2006.
Bank loans are secured by hypothecation and first charge pari–passu on stocks, book
debts and movable assets of the Company and by creation of an equitable mortgage on
certain immovable assets.
Comments:
1. The days in inventory has decreased from 2007 to 2008. The company is taking less
time for converting its raw material to finished goods.
2. The days in receivables have increased by 55 days which is very bad. The company
received payments from debtors after a long time (144 days).
3. The days in payables have decreased by 6 days from 2007 to 2008. This is bad as the
company has to make payments earlier (within 64 days).
4. The operating cycle has increased from 128 days to 178 days. The main reason for this
is the increase in the days in receivables.
5. The cash cycle has also increased. The company would have to look out for funds for
these 115 days.
Thus we have the following:
Days in Inventory +
Days in Receivables -
Days in Payables -
Operating Cycle -
Cash Cycle -
4. Overall Analysis:
Nirma, being well established in market has high demand and takes more time to
convert raw-materials into finished goods (it is a backward integrated company).
Henkel, on the other hand, is a new company and receives most of its raw-materials
from other suppliers. It has low inventory turnover (probably because of less demand
and less volume to manufacture)
The days in receivables of Nirma Ltd. are very less as compared to Henkel India (nearly
1/3rd). This can be explained by considering the fact that Nirma is an established player in
the market and has better relationships with its distributors and hence has less credit
time as compared to Henkel India who has to give more credit (both in terms of money as
well as time) to its distributors.
Nirma’s operating cycles and cash cycle are lesser than that of Henkel’s again stressing
the fact that Nirma is a well established player in the market and has better operations.
The gap between days in receivables and days in payables for Nirma Ltd. is very less
clearly indicating that the company is stable and uses less of credit to fund its payables
as compared to Henkel, for whom the gap is huge (nearly 60 days) clearly making it
more risky and prone to debt.
5. Appendix:
(All fig. in Rs. Crore) Nirma Ltd. Henkel India Ltd.
Mar Mar Mar Dec Dec Dec
2006 2007 2008 2005 2006 2007
Current assets
Inventories 308.14 486.01 635.16 39.39 37.19 42.28
Receivables 440.95 503.98 416.88 100.5 158.06 276.04
Sundry debtors (outstanding less than six months) 214.43 221.25 196.18 55.32 117.64 222.36
Sundry debtors (outstanding over six months) 7.09 12.14 20.19 1.67 1.27 1.23
Considered doubtful 1.03 1.03 1.03 0.51 1.27 1.63
Sundry debtors (outstanding from group cos) 98.71 0 0 0 0 0
Total Sundry Debtors 319.2 232.36 215.34 56.48 117.64 221.96
Accrued income, lease rent & other receivables 216.13 207.14 176.64 36.61 27.9 40.4
Deposits 3.3 24.09 23.87 6.9 11.25 12.05
Sale of investments & other receivables 0 39.36 0 0 0 0
Expenses paid in advance 100.55 275.29 296.48 1.37 1.57 0
Loans & advances 0.00 4.62 3.87 0.47 0.33 0.35
Cash & bank balance 271.17 62.77 72.65 2.11 0.46 0.63
TOTAL 1,120.81 1,332.67 1,425.04 143.84 197.61 319.30
Current liabilities & provisions
Sundry creditors 87.59 137.37 165.31 61.30 75.10 72.15
Deposits & advances from customers &
2.69 34.8 29.09 0.00 0.00 0.00
employees
Interest accrued 1.04 0.21 0.65 0.00 0.00 0.00
Share application money/advances 0.22 0.14 0.14 0.00 0.00 0.00
Other current liabilities 0.23 42.13 0.32 2.56 6.75 6.97
Provisions 77.18 125.23 129.68 3.33 3.68 4.43
TOTAL 168.95 339.88 325.19 67.19 85.53 83.55
Net Current Assets (Working Capital) 951.86 992.79 1,099.85 76.65 112.08 235.75
Sales 2244.5 2548.08 2651.15 304.16 357.43 430.33
Cost of Goods Sold 2060.86 2556.93 2559.3 304.07 353.5 421.02
References:
1. CMIE-Prowess
2. www.moneycontrol.com
3. www.livemint.com
4. Corporate Finance- RWJK