SlideShare a Scribd company logo
1 of 1
Download to read offline
Leading, preparing & supporting
the tourism industry
for success & sustainability
The 2011 Irish Fair of Minnesota attracted approximately 100,000 visitors
to Harriet Island Regional Park August 11-14. To inform marketing &
programming efforts, a visitor profile was conducted.
The 2011 questionnaire was the second such profile of Irish Fair attendees
conducted in a 5-year span (the previous questionnaire was conducted
during the 2007 event). For the 2011 visitor profile, several attendee items
were of key interest:
Fair experience:
• Majority repeat attendees (62.6%)
• Diverse set of activities (Figure 1)
• High satisfaction (Figure 2)
• Expenditures across a range of
categories (Figure 4)
• Average 5 hour stay at fair
• Top reasons for attending the fair:
o Celebrate Irish heritage (19%)
o Know a performer (14%)
o Live music (13%)
Information sources:
• Fair information primarily
disseminated through social
networks.
• Repeat attendees more likely to
use Irish-community sources
(Table 1).
Origin:
• 80% within 25 miles (Figure 3) • 5% traveling 50 miles or more
Demographics:
• Female (53.1%)
• non-Hispanic (97.5%)
• Average age 43 years
• White (89.1%)
• of Irish descent (69.3%)
• $50,000-$74,999 income (19%)
Table 1 Comparison of information
sources used by repeat and first-time
attendees to 2011 Irish Fair (n=532)
% using source
Information source
Repeat
(n=326)
1st-time
(n=195)
Word of mouth 48.5 43.6
Other 24.2 27.7
Newspaper 19.0 10.8 *
Pioneer Press 10.1 5.6
Irish Fair Webpage 15.0 5.6 ***
Irish Bar/Restaurant 12.0 6.2 *
Irish Gazette 8.9 1.0 ***
Radio 8.3 4.6
TV 7.1 10.3
Facebook 7.1 6.2
Poster/Flyer 7.1 2.6 *
Indicates difference is significant at
* p .05. ** p .01. *** p .001
Willingness to pay admission potential admission charge:
• Majority of attendees willing to pay potential charge (Figure 5).
Compared to 2007 visitors, 2011 attendees…
• Younger (43 years vs. 47; p = .001)
• Less reliant on newspapers for information (16% vs. 41%; p < .001).
• Spent more on parking ($9.71 vs. $7.29; p < .000) but less on souvenirs
($39.91 vs. $50.87; p < .05)
Results: Fair Attendees and Experience
A collaboration of the University of Minnesota Extension
& College of Food, Agricultural & Natural Resource Sciences
Profile of the 2011 Irish Fair of Minnesota
Andrew Oftedal, Graduate Research Assistant & Ingrid Schneider, Ph.D.
Methods
Onsite questionnaire: Based on 2007 questionnaire
Sampling: Varied to ensure coverage across festival activities and grounds.
Administered onsite by trained volunteers
Response: 550 completed (70% compliance rate)
Introduction & Purpose
Live Music
40%
Dance Stage
14%
Food & Beverages
13%
People Watching
8%
Sports Area
7%
Vendor Marketplace
4%
Cultural Area
4%
Other
4%
Children's Activities
2%
Pub Experience
3%
Mass
1%
Figure 1 Most enjoyable attributes of the 2011 Irish Fair of Minnesota
(n=528)
17%
14%
55%
13%
2%
No
answer
Zero $1-5 $6-10 >$11
2% 5% 6%
30%
54%
77%
$21 $20 $20
$25
$10
$30
Lodging (in
$10s)
Off-site food
& beverages
Other Souvenirs Parking On-site food
& beverages
Spent at least
$1.00 (%)
Median
dollars spent
($)
Figure 4 Attendee expenditures at the 2011 Irish Fair of Minnesota
(n=528)
Figure 5 Range of admission
charges 2011 Irish Fair of
Minnesota attendees willing to
pay (n=532)
Special thanks to Sarah VanSickle, Angela Mens-Eastman, and the many
volunteers who assisted with data collection. Additional thanks to Art
Nash of the U of M Community Vitality Center for working with the zip
code data. All photos courtesy of the Irish Fair of Minnesota.
Results: Comparisons
Very
Satisfied
56%
Satisfied
34%
Very
Dissatisfied
6%
Unsure
3%
Dissatisfied
1%
Figure 2 Satisfaction with 2011
Irish Fair of Minnesota (n=522)
Implications
Admission charge would likely impact visitation:
• 30.8% would not pay a charge or refused to answer the question.
• 13% cited the fair’s affordability as their main reason for attending.
Marketing focus:
• “Live music” and “food & beverages” most enjoyable but not main
reasons for attending. Marketing should use a mix of customer pulls.
Shift in information sources:
• 2011 attracted a younger demographic who relied heavily upon internet-
based sources for information
• Word of mouth still significant information source
Acknowledgements
Figure 3 Regional map of attendee
places of residence (n=513)
Results: Experiences and Expenditures
• Demographics
• Experiences & satisfaction
• Expenditures
• Information sources
• Willingness to pay admission
• Comparison of 2007 & 2011 visitors
Leading, preparing & supporting the
tourism industry for success & sustainability

More Related Content

More from University of Minnesota Tourism Center

The Benefits & Difficulties of Adopting Sustainable Practices Among the MN To...
The Benefits & Difficulties of Adopting Sustainable Practices Among the MN To...The Benefits & Difficulties of Adopting Sustainable Practices Among the MN To...
The Benefits & Difficulties of Adopting Sustainable Practices Among the MN To...University of Minnesota Tourism Center
 
TAPPING into Community Tourism Potential in Rural Minnesota's Communities
TAPPING into Community Tourism Potential in Rural Minnesota's Communities TAPPING into Community Tourism Potential in Rural Minnesota's Communities
TAPPING into Community Tourism Potential in Rural Minnesota's Communities University of Minnesota Tourism Center
 
Perceptions of Invasive Species & Their Control Among the MN Tourism Industry
Perceptions of Invasive Species & Their Control Among the MN Tourism IndustryPerceptions of Invasive Species & Their Control Among the MN Tourism Industry
Perceptions of Invasive Species & Their Control Among the MN Tourism IndustryUniversity of Minnesota Tourism Center
 
State of Sustainable Tourism: Assessing waste minimization practices among to...
State of Sustainable Tourism: Assessing waste minimization practices among to...State of Sustainable Tourism: Assessing waste minimization practices among to...
State of Sustainable Tourism: Assessing waste minimization practices among to...University of Minnesota Tourism Center
 
Are Tourism Businesses Using the Internet? An Initial Assessment of Digital P...
Are Tourism Businesses Using the Internet? An Initial Assessment of Digital P...Are Tourism Businesses Using the Internet? An Initial Assessment of Digital P...
Are Tourism Businesses Using the Internet? An Initial Assessment of Digital P...University of Minnesota Tourism Center
 
Waste, water, and energy benchmarking and conservation opportunities for Minn...
Waste, water, and energy benchmarking and conservation opportunities for Minn...Waste, water, and energy benchmarking and conservation opportunities for Minn...
Waste, water, and energy benchmarking and conservation opportunities for Minn...University of Minnesota Tourism Center
 

More from University of Minnesota Tourism Center (20)

Dr. Schneider MRCA Keynote
Dr. Schneider MRCA KeynoteDr. Schneider MRCA Keynote
Dr. Schneider MRCA Keynote
 
Seasonal Residents and Economic Development
Seasonal Residents and Economic DevelopmentSeasonal Residents and Economic Development
Seasonal Residents and Economic Development
 
Quality of life & opportunities to position parks & recreation
Quality of life & opportunities to position parks & recreationQuality of life & opportunities to position parks & recreation
Quality of life & opportunities to position parks & recreation
 
Minnesota Museums Help Communities Grow Factsheet
Minnesota Museums Help Communities Grow Factsheet Minnesota Museums Help Communities Grow Factsheet
Minnesota Museums Help Communities Grow Factsheet
 
Profiling Festivals & Events in Minnesota: Select Results
Profiling Festivals & Events in Minnesota: Select ResultsProfiling Festivals & Events in Minnesota: Select Results
Profiling Festivals & Events in Minnesota: Select Results
 
The Benefits & Difficulties of Adopting Sustainable Practices Among the MN To...
The Benefits & Difficulties of Adopting Sustainable Practices Among the MN To...The Benefits & Difficulties of Adopting Sustainable Practices Among the MN To...
The Benefits & Difficulties of Adopting Sustainable Practices Among the MN To...
 
TAPPING into Community Tourism Potential in Rural Minnesota's Communities
TAPPING into Community Tourism Potential in Rural Minnesota's Communities TAPPING into Community Tourism Potential in Rural Minnesota's Communities
TAPPING into Community Tourism Potential in Rural Minnesota's Communities
 
Ripple Effect Mapping of the Tourism Assessment Program
Ripple Effect Mapping of the Tourism Assessment ProgramRipple Effect Mapping of the Tourism Assessment Program
Ripple Effect Mapping of the Tourism Assessment Program
 
Emerald Ash Borer Interviews
Emerald Ash Borer InterviewsEmerald Ash Borer Interviews
Emerald Ash Borer Interviews
 
Emerald Ash Borer Interviews
Emerald Ash Borer Interviews Emerald Ash Borer Interviews
Emerald Ash Borer Interviews
 
Perceptions of Invasive Species & Their Control Among the MN Tourism Industry
Perceptions of Invasive Species & Their Control Among the MN Tourism IndustryPerceptions of Invasive Species & Their Control Among the MN Tourism Industry
Perceptions of Invasive Species & Their Control Among the MN Tourism Industry
 
State of Sustainable Tourism: Assessing waste minimization practices among to...
State of Sustainable Tourism: Assessing waste minimization practices among to...State of Sustainable Tourism: Assessing waste minimization practices among to...
State of Sustainable Tourism: Assessing waste minimization practices among to...
 
Welcome to the New Tradition: Where we are & Where we are heading to
Welcome to the New Tradition: Where we are & Where we are heading toWelcome to the New Tradition: Where we are & Where we are heading to
Welcome to the New Tradition: Where we are & Where we are heading to
 
Quality of Life: Assessment for Transportation Performance Measures
Quality of Life: Assessment for Transportation Performance MeasuresQuality of Life: Assessment for Transportation Performance Measures
Quality of Life: Assessment for Transportation Performance Measures
 
Perceived Bicycle Safety in Minnesota
Perceived Bicycle Safety in MinnesotaPerceived Bicycle Safety in Minnesota
Perceived Bicycle Safety in Minnesota
 
Economic Impact of the 3M Championship Golf Tournament
Economic Impact of the 3M Championship Golf TournamentEconomic Impact of the 3M Championship Golf Tournament
Economic Impact of the 3M Championship Golf Tournament
 
Are Tourism Businesses Using the Internet? An Initial Assessment of Digital P...
Are Tourism Businesses Using the Internet? An Initial Assessment of Digital P...Are Tourism Businesses Using the Internet? An Initial Assessment of Digital P...
Are Tourism Businesses Using the Internet? An Initial Assessment of Digital P...
 
Chisago Lakes Area: Tourism Assessment Program Case Study 2008-2011
Chisago Lakes Area: Tourism Assessment Program Case Study 2008-2011Chisago Lakes Area: Tourism Assessment Program Case Study 2008-2011
Chisago Lakes Area: Tourism Assessment Program Case Study 2008-2011
 
Understanding & Aligning Transportation with Quality of Life
Understanding & Aligning Transportation with Quality of LifeUnderstanding & Aligning Transportation with Quality of Life
Understanding & Aligning Transportation with Quality of Life
 
Waste, water, and energy benchmarking and conservation opportunities for Minn...
Waste, water, and energy benchmarking and conservation opportunities for Minn...Waste, water, and energy benchmarking and conservation opportunities for Minn...
Waste, water, and energy benchmarking and conservation opportunities for Minn...
 

Profile of the 2011 Irish Fair of Minnesota

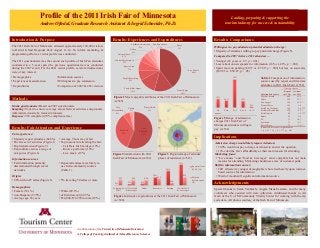
  • 1. Leading, preparing & supporting the tourism industry for success & sustainability The 2011 Irish Fair of Minnesota attracted approximately 100,000 visitors to Harriet Island Regional Park August 11-14. To inform marketing & programming efforts, a visitor profile was conducted. The 2011 questionnaire was the second such profile of Irish Fair attendees conducted in a 5-year span (the previous questionnaire was conducted during the 2007 event). For the 2011 visitor profile, several attendee items were of key interest: Fair experience: • Majority repeat attendees (62.6%) • Diverse set of activities (Figure 1) • High satisfaction (Figure 2) • Expenditures across a range of categories (Figure 4) • Average 5 hour stay at fair • Top reasons for attending the fair: o Celebrate Irish heritage (19%) o Know a performer (14%) o Live music (13%) Information sources: • Fair information primarily disseminated through social networks. • Repeat attendees more likely to use Irish-community sources (Table 1). Origin: • 80% within 25 miles (Figure 3) • 5% traveling 50 miles or more Demographics: • Female (53.1%) • non-Hispanic (97.5%) • Average age 43 years • White (89.1%) • of Irish descent (69.3%) • $50,000-$74,999 income (19%) Table 1 Comparison of information sources used by repeat and first-time attendees to 2011 Irish Fair (n=532) % using source Information source Repeat (n=326) 1st-time (n=195) Word of mouth 48.5 43.6 Other 24.2 27.7 Newspaper 19.0 10.8 * Pioneer Press 10.1 5.6 Irish Fair Webpage 15.0 5.6 *** Irish Bar/Restaurant 12.0 6.2 * Irish Gazette 8.9 1.0 *** Radio 8.3 4.6 TV 7.1 10.3 Facebook 7.1 6.2 Poster/Flyer 7.1 2.6 * Indicates difference is significant at * p .05. ** p .01. *** p .001 Willingness to pay admission potential admission charge: • Majority of attendees willing to pay potential charge (Figure 5). Compared to 2007 visitors, 2011 attendees… • Younger (43 years vs. 47; p = .001) • Less reliant on newspapers for information (16% vs. 41%; p < .001). • Spent more on parking ($9.71 vs. $7.29; p < .000) but less on souvenirs ($39.91 vs. $50.87; p < .05) Results: Fair Attendees and Experience A collaboration of the University of Minnesota Extension & College of Food, Agricultural & Natural Resource Sciences Profile of the 2011 Irish Fair of Minnesota Andrew Oftedal, Graduate Research Assistant & Ingrid Schneider, Ph.D. Methods Onsite questionnaire: Based on 2007 questionnaire Sampling: Varied to ensure coverage across festival activities and grounds. Administered onsite by trained volunteers Response: 550 completed (70% compliance rate) Introduction & Purpose Live Music 40% Dance Stage 14% Food & Beverages 13% People Watching 8% Sports Area 7% Vendor Marketplace 4% Cultural Area 4% Other 4% Children's Activities 2% Pub Experience 3% Mass 1% Figure 1 Most enjoyable attributes of the 2011 Irish Fair of Minnesota (n=528) 17% 14% 55% 13% 2% No answer Zero $1-5 $6-10 >$11 2% 5% 6% 30% 54% 77% $21 $20 $20 $25 $10 $30 Lodging (in $10s) Off-site food & beverages Other Souvenirs Parking On-site food & beverages Spent at least $1.00 (%) Median dollars spent ($) Figure 4 Attendee expenditures at the 2011 Irish Fair of Minnesota (n=528) Figure 5 Range of admission charges 2011 Irish Fair of Minnesota attendees willing to pay (n=532) Special thanks to Sarah VanSickle, Angela Mens-Eastman, and the many volunteers who assisted with data collection. Additional thanks to Art Nash of the U of M Community Vitality Center for working with the zip code data. All photos courtesy of the Irish Fair of Minnesota. Results: Comparisons Very Satisfied 56% Satisfied 34% Very Dissatisfied 6% Unsure 3% Dissatisfied 1% Figure 2 Satisfaction with 2011 Irish Fair of Minnesota (n=522) Implications Admission charge would likely impact visitation: • 30.8% would not pay a charge or refused to answer the question. • 13% cited the fair’s affordability as their main reason for attending. Marketing focus: • “Live music” and “food & beverages” most enjoyable but not main reasons for attending. Marketing should use a mix of customer pulls. Shift in information sources: • 2011 attracted a younger demographic who relied heavily upon internet- based sources for information • Word of mouth still significant information source Acknowledgements Figure 3 Regional map of attendee places of residence (n=513) Results: Experiences and Expenditures • Demographics • Experiences & satisfaction • Expenditures • Information sources • Willingness to pay admission • Comparison of 2007 & 2011 visitors Leading, preparing & supporting the tourism industry for success & sustainability