Pakistan
- 1. Evolution of the rural, urban and total population, 1950-2030
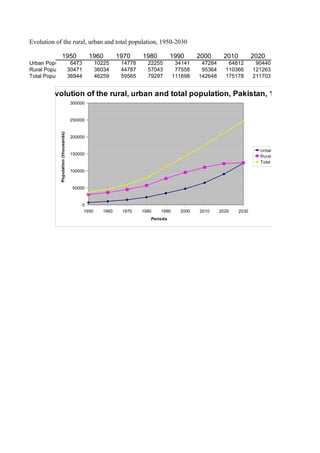
1950 1960 1970 1980 1990 2000 2010 2020
Urban Population6473 10225 14778 22255 34141 47284 64812 90440
Rural Population30471 36034 44787 57043 77558 95364 110366 121263
Total Population36944 46259 59565 79297 111698 142648 175178 211703
Evolution of the rural, urban and total population, Pakistan, 1950-2030
300000
250000
Population (thousands)
200000
Urban Population
150000
Rural Population
Total Population
100000
50000
0
1950 1960 1970 1980 1990 2000 2010 2020 2030
Periods
- 2. 2030
122572
123751
246322
kistan, 1950-2030
Urban Population
Rural Population
Total Population
030
- 3. 1950 1960 1970 1980 1990 2000 2010 2020 2030
Urban Population 22.1
17.5 24.8 28.1 30.6 33.1 37 42.7 49.8
Percentage of population of Pakistan residing
in urban areas, 1950-2030
60
Percentage of urban population
50
40
30
20
10
0
1950 1960 1970 1980 1990 2000 2010 2020 2030
Periods
- 4. 1950-1955 1955-1960 1960-1965 1965-1970 1970-1975 1975-1980 1980-1985 1985-1990 1990-1995 1995-2000
4.5 4.64 3.7 3.67 3.93 4.26 4.44 4.12 3.23 3.29
Average annual rate of change of the urban population, Pakistan, 1950-2030
5
4
3
Annual Rate
2
1
0
5
5
5
85
5
05
5
5
95
96
97
99
01
02
20
19
-1
-1
-1
-1
-2
-2
-
-
50
60
70
80
90
00
10
20
20
19
19
19
19
19
20
20
Periods
- 5. 2000-2005 2005-2010 2010-2015 2015-2020 2020-2025 2025-2030
3.04 3.27 3.35 3.32 3.17 2.91
- 6. 1950 1955 1960 1965 1970 1975 1980 1985 1990
Faisalabad 0.5 0.6 0.9 1 1.2 1.3 1.4 1.4 1.4
Gujranwala 0.3 0.4 0.4 0.5 0.5 0.6 0.7 0.7 0.8
Hyderabad 0.6 0.8 0.9 1 1 1 0.9 0.9 0.9
Karachi 2.8 3.5 4 4.6 5.2 5.8 6.4 6.4 6.4
Lahore 2.3 2.5 2.7 3 3.3 3.5 3.6 3.6 3.6
Multan 0.5 0.6 0.7 0.8 0.8 0.9 0.9 0.9 0.9
Peshawar 0.4 0.4 0.5 0.5 0.4 0.5 0.7 0.7 0.7
Rawalpindi 0.6 0.7 0.7 0.8 0.9 1 1 1 1
Percentage of urban population residing in each urban agglomeration with 750,00
9
8
7
Percentage of urban population
6
5
4 Faisalabad Gujranwala Hyderabad
3
2
1
0
1955 1965 1975 1985 1995 2005 2015
1950 1960 1970 1980 1990 2000 2010
Periods
- 7. 1995 2000 2005 2010 2015
1.4 1.5 1.6 1.6 1.7
0.8 0.9 0.9 1 1
0.9 0.9 0.9 0.9 1
6.7 7 7.4 7.6 7.8
3.7 3.8 4 4.1 4.3
0.9 0.9 0.9 1 1
0.7 0.7 0.8 0.8 0.9
1 1.1 1.1 1.2 1.2
ation with 750,000 or more inhabitants in Pakistan, 1950-2015
Gujranwala Hyderabad Karachi Lahore Multan Peshawar Rawalpindi