Dista Insight Feature Overview.pdf
•
0 likes•11 views

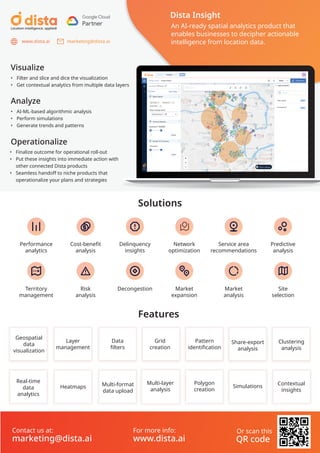
Derive business intelligence with geospatial analytics to get deeper data visualization, improve operational efficiency, and uncover growth opportunities.

Recommended
Recommended
More Related Content
Similar to Dista Insight Feature Overview.pdf
Similar to Dista Insight Feature Overview.pdf (20)
More from Dista
More from Dista (20)
Recently uploaded
Recently uploaded (20)
Dista Insight Feature Overview.pdf
- 1. Dista Insight An AI-ready spatial analytics product that enables businesses to decipher actionable intelligence from location data. Visualize • Filter and slice and dice the visualization • Get contextual analytics from multiple data layers Analyze • AI-ML-based algorithmic analysis • Perform simulations • Generate trends and patterns Operationalize Solutions Features Performance analytics Cost-benefit analysis Network optimization Service area recommendations Delinquency insights Territory management Risk analysis Decongestion Market expansion Market analysis Site selection Predictive analysis Pattern identification Layer management Data filters Grid creation Geospatial data visualization Share-export analysis Real-time data analytics Heatmaps Multi-format data upload Multi-layer analysis Polygon creation Simulations Contextual insights Clustering analysis Location intelligence, applied! • Finalize outcome for operational roll-out • Put these insights into immediate action with other connected Dista products • Seamless handoff to niche products that operationalize your plans and strategies Tejas Gupta Khushali Kal Wasim Khan Tejas Gupta Khushali Kal Contact us at: marketing@dista.ai For more info: www.dista.ai Or scan this QR code
- 2. Key features • Upload geo-tagged customer, prospect, and sales data at various levels • Define clustering parameters • View clusters based on defined parameters • Overlay and adjust clusters based on census and other market data 02 Key features • Geospatial visualizations for your business operations, such as delivery, outlets, etc. • Define and refine thematic maps • Multiple data filters for drill down and contextual analysis Clustering analysis Data visualization 01 Use clustering analysis to identify and define patterns that help you make informed business decisions Key features • Generate polygons and recommend centroids in a logistically optimal manner • Freeze polygons for service qualification, sales team allocation, sales coverage, and beat planning • Performance-based polygon classifications for management, visibility, and decisioning Polygon mapping 03 Data driven polygon maps to check business performance
- 3. Trends and patterns 04 Key features AI-ML based algorithmic analysis generating trends and patterns • Perform cost-benefit analysis • Perform simulations • Generate recommended serviceable areas, territory definitions, etc. • Finalize outcomes for operational roll-out Key features • Get smart recommendations for next best steps • Share key insights and reports with relevant leaders and functions Smart operations 05 Plan your next steps with intelligent, system-generated recommendations Heatmaps 06 Key features Capture or upload data, categorize it based on customer or business criteria for insightful decisioning • Color-coded based on density, ticket size, etc. • Point density and line density to identify areas of high and low intensities • Identify pockets or new markets for business expansion
- 4. Geo-hierarchy management 08 Key features Define and assign access as per roles and responsibilities • Protect sensitive data • Get information to relevant functions • Role-based access • Define organizational hierarchy Leverage layers individually or collectively for detailed geospatial analysis Key features • Create and manage layers • Pair multiple parameters with location data • Save and share geospatial data analysis of multiple layers • Upload multiple file formats for geospatial analysis Layer management 07 Styling and editing 09 Key features • Complete freedom to customize your geospatial analysis dashboards • Define zoom levels • Filter options: logical, range, and business rules • Color and shape options for plotted points Jazz up your reports and insights with a plethora of styling and editing options