Financial Analysis - J.C. Penney Company, Inc., through a subsidiary, operates department stores in the United States and Puerto Rico
•
1 like•473 views

Financial Analysis - J.C. Penney Company, Inc., through a subsidiary, operates department stores in the United States and Puerto Rico

Recommended
Recommended
More Related Content
What's hot
What's hot (18)
Similar to Financial Analysis - J.C. Penney Company, Inc., through a subsidiary, operates department stores in the United States and Puerto Rico
Similar to Financial Analysis - J.C. Penney Company, Inc., through a subsidiary, operates department stores in the United States and Puerto Rico (20)
More from BCV
More from BCV (20)
Recently uploaded
Recently uploaded (20)
Financial Analysis - J.C. Penney Company, Inc., through a subsidiary, operates department stores in the United States and Puerto Rico
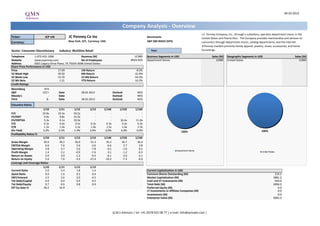
- 1. 04.03.2013 Company Analysis - Overview J.C. Penney Company, Inc., through a subsidiary, operates department stores in the Ticker: JCP UN JC Penney Co Inc Benchmark: United States and Puerto Rico. The Company provides merchandise and services to Currency: New York: JCP, Currency: USD S&P 500 INDEX (SPX) consumers through department stores, catalog departments, and the Internet. JCPenney markets primarily family apparel, jewelry, shoes, accessories, and home Sector: Consumer Discretionary Industry: Multiline Retail Year: furnishings. Telephone 1-972-431-1000 Revenue (M) 12'985 Business Segments in USD Sales (M) Geographic Segments in USD Sales (M) Website www.jcpenney.com No of Employees #N/A N/A Department Stores 12985 United States 12985 Address 6501 Legacy Drive Plano, TX 75024-3698 United States Share Price Performance in USD Price 17.69 1M Return -8.5% 52 Week High 39.50 6M Return -31.9% 52 Week Low 15.70 52 Wk Return -54.3% 52 Wk Beta 1.21 YTD Return -10.2% Credit Ratings Bloomberg HY3 S&P CCC+ Date 28.02.2013 Outlook NEG Moody's - Date - Outlook NEG Fitch B- Date 28.02.2013 Outlook NEG Valuation Ratios 1/10 1/11 1/12 1/13 1/14E 1/15E 1/16E P/E 19.9x 19.3x 59.2x - - - - EV/EBIT 9.4x 9.8x 23.5x - - - - EV/EBITDA 5.4x 6.1x 10.9x - - 16.4x 11.0x P/S 0.3x 0.4x 0.5x 0.3x 0.3x 0.3x 0.3x P/B 1.2x 1.4x 2.2x 1.4x 1.5x 1.6x 2.3x Div Yield 3.2% 2.5% 1.9% 2.0% 0.0% 0.0% 0.0% 100% 100% Profitability Ratios % 1/10 1/11 1/12 1/13 1/14E 1/15E 1/16E Gross Margin 39.4 39.2 36.0 31.3 35.2 36.7 36.4 EBITDA Margin 6.6 7.6 5.6 -3.6 -0.6 2.7 3.8 Operating Margin 3.8 4.7 2.6 -7.8 -4.1 -1.0 0.5 Department Stores Profit Margin 1.4 2.2 -0.9 -7.6 -3.1 -1.2 -0.3 United States Return on Assets 2.0 3.0 -1.2 -9.3 -6.1 -3.9 -3.1 Return on Equity 5.6 7.6 -3.2 -27.4 -16.2 -7.3 -6.0 Leverage and Coverage Ratios 1/10 1/11 1/12 1/13 Current Ratio 2.0 2.4 1.8 1.4 Current Capitalization in USD Quick Ratio 0.9 1.0 0.5 0.4 Common Shares Outstanding (M) 219.3 EBIT/Interest 2.5 3.6 2.0 -4.5 Market Capitalization (M) 3881.2 Tot Debt/Capital 0.4 0.4 0.4 0.5 Cash and ST Investments (M) 930.0 Tot Debt/Equity 0.7 0.6 0.8 0.9 Total Debt (M) 2894.0 Eff Tax Rate % 38.2 34.9 - - Preferred Equity (M) 0.0 LT Investments in Affiliate Companies (M) 0.0 Investments (M) 0.0 Enterprise Value (M) 5845.2 Q.M.S Advisors | tel: +41 (0)78 922 08 77 | e-mail: info@qmsadv.com |
- 2. Company Analysis - Analysts Ratings JC Penney Co Inc Target price in USD Broker Recommendation Buy and Sell Recommendations vs Price and Target Price Price Brokers' Target Price 50 35 100% 18% 17% 16% 16% 14% 14% 15% 15% 45 30 25% 25% 30% 25 80% 36% 40 20 35 15 60% 30 53% 56% 58% 58% 57% 60% 60% 10 62% 25 5 55% 55% 55% 20 40% 50% 0 Telsey Advisory Group Morgan Stanley BMO Capital Markets Maxim Group LLC Barclays Piper Jaffray S&P Capital IQ Atlantic Equities LLP Gilford Securities Macquarie Credit Suisse JPMorgan Oppenheimer & Co Nomura Argus Research Corp EVA Dimensions Northcoast Research Deutsche Bank Buckingham Research Group Robert W. Baird & Co 15 20% 10 29% 28% 26% 26% 29% 25% 25% 24% 20% 20% 5 15% 14% 0% 0 mars.12 avr.12 mai.12 juin.12 juil.12 août.12 sept.12 oct.12 nov.12 déc.12 janv.13 févr.13 Buy Hold Sell Price Target Price Date Buy Hold Sell Date Price Target Price Broker Analyst Recommendation Target Date 28-Feb-13 14% 50% 36% 4-Mar-13 17.69 18.00 Gilford Securities BERNARD SOSNICK sell 1-Mar-13 31-Jan-13 15% 55% 30% 1-Mar-13 17.69 18.00 Morgan Stanley KIMBERLY GREENBERGER Underwt/Cautious 13.00 28-Feb-13 31-Dec-12 20% 55% 25% 28-Feb-13 17.57 18.00 Argus Research Corp CHRISTOPHER GRAJA buy 25.00 28-Feb-13 30-Nov-12 20% 55% 25% 27-Feb-13 21.16 18.25 Robert W. Baird & Co ERIKA K MASCHMEYER neutral 20.00 28-Feb-13 31-Oct-12 25% 60% 15% 26-Feb-13 21.02 18.40 Macquarie LIZABETH DUNN neutral 19.00 28-Feb-13 28-Sep-12 25% 60% 15% 25-Feb-13 21.51 18.40 Buckingham Research Group DAVID J GLICK neutral 15.00 28-Feb-13 31-Aug-12 24% 62% 14% 22-Feb-13 22.47 18.47 Oppenheimer & Co BRIAN NAGEL outperform 30.00 28-Feb-13 31-Jul-12 29% 57% 14% 21-Feb-13 21.55 18.47 S&P Capital IQ JASON ASAEDA hold 20.00 28-Feb-13 29-Jun-12 26% 58% 16% 20-Feb-13 20.19 18.47 Maxim Group LLC RICK SNYDER sell 10.00 28-Feb-13 31-May-12 26% 58% 16% 19-Feb-13 19.61 18.47 Atlantic Equities LLP DANIELA NEDIALKOVA neutral 22.00 28-Feb-13 30-Apr-12 28% 56% 17% 18-Feb-13 19.80 18.47 Piper Jaffray ALEX J FUHRMAN neutral 16.00 28-Feb-13 30-Mar-12 29% 53% 18% 15-Feb-13 19.80 18.47 Telsey Advisory Group DANA TELSEY no rating system 20.00 28-Feb-13 14-Feb-13 19.94 18.71 Northcoast Research JEFFERY STEIN sell 14.00 28-Feb-13 13-Feb-13 19.61 18.56 Credit Suisse MICHAEL B EXSTEIN underperform 15.00 27-Feb-13 12-Feb-13 19.27 18.94 JPMorgan MATTHEW BOSS neutral 15.00 27-Feb-13 11-Feb-13 19.53 18.94 Barclays ROBERT S DRBUL equalweight 20.00 27-Feb-13 8-Feb-13 19.28 18.94 Deutsche Bank PAUL TRUSSELL hold 17.00 15-Feb-13 7-Feb-13 19.50 18.94 BMO Capital Markets WAYNE HOOD market perform 18.00 7-Feb-13 6-Feb-13 19.38 18.94 EVA Dimensions CRAIG STERLING underweight 15-Jan-13 5-Feb-13 19.81 18.94 Nomura PAUL LEJUEZ neutral 18.00 13-Nov-12 4-Feb-13 19.34 20.06 1-Feb-13 19.88 20.06 31-Jan-13 20.33 20.05 30-Jan-13 20.63 20.05 29-Jan-13 21.01 20.05 28-Jan-13 19.22 20.05 25-Jan-13 19.35 20.05 24-Jan-13 19.12 20.05 23-Jan-13 18.35 20.05 22-Jan-13 18.73 20.05 Q.M.S Advisors | tel: +41 (0)78 922 08 77 | e-mail: info@qmsadv.com |
- 3. 04.03.2013 JC Penney Co Inc Company Analysis - Ownership Ownership Type Ownership Statistics Geographic Ownership Distribution Geographic Ownership 1% Shares Outstanding (M) 219.3 United States 82.73% 20% 2% 1% 1% 3% Float 64.5% Unknown Country 5.06% 3% Short Interest (M) 59.7 Switzerland 3.11% 3% Short Interest as % of Float 42.24% Britain 2.94% Days to Cover Shorts 7.28 Germany 1.75% 5% Institutional Ownership 132.31% Canada 0.99% Retail Ownership -33.89% Bermuda 0.87% Insider Ownership 1.58% Others 2.55% 79% Institutional Ownership Distribution 82% Investment Advisor 64.49% Hedge Fund Manager 19.21% Other 11.49% United States Unknown Country Switzerland Institutional Ownership Retail Ownership Insider Ownership Pension Fund (Erisa) 1.97% Britain Germany Canada Pricing data is in USD Others 2.84% Bermuda Others Top 20 Owners: TOP 20 ALL Institutional Ownership Holder Name Position Position Change Market Value % of Ownership Report Date Source Country PERSHING SQUARE CAPI 39'075'771 0 691'250'389 17.81% 03.01.2013 13D UNITED STATES 2% 3% PERSHING SQUARE CAPI 39'075'771 0 691'250'389 17.81% 31.12.2012 13F UNITED STATES VORNADO REALTY TRUST 23'400'000 0 413'946'000 10.67% 08.10.2012 13D UNITED STATES 11% DODGE & COX 20'225'200 -91'350 357'783'788 9.22% 31.12.2012 13F UNITED STATES STATE STREET 17'912'237 -183'174 316'867'473 8.16% 01.03.2013 ULT-AGG UNITED STATES FMR LLC 15'837'049 -2'098'177 280'157'397 7.22% 31.12.2012 ULT-AGG UNITED STATES BLACKROCK 14'568'513 0 257'716'995 6.64% 31.12.2012 ULT-AGG UNITED STATES 19% WELLINGTON MANAGEMEN 13'954'793 11'139'515 246'860'288 6.36% 31.12.2012 13F UNITED STATES 65% HOTCHKIS & WILEY CAP 13'877'917 4'899'442 245'500'352 6.33% 31.12.2012 13F UNITED STATES EVERCORE TRUST COMPA 11'948'829 -239'556 211'374'785 5.45% 31.12.2012 13F UNITED STATES J C PENNEY PROFIT SH 11'699'816 0 206'969'745 5.33% 31.12.2012 13G n/a VANGUARD GROUP INC 9'378'824 506'396 165'911'397 4.27% 31.12.2012 13F UNITED STATES UBS 9'131'960 3'226'159 161'544'372 4.16% 31.12.2012 ULT-AGG GLENVIEW CAPITAL MAN 7'299'112 2'841'900 129'121'291 3.33% 31.12.2012 13F UNITED STATES Investment Advisor Hedge Fund Manager Other Pension Fund (Erisa) Others SASCO CAPITAL INCORP 6'418'093 -80'520 113'536'065 2.93% 31.12.2012 13F UNITED STATES DEUTSCHE BANK AG 5'179'819 125'546 91'630'998 2.36% 31.12.2012 13F GERMANY HSBC HOLDINGS PLC 4'548'097 1'002'775 80'455'836 2.07% 31.12.2012 13F BRITAIN ORBIS HOLDINGS LIMIT 2'718'408 -1'200'182 48'088'638 1.24% 31.12.2012 13F BERMUDA SUSQUEHANNA INTERNAT 2'211'294 1'124'663 39'117'791 1.01% 31.12.2012 13F UNITED STATES DIMENSIONAL FUND ADV 2'180'139 -6'281 38'566'659 0.99% 31.12.2012 13F UNITED STATES Top 5 Insiders: Holder Name Position Position Change Market Value % of Ownership Report Date Source ULLMAN III MYRON E 927'101 -56'148 16'400'417 0.42% 26.01.2012 Form 4 JOHNSON RONALD B 883'330 15'626'108 0.40% 27.01.2012 Form 4 KRAMER MICHAEL W 872'405 15'432'844 0.40% 05.12.2012 Form 4 TERUEL JAVIER G 158'869 856 2'810'393 0.07% 03.12.2012 Form 4 DHILLON JANET L 143'794 -4'277 2'543'716 0.07% 18.05.2012 Form 4 Q.M.S Advisors | tel: +41 (0)78 922 08 77 | e-mail: info@qmsadv.com |
- 4. Company Analysis - Financials I/IV JC Penney Co Inc Financial information is in USD (M) Equivalent Estimates Periodicity: Fiscal Year 1/03 1/04 1/05 1/06 1/07 1/08 1/09 1/10 1/11 1/12 1/13 1/14E 1/15E 1/16E Income Statement Revenue 32'347 17'786 18'096 18'781 19'903 19'860 18'486 17'556 17'759 17'260 12'985 12'665 13'169 13'808 - Cost of Goods Sold 22'573 11'166 11'107 11'405 12'078 12'189 11'571 10'646 10'799 11'042 8'919 Gross Income 9'774 6'620 6'989 7'376 7'825 7'671 6'915 6'910 6'960 6'218 4'066 4'452 4'838 5'032 - Selling, General & Admin Expenses 8'760 5'830 5'702 5'799 5'903 5'783 5'780 6'247 6'128 5'769 5'078 (Research & Dev Costs) 0 0 0 0 Operating Income 1'014 790 1'287 1'577 1'922 1'888 1'135 663 832 449 -1'012 -522 -138 67 - Interest Expense 388 261 373 280 270 278 268 260 233 228 226 - Foreign Exchange Losses (Gains) 0 0 0 0 0 0 0 0 0 0 - Net Non-Operating Losses (Gains) 42 -17 -91 -147 -140 -113 -43 0 18 450 298 Pretax Income 584 546 1'005 1'444 1'792 1'723 910 403 581 -229 -1'536 -673 -458 -299 - Income Tax Expense 213 182 348 467 658 618 343 154 203 -77 -551 Income Before XO Items 371 364 657 977 1'134 1'105 567 249 378 -152 -985 - Extraordinary Loss Net of Tax -34 1'292 133 -111 -19 -6 -5 -2 -11 0 0 - Minority Interests 0 0 0 0 0 0 0 0 0 0 Diluted EPS Before XO Items 1.25 1.21 2.20 3.83 4.96 4.90 2.54 1.07 1.59 (0.70) (4.49) Net Income Adjusted* 256 339 679 925 567 291 397 154 -766 -390 -155 -41 EPS Adjusted 0.95 1.21 2.31 3.63 2.54 1.25 1.67 0.70 (3.49) (2.29) (1.06) (0.15) Dividends Per Share 0.50 0.50 0.50 0.50 0.72 0.80 0.80 0.80 0.80 0.80 0.40 0.00 0.00 0.00 Payout Ratio % 46.8 47.5 23.3 12.8 14.6 16.1 31.3 74.5 50.3 Total Shares Outstanding 269 274 271 233 226 222 222 236 237 216 219 Diluted Shares Outstanding 293 297 307 255 232 225 223 233 238 217 219 EBITDA 1'681 1'184 1'646 1'949 2'311 2'314 1'604 1'158 1'343 967 -469 -74 357 530 *Net income excludes extraordinary gains and losses and one-time charges. Q.M.S Advisors | tel: +41 (0)78 922 08 77 | e-mail: info@qmsadv.com |
- 5. Company Analysis - Financials II/IV Periodicity: 1/03 1/04 1/05 1/06 1/07 1/08 1/09 1/10 1/11 1/12 1/13 1/14E 1/15E 1/16E Balance Sheet Total Current Assets 8353 6513 8232 6702 6648 6751 6220 6652 6370 5081 3683 + Cash & Near Cash Items 2'388 2'907 4'586 2'951 2'747 2'471 2'352 3'011 2'622 1'507 930 + Short Term Investments 86 87 63 65 0 0 + Accounts & Notes Receivable 705 233 274 270 263 430 447 0 0 0 0 + Inventories 4'945 3'156 3'142 3'210 3'400 3'641 3'259 3'024 3'213 2'916 2'341 + Other Current Assets 229 130 167 206 238 209 162 617 535 658 412 Total Long-Term Assets 9'514 11'787 5'895 5'759 6'025 7'558 5'791 5'929 6'672 6'343 6'098 + Long Term Investments 0 0 0 0 0 0 0 0 0 Gross Fixed Assets 8'154 5'637 5'607 5'845 6'277 7'178 7'806 8'058 8'085 8'141 Accumulated Depreciation 3'253 2'122 2'032 2'097 2'115 2'219 2'439 2'701 2'854 2'965 + Net Fixed Assets 4'901 3'515 3'575 3'748 4'162 4'959 5'367 5'357 5'231 5'176 5'353 + Other Long Term Assets 4'613 8'272 2'320 2'011 1'863 2'599 424 572 1'441 1'167 745 Total Current Liabilities 4'159 3'754 3'297 2'762 3'492 3'338 2'794 3'249 2'647 2'756 2'583 + Accounts Payable 3'791 2'551 1'143 1'171 1'366 1'472 1'194 1'226 1'133 1'022 1'162 + Short Term Borrowings 288 260 459 21 434 203 0 393 0 231 26 + Other Short Term Liabilities 80 943 1'695 1'570 1'692 1'663 1'600 1'630 1'514 1'503 1'395 Total Long Term Liabilities 7'338 9'121 5'974 5'692 4'893 5'659 5'062 4'554 4'935 4'658 4'027 + Long Term Borrowings 4'940 5'114 3'464 3'444 3'010 3'505 3'505 2'999 3'099 2'871 2'868 + Other Long Term Borrowings 2'398 4'007 2'510 2'248 1'883 2'154 1'557 1'555 1'836 1'787 1'159 Total Liabilities 11'497 12'875 9'271 8'454 8'385 8'997 7'856 7'803 7'582 7'414 6'610 + Long Preferred Equity 333 304 0 0 0 0 0 0 0 0 0 + Minority Interest 0 0 0 0 0 0 0 0 0 + Share Capital & APIC 3'423 3'531 4'176 3'479 3'542 3'564 3'610 3'985 4'043 3'807 + Retained Earnings & Other Equity 2'614 1'590 680 528 746 1'748 545 793 1'417 203 3'171 Total Shareholders Equity 6'370 5'425 4'856 4'007 4'288 5'312 4'155 4'778 5'460 4'010 3'171 Total Liabilities & Equity 17'867 18'300 14'127 12'461 12'673 14'309 12'011 12'581 13'042 11'424 9'781 Book Value Per Share 22.44 18.69 17.92 17.20 18.97 23.93 18.72 20.25 23.04 18.57 14.46 12.12 10.72 7.54 Tangible Book Value Per Share 12.04 18.54 17.76 17.20 18.97 23.93 18.72 20.25 23.04 18.57 14.46 Q.M.S Advisors | tel: +41 (0)78 922 08 77 | e-mail: info@qmsadv.com |
- 6. Company Analysis - Financials III/IV Periodicity: 1/03 1/04 1/05 1/06 1/07 1/08 1/09 1/10 1/11 1/12 1/13 1/14E 1/15E 1/16E Cash Flows Net Income 405 -928 524 1'088 1'153 1'111 572 251 389 -152 -985 -409 -184 67 + Depreciation & Amortization 667 394 359 372 389 426 469 495 511 518 543 + Other Non-Cash Adjustments 76 1'338 -879 58 -303 -69 35 439 8 313 -316 + Changes in Non-Cash Capital 181 -56 315 -99 27 -211 81 388 -316 141 748 Cash From Operating Activities 1'329 748 319 1'419 1'266 1'257 1'157 1'573 592 820 -10 + Disposal of Fixed Assets 0 0 20 26 13 13 14 15 526 + Capital Expenditures -658 -373 -398 -535 -772 -1'243 -969 -600 -499 -634 -810 -775 -767 -700 + Increase in Investments 0 0 0 0 0 0 0 0 0 + Decrease in Investments 0 0 0 0 0 0 0 0 0 + Other Investing Activities 38 120 4'437 127 -32 -25 -1 0 0 -251 -9 Cash From Investing Activities -620 -253 4'039 -408 -784 -1'242 -957 -587 -485 -870 -293 + Dividends Paid -161 -160 -150 -131 -153 -174 -178 -183 -189 -178 -86 + Change in Short Term Borrowings 25 5 0 0 0 0 0 0 0 0 0 + Increase in Long Term Borrowings 607 0 0 0 980 0 0 392 0 0 + Decrease in Long Term Borrowings -939 -450 -856 -474 -21 -746 -203 -113 -693 0 -250 + Increase in Capital Stocks 30 52 248 205 174 62 5 4 10 78 71 + Decrease in Capital Stocks -30 -29 -1'901 -2'252 -750 -400 0 0 0 -900 0 + Other Financing Activities 34 -14 8 -1 -8 -4 -35 -16 -65 -9 Cash From Financing Activities -1'041 25 -2'673 -2'644 -751 -286 -380 -327 -496 -1'065 -274 Net Changes in Cash -332 520 1'685 -1'633 -269 -271 -180 659 -389 -1'115 -577 Free Cash Flow (CFO-CAPEX) 671 375 -79 884 494 14 188 973 93 186 -820 -639 -283 -216 Free Cash Flow To Firm 917 549 165 1'073 665 192 355 1'134 245 Free Cash Flow To Equity -300 483 -1'251 410 493 274 -2 873 -194 201 -544 Free Cash Flow per Share 2.51 1.38 -0.28 3.49 2.16 0.06 0.85 4.19 0.39 0.86 -3.74 Q.M.S Advisors | tel: +41 (0)78 922 08 77 | e-mail: info@qmsadv.com |
- 7. Company Analysis - Financials IV/IV Periodicity: 1/03 1/04 1/05 1/06 1/07 1/08 1/09 1/10 1/11 1/12 1/13 1/14E 1/15E 1/16E Ratio Analysis Valuation Ratios Price Earnings 15.5x 21.6x 18.3x 15.5x 17.5x 10.2x 6.8x 19.9x 19.3x 59.2x EV to EBIT 8.2x 12.5x 8.2x 8.6x 10.2x 6.4x 4.3x 9.4x 9.8x 23.5x EV to EBITDA 4.9x 8.3x 6.4x 7.0x 8.5x 5.2x 3.0x 5.4x 6.1x 10.9x 16.4x 11.0x Price to Sales 0.2x 0.4x 0.6x 0.8x 1.0x 0.5x 0.2x 0.3x 0.4x 0.5x 0.3x 0.3x 0.3x 0.3x Price to Book 0.9x 1.4x 2.3x 3.3x 4.4x 2.0x 0.9x 1.2x 1.4x 2.2x 1.4x 1.5x 1.6x 2.3x Dividend Yield 2.6% 1.9% 1.2% 0.9% 0.9% 1.6% 4.8% 3.2% 2.5% 1.9% 2.0% 0.0% 0.0% 0.0% Profitability Ratios Gross Margin 30.2% 37.2% 38.6% 39.3% 39.3% 38.6% 37.4% 39.4% 39.2% 36.0% 31.3% 35.2% 36.7% 36.4% EBITDA Margin 5.2% 6.7% 9.1% 10.4% 11.6% 11.7% 8.7% 6.6% 7.6% 5.6% -3.6% -0.6% 2.7% 3.8% Operating Margin 3.1% 4.4% 7.1% 8.4% 9.7% 9.5% 6.1% 3.8% 4.7% 2.6% -7.8% -4.1% -1.0% 0.5% Profit Margin 1.3% -5.2% 2.9% 5.8% 5.8% 5.6% 3.1% 1.4% 2.2% -0.9% -7.6% -3.1% -1.2% -0.3% Return on Assets 2.3% -5.1% 3.2% 8.2% 9.2% 8.2% 4.3% 2.0% 3.0% -1.2% -9.3% -6.1% -3.9% -3.1% Return on Equity 6.4% -17.1% 10.3% 24.6% 27.8% 23.1% 12.1% 5.6% 7.6% -3.2% -27.4% -16.2% -7.3% -6.0% Leverage & Coverage Ratios Current Ratio 2.01 1.73 2.50 2.43 1.90 2.02 2.23 2.05 2.41 1.84 1.43 Quick Ratio 0.76 0.86 1.49 1.19 0.86 0.87 1.00 0.93 0.99 0.55 0.36 Interest Coverage Ratio (EBIT/I) 2.61 3.03 3.44 5.59 6.99 6.56 4.08 2.51 3.57 1.97 -4.48 Tot Debt/Capital 0.45 0.50 0.45 0.46 0.45 0.41 0.46 0.42 0.36 0.44 0.48 Tot Debt/Equity 0.82 0.99 0.81 0.86 0.80 0.70 0.84 0.71 0.57 0.77 0.91 Others Asset Turnover 1.80 0.98 1.12 1.41 1.58 1.47 1.40 1.43 1.39 1.41 1.22 Accounts Receivable Turnover 46.11 37.92 71.38 69.05 74.68 57.32 42.16 78.55 Accounts Payable Turnover 6.23 2.96 6.01 9.92 9.67 8.76 8.39 8.60 9.32 9.97 7.64 Inventory Turnover 4.57 2.76 3.53 3.59 3.65 3.46 3.35 3.39 3.46 3.60 3.39 Effective Tax Rate 36.5% 33.3% 34.6% 32.3% 36.7% 35.9% 37.7% 38.2% 34.9% Q.M.S Advisors | tel: +41 (0)78 922 08 77 | e-mail: info@qmsadv.com |
- 8. Company Analysis - Peers Comparision WAL-MART COSTCO BED BATH J.C. PENNEY CO MACY'S INC KOHLS CORP NORDSTROM INC TARGET CORP SAKS INC SEARS HOLDINGS GAP INC/THE DILLARDS INC-A TJX COS INC ROSS STORES INC BON-TON STORES STORES WHOLESALE &BEYOND Latest Fiscal Year: 01/2013 01/2013 01/2013 01/2013 01/2013 01/2013 01/2013 01/2013 08/2012 01/2013 01/2013 01/2013 01/2012 01/2012 02/2012 52-Week High 39.72 42.17 55.25 58.44 65.80 77.60 12.14 77.21 104.35 37.85 89.42 46.67 70.82 14.99 75.84 52-Week High Date 08.03.2012 02.05.2012 01.11.2012 30.08.2012 21.09.2012 16.10.2012 03.04.2012 16.03.2012 01.02.2013 05.10.2012 15.02.2013 29.08.2012 20.08.2012 12.09.2012 19.06.2012 52-Week Low 15.70 32.31 41.35 46.27 54.68 57.18 9.24 38.40 76.56 24.17 57.20 36.68 52.01 3.50 54.33 52-Week Low Date 16.11.2012 12.07.2012 03.01.2013 05.06.2012 17.05.2012 25.04.2012 13.11.2012 28.12.2012 08.05.2012 05.03.2012 05.03.2012 06.03.2012 27.12.2012 23.05.2012 20.12.2012 Daily Volume 1'768'894 6'094'561 3'322'487 2'316'529 6'536'059 8'902'516 2'212'078 1'166'289 1'790'052 8'480'874 581'586 6'794'205 2'234'168 95'386 2'483'694 Current Price (3/dd/yy) 17.69 40.68 46.17 54.07 64.13 71.74 11.28 44.36 101.42 33.87 80.27 44.98 58.13 10.73 56.93 52-Week High % Change -55.5% -3.5% -16.4% -7.5% -2.5% -7.6% -7.1% -42.5% -2.8% -10.5% -10.2% -3.6% -17.9% -28.4% -24.9% 52-Week Low % Change 12.7% 25.9% 11.7% 16.9% 17.3% 25.5% 22.1% 15.5% 32.5% 40.1% 40.3% 22.6% 11.8% 206.6% 4.8% Total Common Shares (M) 219.3 387.7 227.0 207.6 645.3 3'340.0 145.3 106.4 432.4 479.4 47.8 737.9 226.9 19.7 235.5 Market Capitalization 3'881.2 15'771.6 10'619.6 10'651.8 41'383.1 239'611.6 1'639.0 4'719.9 44'182.3 16'237.9 3'783.1 32'801.8 12'927.0 215.7 12'873.9 Total Debt 2'894.0 6'930.0 4'553.0 3'131.0 17'648.0 54'136.0 359.6 3'120.0 1'382.0 1'246.0 624.0 774.6 150.0 883.4 - Preferred Stock - - - - - - - - - - - - - - - Minority Interest - - - - - 5'395.0 - - 157.0 - - - - - - Cash and Equivalents 930.0 1'836.0 537.0 1'285.0 784.0 7'781.0 80.4 609.0 4'854.0 1'510.0 124.1 2'047.8 650.5 14.3 1'759.6 Enterprise Value 5'845.2 20'865.6 14'635.6 12'497.8 58'247.1 291'361.6 1'918.2 7'230.9 40'151.3 15'973.9 4'283.0 31'528.6 12'451.6 1'230.1 12'089.2 Valuation Total Revenue LFY 12'985.0 27'686.0 19'279.0 12'148.0 73'301.0 469'162.0 3'147.6 39'854.0 99'137.0 15'651.0 6'751.6 25'878.4 8'608.3 2'953.5 9'499.9 LTM 12'985.0 27'686.0 19'280.0 12'148.0 73'301.0 469'162.0 3'147.6 39'854.0 101'224.0 15'651.0 6'748.9 25'878.4 9'358.3 2'953.9 10'245.4 CY+1 12'664.5 28'314.7 19'495.4 12'944.2 75'452.9 492'408.8 3'230.9 36'244.5 106'397.7 16'186.6 6'817.3 27'230.8 9'697.2 2'985.0 10'909.9 CY+2 13'169.2 29'159.8 19'893.1 13'974.6 80'606.4 516'301.8 3'379.3 35'608.5 115'492.0 16'831.5 6'960.0 29'130.6 10'304.3 3'004.0 11'629.9 EV/Total Revenue LFY 0.5x 0.7x 0.8x 1.1x 0.8x 0.6x 0.6x 0.2x 0.4x 1.0x 0.7x 1.2x 1.5x 0.4x 1.3x LTM 0.5x 0.7x 0.8x 1.1x 0.8x 0.6x 0.6x 0.2x 0.4x 1.0x 0.7x 1.2x 1.4x 0.4x 1.3x CY+1 0.5x 0.7x 0.7x 0.9x 0.7x 0.6x 0.6x 0.2x 0.4x 0.9x 0.7x 1.2x 1.3x 0.4x 1.1x CY+2 0.4x 0.7x 0.7x 0.8x 0.7x 0.6x 0.5x 0.2x 0.4x 0.9x 0.6x 1.1x 1.2x 0.4x 1.0x EBITDA LFY (469.0) 3'715.0 2'723.0 1'774.0 7'352.0 36'302.0 271.1 (146.0) 3'667.0 2'425.0 800.1 3'615.4 1'223.4 165.4 1'752.2 LTM (469.0) 3'715.0 2'722.0 1'774.0 7'353.0 36'302.0 271.1 (146.0) 3'774.0 2'425.0 799.9 3'615.4 1'382.2 147.5 1'782.2 CY+1 (74.0) 3'831.3 2'732.1 1'851.1 7'458.0 37'856.6 277.1 605.0 4'101.7 2'571.5 842.0 3'854.6 1'473.6 165.7 1'846.4 CY+2 357.1 4'027.4 2'828.2 2'023.1 8'258.4 39'832.9 305.6 678.0 4'480.8 2'735.6 793.0 4'239.4 1'594.6 192.7 1'966.6 EV/EBITDA LFY -13.5x 5.5x 5.3x 7.5x 7.7x 7.9x 6.8x -51.9x 10.5x 6.4x 5.7x 8.9x 10.7x 7.6x 7.3x LTM 26.2x 5.5x 5.3x 7.5x 7.7x 7.9x 6.8x 115.5x 10.2x 6.4x 5.7x 8.9x 9.5x 8.5x 7.2x CY+1 - 5.3x 5.1x 6.6x 7.4x 7.6x 6.8x 11.8x 10.6x 6.0x 5.4x 8.2x 8.4x 6.9x 6.4x CY+2 16.5x 4.9x 4.9x 5.8x 6.8x 7.2x 5.9x 10.3x 9.6x 5.4x 5.7x 7.4x 7.7x 5.8x 5.8x EPS LFY -3.49 3.46 4.17 3.56 4.76 5.02 0.46 -2.03 3.89 2.33 6.36 2.55 2.86 -1.02 4.06 LTM -3.65 3.51 4.20 3.56 4.56 5.02 0.43 -2.54 4.12 2.30 6.33 2.55 3.31 -1.40 4.38 CY+1 (2.29) 3.92 4.38 3.82 4.72 5.35 0.44 (2.90) 4.50 2.62 7.10 2.81 3.53 (0.43) 4.56 CY+2 (1.06) 4.43 4.91 4.26 5.56 5.88 0.52 (2.26) 5.01 2.92 7.85 3.16 3.88 0.47 5.06 P/E LFY - 11.6x 11.0x 15.2x 14.1x 14.3x 26.2x - 24.6x 14.7x 12.7x 17.6x 17.6x - 13.0x LTM - 11.6x 11.0x 15.2x 14.1x 14.3x 26.2x - 24.6x 14.7x 12.7x 17.6x 17.6x - 13.0x CY+1 - 10.4x 10.6x 14.2x 13.6x 13.4x 25.7x - 22.5x 12.9x 11.3x 16.0x 16.5x - 12.5x CY+2 - 9.2x 9.4x 12.7x 11.5x 12.2x 21.7x - 20.2x 11.6x 10.2x 14.2x 15.0x 22.9x 11.3x Revenue Growth 1 Year (24.8%) 4.9% 2.5% 11.7% 4.9% 5.0% 4.4% (4.1%) 11.5% 7.6% 5.5% 11.6% 9.4% (3.1%) 8.5% 5 Year (8.8%) 1.9% 3.1% 7.7% 2.8% 3.6% 0.2% (4.1%) 8.5% 0.5% (0.3%) 7.6% 9.1% (3.2%) 8.7% EBITDA Growth 1 Year - 7.0% (7.3%) 9.5% (1.4%) 4.7% (2.1%) (131.7%) 11.0% 24.7% 17.5% 23.3% 14.6% (30.8%) 19.0% 5 Year (16.0%) 1.9% 3.8% 3.9% 1.2% 5.1% 2.3% - 10.9% 5.4% 11.7% 13.9% 19.7% (10.3%) 11.4% EBITDA Margin LTM (3.6%) 13.4% 14.1% 14.6% 10.0% 7.7% 8.6% (0.4%) 3.7% 15.5% 11.9% 14.0% 14.8% 5.0% 17.4% CY+1 (0.6%) 13.5% 14.0% 14.3% 9.9% 7.7% 8.6% 1.7% 3.9% 15.9% 12.4% 14.2% 15.2% 5.5% 16.9% CY+2 2.7% 13.8% 14.2% 14.5% 10.2% 7.7% 9.0% 1.9% 3.9% 16.3% 11.4% 14.6% 15.5% 6.4% 16.9% Leverage/Coverage Ratios Total Debt / Equity % 91.3% 114.5% 75.3% 163.7% 106.6% 70.9% 31.3% 98.4% 11.2% 43.1% 31.7% 21.1% 10.0% 671.2% 0.0% Total Debt / Capital % 47.7% 53.4% 42.9% 62.1% 51.6% 39.8% 23.8% 49.6% 9.9% 30.1% 24.1% 17.4% 9.1% 87.0% 0.0% Total Debt / EBITDA 9.690x 1.865x 1.673x 1.765x 2.400x 1.491x 1.327x 44.000x 0.365x 0.514x 0.780x 0.214x 0.109x 6.934x 0.000x Net Debt / EBITDA 7.974x 1.371x 1.475x 1.041x 2.293x 1.277x 1.030x 37.165x -1.112x -0.109x 0.625x -0.352x -0.344x 6.879x -0.440x EBITDA / Int. Expense -2.075x 8.803x 8.277x 11.088x 9.648x 16.127x 7.290x -0.547x 34.924x 29.938x 11.496x 123.922x 113.044x 1.835x - Credit Ratings S&P LT Credit Rating CCC+ BBB BBB+ A- A+ AA BB CCC+ A+ BB+ BB A BBB+ B- BBB+ S&P LT Credit Rating Date 28.02.2013 10.04.2012 20.09.2007 03.02.2011 20.11.2007 09.07.1999 18.08.2011 05.01.2012 28.11.2012 17.11.2006 14.03.2012 18.09.2002 08.06.2011 10.01.2012 30.06.2011 Moody's LT Credit Rating - Baa3 Baa1 Baa1 A2 Aa2 B1 - A1 Baa3 B1 A3 - Caa3 - Moody's LT Credit Rating Date - 09.01.2012 24.09.2007 11.02.2011 27.11.2007 06.03.1996 19.01.2012 - 26.03.2012 07.04.2011 22.06.2012 17.09.1998 - 05.06.2012 - Q.M.S Advisors | tel: +41 (0)78 922 08 77 | e-mail: info@qmsadv.com |