SlideShare a Scribd company logo
1 of 10
Download to read offline
International Journal of Engineering Science Invention
ISSN (Online): 2319 – 6734, ISSN (Print): 2319 – 6726
www.ijesi.org Volume 2 Issue 7 ǁ July. 2013 ǁ PP.20-29
www.ijesi.org 20 | Page
Effect of irrigation regimes and low tunnel heights on
microclimatic parameters in the growing of sweet pepper
A. S. Lodhi1
, Arun Kaushal2
and K. G. Singh3
1
*(Correspondence Author) Former M. Tech. Student, Soil And Water Engineering Department,
Punjab Agricultural University, Ludhiana, India
2
Associate Professor, Soil and Water Engineering Department, Punjab Agricultural University, Ludhiana, India
3
Research Engineer, Soil and Water Engineering Department, Punjab Agricultural University, Ludhiana, India
ABSTRACT: Field experiment was conducted in the Department of Soil and Water Engineering,
PAU, Ludhiana in 2008-09 to study the effects of low tunnel environment in growing of sweet
pepper (Capsicum annuum L. var. grossum). The experiment was laid out in split plot design
keeping five irrigation treatments (drip irrigation with IW/CPE ratio of 0.60 (I1), 0.75 (I2), 0.90
(I3), furrow irrigation with paired row planting (I4) and single row planting (I5)), in main plots
and three different low tunnel heights (45cm (H1), 60cm (H2) and 75cm (H3)) in sub plots and
replicated three times. The air temperature, soil temperature, Relative humidity, solar radiations
were observed. For the combinations I2H2 treatment gave higher air and soil temperature than
other treatments combinations and I3H3 gave higher mean relative humidity at 7:30 am but at 2:30
pm combination I2H2 treatment gave higher relative humidity than other treatment combinations.
KEYWORDS: Air temperature, Soil temperature, Relative Humidity, Microclimate, Low Tunnels,
Sweet pepper.
I. INTRODUCTION
Capsicum (Capsicum annuum L. var. grossum) or sweet pepper is one of the most popular and
high value vegetable crops grown for its immature fruits around the world. High demand of fresh
vegetables generated in domestic and export market throughout the year. But due to unfavourable
climatic conditions there is a flood of vegetables in the season and very high priced vegetables in off -
season. Vegetables can be cultivated in off-season, with the induction of artificial techniques like green
houses, low and high poly tunnels technology, in which temperature and moisture are controlled for
specific growth of vegetables. The production of vegetables all around the year enables the growers to
fully utilize their resources and supplement income from vegetable growing as compared to other normal
agricultural crops.
For sweet pepper the optimum night temperature for quality fruits production 16-18°C. When
the temperature falls below 16°C for extended periods, growth and yields usually decreases. It can
tolerate day temperature above 30°C. Sweet pepper are generally raised in open during main season thus
causing glut in the market, which lead to price crash in the season. Punjab has extreme low temperature
during winter and high temperature during summer, therefore, availability of these vegetable is for a
short span. This situation suggests us to modify microclimate, which will not only increase the
availability span of vegetables but also the yield. Low tunnel technology can help sweet pepper in off-
season during early summer. With this technology, the farmers can capture the market in the early
season and may get good return of their produce.
Low tunnels or row covers are plastic film covered shelters with small frames, producing
greenhouse like effect. For low tunnels the sheet of the film is placed over the plants in a single or
double row with an arch-shaped frame for support. The shape of the frame can vary but the farmer
cannot work inside the low tunnels. These tunnels facilitate the entrapment of carbon dioxide, thereby
enhancing the photosynthetic activity of the plants and hence the yield. These structures also protect the
plants from the high winds, rain, frost and snow. Besides being inexpensive they are easy to construct
and dismantle. Low tunnels are being used for producing high quality high valued nurseries and crops
such as tomatoes, cucumber, radish, beans and capsicum.
Libik and Siwek (1994) studied the changes in soil temperature affected by the application of
plastic covers in field production of lettuce and watermelon. It was reported that at 8.00 h soil
temperature was 3°C higher than in the open ground and by 14.00 h the air temperature under the cover
was 10-15°C higher than the ambient temperature. Lamarrel et al (1996) was found that the use of low
tunnel has been beneficial during winter when the crop has to be protected from frost and low
temperature for higher productivity.
Effect of irrigation regimes and low tunnel height…
www.ijesi.org 21 | Page
II. MATERIALS AND METHODS
Field experiment was conducted at the Research Farm of the Department of Soil and Water
Engineering, PAU, Ludhiana from October, 2008 to June, 2009. Ludhiana is situated at latitude of
30o
54`N and longitude of 75o
48`E and at a mean height of 247 meters above sea level. Average
minimum and maximum temperature in the region varies from 3o
C to 43o
C respectively.
A field plot measuring approximately 550.8 m2
(54mx10.2m) was prepared and the
experiment was laid out in split plot design keeping five irrigation treatments in main plots and
three different heights of low tunnel in sub plots and replicated three times. The irrigation
treatments were taken as main plots as they require bigger plot size. The three treatments of
different heights of low tunnel made with tunnel frame height of 45cm (H1), 60cm (H2) and 75cm
(H3) were used in the experiment. Low tunnels were made with the 6mm thick steel (iron) rods.
The shape of the low tunnel frame was made parabolic with the given base and desired height. A
length of 15cm at the base was kept for inserting frame into the soil and inside loops was provided
on both side of frame for the support in addition to low tunnel height.
Nursery raising of sweet pepper of “Bharath” variety was done in polyhouse on 13th
of
October, 2008 and transplanting was done in the field on 17th
of November, 2008. In paired sowing
60 cm wide beds were raised, row to row space between paired rows was 45 cm and row space
between pairs was 75 cm but plant to plant space was kept as 30 cm. Irrigation was applied as per
the treatments. In the single furrow the row to row spacing was 60 cm and plant to plant spacing
was 30 cm. As per the recommendations of PAU Ludhiana “Package of Practices for Vegetable
Crops” (Anonymous, 2008) full package of plant protection measures were adopted during the
growth period of crop so as to have a disease free and weed free crop.
Fig.1 Low tunnels of different heights in experimental field
After transplanting of crop, the crop was covered with polysheet of 50 micron thickness
with width of 150cm, 185cm and 240cm over the low tunnel frame heights of 45cm, 60cm and 75cm
respectively, to protect crop from frost and other injury (Fig.1). The low tunnel frames were kept at
beginning and at end of paired row and distance between successive frames was kept as 2.50m. The
crop was completely covered with low tunnel till 4th
February, 2009 and after that low tunnels were
removed.
To observe the effect of low tunnels on soil temperature, soil temperature thermometers
were installed at a depth of 10 cm in the field in 45 sub-plots under low tunnel and outside in
adjoining open field. Daily data of minimum and maximum soil temperature was recorded till the
tunnel cover was removed from the crop. The minimum temperature was recorded at 7.30 AM in the
morning and maximum temperature was recorded at 2.30 PM in the afternoon.
Maximum and minimum air temperature was recorded by placing thermometer at middle in
each sub-plot and outside in adjoining open field. This observation was also recorded daily at 7.30
AM and 2.30 PM respectively till the tunnel cover was removed from the crop.
Relative humidity was recorded by placing hygrometer at middle in each sub-plot and
outside in adjoining open field. These observations were also recorded daily at 7:30 AM and 2:30
PM till the tunnel cover was removed from the crop.
Maximum solar radiation inside the tunnel and outside in adjoining field was taken out by
using digital Lux meter (TES 1332) daily at 2.30 PM till the tunnel cover was removed from the
crop.
Effect of irrigation regimes and low tunnel height…
www.ijesi.org 22 | Page
III. RESULTS AND DISCUSSION
To observe the effect of different treatments on microclimate inside the low tunnels air
temperature, soil temperature, relative humidity and solar radiation were recorded daily from the
time when the crop was covered with low tunnels till the low tunnels were removed (i.e. 27th
Nov,2008 to 4th
Feb,2009). Mean of seven days was calculated and used for analysis.
3.1 Air Temperature
The measurement of recorded temperature showed that the thermal condition depends on the
tunnel height and the type of irrigation applied as presented in Table 1. At 7:30 am the air
temperature in low tunnel which varied from 8.75o
C to 13.42o
C was higher by 3.25o
C to 3.71o
C in
comparison with open field whose temperature varied from 5.50o
C to 9.71o
C during the low tunnel
coverage period. Among the tunnel height treatments, in H2 treatment the air temperature was
highest which varied from 9.33o
C to 13.42o
C and was higher by 0.57o
C to 0.58o
C in comparison
with H1 treatment whose temperature was lowest which varied from 8.75o
C to 12.85o
C. Among the
irrigation treatments, in I2 treatment the air temperature was highest which varied from 9.61 o
C to
13.42o
C and was higher by 0.76o
C to 0.86o
C in comparison with I5 treatment whose temperature
was lowest which varied from 8.75o
C to 12.66o
C. For the treatment combination in I2H2 treatment
the air temperature was highest which varied from 9.75o
C to 13.42o
C and was higher by 1o
C in
comparison with I5H1 treatment whose temperature was lowest which varied from 8.75o
C to
12.42o
C.
At 2:30 pm the air temperature in low tunnel which varied from 23.8o
C to 36.8o
C was
higher by 6.38o
C to 9.3o
C in comparison with open field whose temperature varied from 17.42o
C to
27.5o
C during the low tunnel coverage period. Among the tunnel height treatments, in H2 treatment
the air temperature was highest which varied from 24.42o
C to 36.8o
C and was higher by 0.14o
C to
0.62o
C in comparison with H1 treatment whose temperature was lowest which varied from 23.8o
C to
36.66o
C. Among the irrigation treatments, in I2 treatment the air temperature was highest which
varied from 25.94o
C to 36.8o
C and was higher by 1.1o
C to 2.14o
C in comparison with I5 treatment
whose temperature was lowest which varied from 23.8o
C to 35.7o
C. For the treatment combination
in I2H2 treatment the air temperature was highest which varied from 26.61o
C to 36.8o
C and was
higher by 2.81o
C to 3.23o
C in comparison with I5H1 treatment whose temperature was lowest which
varied from 23.8o
C to 33.57o
C. Differences in temperature between low tunnels treatments may be
due to many factors including: initial air and soil temperature; soil moisture, air volume in tunnel,
convective and conductive heat exchange characteristics of the material and transmissibility to long
wave radiation.
The above mentioned results were in close proximity with those of Wolfe et al (1989) who
reported 5°C to 20°C daytime air temperature rise under row covers as compared with open field.
Table 1 Variation of air temperature in different heights of low tunnel with various irrigation treatments
Week after covering
of crop
Mean Air Temp.
(o
C)
(Open Field)
Mean Air Temperature (o
C)
Low Tunnel Heights
45cm 60cm 75cm
7:30
am
2:30
pm
7:30
am
2:30
pm
7:30
am
2:30
pm
7:30
am
2:30
pm
IW/ CPE= 0.60 (I1)
1. (27 Nov -3 Dec) 7.85 24.71 10.90 32.47 11.37 33.42 11.14 33.09
2. (04 - 10 Dec) 9.71 23.14 12.66 30.52 13.04 31.28 12.80 30.85
3. (11 -17 Dec) 7.85 22.42 11.09 31.37 11.42 32.90 11.18 32.37
4. (18- 24 Dec) 9.28 20.85 12.33 27.90 12.61 28.94 12.56 28.66
5. (25- 31 Dec) 7.42 17.42 10.71 24.94 11.33 25.80 10.99 25.28
6. (01 -7 Jan) 6.16 18.00 9.33 26.28 9.56 27.09 9.51 26.95
7. (08 - 14 Jan) 5.50 23.42 9.04 30.04 9.52 31.24 9.28 30.61
8. (15 -21Jan) 8.28 22.57 11.42 30.85 11.61 31.71 11.52 31.14
9. (22 -28 Jan) 8.66 23.50 11.85 30.18 11.99 31.56 11.95 31.28
10. (29 Jan - 4 Feb) 7.00 27.50 10.18 35.56 10.33 36.56 10.23 36.14
IW/CPE= 0.75 (I2)
1. (27 Nov -3 Dec) 7.85 24.71 11.33 33.38 11.90 33.99 11.47 33.94
Effect of irrigation regimes and low tunnel height…
www.ijesi.org 23 | Page
2. (04 - 10 Dec) 9.71 23.14 12.85 31.61 13.42 32.56 13.19 32.04
3. (11 -17 Dec) 7.85 22.42 11.28 32.37 11.76 33.04 11.61 32.90
4. (18- 24 Dec) 9.28 20.85 12.61 29.33 12.90 29.80 12.80 29.61
5. (25- 31 Dec) 7.42 17.42 11.23 25.94 11.66 26.61 11.42 26.18
6. (01 -7 Jan) 6.16 18.00 9.71 27.28 9.95 27.99 9.85 27.47
7. (08 - 14 Jan) 5.50 23.42 9.61 30.80 9.75 31.66 9.71 31.61
8. (15 -21Jan) 8.28 22.57 11.71 31.56 11.95 31.95 11.80 31.80
9. (22 -28 Jan) 8.66 23.50 12.09 31.71 12.52 31.99 12.23 31.85
10. (29 Jan - 4 Feb) 7.00 27.50 10.37 36.66 10.61 36.80 10.47 36.95
IW/CPE= 0.90 (I3)
1. (27 Nov -3 Dec) 7.85 24.71 11.04 32.90 11.76 33.75 11.33 33.61
2. (04 - 10 Dec) 9.71 23.14 12.76 30.99 13.23 32.23 13.04 31.04
3. (11 -17 Dec) 7.85 22.42 11.18 31.8 11.61 32.76 11.33 32.75
4. (18- 24 Dec) 9.28 20.85 12.47 28.75 12.71 29.42 12.66 28.94
5. (25- 31 Dec) 7.42 17.42 11.14 25.33 11.52 26.37 11.28 25.90
6. (01 -7 Jan) 6.16 18.00 9.56 26.99 9.71 27.47 9.61 27.23
7. (08 - 14 Jan) 5.50 23.42 9.18 30.23 9.56 31.61 9.47 31.18
8. (15 -21Jan) 8.28 22.57 11.52 31.18 11.85 31.66 11.66 31.33
9. (22 -28 Jan) 8.66 23.50 12.04 31.66 12.33 31.71 12.13 31.61
10. (29 Jan - 4 Feb) 7.00 27.50 10.23 36.42 10.47 36.75 10.37 36.52
Paired Row Planting (I4)
1. (27 Nov -3 Dec) 7.85 24.71 11.04 32.90 11.76 33.75 11.33 33.61
2. (04 - 10 Dec) 9.71 23.14 12.76 30.99 13.23 32.23 13.04 31.04
3. (11 -17 Dec) 7.85 22.42 11.18 31.8 11.61 32.76 11.33 32.75
4. (18- 24 Dec) 9.28 20.85 12.47 28.75 12.71 29.42 12.66 28.94
5. (25- 31 Dec) 7.42 17.42 11.14 25.33 11.52 26.37 11.28 25.90
6. (01 -7 Jan) 6.16 18.00 9.56 26.99 9.71 27.47 9.61 27.23
7. (08 - 14 Jan) 5.50 23.42 9.18 30.23 9.56 31.61 9.47 31.18
8. (15 -21Jan) 8.28 22.57 11.52 31.18 11.85 31.66 11.66 31.33
9. (22 -28 Jan) 8.66 23.50 12.04 31.66 12.33 31.71 12.13 31.61
10. (29 Jan - 4 Feb) 7.00 27.50 10.23 36.42 10.47 36.75 10.37 36.52
Single Row Planting (I5)
1. (27 Nov -3 Dec) 7.85 24.71 10.47 31.23 10.95 32.18 10.61 31.33
2. (04 - 10 Dec) 9.71 23.14 12.42 29.28 12.66 30.09 12.57 29.85
3. (11 -17 Dec) 7.85 22.42 10.85 30.18 11.09 31.90 10.94 31.33
4. (18- 24 Dec) 9.28 20.85 11.90 27.32 12.33 27.66 12.14 27.56
5. (25- 31 Dec) 7.42 17.42 10.42 23.80 10.99 24.42 10.71 24.18
6. (01 -7 Jan) 6.16 18.00 8.85 24.42 9.33 25.04 9.04 24.90
7. (08 - 14 Jan) 5.50 23.42 8.75 27.90 9.37 29.04 8.90 29.23
8. (15 -21Jan) 8.28 22.57 11.23 30.28 11.47 30.94 11.33 30.47
9. (22 -28 Jan) 8.66 23.50 11.56 28.99 11.76 30.42 11.66 29.94
10. (29 Jan - 4 Feb) 7.00 27.50 10.04 33.57 10.18 35.70 10.09 34.61
3.2 Soil temperature
The measurement of recorded soil temperature also depends on the tunnel height and the
type of irrigation applied as presented in Table 2. At 7:30 am the soil temperature in low tunnel
which varied from 8.71o
C to 16.61o
C was higher by 1.29o
C to 4.76o
C in comparison with open field
whose soil temperature varied from 7.42o
C to 11.85o
C during the low tunnel coverage period.
Among the tunnel height treatments, in H2 treatment the soil temperature was highest which varied
from 9.23o
C to 16.61o
C and was higher by 0.52o
C to 1o
C in comparison with H1 treatment whose
soil temperature was lowest which varied from 8.71o
C to 15.61o
C. Among the irrigation treatments,
in I2 treatment the soil temperature was highest which varied from 10.57o
C to 16.61o
C and was
higher by 0.95o
C to 1.86o
C in comparison with I5 treatment whose soil temperature was lowest
which varied from 8.71o
C to 15.66o
C. For the treatment combination in I2H2 treatment the soil
temperature was highest which varied from 11.13o
C to 16.61o
C and was higher by 2.42o
C to 2.62o
C
Effect of irrigation regimes and low tunnel height…
www.ijesi.org 24 | Page
in comparison with I5H1 treatment whose soil temperature was lowest which varied from 8.71 o
C to
13.99o
C.At 2:30 pm the soil temperature in low tunnel which varied from 20.52o
C to 27.95o
C was
higher by 3.52o
C to 6.38o
C in comparison with open field whose temperature varied from 17o
C to
21.57o
C during the low tunnel coverage period. Among the tunnel height treatments, in H2
treatment the soil temperature was highest which varied from 21.76o
C to 27.95o
C and was higher by
0.48o
C to 1.24o
C in comparison with H1 treatment whose temperature was lowest which varied from
20.52o
C to 27.47o
C. Among the irrigation treatments, in I2 treatment the soil temperature was
highest which varied from 23o
C to 27.95o
C and was higher by 1.43o
C to 2.48o
C in comparison with
I5 treatment whose soil temperature was lowest which varied from 20.52o
C to 26.52o
C. For the
treatment combination in I2H2 treatment the soil temperature was highest which varied from
23.76o
C to 27.95o
C and was higher by 1.43o
C to 2o
C in comparison with I5H1 treatment whose
temperature was lowest which varied from 21.76o
C to 26.52o
C. Differences in soil temperature
between low tunnels treatments may be due to many factors including: initial air and soil
temperature; soil moisture, air volume in tunnel, convective and conductive heat exchange
characteristics of the material, surface area of the tunnel to volume ratio and transmissibility to long
wave radiation.
The above mentioned results were in close proximity with those of Hemphill (1986) who
reported that row covers increased daily mean soil temperature by 1 to 4°C over bare ground. The
results are also in line with those of Gaye and Maurer (1991) who reported that row cover elevated
mean soil temperature 1 to 6°C and promoted plant growth compared with bare soil.
Table 2 Variation of soil temperature in different heights of low tunnel with various irrigation treatments
Week after covering
of crop
Mean Soil
Temp. (o
C)
(Open Field)
Mean Soil Temperature (o
C)
Low Tunnel Heights
45cm 60cm 75cm
7:30
am
2:30
pm
7:30
am
2:30
pm
7:30
am
2:30
pm
7:30
am
2:30
pm
IW/ CPE= 0.60 (I1)
1. (27 Nov -3 Dec) 11.00 19.14 13.28 23.14 13.75 24.19 13.61 23.85
2. (04 - 10 Dec) 11.85 20.57 13.95 25.23 14.66 26.14 14.28 25.71
3. (11 -17 Dec) 9.71 17.42 12.37 22.47 12.90 22.95 12.66 22.66
4. (18- 24 Dec) 11.14 20.85 13.47 25.38 14.09 26.85 13.76 25.9
5. (25- 31 Dec) 11.28 18.14 13.71 22.52 14.04 23.38 13.99 23.00
6. (01 -7 Jan) 10.66 19.14 13.28 23.95 13.94 25.04 13.61 24.47
7. (08 - 14 Jan) 7.42 17.00 10.18 22.33 10.80 23.19 10.42 22.61
8. (15 -21Jan) 10.42 19.57 15.04 23.61 16.00 24.47 15.56 24.14
9. (22 -28 Jan) 9.71 19.71 12.38 23.19 12.75 24.04 12.61 23.57
10. (29 Jan - 4 Feb) 10.50 21.57 13.85 26.28 14.04 27.28 13.99 26.61
IW/CPE= 0.75 (I2)
1. (27 Nov -3 Dec) 11.00 19.14 13.80 24.23 14.28 25.18 14.14 24.62
2. (04 - 10 Dec) 11.85 20.57 14.37 26.38 15.09 26.85 14.71 26.52
3. (11 -17 Dec) 9.71 17.42 12.95 23.00 13.37 23.76 13.18 23.28
4. (18- 24 Dec) 11.14 20.85 13.94 26.85 14.71 27.52 14.47 27.09
5. (25- 31 Dec) 11.28 18.14 14.23 23.42 15.09 24.33 14.47 23.71
6. (01 -7 Jan) 10.66 19.14 13.99 25.04 14.37 25.66 14.13 25.23
7. (08 - 14 Jan) 7.42 17.00 10.57 23.00 11.13 23.76 10.76 23.23
8. (15 -21Jan) 10.42 19.57 15.61 24.71 16.61 26.09 15.85 25.61
9. (22 -28 Jan) 9.71 19.71 12.90 24.19 13.23 25.33 13.00 24.95
10. (29 Jan - 4 Feb) 10.50 21.57 14.04 27.47 14.61 27.95 14.37 27.66
IW/CPE= 0.90 (I3)
1. (27 Nov -3 Dec) 11.00 19.14 13.42 24.09 13.95 24.85 13.71 24.57
2. (04 - 10 Dec) 11.85 20.57 14.23 26.00 14.80 26.62 14.56 26.43
3. (11 -17 Dec) 9.71 17.42 12.75 22.71 13.18 23.38 12.99 23.14
4. (18- 24 Dec) 11.14 20.85 13.85 26.14 14.42 27.04 14.18 26.9
Effect of irrigation regimes and low tunnel height…
www.ijesi.org 25 | Page
5. (25- 31 Dec) 11.28 18.14 13.99 23.14 14.61 23.95 14.33 23.57
6. (01 -7 Jan) 10.66 19.14 13.75 24.76 14.14 25.33 13.95 24.99
7. (08 - 14 Jan) 7.42 17.00 10.33 22.66 10.94 23.52 10.52 22.95
8. (15 -21Jan) 10.42 19.57 15.37 24.33 16.13 24.80 15.71 24.76
9. (22 -28 Jan) 9.71 19.71 12.61 23.99 13.04 24.95 12.90 24.52
10. (29 Jan - 4 Feb) 10.50 21.57 13.94 26.99 14.37 27.52 14.14 27.14
Paired Row Planting (I4)
1. (27 Nov -3 Dec) 11.00 19.14 13.09 22.57 13.61 23.81 13.47 23.28
2. (04 - 10 Dec) 11.85 20.57 13.80 24.42 14.47 25.71 14.14 25.09
3. (11 -17 Dec) 9.71 17.42 12.09 21.19 12.70 22.76 12.37 22.33
4. (18- 24 Dec) 11.14 20.85 13.28 24.95 13.85 25.95 13.71 25.57
5. (25- 31 Dec) 11.28 18.14 13.51 21.71 13.85 23.09 13.71 22.19
6. (01 -7 Jan) 10.66 19.14 13.04 23.05 13.71 24.61 13.37 24.19
7. (08 - 14 Jan) 7.42 17.00 9.94 21.38 10.33 22.23 10.04 21.90
8. (15 -21Jan) 10.42 19.57 14.95 23.43 15.75 24.00 15.37 23.76
9. (22 -28 Jan) 9.71 19.71 12.23 22.76 12.52 23.62 12.37 23.04
10. (29 Jan - 4 Feb) 10.50 21.57 13.66 25.90 13.85 26.81 13.76 26.52
Single Row Planting (I5)
1. (27 Nov -3 Dec) 11.00 19.14 12.95 22.09 13.33 23.47 13.18 22.62
2. (04 - 10 Dec) 11.85 20.57 13.28 24.75 14.13 25.38 13.80 24.19
3. (11 -17 Dec) 9.71 17.42 11.89 20.52 12.33 21.76 12.09 21.57
4. (18- 24 Dec) 11.14 20.85 13.04 23.76 13.56 25.61 13.33 24.90
5. (25- 31 Dec) 11.28 18.14 13.37 21.33 13.71 22.42 13.47 21.90
6. (01 -7 Jan) 10.66 19.14 12.90 22.28 13.42 24.38 13.04 23.42
7. (08 - 14 Jan) 7.42 17.00 8.71 21.09 9.23 22.14 8.95 21.42
8. (15 -21Jan) 10.42 19.57 13.99 22.81 15.66 23.62 14.56 23.19
9. (22 -28 Jan) 9.71 19.71 11.61 22.24 12.23 22.80 11.99 22.47
10. (29 Jan - 4 Feb) 10.50 21.57 13.04 25.42 13.56 26.52 13.23 26.14
3.3 Relative humidity
The measurement of recorded relative humidity also depends on the tunnel height and the
type of irrigation applied as presented in Table 3. At 7:30 am the relative humidity in low tunnel
which varied from 87.59% to 94.13% was lower by 4.58% to 6.55% in comparison with open field
whose relative humidity varied from 94.14% to 98.71% during the low tunnel coverage period.
Among the tunnel height treatments, in H3 treatment the relative humidity was highest which varied
from 88.4% to 94.00% and was higher by 0.01% to 0.81% in comparison with H1 treatment whose
relative humidity was lowest which varied from 87.59% to 93.99%. Among the irrigation
treatments, in I3 treatment the relative humidity was highest which varied from 89.3% to 94.13%
and was higher by 1.23% to 1.71% in comparison with I5 treatment whose relative humidity was
lowest which varied from 87.59% to 92.9%. For the treatment combination in I3H3 treatment the
relative humidity was highest which varied from 89.8% to 93.8% and was higher by 1.19% to 2.23%
in comparison with I5H1 treatment whose relative humidity was lowest which varied from 87.57%
to 92.61%. The decrease in the relative humidity from the open field may be due to dew effect on
the polysheet in the morning.
At 2:30 pm the relative humidity in low tunnel which varied from 59.71% to 91.66% was
higher by 11.52% to 17.57% in comparison with open field whose relative humidity varied from
42.14% to 80.14% during the low tunnel coverage period. Among the tunnel height treatments, in
H2 treatment the relative humidity was highest which varied from 61.75% to 91.66% and was
higher by 1.86% to 2.04% in comparison with H1 treatment whose relative humidity was lowest
which varied from 59.71% to 89.8%. Among the irrigation treatments, in I2 treatment the relative
humidity was highest which varied from 63.71% to 91.66% and was higher by 2% to 4% in
comparison with I5 treatment whose relative humidity was lowest which varied from 59.71% to
89.66%. For the treatment combination in I2H2 treatment the relative humidity was highest which
varied from 67.04% to 91.66% and was higher by 3.57% to 7.28% in comparison with I4H3
treatment whose relative humidity was lowest which varied from 59.76% to 88.09%. Differences in
relative humidity between low tunnels treatments may be due to many factors in cluding: initial air
Effect of irrigation regimes and low tunnel height…
www.ijesi.org 26 | Page
and soil temperature; soil moisture, air volume in tunnel, convective and conductive heat exchange
characteristics of the material, surface area of the tunnel to volume ratio and transmissibility to long
wave radiation. The data also reveals that the low tunnel effect decreases the relative humidity in
the morning but in the daytime it increases the relative humidity to provide favourable condition for
plant growth. The above mentioned results were in close proximity with those of Chaugule et al
(1990).
Table 3 Variation of relative humidity in different heights of low tunnel with various irrigation
treatments
Week after covering
of crop
Mean Relative
Humidity (%)
(Open Field)
Mean Relative Humidity (%)
Low Tunnel Heights
45cm 60cm 75cm
7:30
am
2:30
pm
7:30
am
2:30
pm
7:30
am
2:30
pm
7:30
am
2:30
pm
IW/ CPE= 0.60 (I1)
1. (27 Nov -3 Dec) 98.71 42.14 93.76 63.75 93.52 65.33 94.00 64.8
2. (04 - 10 Dec) 98.14 48.85 91.8 66.33 91.9 67.04 92.09 66.99
3. (11 -17 Dec) 97.71 51.42 90.47 67.47 90.61 69.37 90.87 68.09
4. (18- 24 Dec) 94.14 65.42 88.78 77.99 88.87 80.47 89.21 78.76
5. (25- 31 Dec) 98.14 80.14 91.9 88.04 92.47 90.8 93.18 89.09
6. (01 -7 Jan) 96.85 62 89.95 75.85 90.42 76.8 90.8 76.37
7. (08 - 14 Jan) 97.42 58.85 92.13 74.09 92.61 75.56 92.76 74.85
8. (15 -21Jan) 96.57 68.71 90.33 82.18 90.66 83.09 91.13 82.66
9. (22 -28 Jan) 94.14 66 88.71 78.94 88.85 79.56 89.23 79.18
10. (29 Jan - 4 Feb) 97.57 57.28 89.66 71.71 90.28 74.23 90.9 73.9
IW/CPE= 0.75 (I2)
1. (27 Nov -3 Dec) 98.71 42.14 93.42 63.71 93.9 67.04 93.61 65.56
2. (04 - 10 Dec) 98.14 48.85 91.85 66.28 91.9 68.28 92.47 67.52
3. (11 -17 Dec) 97.71 51.42 90.4 68.23 90.83 69.9 91.54 68.85
4. (18- 24 Dec) 94.14 65.42 88.26 79.18 89.16 82.04 89.73 79.8
5. (25- 31 Dec) 98.14 80.14 92.37 89.8 92.47 91.66 92.56 90.57
6. (01 -7 Jan) 96.85 62 90.28 75.99 90.61 78.28 90.99 77.71
7. (08 - 14 Jan) 97.42 58.85 92.56 74.75 92.8 77.28 93.04 76.18
8. (15 -21Jan) 96.57 68.71 90.66 82.18 91.18 83.47 91.33 81.85
9. (22 -28 Jan) 94.14 66 89.18 81.09 89.23 83.04 89.57 81.61
10. (29 Jan - 4 Feb) 97.57 57.28 90.18 73.8 90.37 75.18 91.37 74.04
IW/CPE= 0.90 (I3)
1. (27 Nov -3 Dec) 98.71 42.14 93.99 63.61 94.13 66.23 93.8 64.09
2. (04 - 10 Dec) 98.14 48.85 92.09 66.04 92.13 67.8 92.66 66.09
3. (11 -17 Dec) 97.71 51.42 91.21 66.47 91.73 69.61 91.83 68.42
4. (18- 24 Dec) 94.14 65.42 89.3 78.75 89.73 80.47 90.11 79.94
5. (25- 31 Dec) 98.14 80.14 92.85 88.94 93.33 90.75 93.47 89.39
6. (01 -7 Jan) 96.85 62 90.94 75.94 91.42 76.85 91.99 76.71
7. (08 - 14 Jan) 97.42 58.85 92.61 73.99 92.99 75.85 93.71 74.37
8. (15 -21Jan) 96.57 68.71 91.14 80.23 91.33 83.04 91.9 82.28
9. (22 -28 Jan) 94.14 66 89.37 80.51 89.61 81.13 89.8 81.09
10. (29 Jan - 4 Feb) 97.57 57.28 91.66 72.23 92.8 74.66 93.13 73.8
Paired Row Planting (I4)
1. (27 Nov -3 Dec) 98.71 42.14 92.85 61.23 93.23 62.99 93.33 59.76
2. (04 - 10 Dec) 98.14 48.85 91.04 65.18 91.23 65.42 91.52 63.42
3. (11 -17 Dec) 97.71 51.42 90.59 66.14 90.78 67.18 91.44 64.33
4. (18- 24 Dec) 94.14 65.42 88.54 77.23 88.73 78.33 89.16 76.66
5. (25- 31 Dec) 98.14 80.14 91.94 88.37 91.99 88.8 92.13 88.09
Effect of irrigation regimes and low tunnel height…
www.ijesi.org 27 | Page
6. (01 -7 Jan) 96.85 62 89.47 74.09 90.18 75.42 90.23 74.13
7. (08 - 14 Jan) 97.42 58.85 91.71 73.61 91.94 72.32 92.32 71.18
8. (15 -21Jan) 96.57 68.71 90.04 82.09 90.56 81.18 90.9 80.37
9. (22 -28 Jan) 94.14 66 88.37 75.71 88.42 76.71 88.47 75.56
10. (29 Jan - 4 Feb) 97.57 57.28 89.8 72.14 90.09 71.71 90.8 69.75
Single Row Planting (I5)
1. (27 Nov -3 Dec) 98.71 42.14 92.61 59.71 92.85 61.75 92.9 60.04
2. (04 - 10 Dec) 98.14 48.85 91.04 63.13 91.18 64.42 91.37 63.28
3. (11 -17 Dec) 97.71 51.42 89.49 64.13 90.3 65.14 90.78 64.61
4. (18- 24 Dec) 94.14 65.42 87.59 75.85 88.11 77.57 88.4 76.85
5. (25- 31 Dec) 98.14 80.14 91.13 88.9 91.51 89.66 91.7 89.18
6. (01 -7 Jan) 96.85 62 89.37 73.04 89.61 74.09 88.99 73.42
7. (08 - 14 Jan) 97.42 58.85 91.33 72.56 91.56 72.28 91.66 71.47
8. (15 -21Jan) 96.57 68.71 89.71 81.8 89.76 81.75 89.9 81.56
9. (22 -28 Jan) 94.14 66 88.42 76.28 88.47 77.37 87.9 76.75
10. (29 Jan - 4 Feb) 97.57 57.28 88.76 71.56 89.71 70.95 89.76 69.85
3.4 Solar radiation
The measurement of solar radiation depends on the tunnel height and the type of irrigation
applied as presented in Table 4. At 2:30 pm the solar radiation in low tunnel which varied from
19614 lux to 43242.66 lux was lower by 16.65% to 37.45% in comparison with open field whose
solar radiation varied from 31360 lux to 51885.71 lux during the low tunnel coverage period.
Among the tunnel height treatments, in H3 treatment the solar radiation was highest which varied
from 19861.66 lux to 43242.66 lux and was higher by 1.26% to 9.01% in comparison with H1
treatment whose solar radiation was lowest which varied from 19614 lux to 39666.33 lux. Among
the irrigation treatments, in I5 treatment the solar radiation was highest which varied from 19718.66
lux to 43242.66 lux and was higher by 0.53% to 6.97% in comparison with I1 treatment whose solar
radiation was lowest which varied from 19614 lux to 40423.33 lux. For the treatment combination
in I5H3 treatment the solar radiation was highest which varied from 19994.66 lux to 43242.66 lux
and was higher by 1.94% to 10.97% in comparison with I1H1 treatment whose solar radiation was
lowest which varied from 19614 lux to 38966.33 lux. Differences in solar radiation between low
tunnels treatments may be due to different surface area of the tunnel and soil moisture distribution.
The above mentioned results were in close proximity with those of Siwek et al (1994) who reported
that on average 70.3% of radiation reached to the plants inside the tunnel.
Table 4 Variation of solar radiation in different heights of low tunnel under various irrigation treatments
Week after covering
of crop
Mean Solar
Radiation (Lux)
(Open Field)
Mean Solar Radiation (Lux)
Low Tunnel Heights
45cm 60cm 75cm
IW/ CPE= 0.60 (I1)
1. (27 Nov -3 Dec) 40328.57 26361.66 27647.00 28399.66
2. (04 - 10 Dec) 50471.42 38304.33 40166.33 40423.33
3. (11 -17 Dec) 45514.28 30399.66 31409.00 33032.66
4. (18- 24 Dec) 48614.28 35270.66 37866.33 38147.00
5. (25- 31 Dec) 31360.00 19614.00 19747.33 19866.00
6. (01 -7 Jan) 33342.85 23380.33 23557.00 23904.33
7. (08 - 14 Jan) 44128.57 29647.00 29871.00 30285.00
8. (15 -21Jan) 51885.71 38966.33 39728.33 39842.33
9. (22 -28 Jan) 46342.85 33914.00 34499.66 34694.66
10. (29 Jan - 4 Feb) 51442.85 36556.66 37004.33 37104.66
IW/CPE= 0.75 (I2)
1. (27 Nov -3 Dec) 40328.57 27218.66 27518.66 28385.33
2. (04 - 10 Dec) 50471.42 39176.00 40361.66 41737.66
3. (11 -17 Dec) 45514.28 31118.66 31823.33 32261.33
Effect of irrigation regimes and low tunnel height…
www.ijesi.org 28 | Page
4. (18- 24 Dec) 48614.28 36399.66 37899.66 39690.00
5. (25- 31 Dec) 31360.00 19695.00 19733.00 19914.00
6. (01 -7 Jan) 33342.85 23328.33 23666.33 23899.66
7. (08 - 14 Jan) 44128.57 29380.66 29875.66 30161.66
8. (15 -21Jan) 51885.71 38909.00 39666.00 39885.33
9. (22 -28 Jan) 46342.85 34480.33 34628.33 34842.66
10. (29 Jan - 4 Feb) 51442.85 36894.66 37066.33 37290.33
IW/CPE= 0.90 (I3)
1. (27 Nov -3 Dec) 40328.57 27037.66 27499.33 27818.66
2. (04 - 10 Dec) 50471.42 39533.00 40076.00 41885.00
3. (11 -17 Dec) 45514.28 30652.00 31542.66 32299.66
4. (18- 24 Dec) 48614.28 37647.33 37704.33 37847.33
5. (25- 31 Dec) 31360.00 19485.33 19752.00 19899.66
6. (01 -7 Jan) 33342.85 23213.66 23490.00 23756.66
7. (08 - 14 Jan) 44128.57 29294.66 29842.33 30242.33
8. (15 -21Jan) 51885.71 39299.66 39475.66 39875.66
9. (22 -28 Jan) 46342.85 33833.00 34633.00 34880.66
10. (29 Jan - 4 Feb) 51442.85 36918.66 37014.00 37175.66
Paired Row Planting (I4)
1. (27 Nov -3 Dec) 40328.57 26814.00 27347.00 27609.00
2. (04 - 10 Dec) 50471.42 39666.33 40433.00 41304.33
3. (11 -17 Dec) 45514.28 30318.66 31856.66 32807.66
4. (18- 24 Dec) 48614.28 35409.33 37928.00 38047.00
5. (25- 31 Dec) 31360.00 19633.00 19761.33 19861.66
6. (01 -7 Jan) 33342.85 23109.00 23433.00 23785.33
7. (08 - 14 Jan) 44128.57 29704.33 29928.33 30190.00
8. (15 -21Jan) 51885.71 39375.66 39599.66 39795.00
9. (22 -28 Jan) 46342.85 33380.33 34490.00 34652.00
10. (29 Jan - 4 Feb) 51442.85 36809.00 37128.33 37290.33
Single Row Planting (I5)
1. (27 Nov -3 Dec) 40328.57 28123.33 28795.00 29999.66
2. (04 - 10 Dec) 50471.42 39661.66 40609.00 43242.66
3. (11 -17 Dec) 45514.28 32566.00 33209.00 33752.00
4. (18- 24 Dec) 48614.28 38356.66 38766.33 39485.33
5. (25- 31 Dec) 31360.00 19718.66 19832.66 19994.66
6. (01 -7 Jan) 33342.85 23499.33 23604.33 23956.66
7. (08 - 14 Jan) 44128.57 29723.33 29990.00 30528.33
8. (15 -21Jan) 51885.71 39370.66 39933.00 39932.66
9. (22 -28 Jan) 46342.85 34447.00 34618.66 34780.66
10. (29 Jan - 4 Feb) 51442.85 36999.66 37185.33 37352.00
IV. CONCLUSIONS
The mean air temperature was higher in low tunnel than open field by 3.25o
C to 3.71o
C and
6.38o
C to 9.30o
C at 7:30 am and 2:30 pm respectively. The mean soil temperature was higher in low
tunnel than open field by 1.29o
C to 4.76o
C and 3.52o
C to 6.30o
C at 7:30 am and 2:30 pm
respectively. The highest air and soil temperature was observed in H2 and I2 treatments in the
tunnel height and irrigation treatments respectively. For the combinations I2H2 treatment gave
higher air and soil temperature than other treatments combinations.
The highest relative humidity observed at 7:30 am and lowest at 2:30 pm. At 7:30 am, in the
low tunnels mean relative humidity lowered by 4.58% to 6.55% than open field but at 2:30 it was
higher by 11.52% to 17.57%. The highest relative humidity was observed in H3 and I2 treatments
among the tunnel height and irrigation treatments respectively. For the combinations I3H3 gave
higher mean relative humidity at 7:30 am but at 2:30 pm combination I2H2 treatment gave higher
relative humidity than other treatment combinations.
The mean solar radiation under low tunnels lowered by 16.65% to 37.45% as compared to
Effect of irrigation regimes and low tunnel height…
www.ijesi.org 29 | Page
open field at 2:30 pm. The highest solar radiation was observed in H3 and I5 treatments in the
tunnel height and irrigation treatments respectively. For the combinations, in I5H3 treatment higher
mean solar radiation was observed than other treatments combinations.
REFERENCES
[1]. Anonymous (2008) Package of Practices for Vegetable Crops. Pp 20-25. PunjabAgricultural University,
Ludhiana.
Chaugule A A, Gutal G B and Kulkarni P V (1990) The feasibility of plastic polyhouse for capsicum crop. Proc
Iinternational Agricultural Engineering Conference and Eexhibition. pp 1485-89, Bangkok, Thailand.
[2]. Gaye M M and Maurer A R (1991) Modified transplant production techniques to increase yield and improve
earliness of Brussels sprouts. J Amer Soc Hort Sci 116: 210-14.
[3]. Hemphill D D (1986) Response of muskmelon to three floating row covers. J Amer Soc Hort Sci 111: 513-17.
[4]. Wolfe D W, Albright L D and Wyland J (1989) Modeling row cover effects on microclimate and yiield : I.
Growth response of tomato and cucumber. J Amer Soc Hort Sci 114: 562-68.
[5]. Lamarrel M, Larean M J, Payette S and Fortin C (1996) Influence of nitrogen fertilization, row covers and
cultivars on the production of day neutral strawberry. Canadian J Soil Sci 76: 29-36.
[6]. Libik A and Siwek P (1994) Changes in soil temperature affected by the application of plastic covers in field
production of lettuce and water melon. Acta Hort 371: 269-73.

More Related Content

What's hot

Development of Wind Operated Passive Evaporative Cooling Structures for Stora...
Development of Wind Operated Passive Evaporative Cooling Structures for Stora...Development of Wind Operated Passive Evaporative Cooling Structures for Stora...
Development of Wind Operated Passive Evaporative Cooling Structures for Stora...
AZOJETE UNIMAID
 
Integrating Renewable Energy into your Farm Plan
Integrating Renewable Energy into your Farm PlanIntegrating Renewable Energy into your Farm Plan
Integrating Renewable Energy into your Farm Plan
cegundacker
 

What's hot (20)

Development of Wind Operated Passive Evaporative Cooling Structures for Stora...
Development of Wind Operated Passive Evaporative Cooling Structures for Stora...Development of Wind Operated Passive Evaporative Cooling Structures for Stora...
Development of Wind Operated Passive Evaporative Cooling Structures for Stora...
 
10. article azojete vol. 12 94 102 sunmonu
10. article azojete vol. 12 94 102 sunmonu10. article azojete vol. 12 94 102 sunmonu
10. article azojete vol. 12 94 102 sunmonu
 
CONSTRUCTION OF GREENHOUSE
CONSTRUCTION OF GREENHOUSECONSTRUCTION OF GREENHOUSE
CONSTRUCTION OF GREENHOUSE
 
Recent advances in green house climate control and energy use in INDIA
 Recent advances in  green house climate control and energy use in INDIA Recent advances in  green house climate control and energy use in INDIA
Recent advances in green house climate control and energy use in INDIA
 
Green house Introduction types
Green house Introduction typesGreen house Introduction types
Green house Introduction types
 
PLANNING AND DESIGN OF GREENHOUSE
PLANNING AND DESIGN OF GREENHOUSEPLANNING AND DESIGN OF GREENHOUSE
PLANNING AND DESIGN OF GREENHOUSE
 
grennhouse
grennhousegrennhouse
grennhouse
 
COOLING AND HEATING OF GREENHOUSE
COOLING AND HEATING OF GREENHOUSECOOLING AND HEATING OF GREENHOUSE
COOLING AND HEATING OF GREENHOUSE
 
Application of renewable energy technology for controlled atmosphere
Application of  renewable energy technology for controlled atmosphereApplication of  renewable energy technology for controlled atmosphere
Application of renewable energy technology for controlled atmosphere
 
Class 2 Types of green house
Class 2 Types of green houseClass 2 Types of green house
Class 2 Types of green house
 
Greenhouse technology
Greenhouse technologyGreenhouse technology
Greenhouse technology
 
Integrating Renewable Energy into your Farm Plan
Integrating Renewable Energy into your Farm PlanIntegrating Renewable Energy into your Farm Plan
Integrating Renewable Energy into your Farm Plan
 
Protected Cultivation
Protected CultivationProtected Cultivation
Protected Cultivation
 
Microclimate Modification Using Eco-Friendly Nets & Floating Row Covers Impro...
Microclimate Modification Using Eco-Friendly Nets & Floating Row Covers Impro...Microclimate Modification Using Eco-Friendly Nets & Floating Row Covers Impro...
Microclimate Modification Using Eco-Friendly Nets & Floating Row Covers Impro...
 
Plant response to green house environment
Plant response to green house environmentPlant response to green house environment
Plant response to green house environment
 
Temperature Monitering System For Smart Crop
Temperature Monitering System For Smart CropTemperature Monitering System For Smart Crop
Temperature Monitering System For Smart Crop
 
GREEN HOUSE ENVIRONMENT
GREEN HOUSE ENVIRONMENTGREEN HOUSE ENVIRONMENT
GREEN HOUSE ENVIRONMENT
 
Urban Agriculture Technology
Urban Agriculture TechnologyUrban Agriculture Technology
Urban Agriculture Technology
 
OPTIMIZING THE GREENHOUSE MICRO-CLIMATE MANAGEMENT BY THE INTRODUCTION OF ART...
OPTIMIZING THE GREENHOUSE MICRO-CLIMATE MANAGEMENT BY THE INTRODUCTION OF ART...OPTIMIZING THE GREENHOUSE MICRO-CLIMATE MANAGEMENT BY THE INTRODUCTION OF ART...
OPTIMIZING THE GREENHOUSE MICRO-CLIMATE MANAGEMENT BY THE INTRODUCTION OF ART...
 
Design and Construction of Solar Dryer for Drying Agricultural Products
Design and Construction of Solar Dryer for Drying Agricultural ProductsDesign and Construction of Solar Dryer for Drying Agricultural Products
Design and Construction of Solar Dryer for Drying Agricultural Products
 

Similar to Effect of Irrigation Regimes & Low Tunnel Heights on Microclimatic Parameters in the Growing of Sweet Pepper

V4I2-IJERTV4IS020774
V4I2-IJERTV4IS020774V4I2-IJERTV4IS020774
V4I2-IJERTV4IS020774
Vijesh Ravi
 
Effect of Spacing and Topping on the Performance of Hydroponically Grown Toma...
Effect of Spacing and Topping on the Performance of Hydroponically Grown Toma...Effect of Spacing and Topping on the Performance of Hydroponically Grown Toma...
Effect of Spacing and Topping on the Performance of Hydroponically Grown Toma...
Journal of Agriculture and Crops
 

Similar to Effect of Irrigation Regimes & Low Tunnel Heights on Microclimatic Parameters in the Growing of Sweet Pepper (20)

Low tunnel technology in cucurbits
Low tunnel technology in cucurbitsLow tunnel technology in cucurbits
Low tunnel technology in cucurbits
 
Tunnel farming and its significance
Tunnel farming and its significanceTunnel farming and its significance
Tunnel farming and its significance
 
Ijsrp p8083
Ijsrp p8083Ijsrp p8083
Ijsrp p8083
 
Experiment Analysis of Open, Simple and Modified Greenhouse Dryers for Drying...
Experiment Analysis of Open, Simple and Modified Greenhouse Dryers for Drying...Experiment Analysis of Open, Simple and Modified Greenhouse Dryers for Drying...
Experiment Analysis of Open, Simple and Modified Greenhouse Dryers for Drying...
 
Design and Evaluation of Gravity-Fed Perforated Tube Drip Irrigation for Dry...
Design and Evaluation of Gravity-Fed Perforated Tube Drip  Irrigation for Dry...Design and Evaluation of Gravity-Fed Perforated Tube Drip  Irrigation for Dry...
Design and Evaluation of Gravity-Fed Perforated Tube Drip Irrigation for Dry...
 
The Effect of Pot Volume on the Performance
The Effect of Pot Volume on the PerformanceThe Effect of Pot Volume on the Performance
The Effect of Pot Volume on the Performance
 
V4I2-IJERTV4IS020774
V4I2-IJERTV4IS020774V4I2-IJERTV4IS020774
V4I2-IJERTV4IS020774
 
Vegetables tunnel technology A Lecture By Mr Allah Dad Khan Former DG Agricu...
Vegetables tunnel technology  A Lecture By Mr Allah Dad Khan Former DG Agricu...Vegetables tunnel technology  A Lecture By Mr Allah Dad Khan Former DG Agricu...
Vegetables tunnel technology A Lecture By Mr Allah Dad Khan Former DG Agricu...
 
Performance Analysis of Single Pass Earth Tube Heat Exchanger for Cooling in ...
Performance Analysis of Single Pass Earth Tube Heat Exchanger for Cooling in ...Performance Analysis of Single Pass Earth Tube Heat Exchanger for Cooling in ...
Performance Analysis of Single Pass Earth Tube Heat Exchanger for Cooling in ...
 
B04120610
B04120610B04120610
B04120610
 
Effect of Spacing and Topping on the Performance of Hydroponically Grown Toma...
Effect of Spacing and Topping on the Performance of Hydroponically Grown Toma...Effect of Spacing and Topping on the Performance of Hydroponically Grown Toma...
Effect of Spacing and Topping on the Performance of Hydroponically Grown Toma...
 
Off season vegetables ,tunnel technology By Allah Dad Khan
Off season vegetables ,tunnel technology By Allah Dad KhanOff season vegetables ,tunnel technology By Allah Dad Khan
Off season vegetables ,tunnel technology By Allah Dad Khan
 
Experimental Analysis of Open, Simple and Modified Greenhouse Dryers for Dryi...
Experimental Analysis of Open, Simple and Modified Greenhouse Dryers for Dryi...Experimental Analysis of Open, Simple and Modified Greenhouse Dryers for Dryi...
Experimental Analysis of Open, Simple and Modified Greenhouse Dryers for Dryi...
 
Design and Experimentation of Collector based Solar Dryer with Recirculation ...
Design and Experimentation of Collector based Solar Dryer with Recirculation ...Design and Experimentation of Collector based Solar Dryer with Recirculation ...
Design and Experimentation of Collector based Solar Dryer with Recirculation ...
 
Tunnel technology for Off season Vegetables by Allah Dad Khan
Tunnel technology for Off season Vegetables by Allah Dad Khan Tunnel technology for Off season Vegetables by Allah Dad Khan
Tunnel technology for Off season Vegetables by Allah Dad Khan
 
Tunnel technology
Tunnel technologyTunnel technology
Tunnel technology
 
Vegetables Tunnel technology to Eradicate Poverty in Pakistan Presentation By...
Vegetables Tunnel technology to Eradicate Poverty in Pakistan Presentation By...Vegetables Tunnel technology to Eradicate Poverty in Pakistan Presentation By...
Vegetables Tunnel technology to Eradicate Poverty in Pakistan Presentation By...
 
O41038993
O41038993O41038993
O41038993
 
Drying of agricultural products using forced convection indirect solar dryer
Drying of agricultural products using forced convection indirect solar dryerDrying of agricultural products using forced convection indirect solar dryer
Drying of agricultural products using forced convection indirect solar dryer
 
A review on use of sea water & solar power for agricultural purpose in co...
A review on use of sea water & solar power for agricultural purpose in co...A review on use of sea water & solar power for agricultural purpose in co...
A review on use of sea water & solar power for agricultural purpose in co...
 

More from School Vegetable Gardening - Victory Gardens

More from School Vegetable Gardening - Victory Gardens (20)

Behind Enemy Lines - Marthe Cohn - One Woman against Nazi Germany
Behind Enemy Lines - Marthe Cohn - One Woman against Nazi GermanyBehind Enemy Lines - Marthe Cohn - One Woman against Nazi Germany
Behind Enemy Lines - Marthe Cohn - One Woman against Nazi Germany
 
Classical Art School Gardening Posters
Classical Art School Gardening PostersClassical Art School Gardening Posters
Classical Art School Gardening Posters
 
One Teacher Saves her School & her Students
One Teacher Saves her School & her StudentsOne Teacher Saves her School & her Students
One Teacher Saves her School & her Students
 
Coconut Oil helps Heal Children's ADHD - ADD Disease, Autism & Alzheimer Disease
Coconut Oil helps Heal Children's ADHD - ADD Disease, Autism & Alzheimer DiseaseCoconut Oil helps Heal Children's ADHD - ADD Disease, Autism & Alzheimer Disease
Coconut Oil helps Heal Children's ADHD - ADD Disease, Autism & Alzheimer Disease
 
One Teacher Makes Students into Champions
One Teacher Makes Students into ChampionsOne Teacher Makes Students into Champions
One Teacher Makes Students into Champions
 
Good Books help Students Excel in Life & School
Good Books help Students Excel in Life & SchoolGood Books help Students Excel in Life & School
Good Books help Students Excel in Life & School
 
Greening & Restoring the Sahara Desert with the Groasis Waterboxx
Greening & Restoring the Sahara Desert with the Groasis WaterboxxGreening & Restoring the Sahara Desert with the Groasis Waterboxx
Greening & Restoring the Sahara Desert with the Groasis Waterboxx
 
Groasis Waterboxx Lets Trees Grow Up in Unfriendly Places
Groasis Waterboxx Lets Trees Grow Up in Unfriendly PlacesGroasis Waterboxx Lets Trees Grow Up in Unfriendly Places
Groasis Waterboxx Lets Trees Grow Up in Unfriendly Places
 
Explanation of the Groasis Technology for Growing Food in Desert Regions
Explanation of the Groasis Technology for Growing Food in Desert RegionsExplanation of the Groasis Technology for Growing Food in Desert Regions
Explanation of the Groasis Technology for Growing Food in Desert Regions
 
Groasis Waterboxx & the Agua, Vida Naturaleza Project for Growing Food in Des...
Groasis Waterboxx & the Agua, Vida Naturaleza Project for Growing Food in Des...Groasis Waterboxx & the Agua, Vida Naturaleza Project for Growing Food in Des...
Groasis Waterboxx & the Agua, Vida Naturaleza Project for Growing Food in Des...
 
Groasis Waterboxx Handbook on Planting Instructions for Trees & Crops in Dese...
Groasis Waterboxx Handbook on Planting Instructions for Trees & Crops in Dese...Groasis Waterboxx Handbook on Planting Instructions for Trees & Crops in Dese...
Groasis Waterboxx Handbook on Planting Instructions for Trees & Crops in Dese...
 
Groasis Waterboxx Manual for Growing Vegetables in Arid Lands
Groasis Waterboxx Manual for Growing Vegetables in Arid LandsGroasis Waterboxx Manual for Growing Vegetables in Arid Lands
Groasis Waterboxx Manual for Growing Vegetables in Arid Lands
 
Water Saving Measures of Using the Groasis Waterboxx in Organic Gardening in ...
Water Saving Measures of Using the Groasis Waterboxx in Organic Gardening in ...Water Saving Measures of Using the Groasis Waterboxx in Organic Gardening in ...
Water Saving Measures of Using the Groasis Waterboxx in Organic Gardening in ...
 
Making a Week’s Worth of Rain Last the Whole Year
Making a Week’s Worth of Rain Last the Whole YearMaking a Week’s Worth of Rain Last the Whole Year
Making a Week’s Worth of Rain Last the Whole Year
 
Using the Groasis Waterboxx to Plant New Trees in Desert Regions
Using the Groasis Waterboxx to Plant New Trees in Desert RegionsUsing the Groasis Waterboxx to Plant New Trees in Desert Regions
Using the Groasis Waterboxx to Plant New Trees in Desert Regions
 
Greening the World - Desert Restoration, Reduce CO2, Feed the People & Create...
Greening the World - Desert Restoration, Reduce CO2, Feed the People & Create...Greening the World - Desert Restoration, Reduce CO2, Feed the People & Create...
Greening the World - Desert Restoration, Reduce CO2, Feed the People & Create...
 
Groasis Technology Compared to Drip Irrigation
Groasis Technology Compared to Drip IrrigationGroasis Technology Compared to Drip Irrigation
Groasis Technology Compared to Drip Irrigation
 
Groasis Waterboxx - Palm Springs Students Test New Planter Designed to Fight ...
Groasis Waterboxx - Palm Springs Students Test New Planter Designed to Fight ...Groasis Waterboxx - Palm Springs Students Test New Planter Designed to Fight ...
Groasis Waterboxx - Palm Springs Students Test New Planter Designed to Fight ...
 
Groasis Waterboxx Handbook for Planting Methods & Sample of Crop Test Results...
Groasis Waterboxx Handbook for Planting Methods & Sample of Crop Test Results...Groasis Waterboxx Handbook for Planting Methods & Sample of Crop Test Results...
Groasis Waterboxx Handbook for Planting Methods & Sample of Crop Test Results...
 
Groasis Waterboxx Technology Offers Possible Cure for the Deserts
Groasis Waterboxx Technology Offers Possible Cure for the DesertsGroasis Waterboxx Technology Offers Possible Cure for the Deserts
Groasis Waterboxx Technology Offers Possible Cure for the Deserts
 

Recently uploaded

Seal of Good Local Governance (SGLG) 2024Final.pptx
Seal of Good Local Governance (SGLG) 2024Final.pptxSeal of Good Local Governance (SGLG) 2024Final.pptx
Seal of Good Local Governance (SGLG) 2024Final.pptx
negromaestrong
 
1029-Danh muc Sach Giao Khoa khoi 6.pdf
1029-Danh muc Sach Giao Khoa khoi  6.pdf1029-Danh muc Sach Giao Khoa khoi  6.pdf
1029-Danh muc Sach Giao Khoa khoi 6.pdf
QucHHunhnh
 
Russian Escort Service in Delhi 11k Hotel Foreigner Russian Call Girls in Delhi
Russian Escort Service in Delhi 11k Hotel Foreigner Russian Call Girls in DelhiRussian Escort Service in Delhi 11k Hotel Foreigner Russian Call Girls in Delhi
Russian Escort Service in Delhi 11k Hotel Foreigner Russian Call Girls in Delhi
kauryashika82
 
Activity 01 - Artificial Culture (1).pdf
Activity 01 - Artificial Culture (1).pdfActivity 01 - Artificial Culture (1).pdf
Activity 01 - Artificial Culture (1).pdf
ciinovamais
 

Recently uploaded (20)

Explore beautiful and ugly buildings. Mathematics helps us create beautiful d...
Explore beautiful and ugly buildings. Mathematics helps us create beautiful d...Explore beautiful and ugly buildings. Mathematics helps us create beautiful d...
Explore beautiful and ugly buildings. Mathematics helps us create beautiful d...
 
Key note speaker Neum_Admir Softic_ENG.pdf
Key note speaker Neum_Admir Softic_ENG.pdfKey note speaker Neum_Admir Softic_ENG.pdf
Key note speaker Neum_Admir Softic_ENG.pdf
 
Web & Social Media Analytics Previous Year Question Paper.pdf
Web & Social Media Analytics Previous Year Question Paper.pdfWeb & Social Media Analytics Previous Year Question Paper.pdf
Web & Social Media Analytics Previous Year Question Paper.pdf
 
Seal of Good Local Governance (SGLG) 2024Final.pptx
Seal of Good Local Governance (SGLG) 2024Final.pptxSeal of Good Local Governance (SGLG) 2024Final.pptx
Seal of Good Local Governance (SGLG) 2024Final.pptx
 
Asian American Pacific Islander Month DDSD 2024.pptx
Asian American Pacific Islander Month DDSD 2024.pptxAsian American Pacific Islander Month DDSD 2024.pptx
Asian American Pacific Islander Month DDSD 2024.pptx
 
2024-NATIONAL-LEARNING-CAMP-AND-OTHER.pptx
2024-NATIONAL-LEARNING-CAMP-AND-OTHER.pptx2024-NATIONAL-LEARNING-CAMP-AND-OTHER.pptx
2024-NATIONAL-LEARNING-CAMP-AND-OTHER.pptx
 
On National Teacher Day, meet the 2024-25 Kenan Fellows
On National Teacher Day, meet the 2024-25 Kenan FellowsOn National Teacher Day, meet the 2024-25 Kenan Fellows
On National Teacher Day, meet the 2024-25 Kenan Fellows
 
Grant Readiness 101 TechSoup and Remy Consulting
Grant Readiness 101 TechSoup and Remy ConsultingGrant Readiness 101 TechSoup and Remy Consulting
Grant Readiness 101 TechSoup and Remy Consulting
 
1029-Danh muc Sach Giao Khoa khoi 6.pdf
1029-Danh muc Sach Giao Khoa khoi  6.pdf1029-Danh muc Sach Giao Khoa khoi  6.pdf
1029-Danh muc Sach Giao Khoa khoi 6.pdf
 
Russian Escort Service in Delhi 11k Hotel Foreigner Russian Call Girls in Delhi
Russian Escort Service in Delhi 11k Hotel Foreigner Russian Call Girls in DelhiRussian Escort Service in Delhi 11k Hotel Foreigner Russian Call Girls in Delhi
Russian Escort Service in Delhi 11k Hotel Foreigner Russian Call Girls in Delhi
 
Mixin Classes in Odoo 17 How to Extend Models Using Mixin Classes
Mixin Classes in Odoo 17  How to Extend Models Using Mixin ClassesMixin Classes in Odoo 17  How to Extend Models Using Mixin Classes
Mixin Classes in Odoo 17 How to Extend Models Using Mixin Classes
 
Mehran University Newsletter Vol-X, Issue-I, 2024
Mehran University Newsletter Vol-X, Issue-I, 2024Mehran University Newsletter Vol-X, Issue-I, 2024
Mehran University Newsletter Vol-X, Issue-I, 2024
 
Sociology 101 Demonstration of Learning Exhibit
Sociology 101 Demonstration of Learning ExhibitSociology 101 Demonstration of Learning Exhibit
Sociology 101 Demonstration of Learning Exhibit
 
psychiatric nursing HISTORY COLLECTION .docx
psychiatric  nursing HISTORY  COLLECTION  .docxpsychiatric  nursing HISTORY  COLLECTION  .docx
psychiatric nursing HISTORY COLLECTION .docx
 
TỔNG ÔN TẬP THI VÀO LỚP 10 MÔN TIẾNG ANH NĂM HỌC 2023 - 2024 CÓ ĐÁP ÁN (NGỮ Â...
TỔNG ÔN TẬP THI VÀO LỚP 10 MÔN TIẾNG ANH NĂM HỌC 2023 - 2024 CÓ ĐÁP ÁN (NGỮ Â...TỔNG ÔN TẬP THI VÀO LỚP 10 MÔN TIẾNG ANH NĂM HỌC 2023 - 2024 CÓ ĐÁP ÁN (NGỮ Â...
TỔNG ÔN TẬP THI VÀO LỚP 10 MÔN TIẾNG ANH NĂM HỌC 2023 - 2024 CÓ ĐÁP ÁN (NGỮ Â...
 
Holdier Curriculum Vitae (April 2024).pdf
Holdier Curriculum Vitae (April 2024).pdfHoldier Curriculum Vitae (April 2024).pdf
Holdier Curriculum Vitae (April 2024).pdf
 
Measures of Central Tendency: Mean, Median and Mode
Measures of Central Tendency: Mean, Median and ModeMeasures of Central Tendency: Mean, Median and Mode
Measures of Central Tendency: Mean, Median and Mode
 
ICT Role in 21st Century Education & its Challenges.pptx
ICT Role in 21st Century Education & its Challenges.pptxICT Role in 21st Century Education & its Challenges.pptx
ICT Role in 21st Century Education & its Challenges.pptx
 
INDIA QUIZ 2024 RLAC DELHI UNIVERSITY.pptx
INDIA QUIZ 2024 RLAC DELHI UNIVERSITY.pptxINDIA QUIZ 2024 RLAC DELHI UNIVERSITY.pptx
INDIA QUIZ 2024 RLAC DELHI UNIVERSITY.pptx
 
Activity 01 - Artificial Culture (1).pdf
Activity 01 - Artificial Culture (1).pdfActivity 01 - Artificial Culture (1).pdf
Activity 01 - Artificial Culture (1).pdf
 

Effect of Irrigation Regimes & Low Tunnel Heights on Microclimatic Parameters in the Growing of Sweet Pepper

  • 1. International Journal of Engineering Science Invention ISSN (Online): 2319 – 6734, ISSN (Print): 2319 – 6726 www.ijesi.org Volume 2 Issue 7 ǁ July. 2013 ǁ PP.20-29 www.ijesi.org 20 | Page Effect of irrigation regimes and low tunnel heights on microclimatic parameters in the growing of sweet pepper A. S. Lodhi1 , Arun Kaushal2 and K. G. Singh3 1 *(Correspondence Author) Former M. Tech. Student, Soil And Water Engineering Department, Punjab Agricultural University, Ludhiana, India 2 Associate Professor, Soil and Water Engineering Department, Punjab Agricultural University, Ludhiana, India 3 Research Engineer, Soil and Water Engineering Department, Punjab Agricultural University, Ludhiana, India ABSTRACT: Field experiment was conducted in the Department of Soil and Water Engineering, PAU, Ludhiana in 2008-09 to study the effects of low tunnel environment in growing of sweet pepper (Capsicum annuum L. var. grossum). The experiment was laid out in split plot design keeping five irrigation treatments (drip irrigation with IW/CPE ratio of 0.60 (I1), 0.75 (I2), 0.90 (I3), furrow irrigation with paired row planting (I4) and single row planting (I5)), in main plots and three different low tunnel heights (45cm (H1), 60cm (H2) and 75cm (H3)) in sub plots and replicated three times. The air temperature, soil temperature, Relative humidity, solar radiations were observed. For the combinations I2H2 treatment gave higher air and soil temperature than other treatments combinations and I3H3 gave higher mean relative humidity at 7:30 am but at 2:30 pm combination I2H2 treatment gave higher relative humidity than other treatment combinations. KEYWORDS: Air temperature, Soil temperature, Relative Humidity, Microclimate, Low Tunnels, Sweet pepper. I. INTRODUCTION Capsicum (Capsicum annuum L. var. grossum) or sweet pepper is one of the most popular and high value vegetable crops grown for its immature fruits around the world. High demand of fresh vegetables generated in domestic and export market throughout the year. But due to unfavourable climatic conditions there is a flood of vegetables in the season and very high priced vegetables in off - season. Vegetables can be cultivated in off-season, with the induction of artificial techniques like green houses, low and high poly tunnels technology, in which temperature and moisture are controlled for specific growth of vegetables. The production of vegetables all around the year enables the growers to fully utilize their resources and supplement income from vegetable growing as compared to other normal agricultural crops. For sweet pepper the optimum night temperature for quality fruits production 16-18°C. When the temperature falls below 16°C for extended periods, growth and yields usually decreases. It can tolerate day temperature above 30°C. Sweet pepper are generally raised in open during main season thus causing glut in the market, which lead to price crash in the season. Punjab has extreme low temperature during winter and high temperature during summer, therefore, availability of these vegetable is for a short span. This situation suggests us to modify microclimate, which will not only increase the availability span of vegetables but also the yield. Low tunnel technology can help sweet pepper in off- season during early summer. With this technology, the farmers can capture the market in the early season and may get good return of their produce. Low tunnels or row covers are plastic film covered shelters with small frames, producing greenhouse like effect. For low tunnels the sheet of the film is placed over the plants in a single or double row with an arch-shaped frame for support. The shape of the frame can vary but the farmer cannot work inside the low tunnels. These tunnels facilitate the entrapment of carbon dioxide, thereby enhancing the photosynthetic activity of the plants and hence the yield. These structures also protect the plants from the high winds, rain, frost and snow. Besides being inexpensive they are easy to construct and dismantle. Low tunnels are being used for producing high quality high valued nurseries and crops such as tomatoes, cucumber, radish, beans and capsicum. Libik and Siwek (1994) studied the changes in soil temperature affected by the application of plastic covers in field production of lettuce and watermelon. It was reported that at 8.00 h soil temperature was 3°C higher than in the open ground and by 14.00 h the air temperature under the cover was 10-15°C higher than the ambient temperature. Lamarrel et al (1996) was found that the use of low tunnel has been beneficial during winter when the crop has to be protected from frost and low temperature for higher productivity.
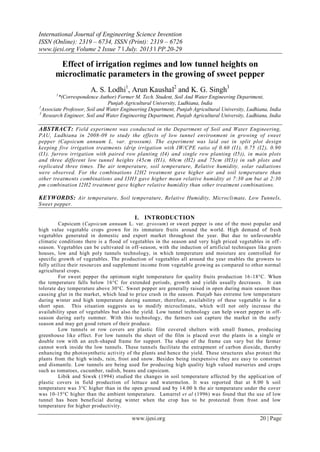
  • 2. Effect of irrigation regimes and low tunnel height… www.ijesi.org 21 | Page II. MATERIALS AND METHODS Field experiment was conducted at the Research Farm of the Department of Soil and Water Engineering, PAU, Ludhiana from October, 2008 to June, 2009. Ludhiana is situated at latitude of 30o 54`N and longitude of 75o 48`E and at a mean height of 247 meters above sea level. Average minimum and maximum temperature in the region varies from 3o C to 43o C respectively. A field plot measuring approximately 550.8 m2 (54mx10.2m) was prepared and the experiment was laid out in split plot design keeping five irrigation treatments in main plots and three different heights of low tunnel in sub plots and replicated three times. The irrigation treatments were taken as main plots as they require bigger plot size. The three treatments of different heights of low tunnel made with tunnel frame height of 45cm (H1), 60cm (H2) and 75cm (H3) were used in the experiment. Low tunnels were made with the 6mm thick steel (iron) rods. The shape of the low tunnel frame was made parabolic with the given base and desired height. A length of 15cm at the base was kept for inserting frame into the soil and inside loops was provided on both side of frame for the support in addition to low tunnel height. Nursery raising of sweet pepper of “Bharath” variety was done in polyhouse on 13th of October, 2008 and transplanting was done in the field on 17th of November, 2008. In paired sowing 60 cm wide beds were raised, row to row space between paired rows was 45 cm and row space between pairs was 75 cm but plant to plant space was kept as 30 cm. Irrigation was applied as per the treatments. In the single furrow the row to row spacing was 60 cm and plant to plant spacing was 30 cm. As per the recommendations of PAU Ludhiana “Package of Practices for Vegetable Crops” (Anonymous, 2008) full package of plant protection measures were adopted during the growth period of crop so as to have a disease free and weed free crop. Fig.1 Low tunnels of different heights in experimental field After transplanting of crop, the crop was covered with polysheet of 50 micron thickness with width of 150cm, 185cm and 240cm over the low tunnel frame heights of 45cm, 60cm and 75cm respectively, to protect crop from frost and other injury (Fig.1). The low tunnel frames were kept at beginning and at end of paired row and distance between successive frames was kept as 2.50m. The crop was completely covered with low tunnel till 4th February, 2009 and after that low tunnels were removed. To observe the effect of low tunnels on soil temperature, soil temperature thermometers were installed at a depth of 10 cm in the field in 45 sub-plots under low tunnel and outside in adjoining open field. Daily data of minimum and maximum soil temperature was recorded till the tunnel cover was removed from the crop. The minimum temperature was recorded at 7.30 AM in the morning and maximum temperature was recorded at 2.30 PM in the afternoon. Maximum and minimum air temperature was recorded by placing thermometer at middle in each sub-plot and outside in adjoining open field. This observation was also recorded daily at 7.30 AM and 2.30 PM respectively till the tunnel cover was removed from the crop. Relative humidity was recorded by placing hygrometer at middle in each sub-plot and outside in adjoining open field. These observations were also recorded daily at 7:30 AM and 2:30 PM till the tunnel cover was removed from the crop. Maximum solar radiation inside the tunnel and outside in adjoining field was taken out by using digital Lux meter (TES 1332) daily at 2.30 PM till the tunnel cover was removed from the crop.
  • 3. Effect of irrigation regimes and low tunnel height… www.ijesi.org 22 | Page III. RESULTS AND DISCUSSION To observe the effect of different treatments on microclimate inside the low tunnels air temperature, soil temperature, relative humidity and solar radiation were recorded daily from the time when the crop was covered with low tunnels till the low tunnels were removed (i.e. 27th Nov,2008 to 4th Feb,2009). Mean of seven days was calculated and used for analysis. 3.1 Air Temperature The measurement of recorded temperature showed that the thermal condition depends on the tunnel height and the type of irrigation applied as presented in Table 1. At 7:30 am the air temperature in low tunnel which varied from 8.75o C to 13.42o C was higher by 3.25o C to 3.71o C in comparison with open field whose temperature varied from 5.50o C to 9.71o C during the low tunnel coverage period. Among the tunnel height treatments, in H2 treatment the air temperature was highest which varied from 9.33o C to 13.42o C and was higher by 0.57o C to 0.58o C in comparison with H1 treatment whose temperature was lowest which varied from 8.75o C to 12.85o C. Among the irrigation treatments, in I2 treatment the air temperature was highest which varied from 9.61 o C to 13.42o C and was higher by 0.76o C to 0.86o C in comparison with I5 treatment whose temperature was lowest which varied from 8.75o C to 12.66o C. For the treatment combination in I2H2 treatment the air temperature was highest which varied from 9.75o C to 13.42o C and was higher by 1o C in comparison with I5H1 treatment whose temperature was lowest which varied from 8.75o C to 12.42o C. At 2:30 pm the air temperature in low tunnel which varied from 23.8o C to 36.8o C was higher by 6.38o C to 9.3o C in comparison with open field whose temperature varied from 17.42o C to 27.5o C during the low tunnel coverage period. Among the tunnel height treatments, in H2 treatment the air temperature was highest which varied from 24.42o C to 36.8o C and was higher by 0.14o C to 0.62o C in comparison with H1 treatment whose temperature was lowest which varied from 23.8o C to 36.66o C. Among the irrigation treatments, in I2 treatment the air temperature was highest which varied from 25.94o C to 36.8o C and was higher by 1.1o C to 2.14o C in comparison with I5 treatment whose temperature was lowest which varied from 23.8o C to 35.7o C. For the treatment combination in I2H2 treatment the air temperature was highest which varied from 26.61o C to 36.8o C and was higher by 2.81o C to 3.23o C in comparison with I5H1 treatment whose temperature was lowest which varied from 23.8o C to 33.57o C. Differences in temperature between low tunnels treatments may be due to many factors including: initial air and soil temperature; soil moisture, air volume in tunnel, convective and conductive heat exchange characteristics of the material and transmissibility to long wave radiation. The above mentioned results were in close proximity with those of Wolfe et al (1989) who reported 5°C to 20°C daytime air temperature rise under row covers as compared with open field. Table 1 Variation of air temperature in different heights of low tunnel with various irrigation treatments Week after covering of crop Mean Air Temp. (o C) (Open Field) Mean Air Temperature (o C) Low Tunnel Heights 45cm 60cm 75cm 7:30 am 2:30 pm 7:30 am 2:30 pm 7:30 am 2:30 pm 7:30 am 2:30 pm IW/ CPE= 0.60 (I1) 1. (27 Nov -3 Dec) 7.85 24.71 10.90 32.47 11.37 33.42 11.14 33.09 2. (04 - 10 Dec) 9.71 23.14 12.66 30.52 13.04 31.28 12.80 30.85 3. (11 -17 Dec) 7.85 22.42 11.09 31.37 11.42 32.90 11.18 32.37 4. (18- 24 Dec) 9.28 20.85 12.33 27.90 12.61 28.94 12.56 28.66 5. (25- 31 Dec) 7.42 17.42 10.71 24.94 11.33 25.80 10.99 25.28 6. (01 -7 Jan) 6.16 18.00 9.33 26.28 9.56 27.09 9.51 26.95 7. (08 - 14 Jan) 5.50 23.42 9.04 30.04 9.52 31.24 9.28 30.61 8. (15 -21Jan) 8.28 22.57 11.42 30.85 11.61 31.71 11.52 31.14 9. (22 -28 Jan) 8.66 23.50 11.85 30.18 11.99 31.56 11.95 31.28 10. (29 Jan - 4 Feb) 7.00 27.50 10.18 35.56 10.33 36.56 10.23 36.14 IW/CPE= 0.75 (I2) 1. (27 Nov -3 Dec) 7.85 24.71 11.33 33.38 11.90 33.99 11.47 33.94
  • 4. Effect of irrigation regimes and low tunnel height… www.ijesi.org 23 | Page 2. (04 - 10 Dec) 9.71 23.14 12.85 31.61 13.42 32.56 13.19 32.04 3. (11 -17 Dec) 7.85 22.42 11.28 32.37 11.76 33.04 11.61 32.90 4. (18- 24 Dec) 9.28 20.85 12.61 29.33 12.90 29.80 12.80 29.61 5. (25- 31 Dec) 7.42 17.42 11.23 25.94 11.66 26.61 11.42 26.18 6. (01 -7 Jan) 6.16 18.00 9.71 27.28 9.95 27.99 9.85 27.47 7. (08 - 14 Jan) 5.50 23.42 9.61 30.80 9.75 31.66 9.71 31.61 8. (15 -21Jan) 8.28 22.57 11.71 31.56 11.95 31.95 11.80 31.80 9. (22 -28 Jan) 8.66 23.50 12.09 31.71 12.52 31.99 12.23 31.85 10. (29 Jan - 4 Feb) 7.00 27.50 10.37 36.66 10.61 36.80 10.47 36.95 IW/CPE= 0.90 (I3) 1. (27 Nov -3 Dec) 7.85 24.71 11.04 32.90 11.76 33.75 11.33 33.61 2. (04 - 10 Dec) 9.71 23.14 12.76 30.99 13.23 32.23 13.04 31.04 3. (11 -17 Dec) 7.85 22.42 11.18 31.8 11.61 32.76 11.33 32.75 4. (18- 24 Dec) 9.28 20.85 12.47 28.75 12.71 29.42 12.66 28.94 5. (25- 31 Dec) 7.42 17.42 11.14 25.33 11.52 26.37 11.28 25.90 6. (01 -7 Jan) 6.16 18.00 9.56 26.99 9.71 27.47 9.61 27.23 7. (08 - 14 Jan) 5.50 23.42 9.18 30.23 9.56 31.61 9.47 31.18 8. (15 -21Jan) 8.28 22.57 11.52 31.18 11.85 31.66 11.66 31.33 9. (22 -28 Jan) 8.66 23.50 12.04 31.66 12.33 31.71 12.13 31.61 10. (29 Jan - 4 Feb) 7.00 27.50 10.23 36.42 10.47 36.75 10.37 36.52 Paired Row Planting (I4) 1. (27 Nov -3 Dec) 7.85 24.71 11.04 32.90 11.76 33.75 11.33 33.61 2. (04 - 10 Dec) 9.71 23.14 12.76 30.99 13.23 32.23 13.04 31.04 3. (11 -17 Dec) 7.85 22.42 11.18 31.8 11.61 32.76 11.33 32.75 4. (18- 24 Dec) 9.28 20.85 12.47 28.75 12.71 29.42 12.66 28.94 5. (25- 31 Dec) 7.42 17.42 11.14 25.33 11.52 26.37 11.28 25.90 6. (01 -7 Jan) 6.16 18.00 9.56 26.99 9.71 27.47 9.61 27.23 7. (08 - 14 Jan) 5.50 23.42 9.18 30.23 9.56 31.61 9.47 31.18 8. (15 -21Jan) 8.28 22.57 11.52 31.18 11.85 31.66 11.66 31.33 9. (22 -28 Jan) 8.66 23.50 12.04 31.66 12.33 31.71 12.13 31.61 10. (29 Jan - 4 Feb) 7.00 27.50 10.23 36.42 10.47 36.75 10.37 36.52 Single Row Planting (I5) 1. (27 Nov -3 Dec) 7.85 24.71 10.47 31.23 10.95 32.18 10.61 31.33 2. (04 - 10 Dec) 9.71 23.14 12.42 29.28 12.66 30.09 12.57 29.85 3. (11 -17 Dec) 7.85 22.42 10.85 30.18 11.09 31.90 10.94 31.33 4. (18- 24 Dec) 9.28 20.85 11.90 27.32 12.33 27.66 12.14 27.56 5. (25- 31 Dec) 7.42 17.42 10.42 23.80 10.99 24.42 10.71 24.18 6. (01 -7 Jan) 6.16 18.00 8.85 24.42 9.33 25.04 9.04 24.90 7. (08 - 14 Jan) 5.50 23.42 8.75 27.90 9.37 29.04 8.90 29.23 8. (15 -21Jan) 8.28 22.57 11.23 30.28 11.47 30.94 11.33 30.47 9. (22 -28 Jan) 8.66 23.50 11.56 28.99 11.76 30.42 11.66 29.94 10. (29 Jan - 4 Feb) 7.00 27.50 10.04 33.57 10.18 35.70 10.09 34.61 3.2 Soil temperature The measurement of recorded soil temperature also depends on the tunnel height and the type of irrigation applied as presented in Table 2. At 7:30 am the soil temperature in low tunnel which varied from 8.71o C to 16.61o C was higher by 1.29o C to 4.76o C in comparison with open field whose soil temperature varied from 7.42o C to 11.85o C during the low tunnel coverage period. Among the tunnel height treatments, in H2 treatment the soil temperature was highest which varied from 9.23o C to 16.61o C and was higher by 0.52o C to 1o C in comparison with H1 treatment whose soil temperature was lowest which varied from 8.71o C to 15.61o C. Among the irrigation treatments, in I2 treatment the soil temperature was highest which varied from 10.57o C to 16.61o C and was higher by 0.95o C to 1.86o C in comparison with I5 treatment whose soil temperature was lowest which varied from 8.71o C to 15.66o C. For the treatment combination in I2H2 treatment the soil temperature was highest which varied from 11.13o C to 16.61o C and was higher by 2.42o C to 2.62o C
  • 5. Effect of irrigation regimes and low tunnel height… www.ijesi.org 24 | Page in comparison with I5H1 treatment whose soil temperature was lowest which varied from 8.71 o C to 13.99o C.At 2:30 pm the soil temperature in low tunnel which varied from 20.52o C to 27.95o C was higher by 3.52o C to 6.38o C in comparison with open field whose temperature varied from 17o C to 21.57o C during the low tunnel coverage period. Among the tunnel height treatments, in H2 treatment the soil temperature was highest which varied from 21.76o C to 27.95o C and was higher by 0.48o C to 1.24o C in comparison with H1 treatment whose temperature was lowest which varied from 20.52o C to 27.47o C. Among the irrigation treatments, in I2 treatment the soil temperature was highest which varied from 23o C to 27.95o C and was higher by 1.43o C to 2.48o C in comparison with I5 treatment whose soil temperature was lowest which varied from 20.52o C to 26.52o C. For the treatment combination in I2H2 treatment the soil temperature was highest which varied from 23.76o C to 27.95o C and was higher by 1.43o C to 2o C in comparison with I5H1 treatment whose temperature was lowest which varied from 21.76o C to 26.52o C. Differences in soil temperature between low tunnels treatments may be due to many factors including: initial air and soil temperature; soil moisture, air volume in tunnel, convective and conductive heat exchange characteristics of the material, surface area of the tunnel to volume ratio and transmissibility to long wave radiation. The above mentioned results were in close proximity with those of Hemphill (1986) who reported that row covers increased daily mean soil temperature by 1 to 4°C over bare ground. The results are also in line with those of Gaye and Maurer (1991) who reported that row cover elevated mean soil temperature 1 to 6°C and promoted plant growth compared with bare soil. Table 2 Variation of soil temperature in different heights of low tunnel with various irrigation treatments Week after covering of crop Mean Soil Temp. (o C) (Open Field) Mean Soil Temperature (o C) Low Tunnel Heights 45cm 60cm 75cm 7:30 am 2:30 pm 7:30 am 2:30 pm 7:30 am 2:30 pm 7:30 am 2:30 pm IW/ CPE= 0.60 (I1) 1. (27 Nov -3 Dec) 11.00 19.14 13.28 23.14 13.75 24.19 13.61 23.85 2. (04 - 10 Dec) 11.85 20.57 13.95 25.23 14.66 26.14 14.28 25.71 3. (11 -17 Dec) 9.71 17.42 12.37 22.47 12.90 22.95 12.66 22.66 4. (18- 24 Dec) 11.14 20.85 13.47 25.38 14.09 26.85 13.76 25.9 5. (25- 31 Dec) 11.28 18.14 13.71 22.52 14.04 23.38 13.99 23.00 6. (01 -7 Jan) 10.66 19.14 13.28 23.95 13.94 25.04 13.61 24.47 7. (08 - 14 Jan) 7.42 17.00 10.18 22.33 10.80 23.19 10.42 22.61 8. (15 -21Jan) 10.42 19.57 15.04 23.61 16.00 24.47 15.56 24.14 9. (22 -28 Jan) 9.71 19.71 12.38 23.19 12.75 24.04 12.61 23.57 10. (29 Jan - 4 Feb) 10.50 21.57 13.85 26.28 14.04 27.28 13.99 26.61 IW/CPE= 0.75 (I2) 1. (27 Nov -3 Dec) 11.00 19.14 13.80 24.23 14.28 25.18 14.14 24.62 2. (04 - 10 Dec) 11.85 20.57 14.37 26.38 15.09 26.85 14.71 26.52 3. (11 -17 Dec) 9.71 17.42 12.95 23.00 13.37 23.76 13.18 23.28 4. (18- 24 Dec) 11.14 20.85 13.94 26.85 14.71 27.52 14.47 27.09 5. (25- 31 Dec) 11.28 18.14 14.23 23.42 15.09 24.33 14.47 23.71 6. (01 -7 Jan) 10.66 19.14 13.99 25.04 14.37 25.66 14.13 25.23 7. (08 - 14 Jan) 7.42 17.00 10.57 23.00 11.13 23.76 10.76 23.23 8. (15 -21Jan) 10.42 19.57 15.61 24.71 16.61 26.09 15.85 25.61 9. (22 -28 Jan) 9.71 19.71 12.90 24.19 13.23 25.33 13.00 24.95 10. (29 Jan - 4 Feb) 10.50 21.57 14.04 27.47 14.61 27.95 14.37 27.66 IW/CPE= 0.90 (I3) 1. (27 Nov -3 Dec) 11.00 19.14 13.42 24.09 13.95 24.85 13.71 24.57 2. (04 - 10 Dec) 11.85 20.57 14.23 26.00 14.80 26.62 14.56 26.43 3. (11 -17 Dec) 9.71 17.42 12.75 22.71 13.18 23.38 12.99 23.14 4. (18- 24 Dec) 11.14 20.85 13.85 26.14 14.42 27.04 14.18 26.9
  • 6. Effect of irrigation regimes and low tunnel height… www.ijesi.org 25 | Page 5. (25- 31 Dec) 11.28 18.14 13.99 23.14 14.61 23.95 14.33 23.57 6. (01 -7 Jan) 10.66 19.14 13.75 24.76 14.14 25.33 13.95 24.99 7. (08 - 14 Jan) 7.42 17.00 10.33 22.66 10.94 23.52 10.52 22.95 8. (15 -21Jan) 10.42 19.57 15.37 24.33 16.13 24.80 15.71 24.76 9. (22 -28 Jan) 9.71 19.71 12.61 23.99 13.04 24.95 12.90 24.52 10. (29 Jan - 4 Feb) 10.50 21.57 13.94 26.99 14.37 27.52 14.14 27.14 Paired Row Planting (I4) 1. (27 Nov -3 Dec) 11.00 19.14 13.09 22.57 13.61 23.81 13.47 23.28 2. (04 - 10 Dec) 11.85 20.57 13.80 24.42 14.47 25.71 14.14 25.09 3. (11 -17 Dec) 9.71 17.42 12.09 21.19 12.70 22.76 12.37 22.33 4. (18- 24 Dec) 11.14 20.85 13.28 24.95 13.85 25.95 13.71 25.57 5. (25- 31 Dec) 11.28 18.14 13.51 21.71 13.85 23.09 13.71 22.19 6. (01 -7 Jan) 10.66 19.14 13.04 23.05 13.71 24.61 13.37 24.19 7. (08 - 14 Jan) 7.42 17.00 9.94 21.38 10.33 22.23 10.04 21.90 8. (15 -21Jan) 10.42 19.57 14.95 23.43 15.75 24.00 15.37 23.76 9. (22 -28 Jan) 9.71 19.71 12.23 22.76 12.52 23.62 12.37 23.04 10. (29 Jan - 4 Feb) 10.50 21.57 13.66 25.90 13.85 26.81 13.76 26.52 Single Row Planting (I5) 1. (27 Nov -3 Dec) 11.00 19.14 12.95 22.09 13.33 23.47 13.18 22.62 2. (04 - 10 Dec) 11.85 20.57 13.28 24.75 14.13 25.38 13.80 24.19 3. (11 -17 Dec) 9.71 17.42 11.89 20.52 12.33 21.76 12.09 21.57 4. (18- 24 Dec) 11.14 20.85 13.04 23.76 13.56 25.61 13.33 24.90 5. (25- 31 Dec) 11.28 18.14 13.37 21.33 13.71 22.42 13.47 21.90 6. (01 -7 Jan) 10.66 19.14 12.90 22.28 13.42 24.38 13.04 23.42 7. (08 - 14 Jan) 7.42 17.00 8.71 21.09 9.23 22.14 8.95 21.42 8. (15 -21Jan) 10.42 19.57 13.99 22.81 15.66 23.62 14.56 23.19 9. (22 -28 Jan) 9.71 19.71 11.61 22.24 12.23 22.80 11.99 22.47 10. (29 Jan - 4 Feb) 10.50 21.57 13.04 25.42 13.56 26.52 13.23 26.14 3.3 Relative humidity The measurement of recorded relative humidity also depends on the tunnel height and the type of irrigation applied as presented in Table 3. At 7:30 am the relative humidity in low tunnel which varied from 87.59% to 94.13% was lower by 4.58% to 6.55% in comparison with open field whose relative humidity varied from 94.14% to 98.71% during the low tunnel coverage period. Among the tunnel height treatments, in H3 treatment the relative humidity was highest which varied from 88.4% to 94.00% and was higher by 0.01% to 0.81% in comparison with H1 treatment whose relative humidity was lowest which varied from 87.59% to 93.99%. Among the irrigation treatments, in I3 treatment the relative humidity was highest which varied from 89.3% to 94.13% and was higher by 1.23% to 1.71% in comparison with I5 treatment whose relative humidity was lowest which varied from 87.59% to 92.9%. For the treatment combination in I3H3 treatment the relative humidity was highest which varied from 89.8% to 93.8% and was higher by 1.19% to 2.23% in comparison with I5H1 treatment whose relative humidity was lowest which varied from 87.57% to 92.61%. The decrease in the relative humidity from the open field may be due to dew effect on the polysheet in the morning. At 2:30 pm the relative humidity in low tunnel which varied from 59.71% to 91.66% was higher by 11.52% to 17.57% in comparison with open field whose relative humidity varied from 42.14% to 80.14% during the low tunnel coverage period. Among the tunnel height treatments, in H2 treatment the relative humidity was highest which varied from 61.75% to 91.66% and was higher by 1.86% to 2.04% in comparison with H1 treatment whose relative humidity was lowest which varied from 59.71% to 89.8%. Among the irrigation treatments, in I2 treatment the relative humidity was highest which varied from 63.71% to 91.66% and was higher by 2% to 4% in comparison with I5 treatment whose relative humidity was lowest which varied from 59.71% to 89.66%. For the treatment combination in I2H2 treatment the relative humidity was highest which varied from 67.04% to 91.66% and was higher by 3.57% to 7.28% in comparison with I4H3 treatment whose relative humidity was lowest which varied from 59.76% to 88.09%. Differences in relative humidity between low tunnels treatments may be due to many factors in cluding: initial air
  • 7. Effect of irrigation regimes and low tunnel height… www.ijesi.org 26 | Page and soil temperature; soil moisture, air volume in tunnel, convective and conductive heat exchange characteristics of the material, surface area of the tunnel to volume ratio and transmissibility to long wave radiation. The data also reveals that the low tunnel effect decreases the relative humidity in the morning but in the daytime it increases the relative humidity to provide favourable condition for plant growth. The above mentioned results were in close proximity with those of Chaugule et al (1990). Table 3 Variation of relative humidity in different heights of low tunnel with various irrigation treatments Week after covering of crop Mean Relative Humidity (%) (Open Field) Mean Relative Humidity (%) Low Tunnel Heights 45cm 60cm 75cm 7:30 am 2:30 pm 7:30 am 2:30 pm 7:30 am 2:30 pm 7:30 am 2:30 pm IW/ CPE= 0.60 (I1) 1. (27 Nov -3 Dec) 98.71 42.14 93.76 63.75 93.52 65.33 94.00 64.8 2. (04 - 10 Dec) 98.14 48.85 91.8 66.33 91.9 67.04 92.09 66.99 3. (11 -17 Dec) 97.71 51.42 90.47 67.47 90.61 69.37 90.87 68.09 4. (18- 24 Dec) 94.14 65.42 88.78 77.99 88.87 80.47 89.21 78.76 5. (25- 31 Dec) 98.14 80.14 91.9 88.04 92.47 90.8 93.18 89.09 6. (01 -7 Jan) 96.85 62 89.95 75.85 90.42 76.8 90.8 76.37 7. (08 - 14 Jan) 97.42 58.85 92.13 74.09 92.61 75.56 92.76 74.85 8. (15 -21Jan) 96.57 68.71 90.33 82.18 90.66 83.09 91.13 82.66 9. (22 -28 Jan) 94.14 66 88.71 78.94 88.85 79.56 89.23 79.18 10. (29 Jan - 4 Feb) 97.57 57.28 89.66 71.71 90.28 74.23 90.9 73.9 IW/CPE= 0.75 (I2) 1. (27 Nov -3 Dec) 98.71 42.14 93.42 63.71 93.9 67.04 93.61 65.56 2. (04 - 10 Dec) 98.14 48.85 91.85 66.28 91.9 68.28 92.47 67.52 3. (11 -17 Dec) 97.71 51.42 90.4 68.23 90.83 69.9 91.54 68.85 4. (18- 24 Dec) 94.14 65.42 88.26 79.18 89.16 82.04 89.73 79.8 5. (25- 31 Dec) 98.14 80.14 92.37 89.8 92.47 91.66 92.56 90.57 6. (01 -7 Jan) 96.85 62 90.28 75.99 90.61 78.28 90.99 77.71 7. (08 - 14 Jan) 97.42 58.85 92.56 74.75 92.8 77.28 93.04 76.18 8. (15 -21Jan) 96.57 68.71 90.66 82.18 91.18 83.47 91.33 81.85 9. (22 -28 Jan) 94.14 66 89.18 81.09 89.23 83.04 89.57 81.61 10. (29 Jan - 4 Feb) 97.57 57.28 90.18 73.8 90.37 75.18 91.37 74.04 IW/CPE= 0.90 (I3) 1. (27 Nov -3 Dec) 98.71 42.14 93.99 63.61 94.13 66.23 93.8 64.09 2. (04 - 10 Dec) 98.14 48.85 92.09 66.04 92.13 67.8 92.66 66.09 3. (11 -17 Dec) 97.71 51.42 91.21 66.47 91.73 69.61 91.83 68.42 4. (18- 24 Dec) 94.14 65.42 89.3 78.75 89.73 80.47 90.11 79.94 5. (25- 31 Dec) 98.14 80.14 92.85 88.94 93.33 90.75 93.47 89.39 6. (01 -7 Jan) 96.85 62 90.94 75.94 91.42 76.85 91.99 76.71 7. (08 - 14 Jan) 97.42 58.85 92.61 73.99 92.99 75.85 93.71 74.37 8. (15 -21Jan) 96.57 68.71 91.14 80.23 91.33 83.04 91.9 82.28 9. (22 -28 Jan) 94.14 66 89.37 80.51 89.61 81.13 89.8 81.09 10. (29 Jan - 4 Feb) 97.57 57.28 91.66 72.23 92.8 74.66 93.13 73.8 Paired Row Planting (I4) 1. (27 Nov -3 Dec) 98.71 42.14 92.85 61.23 93.23 62.99 93.33 59.76 2. (04 - 10 Dec) 98.14 48.85 91.04 65.18 91.23 65.42 91.52 63.42 3. (11 -17 Dec) 97.71 51.42 90.59 66.14 90.78 67.18 91.44 64.33 4. (18- 24 Dec) 94.14 65.42 88.54 77.23 88.73 78.33 89.16 76.66 5. (25- 31 Dec) 98.14 80.14 91.94 88.37 91.99 88.8 92.13 88.09
  • 8. Effect of irrigation regimes and low tunnel height… www.ijesi.org 27 | Page 6. (01 -7 Jan) 96.85 62 89.47 74.09 90.18 75.42 90.23 74.13 7. (08 - 14 Jan) 97.42 58.85 91.71 73.61 91.94 72.32 92.32 71.18 8. (15 -21Jan) 96.57 68.71 90.04 82.09 90.56 81.18 90.9 80.37 9. (22 -28 Jan) 94.14 66 88.37 75.71 88.42 76.71 88.47 75.56 10. (29 Jan - 4 Feb) 97.57 57.28 89.8 72.14 90.09 71.71 90.8 69.75 Single Row Planting (I5) 1. (27 Nov -3 Dec) 98.71 42.14 92.61 59.71 92.85 61.75 92.9 60.04 2. (04 - 10 Dec) 98.14 48.85 91.04 63.13 91.18 64.42 91.37 63.28 3. (11 -17 Dec) 97.71 51.42 89.49 64.13 90.3 65.14 90.78 64.61 4. (18- 24 Dec) 94.14 65.42 87.59 75.85 88.11 77.57 88.4 76.85 5. (25- 31 Dec) 98.14 80.14 91.13 88.9 91.51 89.66 91.7 89.18 6. (01 -7 Jan) 96.85 62 89.37 73.04 89.61 74.09 88.99 73.42 7. (08 - 14 Jan) 97.42 58.85 91.33 72.56 91.56 72.28 91.66 71.47 8. (15 -21Jan) 96.57 68.71 89.71 81.8 89.76 81.75 89.9 81.56 9. (22 -28 Jan) 94.14 66 88.42 76.28 88.47 77.37 87.9 76.75 10. (29 Jan - 4 Feb) 97.57 57.28 88.76 71.56 89.71 70.95 89.76 69.85 3.4 Solar radiation The measurement of solar radiation depends on the tunnel height and the type of irrigation applied as presented in Table 4. At 2:30 pm the solar radiation in low tunnel which varied from 19614 lux to 43242.66 lux was lower by 16.65% to 37.45% in comparison with open field whose solar radiation varied from 31360 lux to 51885.71 lux during the low tunnel coverage period. Among the tunnel height treatments, in H3 treatment the solar radiation was highest which varied from 19861.66 lux to 43242.66 lux and was higher by 1.26% to 9.01% in comparison with H1 treatment whose solar radiation was lowest which varied from 19614 lux to 39666.33 lux. Among the irrigation treatments, in I5 treatment the solar radiation was highest which varied from 19718.66 lux to 43242.66 lux and was higher by 0.53% to 6.97% in comparison with I1 treatment whose solar radiation was lowest which varied from 19614 lux to 40423.33 lux. For the treatment combination in I5H3 treatment the solar radiation was highest which varied from 19994.66 lux to 43242.66 lux and was higher by 1.94% to 10.97% in comparison with I1H1 treatment whose solar radiation was lowest which varied from 19614 lux to 38966.33 lux. Differences in solar radiation between low tunnels treatments may be due to different surface area of the tunnel and soil moisture distribution. The above mentioned results were in close proximity with those of Siwek et al (1994) who reported that on average 70.3% of radiation reached to the plants inside the tunnel. Table 4 Variation of solar radiation in different heights of low tunnel under various irrigation treatments Week after covering of crop Mean Solar Radiation (Lux) (Open Field) Mean Solar Radiation (Lux) Low Tunnel Heights 45cm 60cm 75cm IW/ CPE= 0.60 (I1) 1. (27 Nov -3 Dec) 40328.57 26361.66 27647.00 28399.66 2. (04 - 10 Dec) 50471.42 38304.33 40166.33 40423.33 3. (11 -17 Dec) 45514.28 30399.66 31409.00 33032.66 4. (18- 24 Dec) 48614.28 35270.66 37866.33 38147.00 5. (25- 31 Dec) 31360.00 19614.00 19747.33 19866.00 6. (01 -7 Jan) 33342.85 23380.33 23557.00 23904.33 7. (08 - 14 Jan) 44128.57 29647.00 29871.00 30285.00 8. (15 -21Jan) 51885.71 38966.33 39728.33 39842.33 9. (22 -28 Jan) 46342.85 33914.00 34499.66 34694.66 10. (29 Jan - 4 Feb) 51442.85 36556.66 37004.33 37104.66 IW/CPE= 0.75 (I2) 1. (27 Nov -3 Dec) 40328.57 27218.66 27518.66 28385.33 2. (04 - 10 Dec) 50471.42 39176.00 40361.66 41737.66 3. (11 -17 Dec) 45514.28 31118.66 31823.33 32261.33
  • 9. Effect of irrigation regimes and low tunnel height… www.ijesi.org 28 | Page 4. (18- 24 Dec) 48614.28 36399.66 37899.66 39690.00 5. (25- 31 Dec) 31360.00 19695.00 19733.00 19914.00 6. (01 -7 Jan) 33342.85 23328.33 23666.33 23899.66 7. (08 - 14 Jan) 44128.57 29380.66 29875.66 30161.66 8. (15 -21Jan) 51885.71 38909.00 39666.00 39885.33 9. (22 -28 Jan) 46342.85 34480.33 34628.33 34842.66 10. (29 Jan - 4 Feb) 51442.85 36894.66 37066.33 37290.33 IW/CPE= 0.90 (I3) 1. (27 Nov -3 Dec) 40328.57 27037.66 27499.33 27818.66 2. (04 - 10 Dec) 50471.42 39533.00 40076.00 41885.00 3. (11 -17 Dec) 45514.28 30652.00 31542.66 32299.66 4. (18- 24 Dec) 48614.28 37647.33 37704.33 37847.33 5. (25- 31 Dec) 31360.00 19485.33 19752.00 19899.66 6. (01 -7 Jan) 33342.85 23213.66 23490.00 23756.66 7. (08 - 14 Jan) 44128.57 29294.66 29842.33 30242.33 8. (15 -21Jan) 51885.71 39299.66 39475.66 39875.66 9. (22 -28 Jan) 46342.85 33833.00 34633.00 34880.66 10. (29 Jan - 4 Feb) 51442.85 36918.66 37014.00 37175.66 Paired Row Planting (I4) 1. (27 Nov -3 Dec) 40328.57 26814.00 27347.00 27609.00 2. (04 - 10 Dec) 50471.42 39666.33 40433.00 41304.33 3. (11 -17 Dec) 45514.28 30318.66 31856.66 32807.66 4. (18- 24 Dec) 48614.28 35409.33 37928.00 38047.00 5. (25- 31 Dec) 31360.00 19633.00 19761.33 19861.66 6. (01 -7 Jan) 33342.85 23109.00 23433.00 23785.33 7. (08 - 14 Jan) 44128.57 29704.33 29928.33 30190.00 8. (15 -21Jan) 51885.71 39375.66 39599.66 39795.00 9. (22 -28 Jan) 46342.85 33380.33 34490.00 34652.00 10. (29 Jan - 4 Feb) 51442.85 36809.00 37128.33 37290.33 Single Row Planting (I5) 1. (27 Nov -3 Dec) 40328.57 28123.33 28795.00 29999.66 2. (04 - 10 Dec) 50471.42 39661.66 40609.00 43242.66 3. (11 -17 Dec) 45514.28 32566.00 33209.00 33752.00 4. (18- 24 Dec) 48614.28 38356.66 38766.33 39485.33 5. (25- 31 Dec) 31360.00 19718.66 19832.66 19994.66 6. (01 -7 Jan) 33342.85 23499.33 23604.33 23956.66 7. (08 - 14 Jan) 44128.57 29723.33 29990.00 30528.33 8. (15 -21Jan) 51885.71 39370.66 39933.00 39932.66 9. (22 -28 Jan) 46342.85 34447.00 34618.66 34780.66 10. (29 Jan - 4 Feb) 51442.85 36999.66 37185.33 37352.00 IV. CONCLUSIONS The mean air temperature was higher in low tunnel than open field by 3.25o C to 3.71o C and 6.38o C to 9.30o C at 7:30 am and 2:30 pm respectively. The mean soil temperature was higher in low tunnel than open field by 1.29o C to 4.76o C and 3.52o C to 6.30o C at 7:30 am and 2:30 pm respectively. The highest air and soil temperature was observed in H2 and I2 treatments in the tunnel height and irrigation treatments respectively. For the combinations I2H2 treatment gave higher air and soil temperature than other treatments combinations. The highest relative humidity observed at 7:30 am and lowest at 2:30 pm. At 7:30 am, in the low tunnels mean relative humidity lowered by 4.58% to 6.55% than open field but at 2:30 it was higher by 11.52% to 17.57%. The highest relative humidity was observed in H3 and I2 treatments among the tunnel height and irrigation treatments respectively. For the combinations I3H3 gave higher mean relative humidity at 7:30 am but at 2:30 pm combination I2H2 treatment gave higher relative humidity than other treatment combinations. The mean solar radiation under low tunnels lowered by 16.65% to 37.45% as compared to
  • 10. Effect of irrigation regimes and low tunnel height… www.ijesi.org 29 | Page open field at 2:30 pm. The highest solar radiation was observed in H3 and I5 treatments in the tunnel height and irrigation treatments respectively. For the combinations, in I5H3 treatment higher mean solar radiation was observed than other treatments combinations. REFERENCES [1]. Anonymous (2008) Package of Practices for Vegetable Crops. Pp 20-25. PunjabAgricultural University, Ludhiana. Chaugule A A, Gutal G B and Kulkarni P V (1990) The feasibility of plastic polyhouse for capsicum crop. Proc Iinternational Agricultural Engineering Conference and Eexhibition. pp 1485-89, Bangkok, Thailand. [2]. Gaye M M and Maurer A R (1991) Modified transplant production techniques to increase yield and improve earliness of Brussels sprouts. J Amer Soc Hort Sci 116: 210-14. [3]. Hemphill D D (1986) Response of muskmelon to three floating row covers. J Amer Soc Hort Sci 111: 513-17. [4]. Wolfe D W, Albright L D and Wyland J (1989) Modeling row cover effects on microclimate and yiield : I. Growth response of tomato and cucumber. J Amer Soc Hort Sci 114: 562-68. [5]. Lamarrel M, Larean M J, Payette S and Fortin C (1996) Influence of nitrogen fertilization, row covers and cultivars on the production of day neutral strawberry. Canadian J Soil Sci 76: 29-36. [6]. Libik A and Siwek P (1994) Changes in soil temperature affected by the application of plastic covers in field production of lettuce and water melon. Acta Hort 371: 269-73.