Plant propagation: Sexual and Asexual propapagation.pptx
2010 legume bloat poster
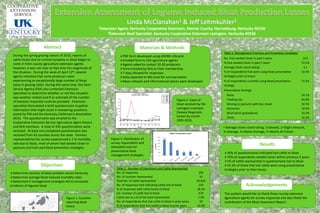
1. Abstract Materials & Methods
Table 2. Management Practices and Prevention Strategies
During the spring grazing season of 2010, reports of PDF form developed using ADOBE Lifecycle
cattle losses due to ruminal tympany or bloat began to No. that seeded clover in past 5 years 213
Emailed form to CES agriculture agents
come in from county agriculture extension agents. % that seeded clover in past 5 years 72.2%
Agents asked to contact 10-20 producers
However, it was not clear at that time the magnitude of Form emailed by KCA to their membership Average clover stand ratinga 4.1
the situation. During the week of April 12th, several 7 days allowed for responses % of respondents that were using bloat preventative 52.5%
agents indicated that some producers were Data exported to MS Excel for summarization strategies prior to losses
experiencing an exceptionally large number of bloat News releases and informational pieces were developed % of respondents currently using bloat preventative 72.2%
cases in grazing cattle. During this same time, the Farm strategy
Service Agency (FSA) also contacted Extension Preventative Strategy
specialists to determine whether or not this situation
None 24.1%
was weather related and if an estimate of the number
Figure 2. Cases of Feeding hay 40.0%
of livestock impacted could be provided. Extension
specialists formulated a brief questionnaire to gather bloat received by the Moving to pastures with less clover 32.5%
Lexington Livestock Rumensin 32.9%
information that might assist in answering questions
Disease Diagnostic Bloat block (poloxalene) 33.2%
posed by FSA and the Kentucky Cattlemen’s Association
Center by month Other 16.3%
(KCA). The questionnaire was emailed to the
2005-2010.
Cooperative Extension Service Agriculture Agent listserv
and KCA members. A total of 295 questionnaires were aAverage clover stand rating: 1=Devoid, 2=Slight Amount,
received. At least one completed questionnaire was 3=Average, 4=Above Average, 5=Nearly All Clover.
received from 42 counties across the state. Farmers
represented by the survey experienced a 1 % mortality Figure 3. Distribution of
rate due to bloat, most of whom had seeded clover in survey respondents and
estimated costs for
Results
pastures and had used bloat prevention strategies.
preventative bloat
36% of questionnaires indicated lost cattle to bloat
management strategies
72% of respondents seeded clover within previous 5 years
1% of cattle represented in questionnaire lost to bloat
Objectives 52.5% of those that lost cattle were using preventative
Table 1. Number of Operations and Cattle Represented strategies prior to their losses
Determine severity of bloat problem across Kentucky No. of responses 295
Determine average bloat induced mortality rates No. of counties represented 42
Determine if management strategies led to increased Total No. of cattle represented 65,822
incidence of legume bloat No. of responses that indicating cattle lost to bloat 107 Acknowledgements
% of responses with cattle losses to bloat 36.3%
Est. number of cattle lost to bloat 670 The authors would like to thank those county extension
Figure 1. Counties Cattle lost as a % of the total represented 1.0% agriculture agents for survey responses and also thank the
reporting bloat No. of respondents that lost cattle to bloat in prior years 50 contributors of the Bloat Assesment Report.
losses. % of respondents that lost cattle to bloat in prior years 16.9%