Downloaded 31 times


![57
APPENDIX 2: BIBLIOGRAPHY
Basak, G. K. 2007. “Changing Dynamics of the Secondary Steel Sector.” Mimeo. Kolkata: Joint Plant
Committee.
Basel Convention. 2003. “Technical Guidelines for the Environmentally Sound Management of the Full and
Partial Dismantling of Ships.” Basel Convention Series/SBC No 2003/2. Geneva.
Bastiansen, E. 2006. “Recycling of Ships 2006–2021.” BIMCO Bulletin 101 (6): 110–15.
Beriwala, Shyam Sunder. 2002. “The Status of Re-rolling industry–Its Problems and Future Prospects.”
Mimeo. Kolkata: Joint Plant Committee.
Buerk, Roland. 2006. Breaking Ships: How Supertankers and Cargo Ships Are Dismantled on the Beaches of
Bangladesh. New York: Chamberlain Bros.
Buncombe, Andrew. 2009. “Alang: The Place Where Ships Go to Die.” The Independent (UK). 31 August.
China–Netherlands Environmental Protection Cooperation Project. 2005. Report on Environmental Sound
Management of Waste Ship Dismantling.
Clarkson. 2006. “Breaking News.” Feature by Martin Macleod.
Clarkson, Perter. 2009. “Huge Investment in Pakistan Shipbreaking.” GlobMaritime Social Network, 15
June.
Commission of the European Communities. 2007. Better Ship Dismantling. Green Paper. Brussels.
CONCAWE. 1998. Heavy Fuel Oils. Petroleum Products and Health Management Groups, Brussels.
Cotzias. 2009. “Cotzias Market Economic Outlook.” Maritime Econometrics, October. Pireaus-Hellas,
Greece: N. Cotzias Shipping Co. Ltd.
COWI/Litehauz. 2008. Certification of Ship Recycling Facilities, prepared for European Maritime Safety
Agency. Copenhagen.
Danish EPA (Environmental Protection Agency). 2003. Ship Breaking in OECD. Working Report No. 17,
Copenhagen.
———. 2007a. Pocket Book Manual. Draft 2006 submitted to Basel Convention Secretariat. Copenhagen.
———. 2007b. “Project Identification Note – Options for Demonstration Projects on Green Ship
Recycling,” February–September. By DHI/COWI. Copenhagen.
Das, P. K. et al. 2006. Proceedings of the First International Conference on Dismantling of Obsolete Vessels,
11–12 September 2006, Glasgow, U.K.
Dear, I. C. B., and P. Kemp. 2006. Oxford Companion to Ships and the Sea. Oxford: Oxford University
Press.
DEFRA (Department for Environment, Food and Rural Affairs). 2002. [[Ref missing; from chap 2]] London.
———. 2006. Partial Regulatory Impact Assessment: UK Ship Recycling Strategy. London.
———. 2007. Overview of the Ship Recycling Process in the UK. London.
Department of Environment, Ministry of Environment and Forests, Government of the People’s Republic of
Bangladesh in collaboration with IUCN Bangladesh Country Office and Bangladesh Centre for Advance
Studies, 2006. National Programme of Action for Protection of the Coastal and Marine Environment from
Land-Based Activities.
DNV (Det Norske Veritas). 2000. Decommissioning of Ships – Environmental Standards; Ship-Breaking
Practices/ On-Site Assessment; Bangladesh – Chittagong. Report 2000-3158. Oslo.
DNV/Appeldore. 2001. Technological and Economic Feasibility Study of Ship Scrapping in Europe.
Brussels: Commission of the European Communities.
Esso. 2003. Product Data Sheet, ESSO Hydraulic Oil AW, Anti-wear Hydraulic. Calgary: Esso Imperial Oil.
European Commission. 2004. Oil Tanker Phase Out and the Ship Scrapping Industry. Brussels.
———. 2007. Ship Dismantling and Pre-cleaning of Ships. Study by COWI/DHI. Brussels.
———. Forthcoming. Dismantling of Vessels with Enhanced Safety and Technology. Research foreseen
under the 7th European Research Framework Programme. Brussels: European Union.
———. Undated. Cost-effective and Environmentally Sound Dismantling of Obsolete Vessels. Project
funded under 6th Research Framework Programme.
———. Undated. Ship repair to Maintain Transport Which is Environmentally Sustainable. Project funded
under 6th Research Framework Programme.
Feringa, G. 2005. “Ship Recycling in Bangladesh – Findings of Baseline Survey.” Draft Report to the ILO.
Geneva.](https://image.slidesharecdn.com/shipbreaking-myanmar-2014-140611041422-phpapp02/75/Shipbreaking-myanmar-2014-83-2048.jpg)


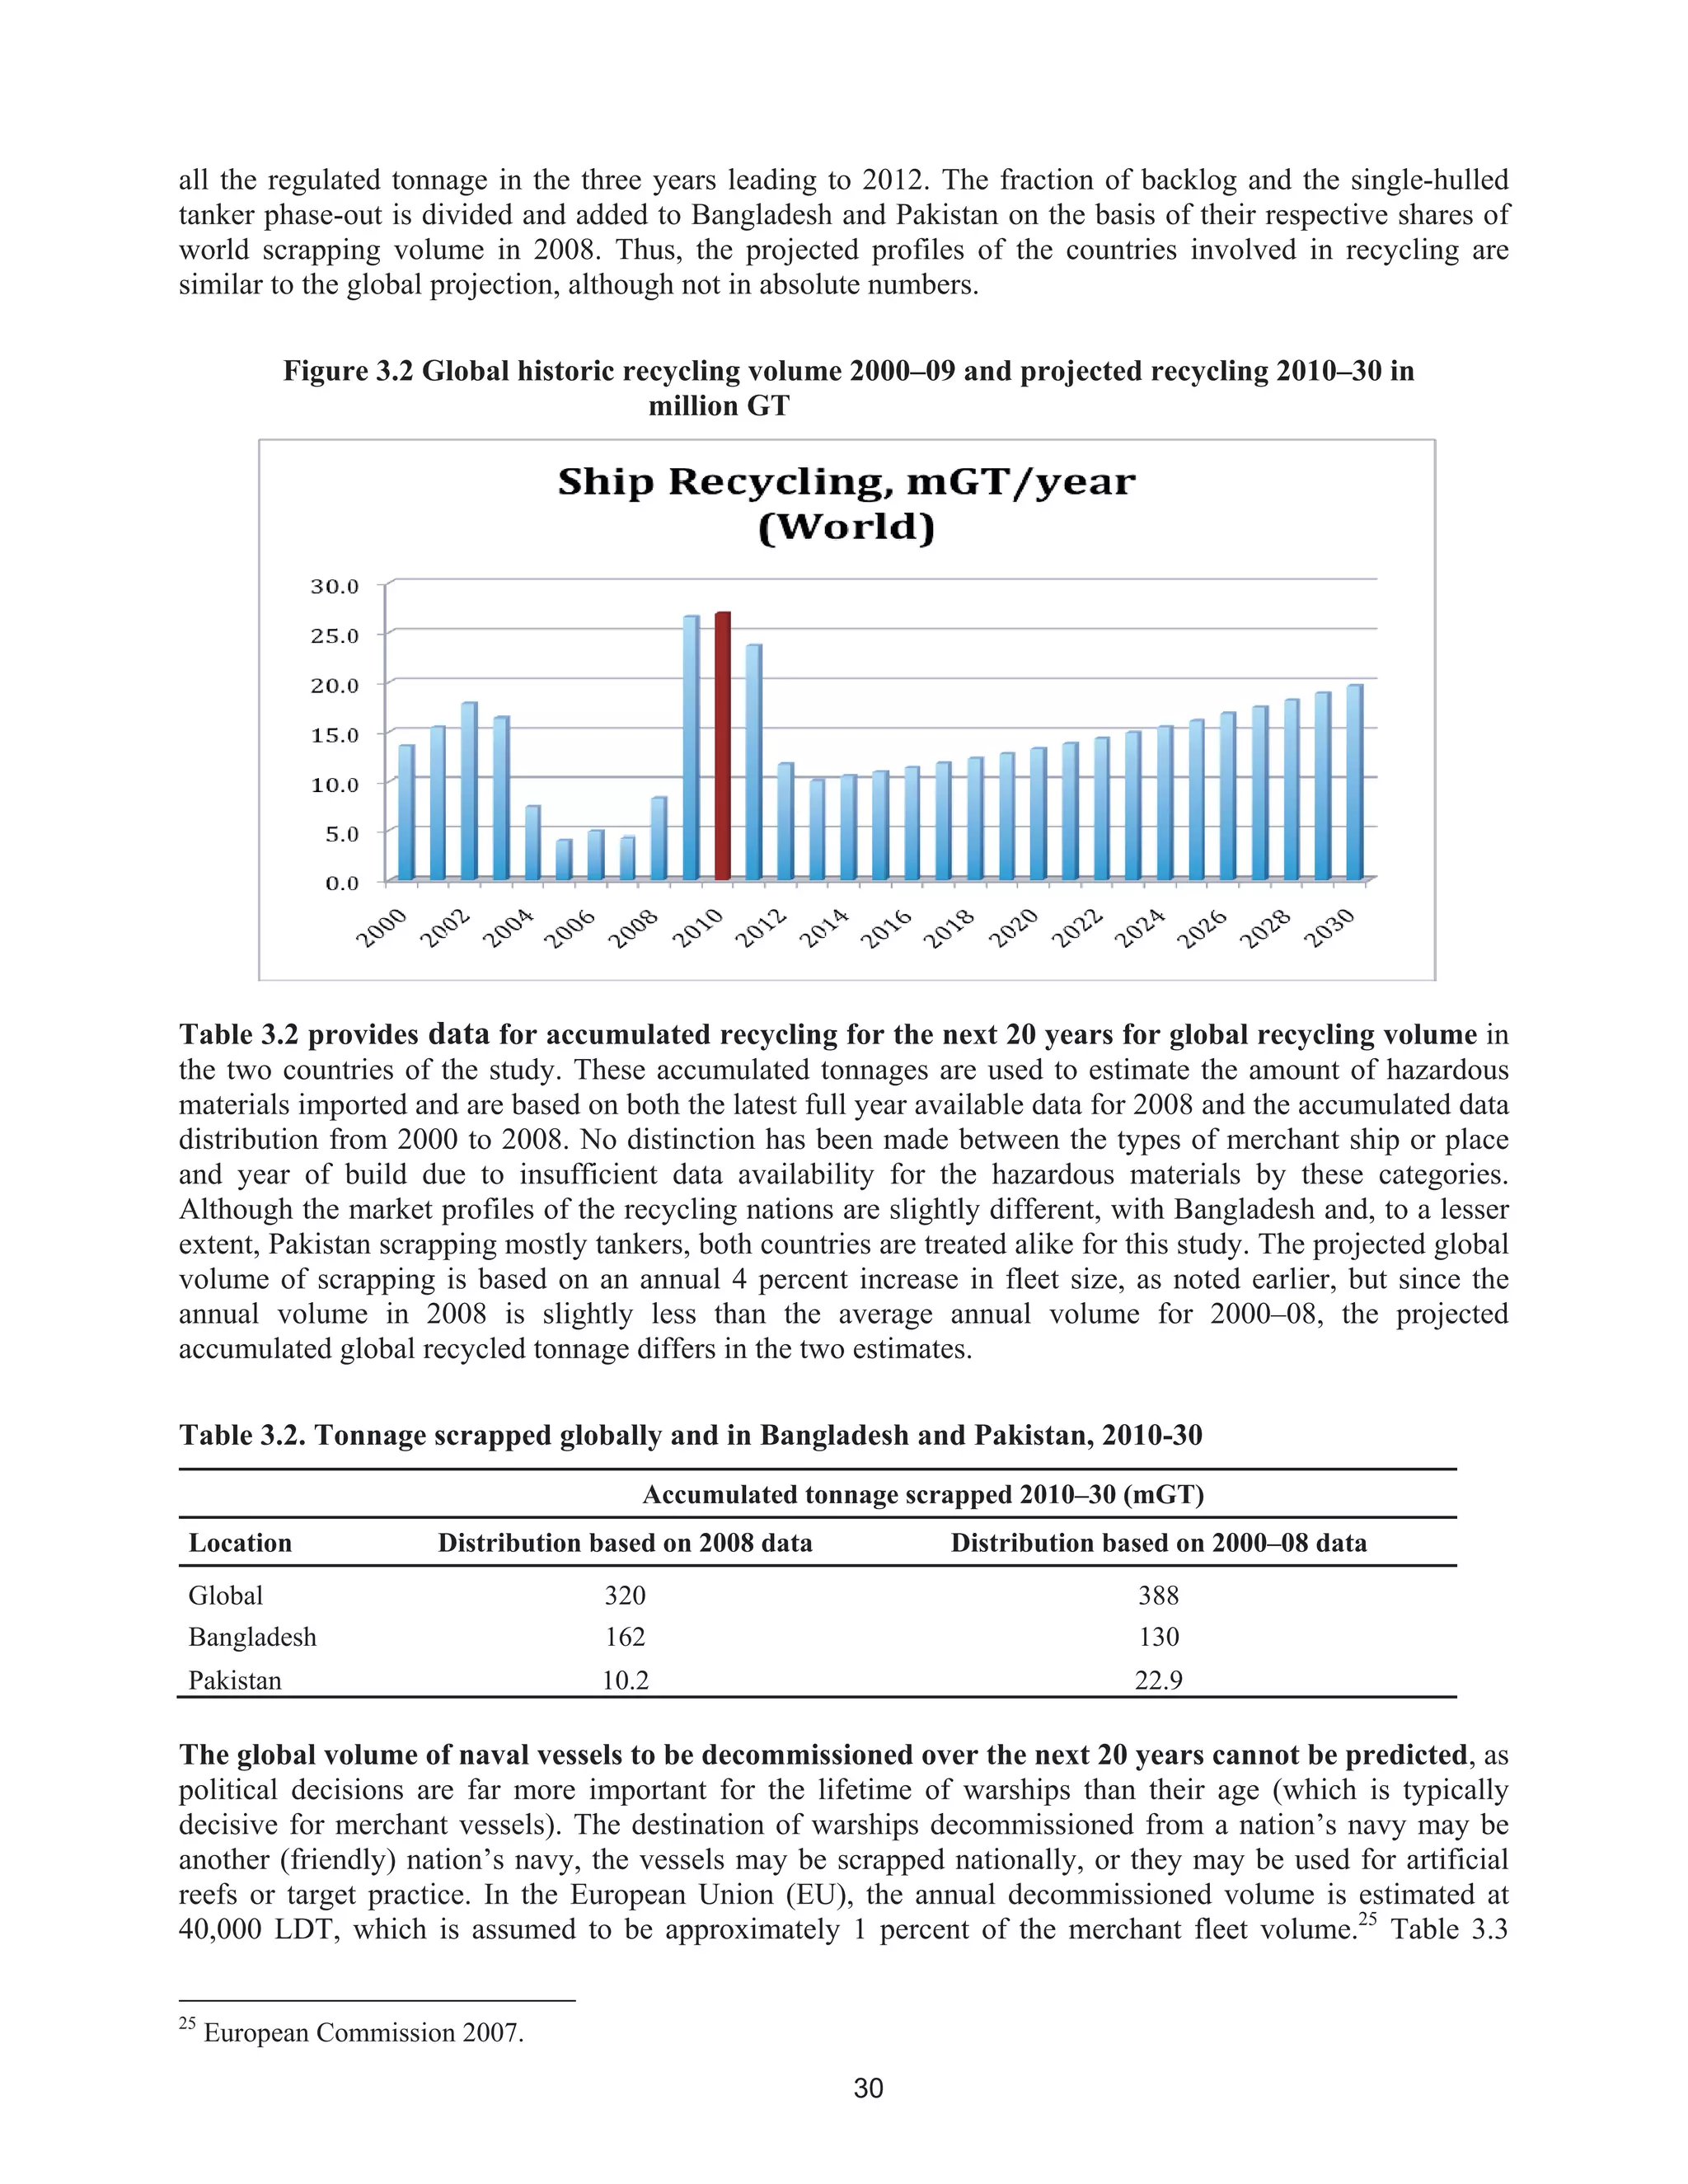
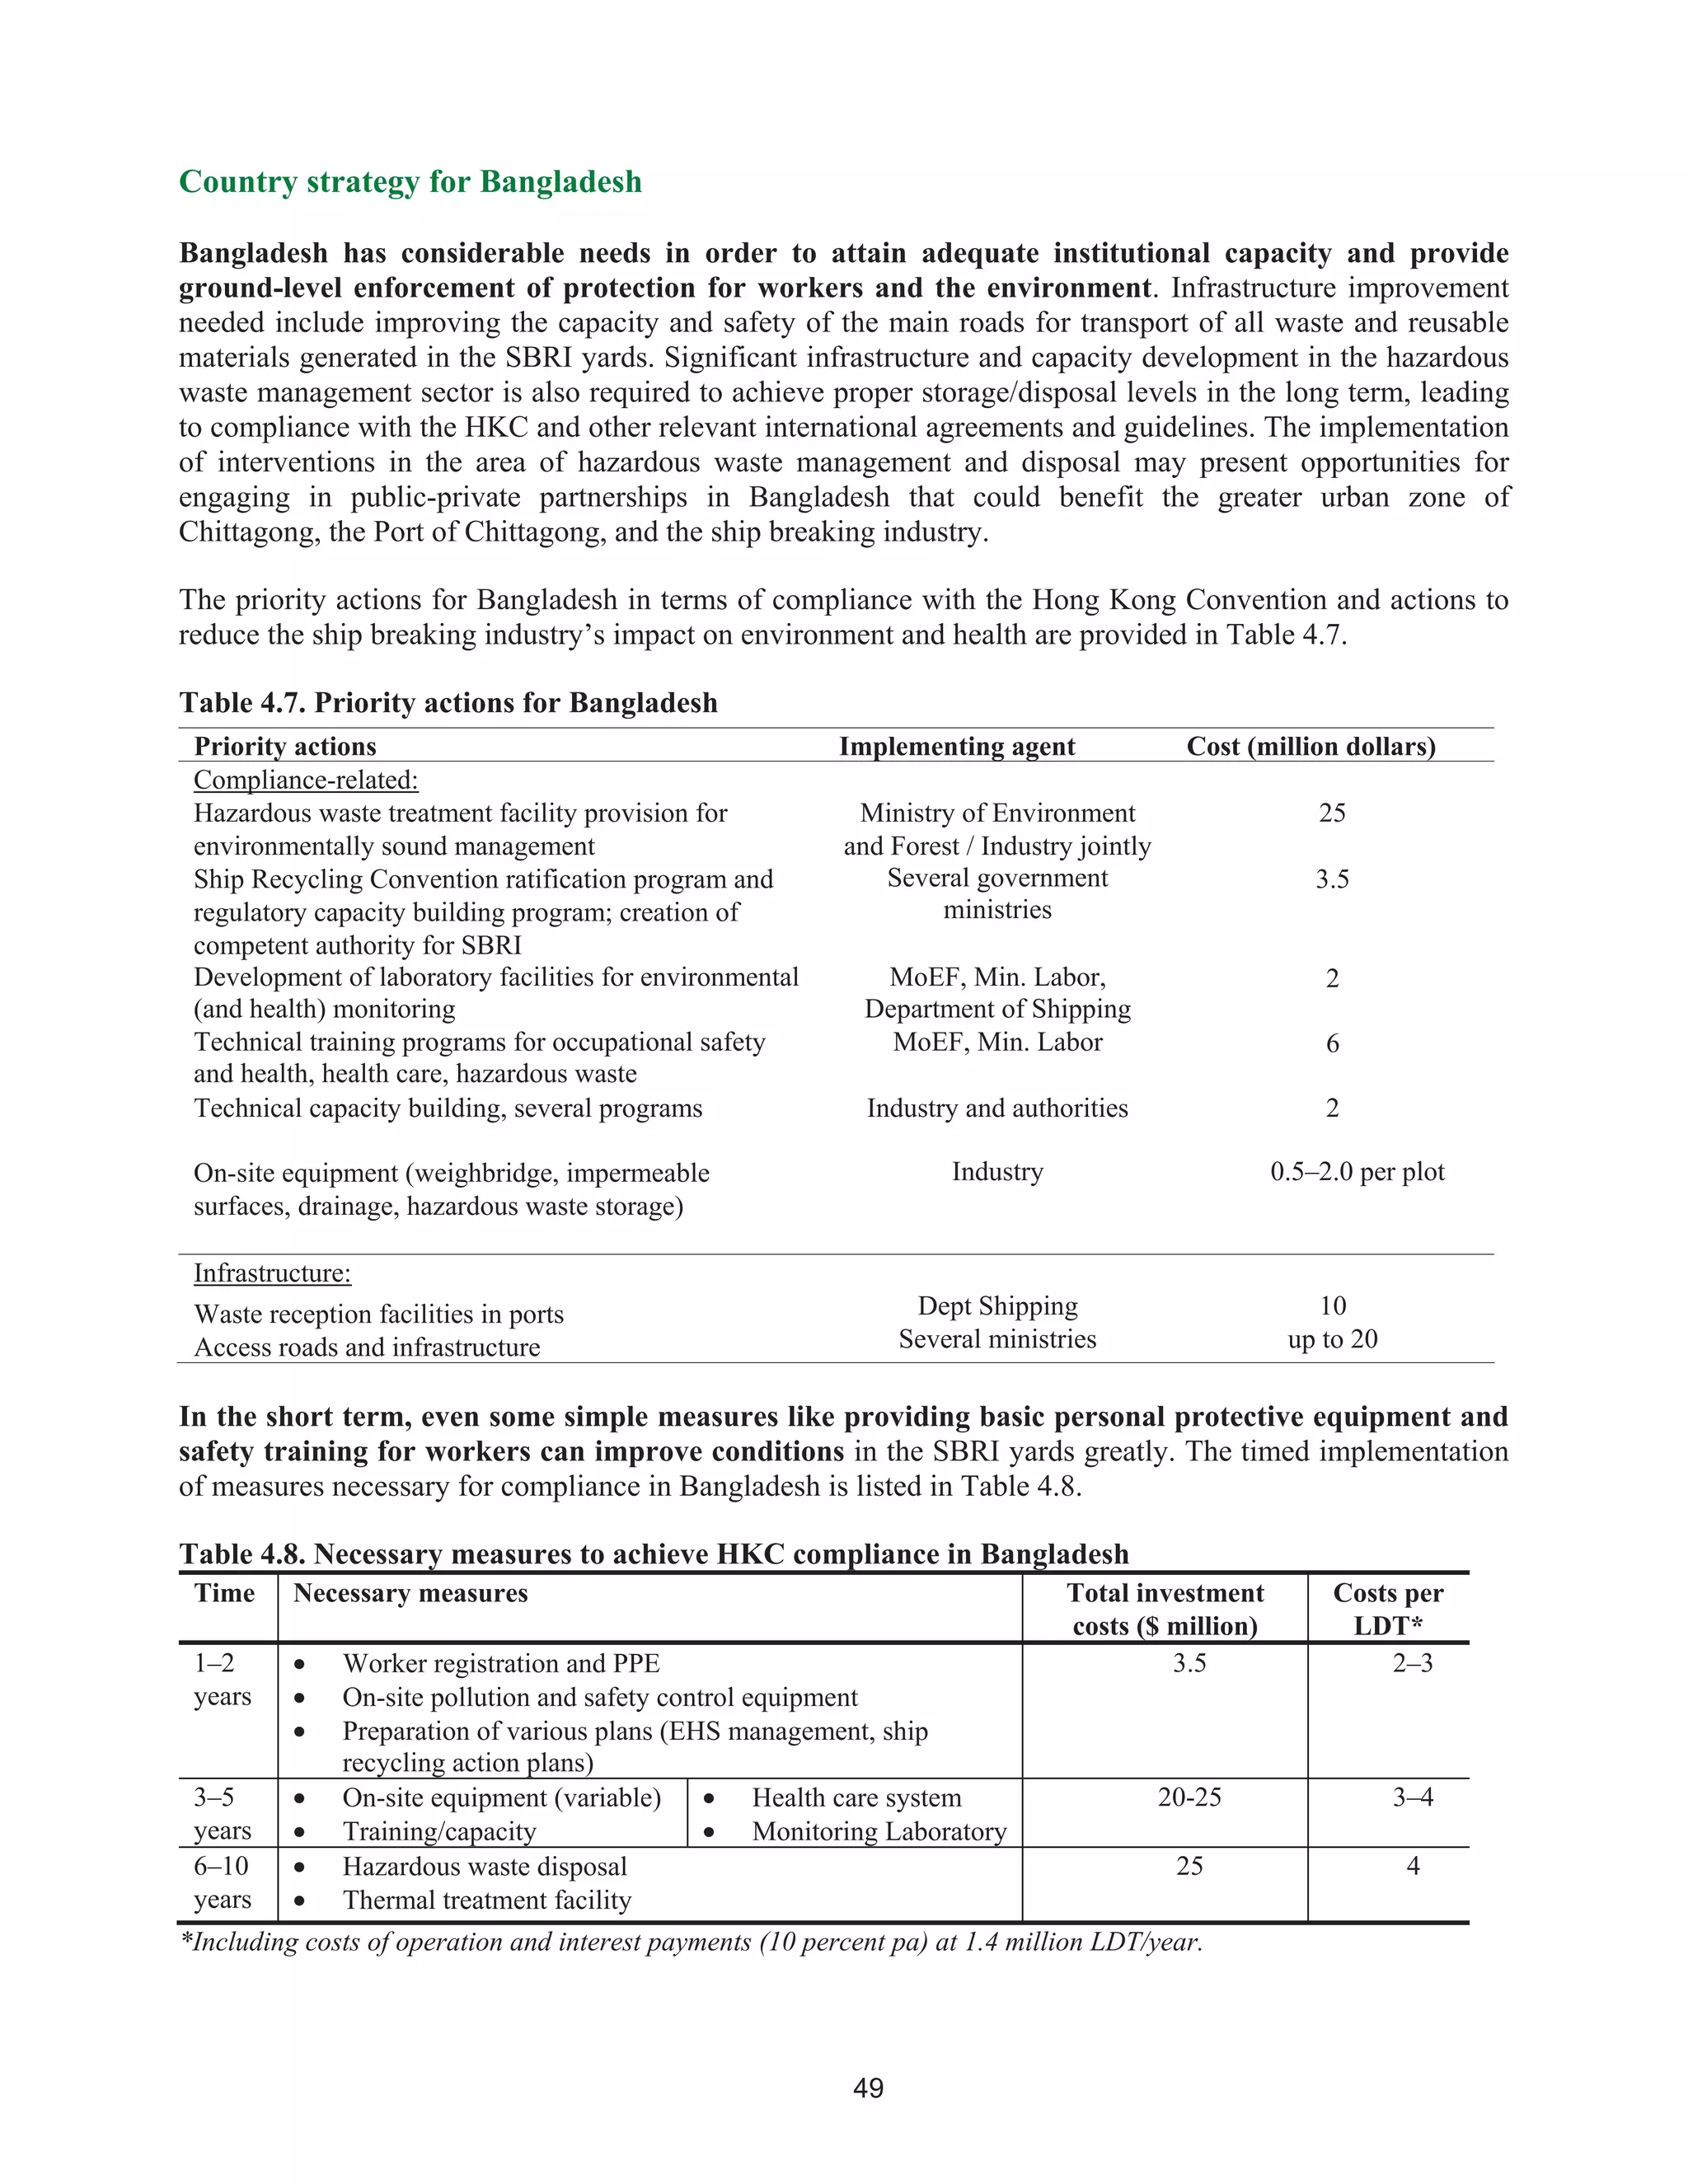
![69
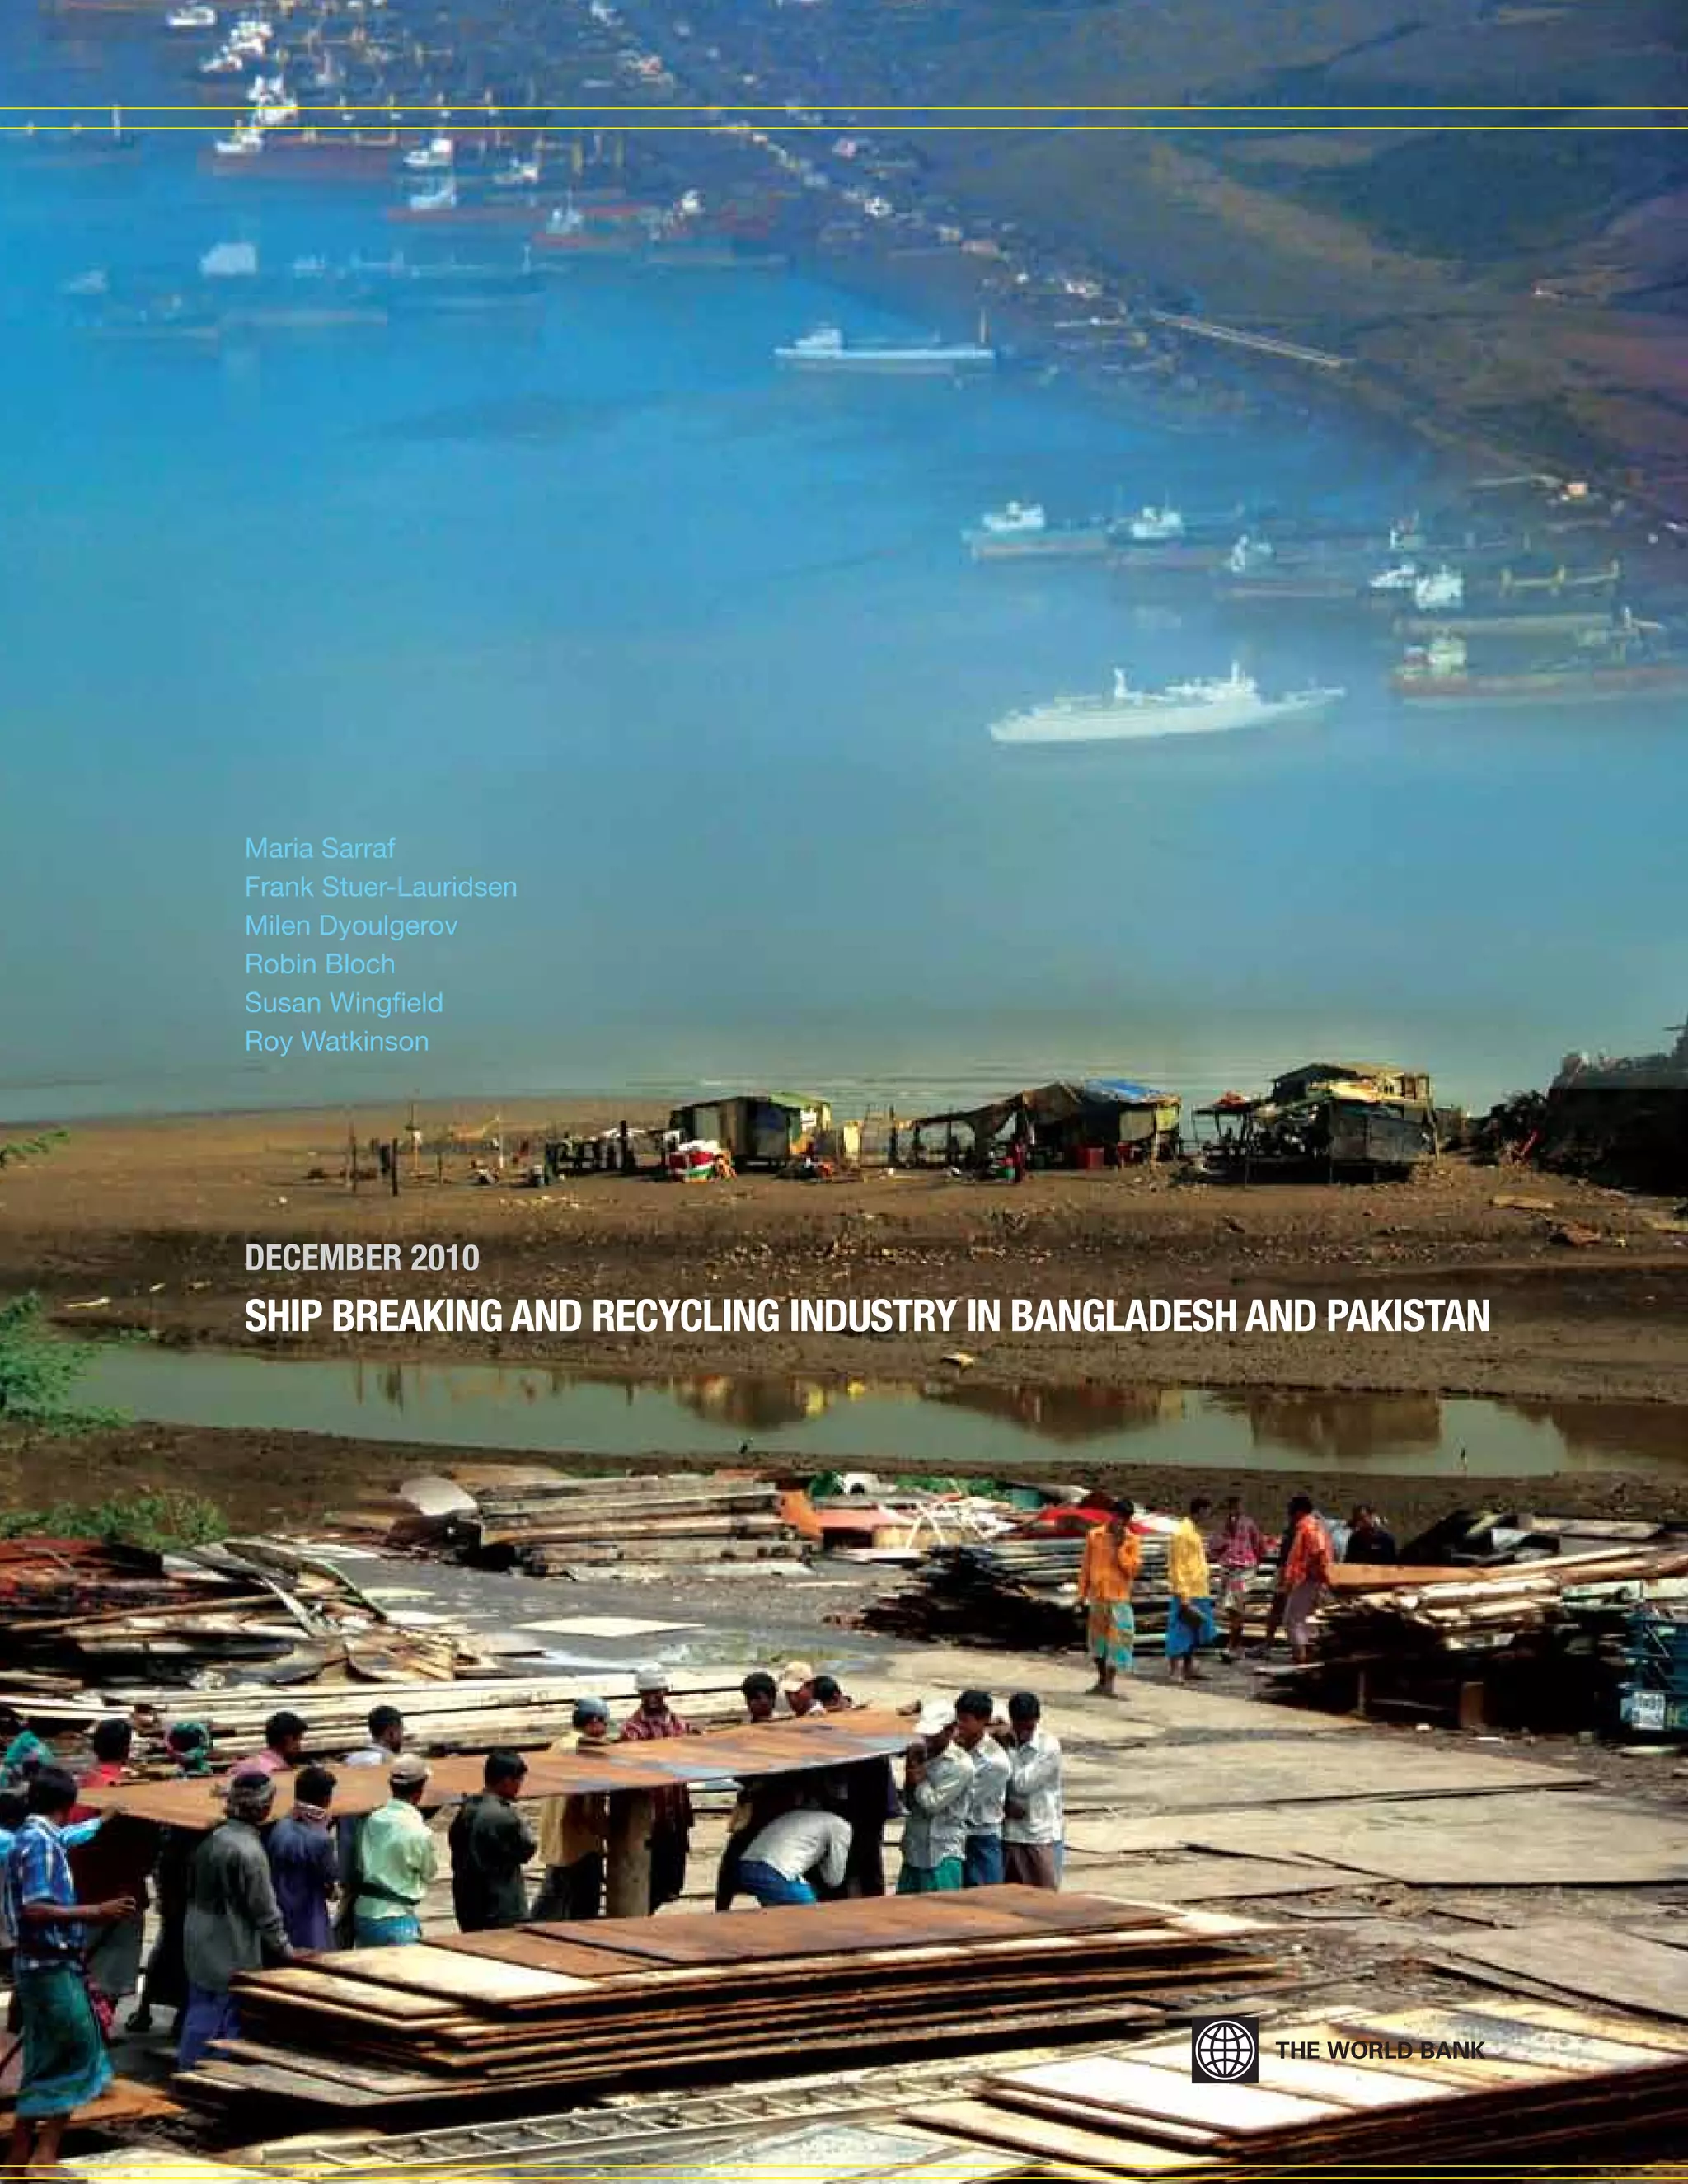
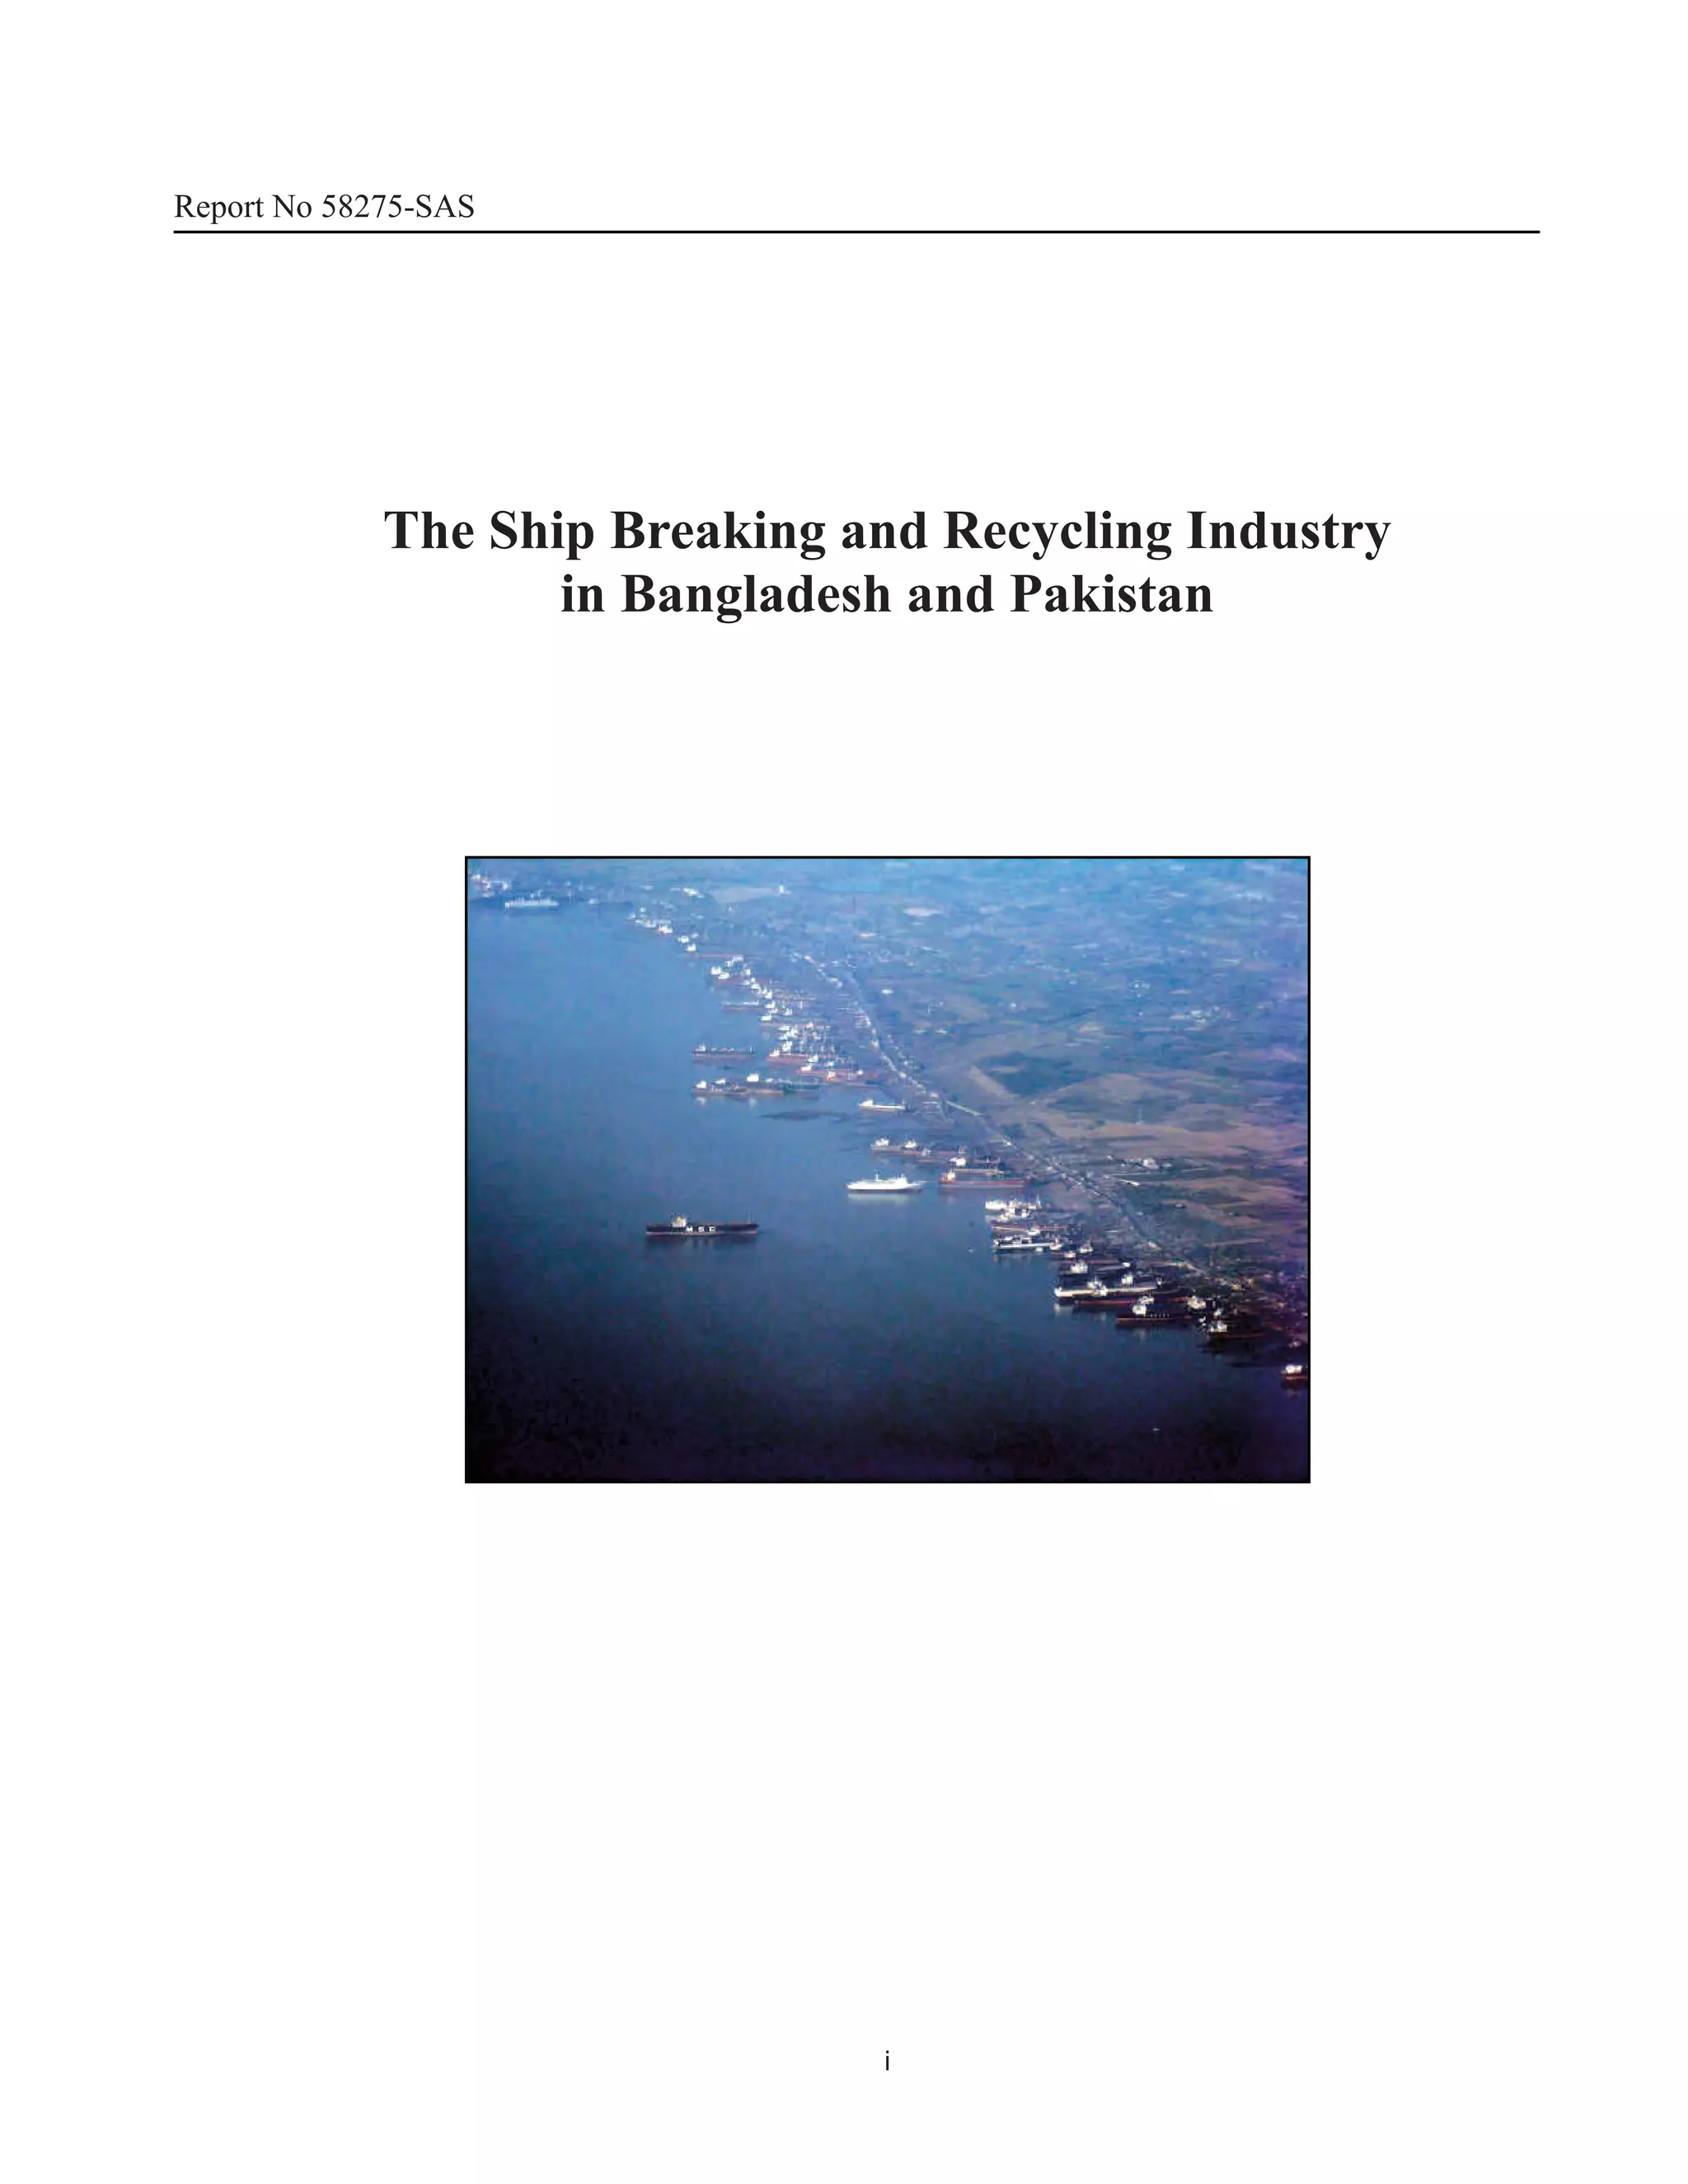
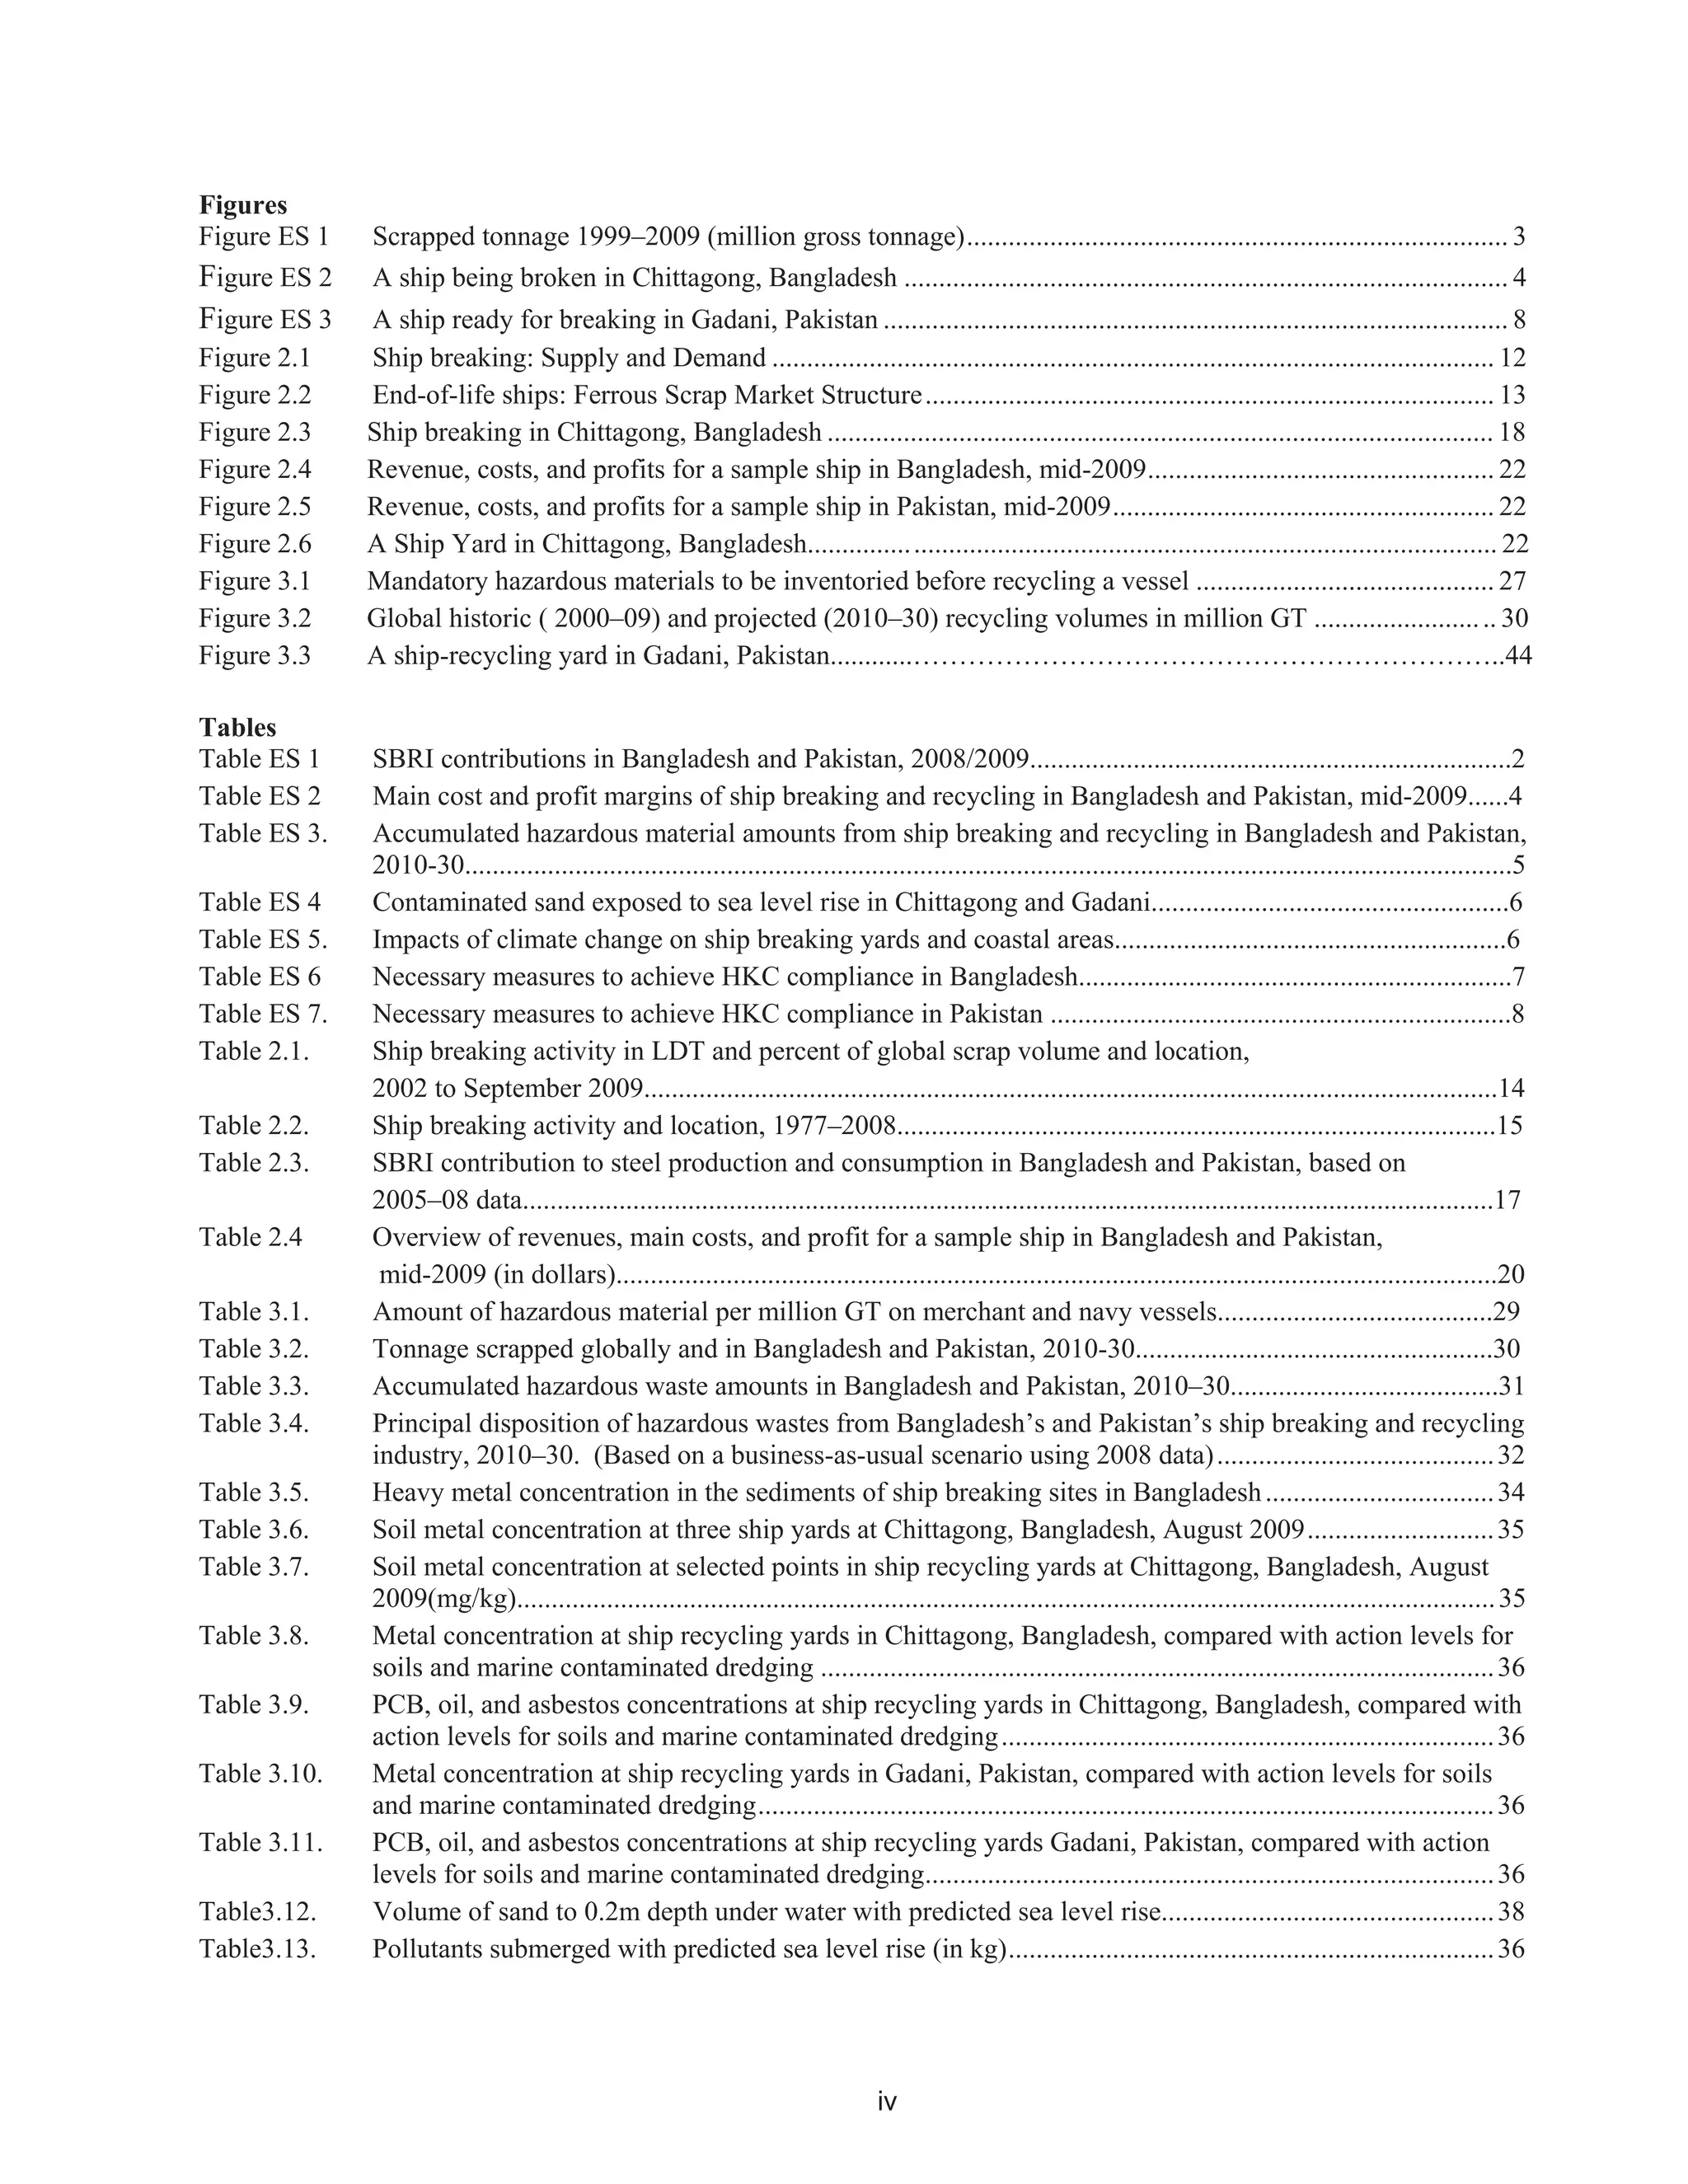
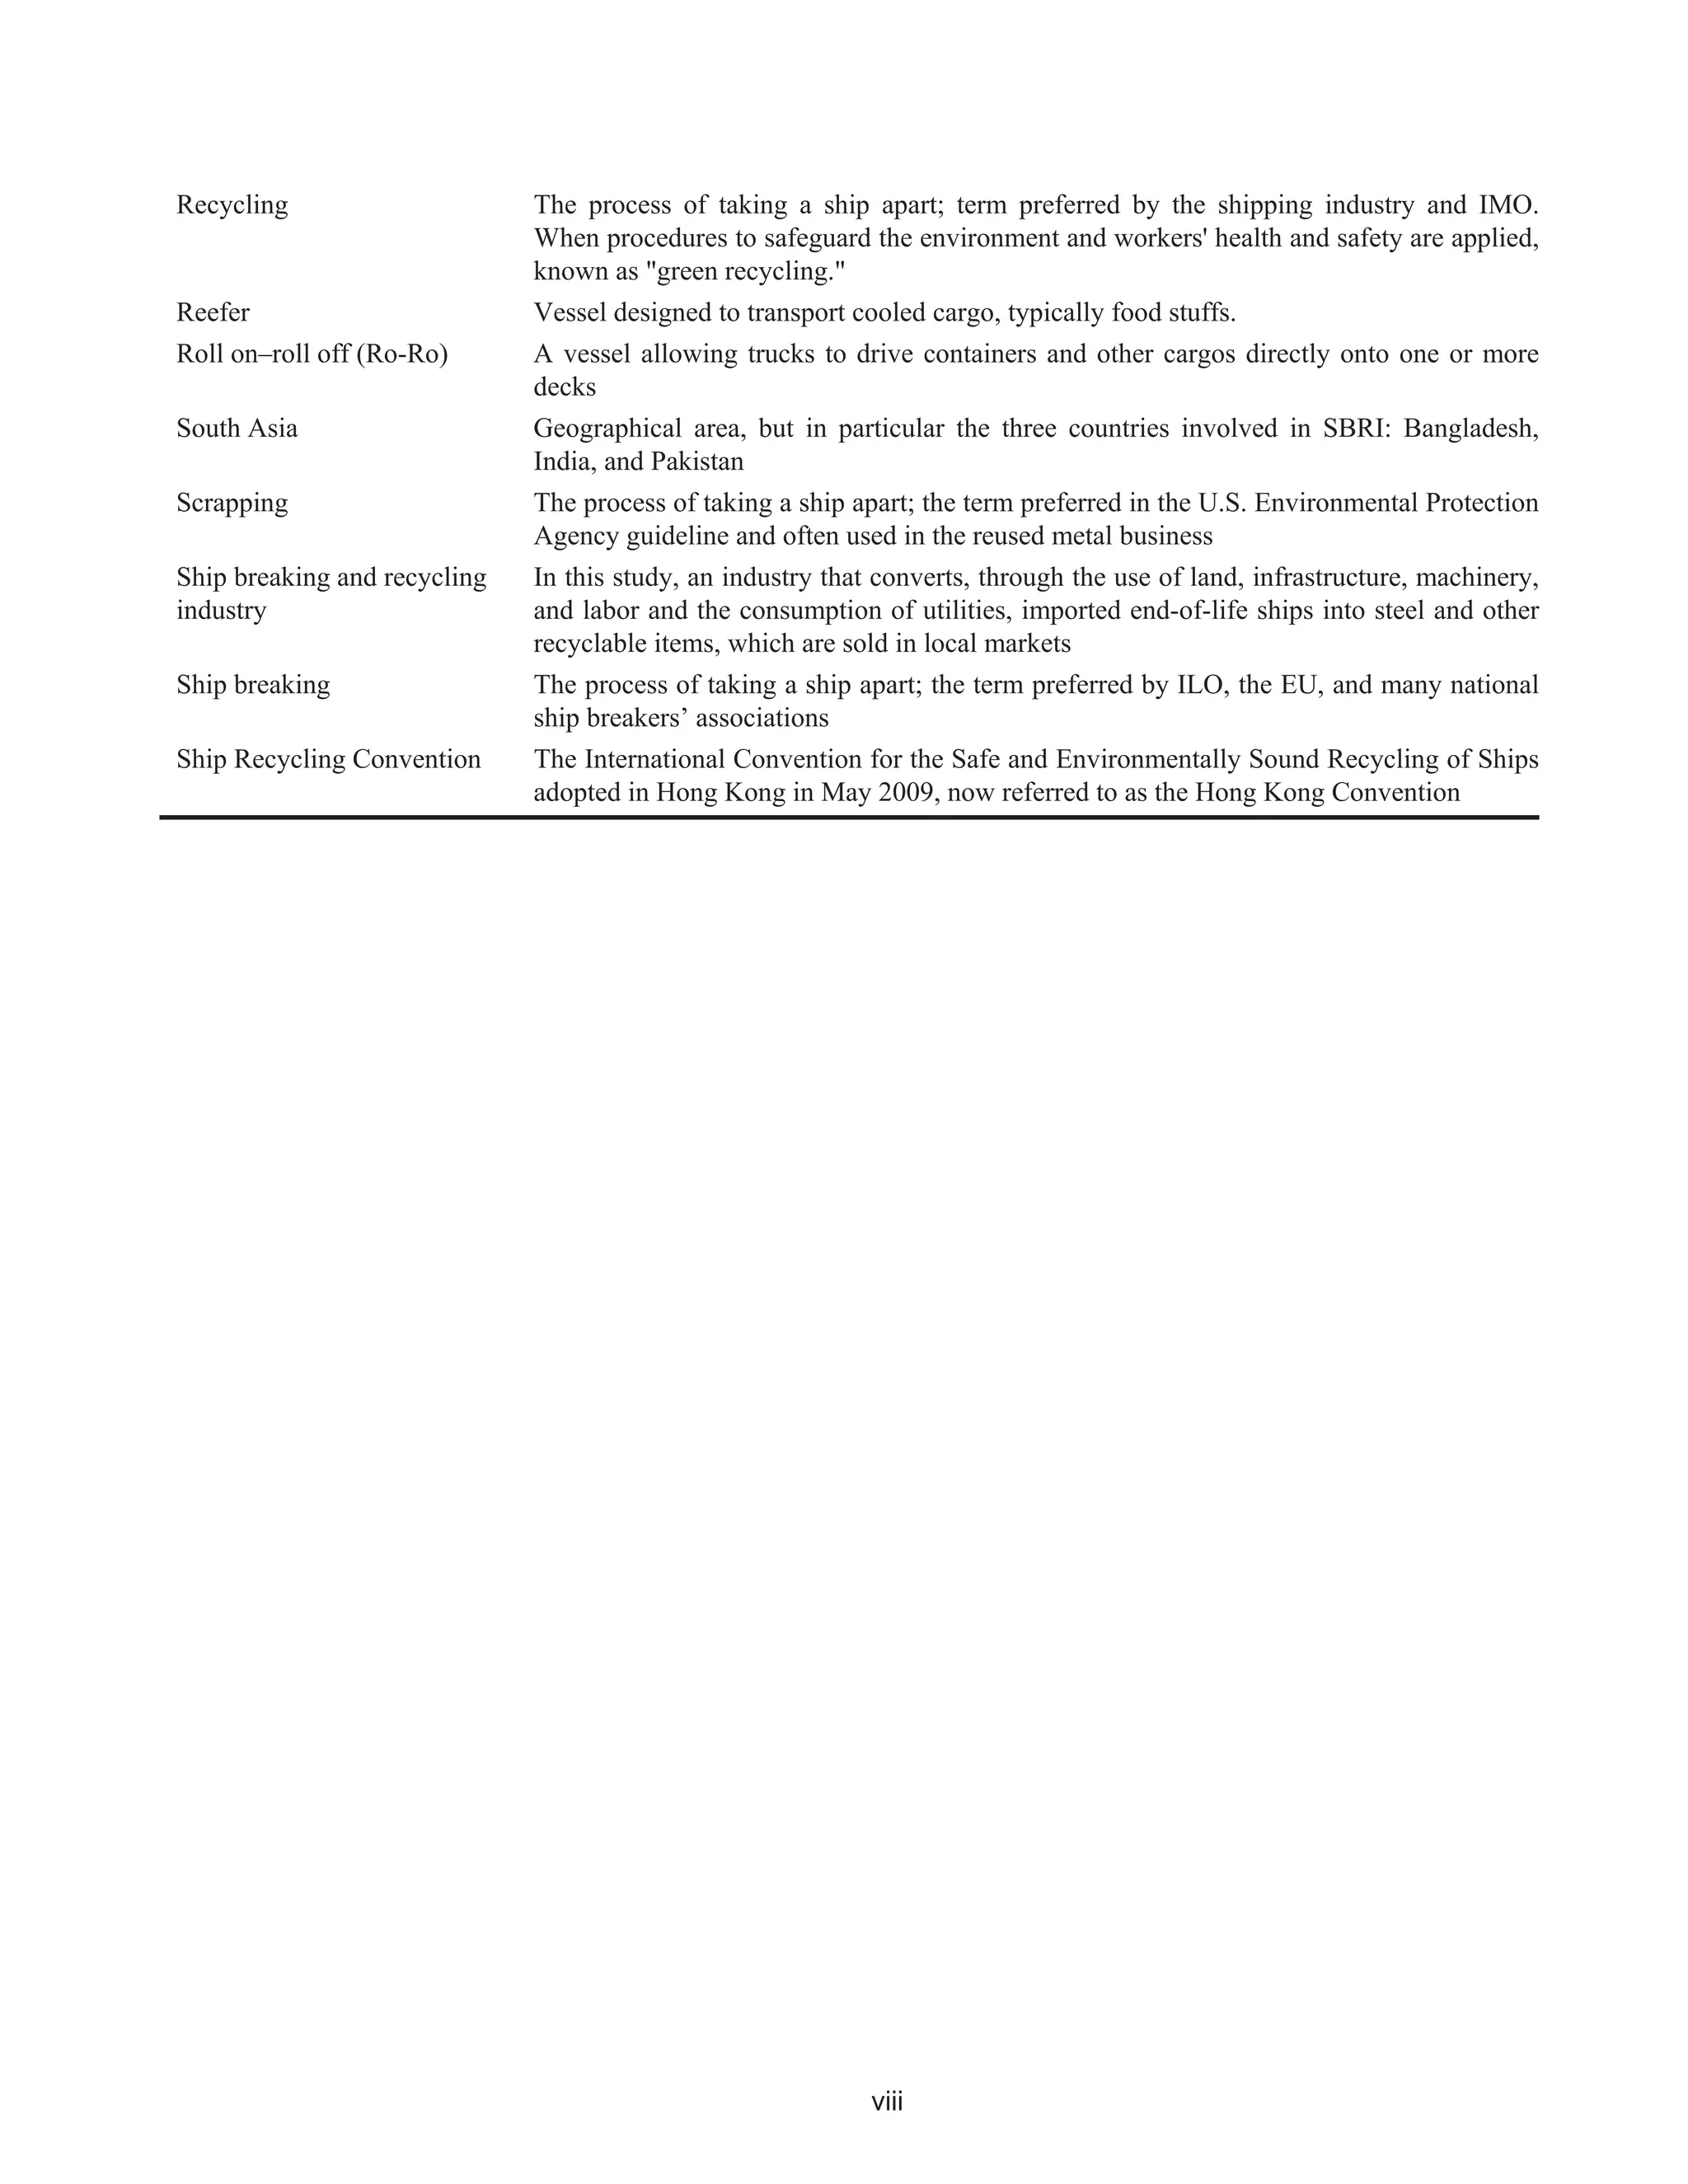
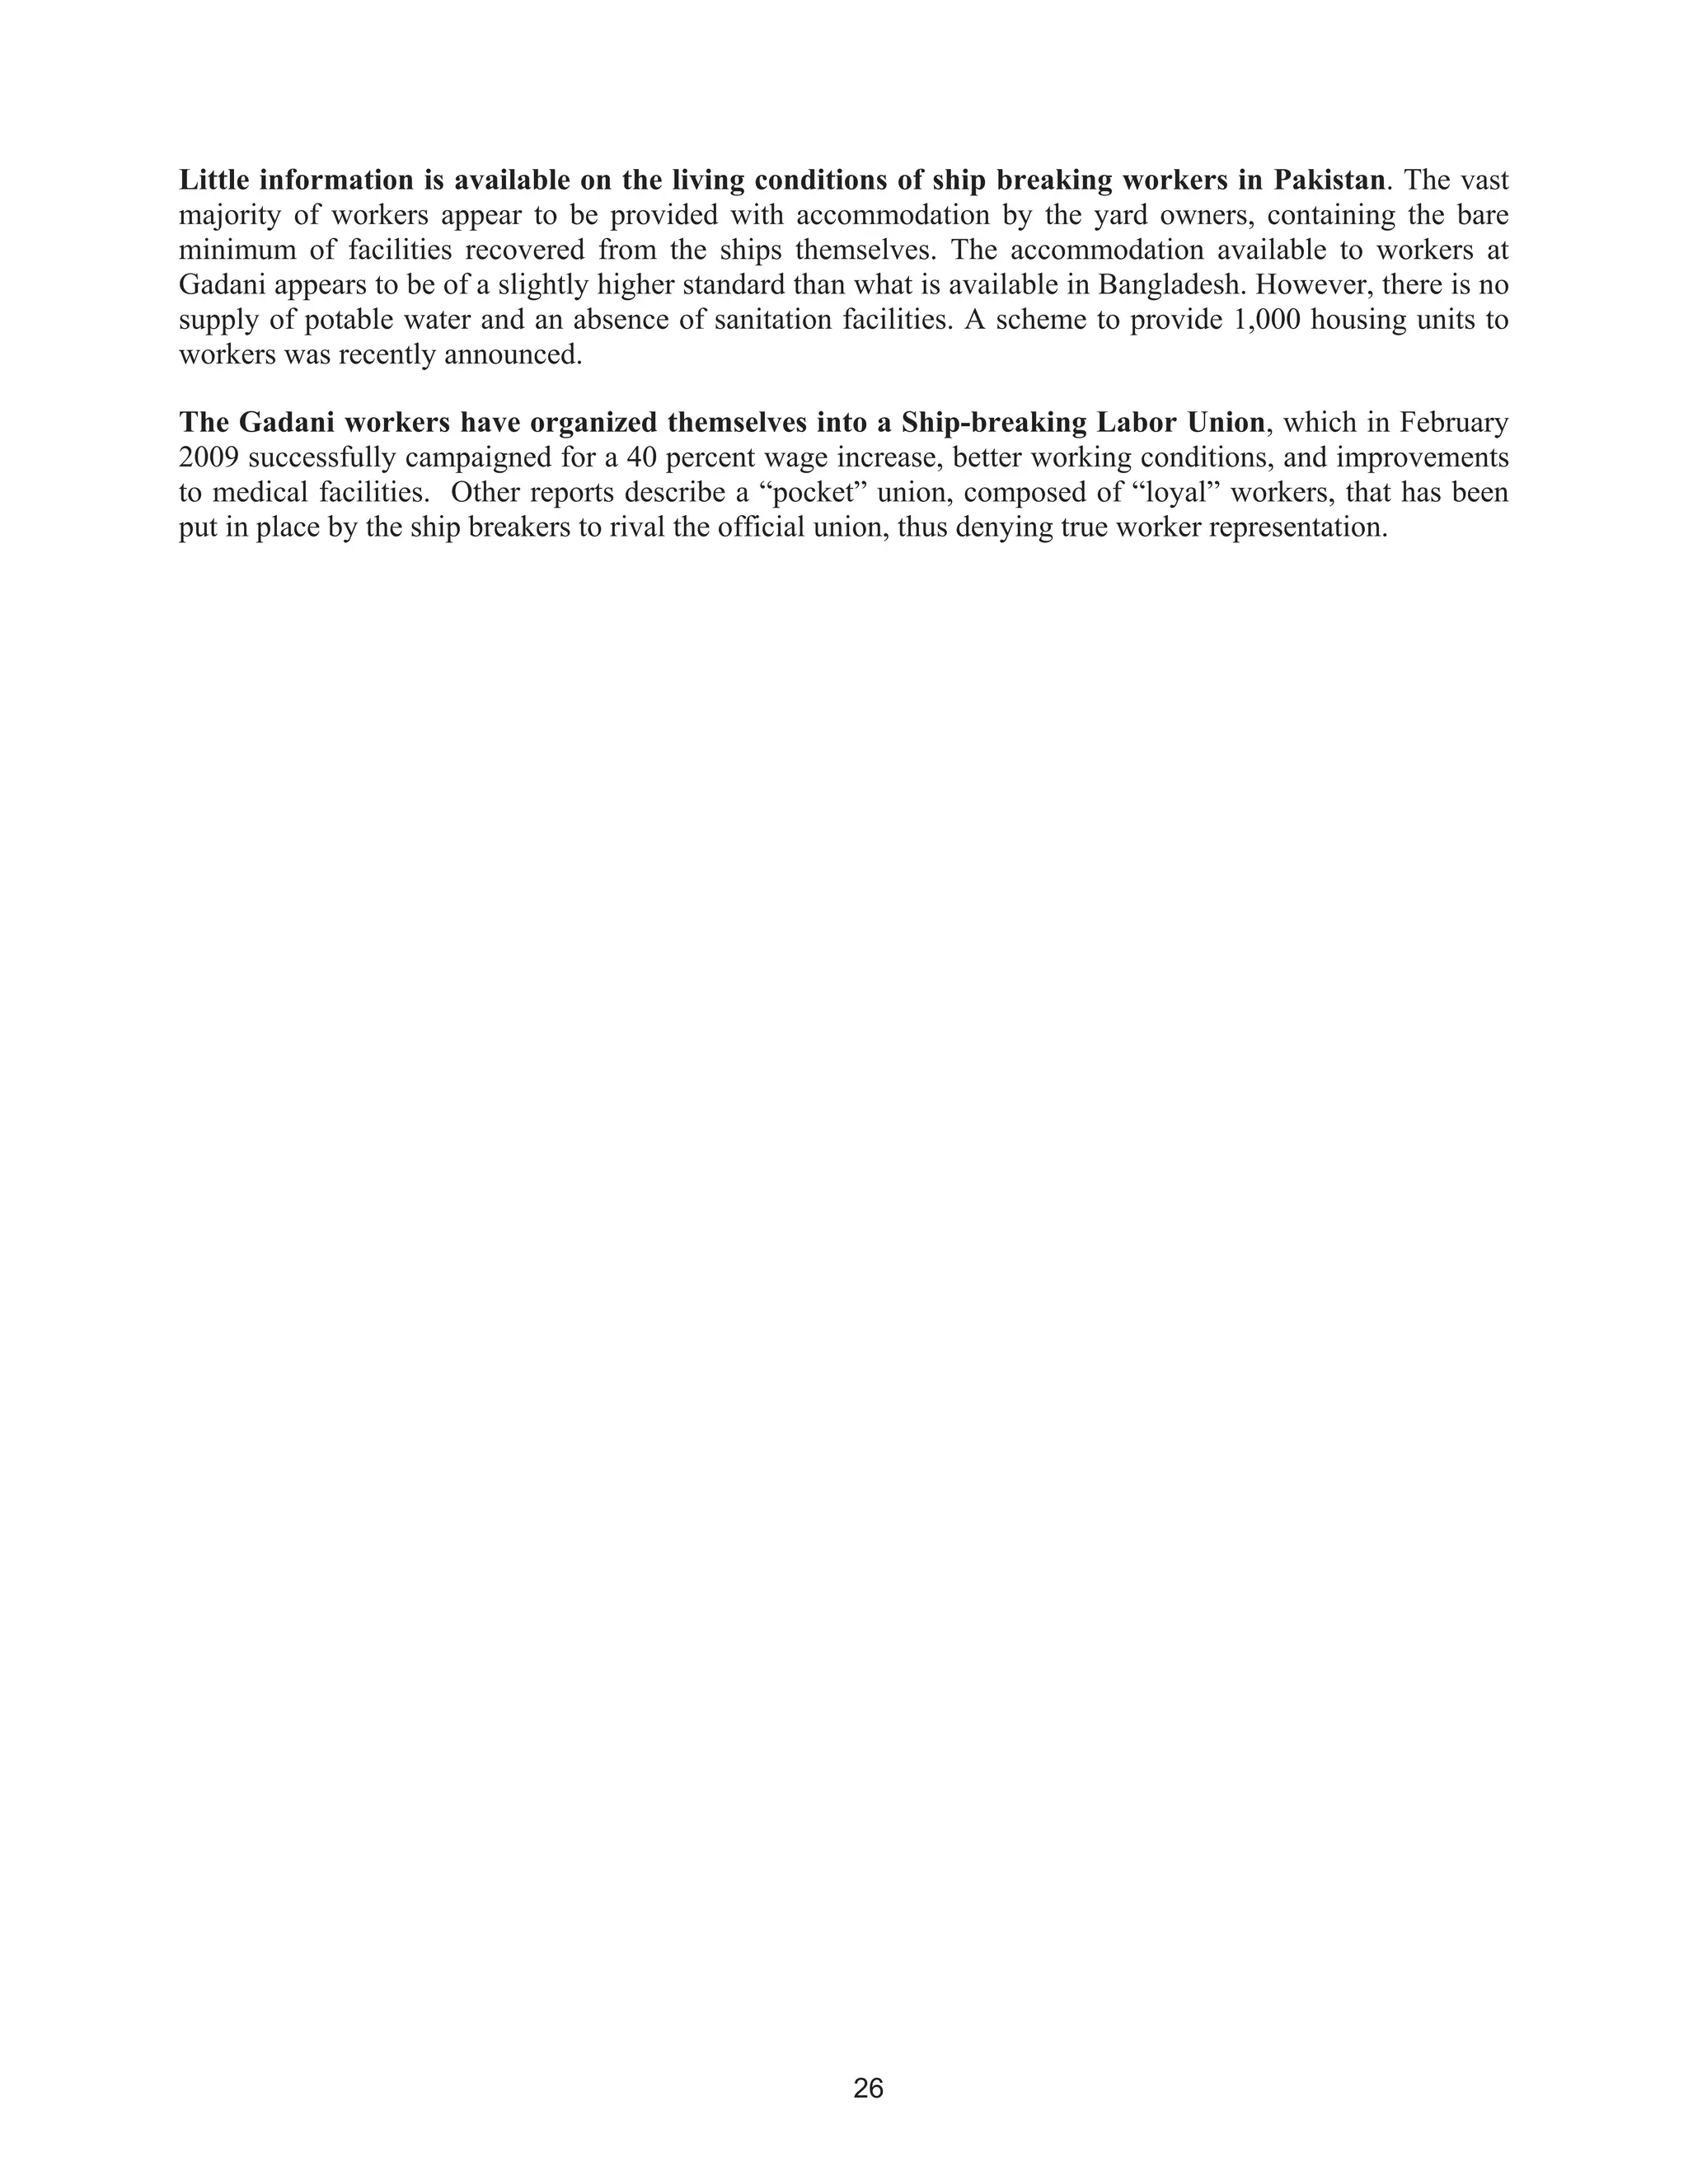
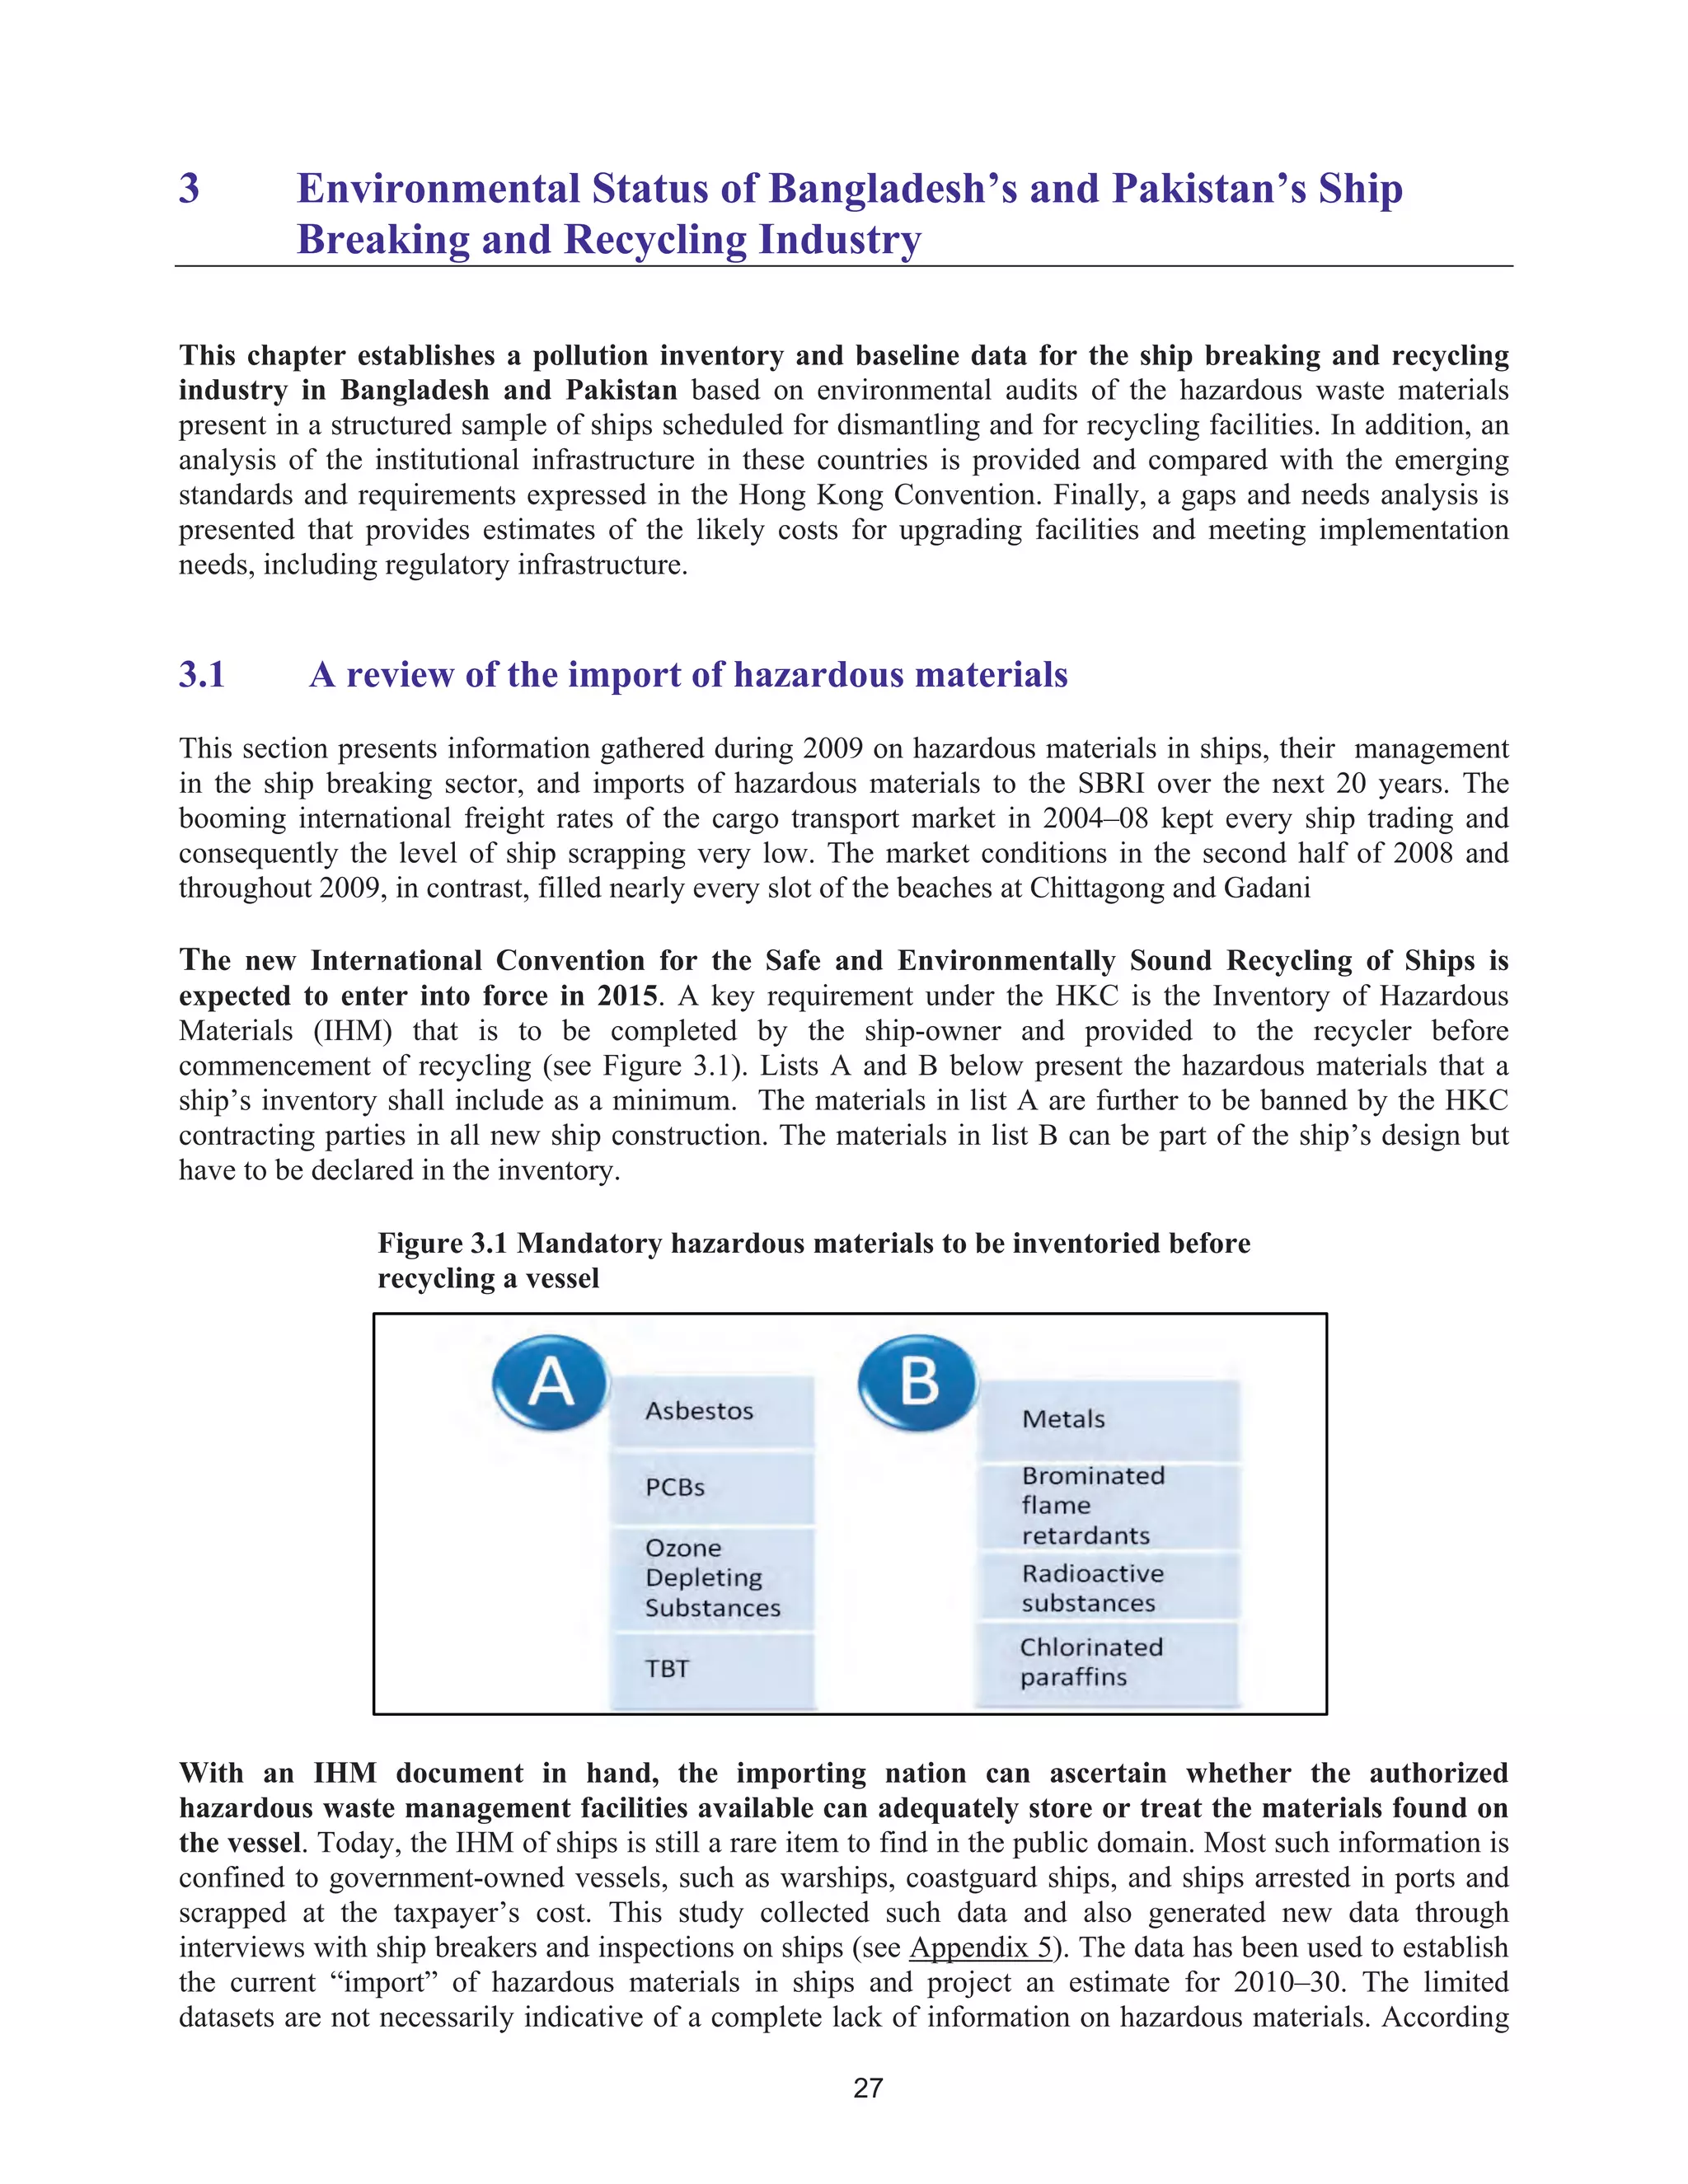
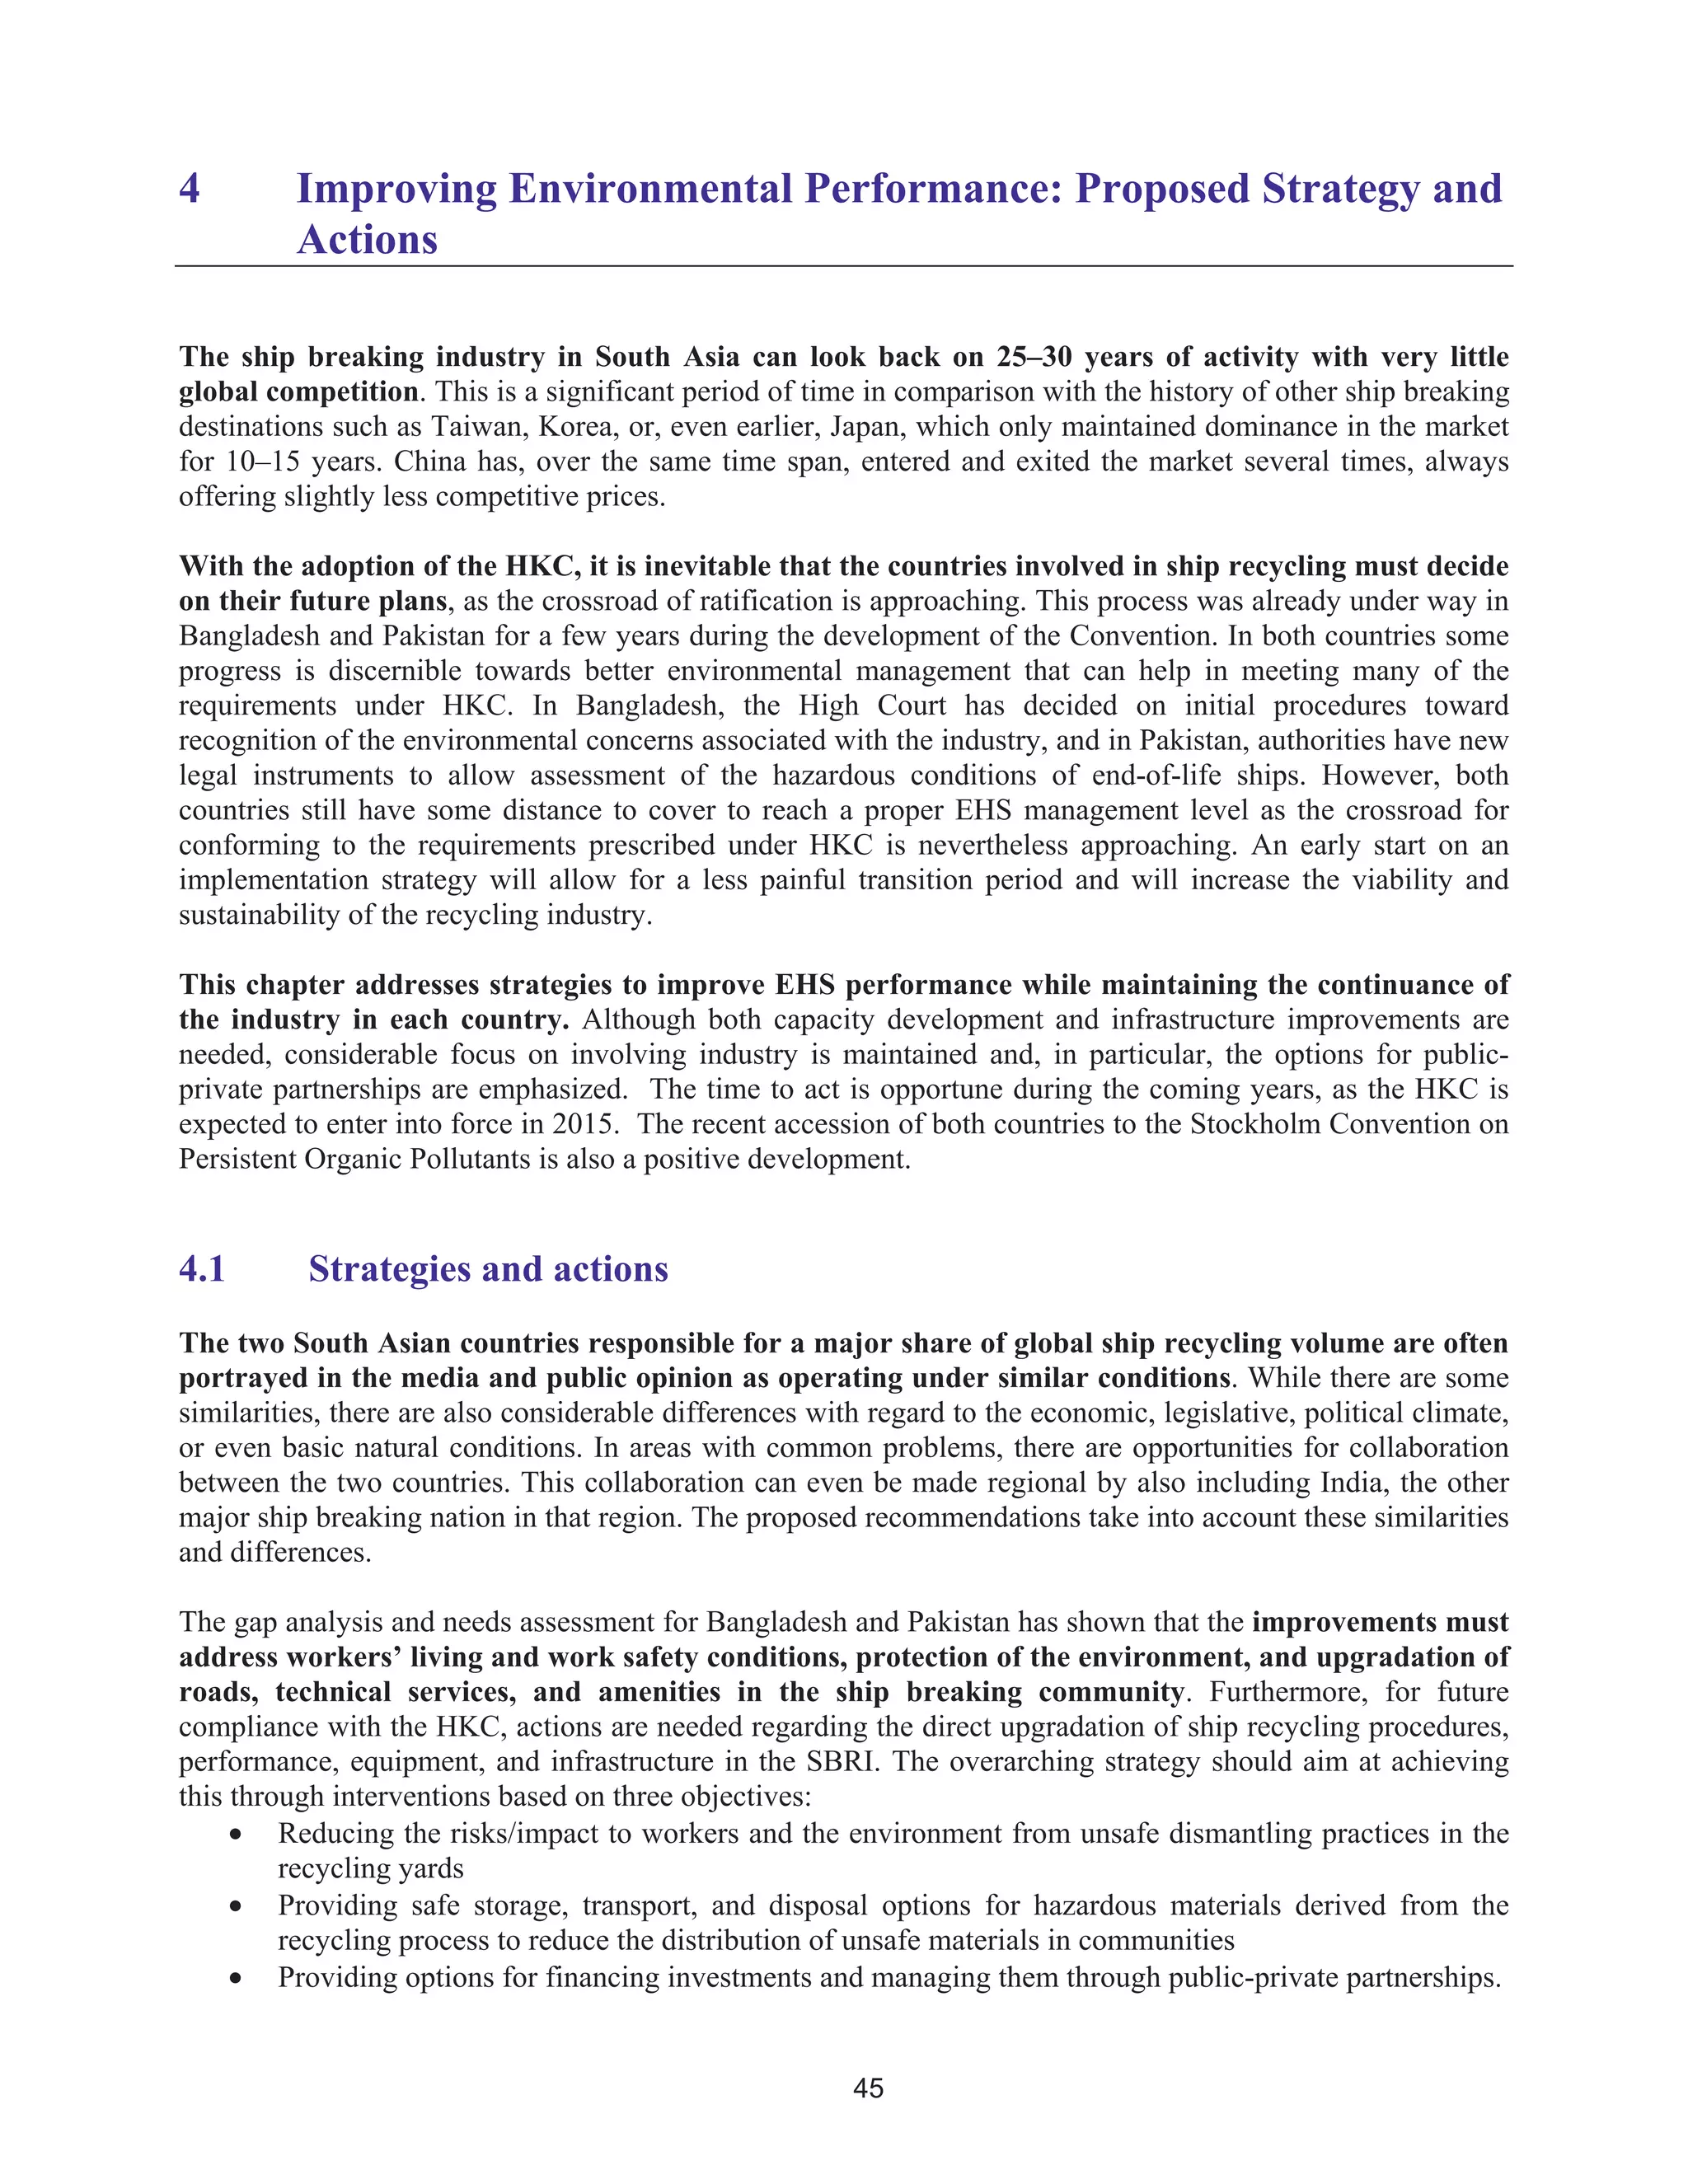
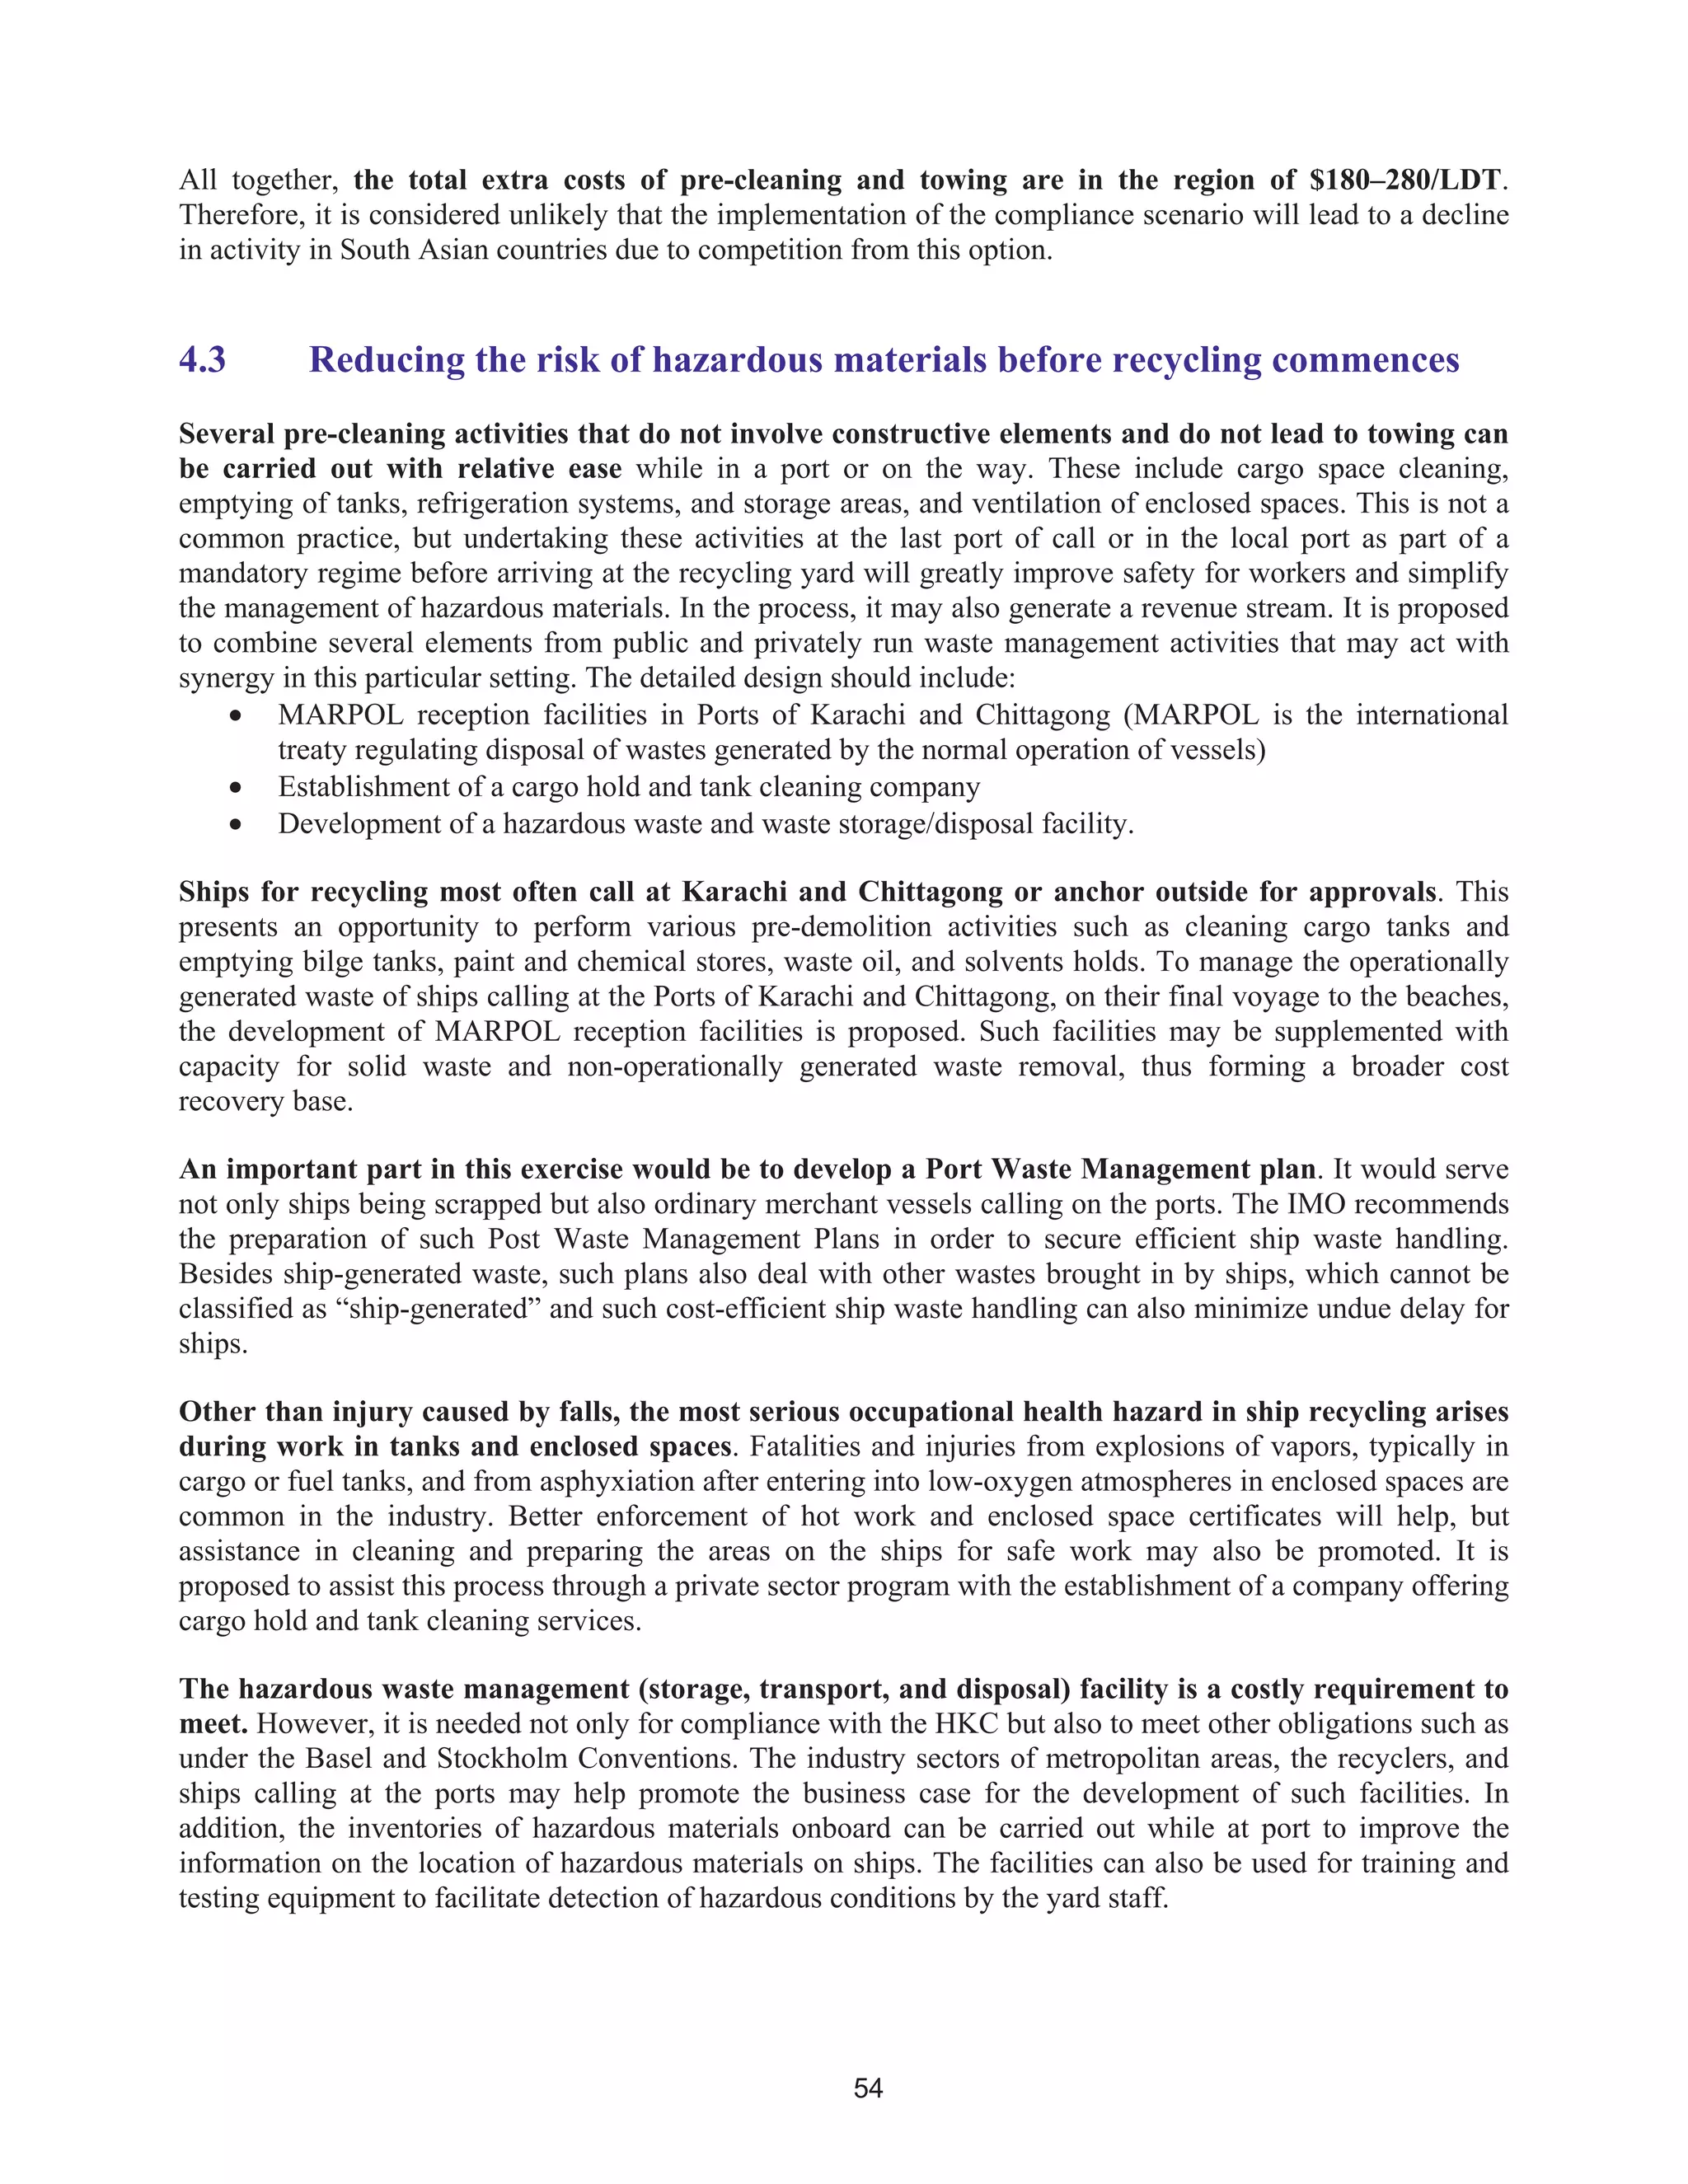
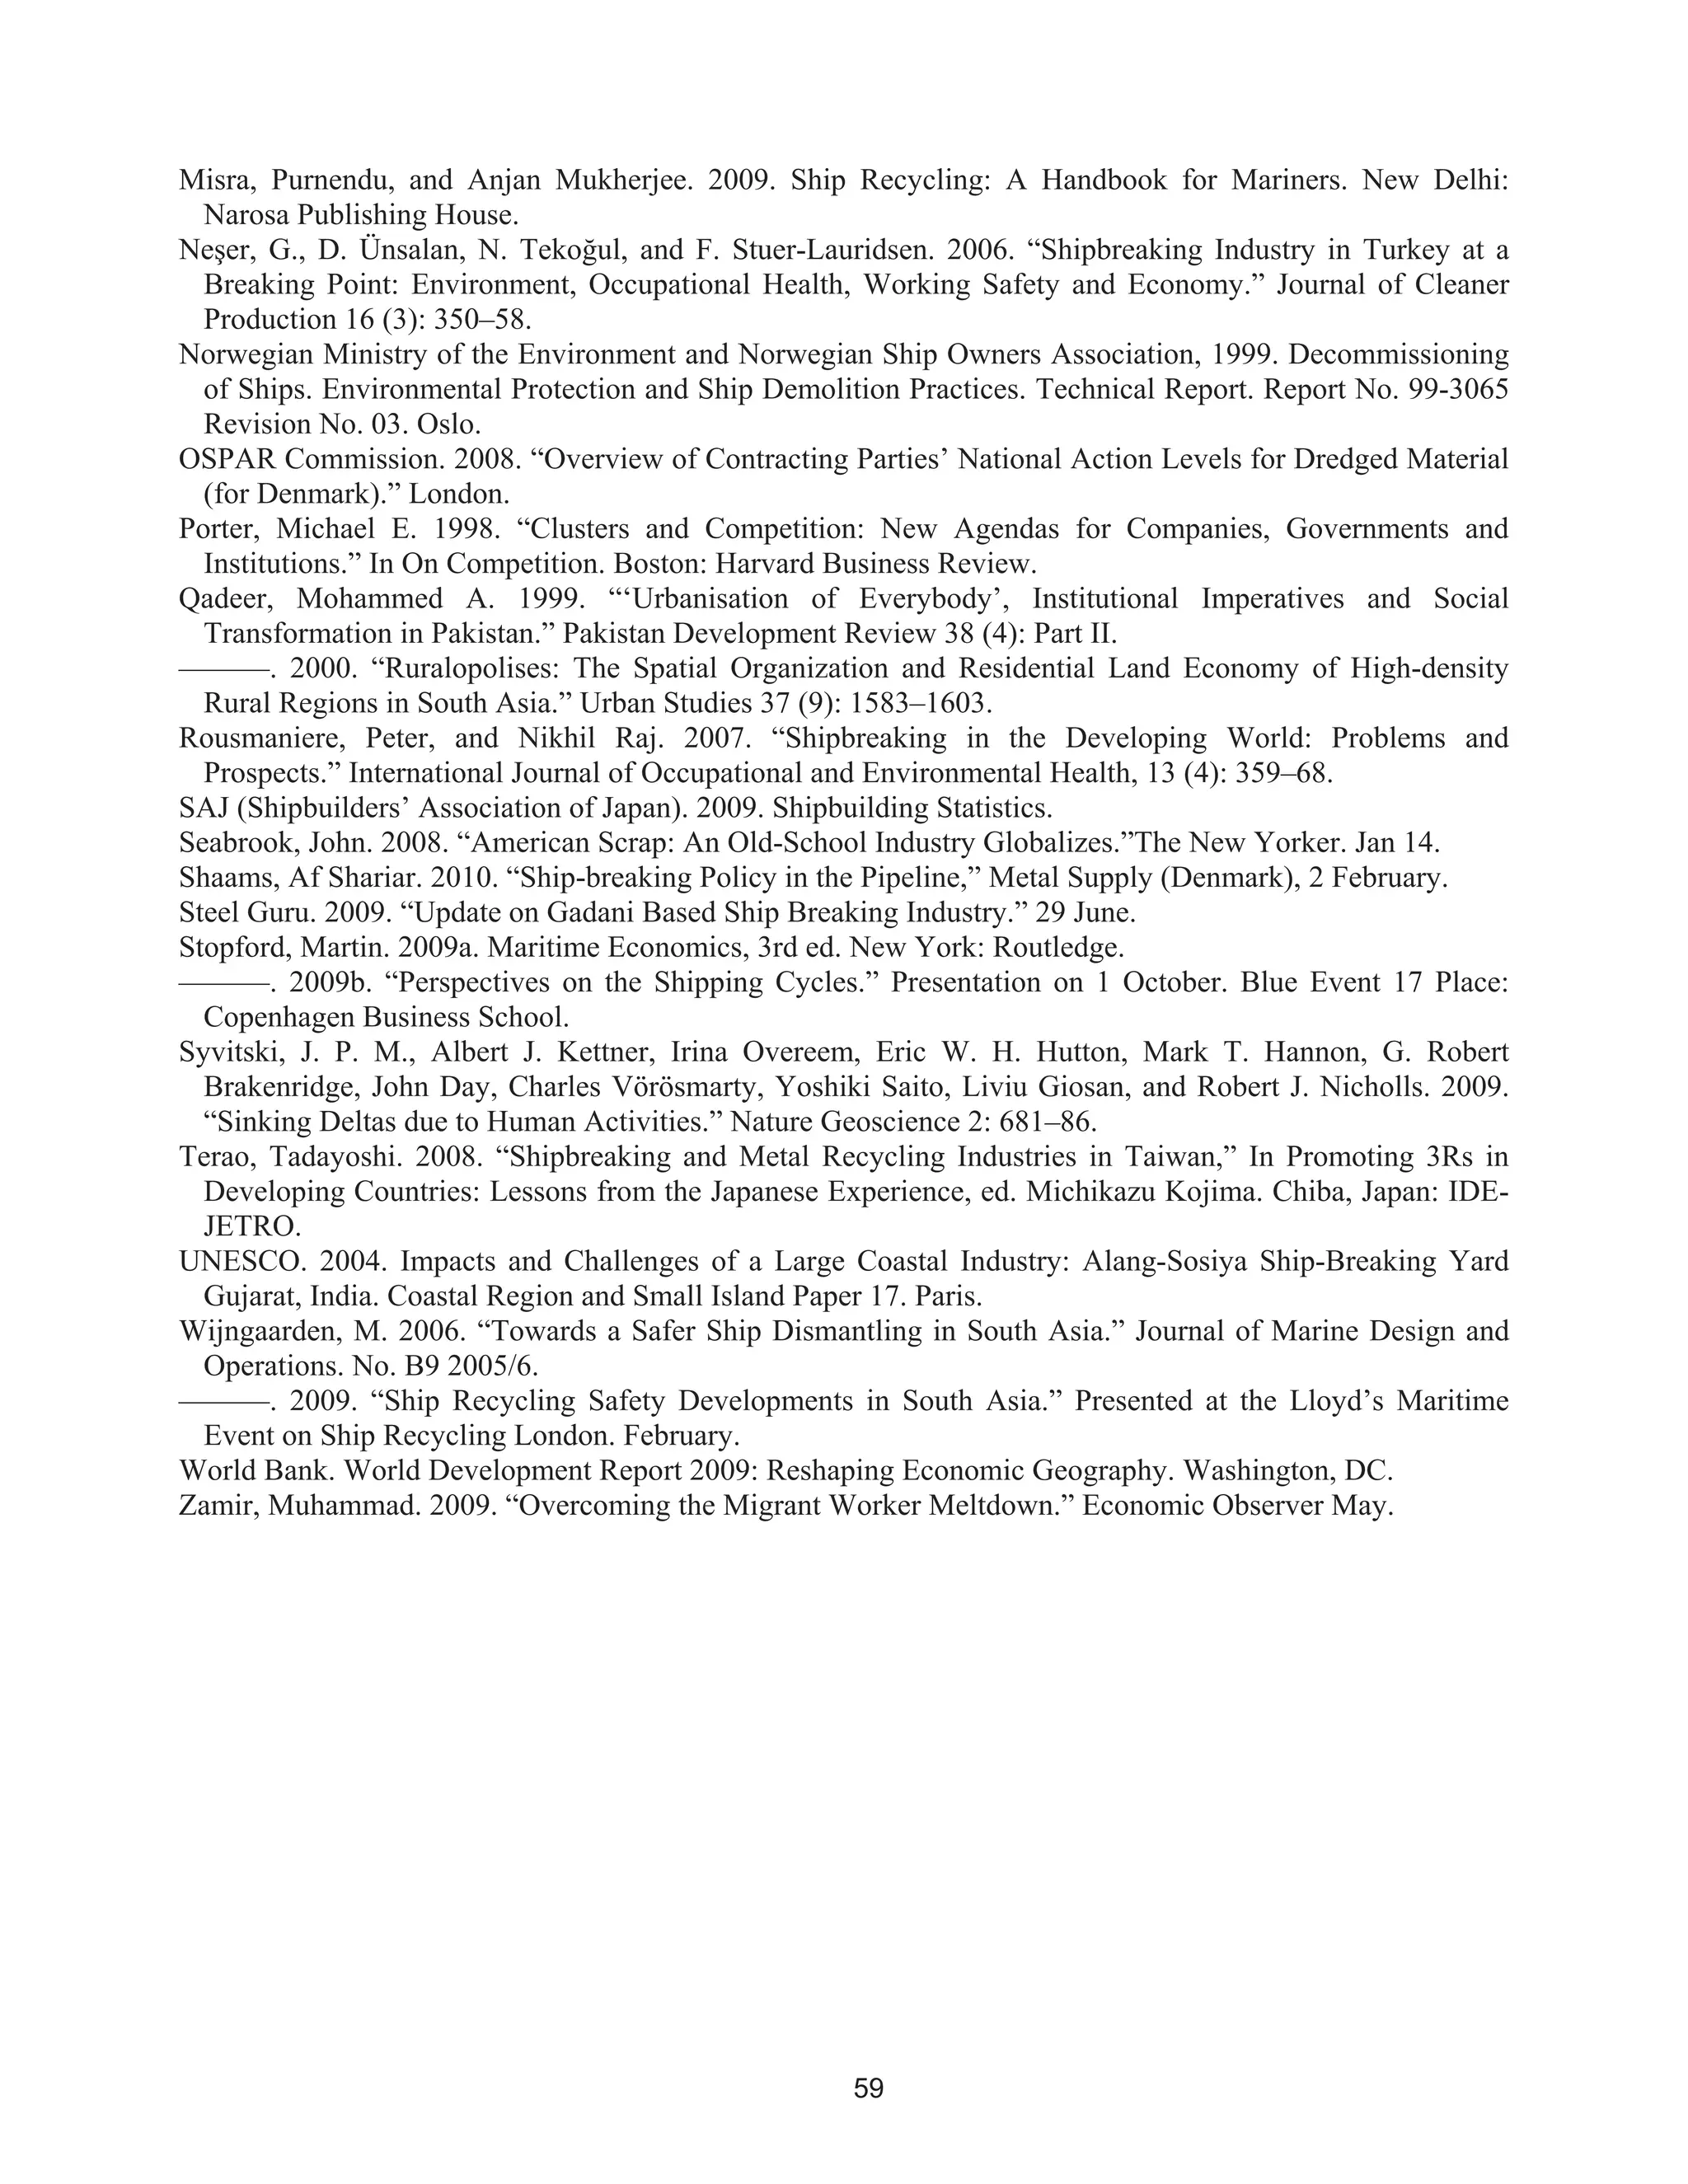
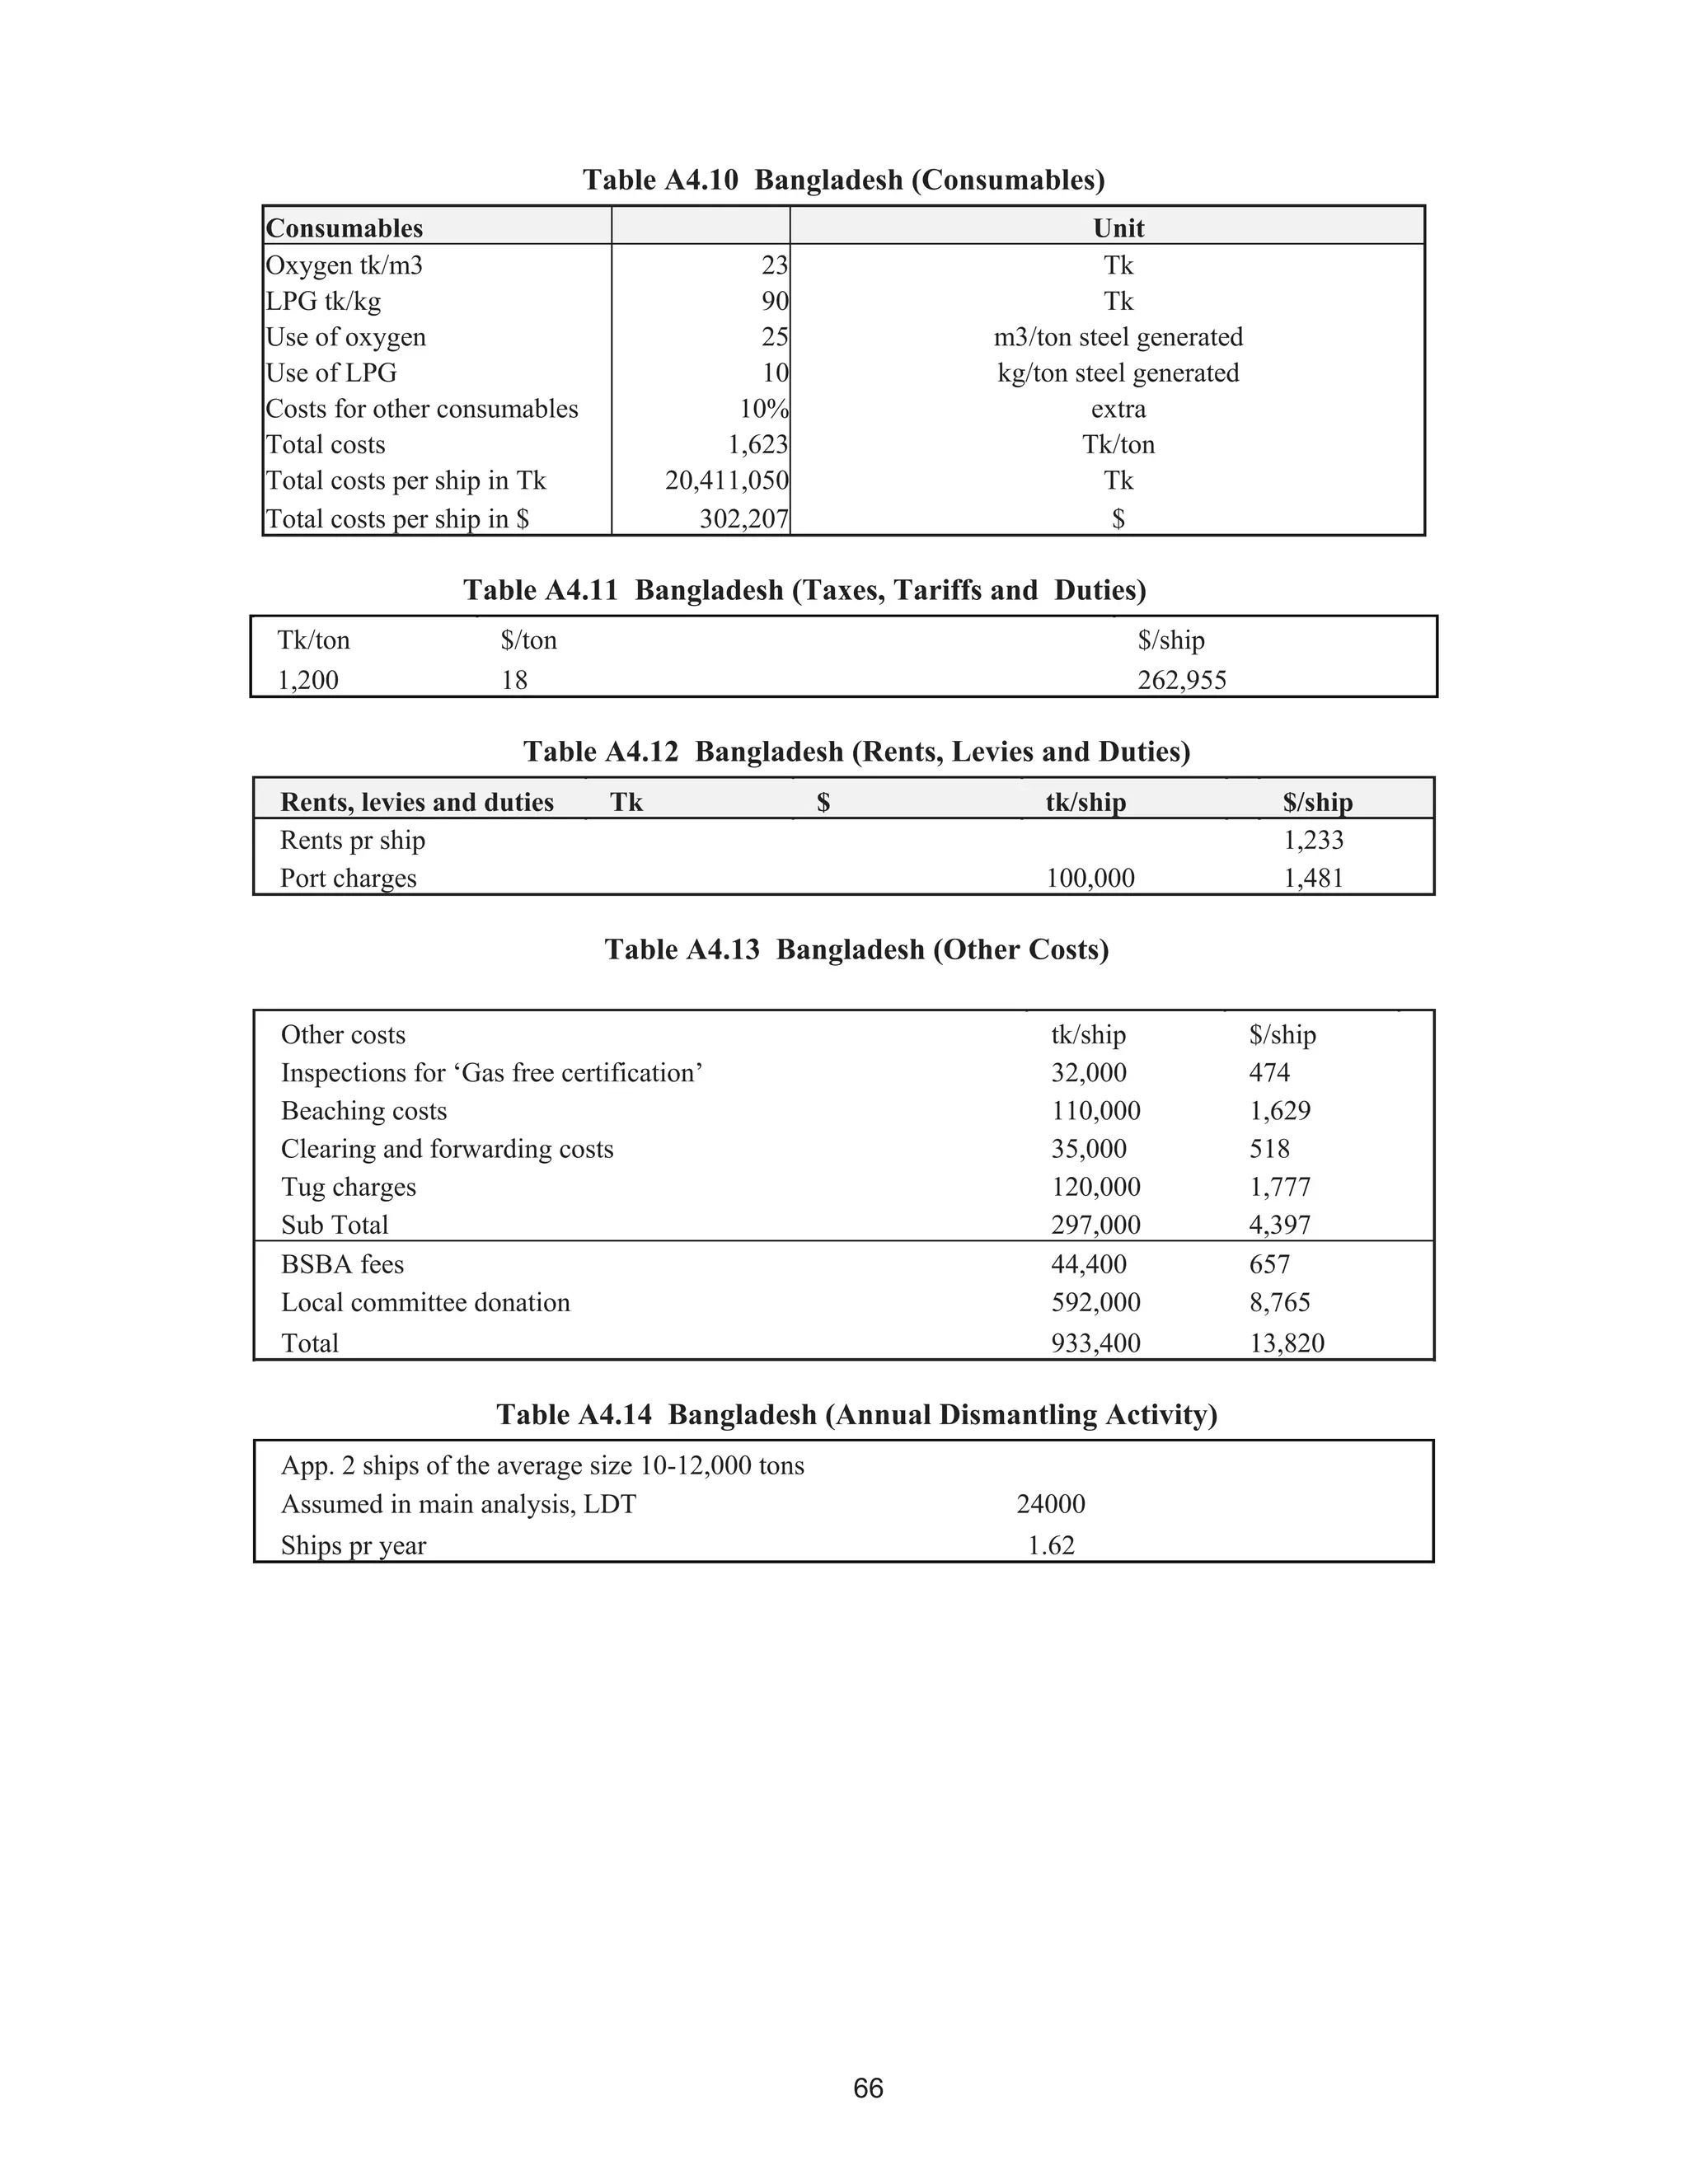
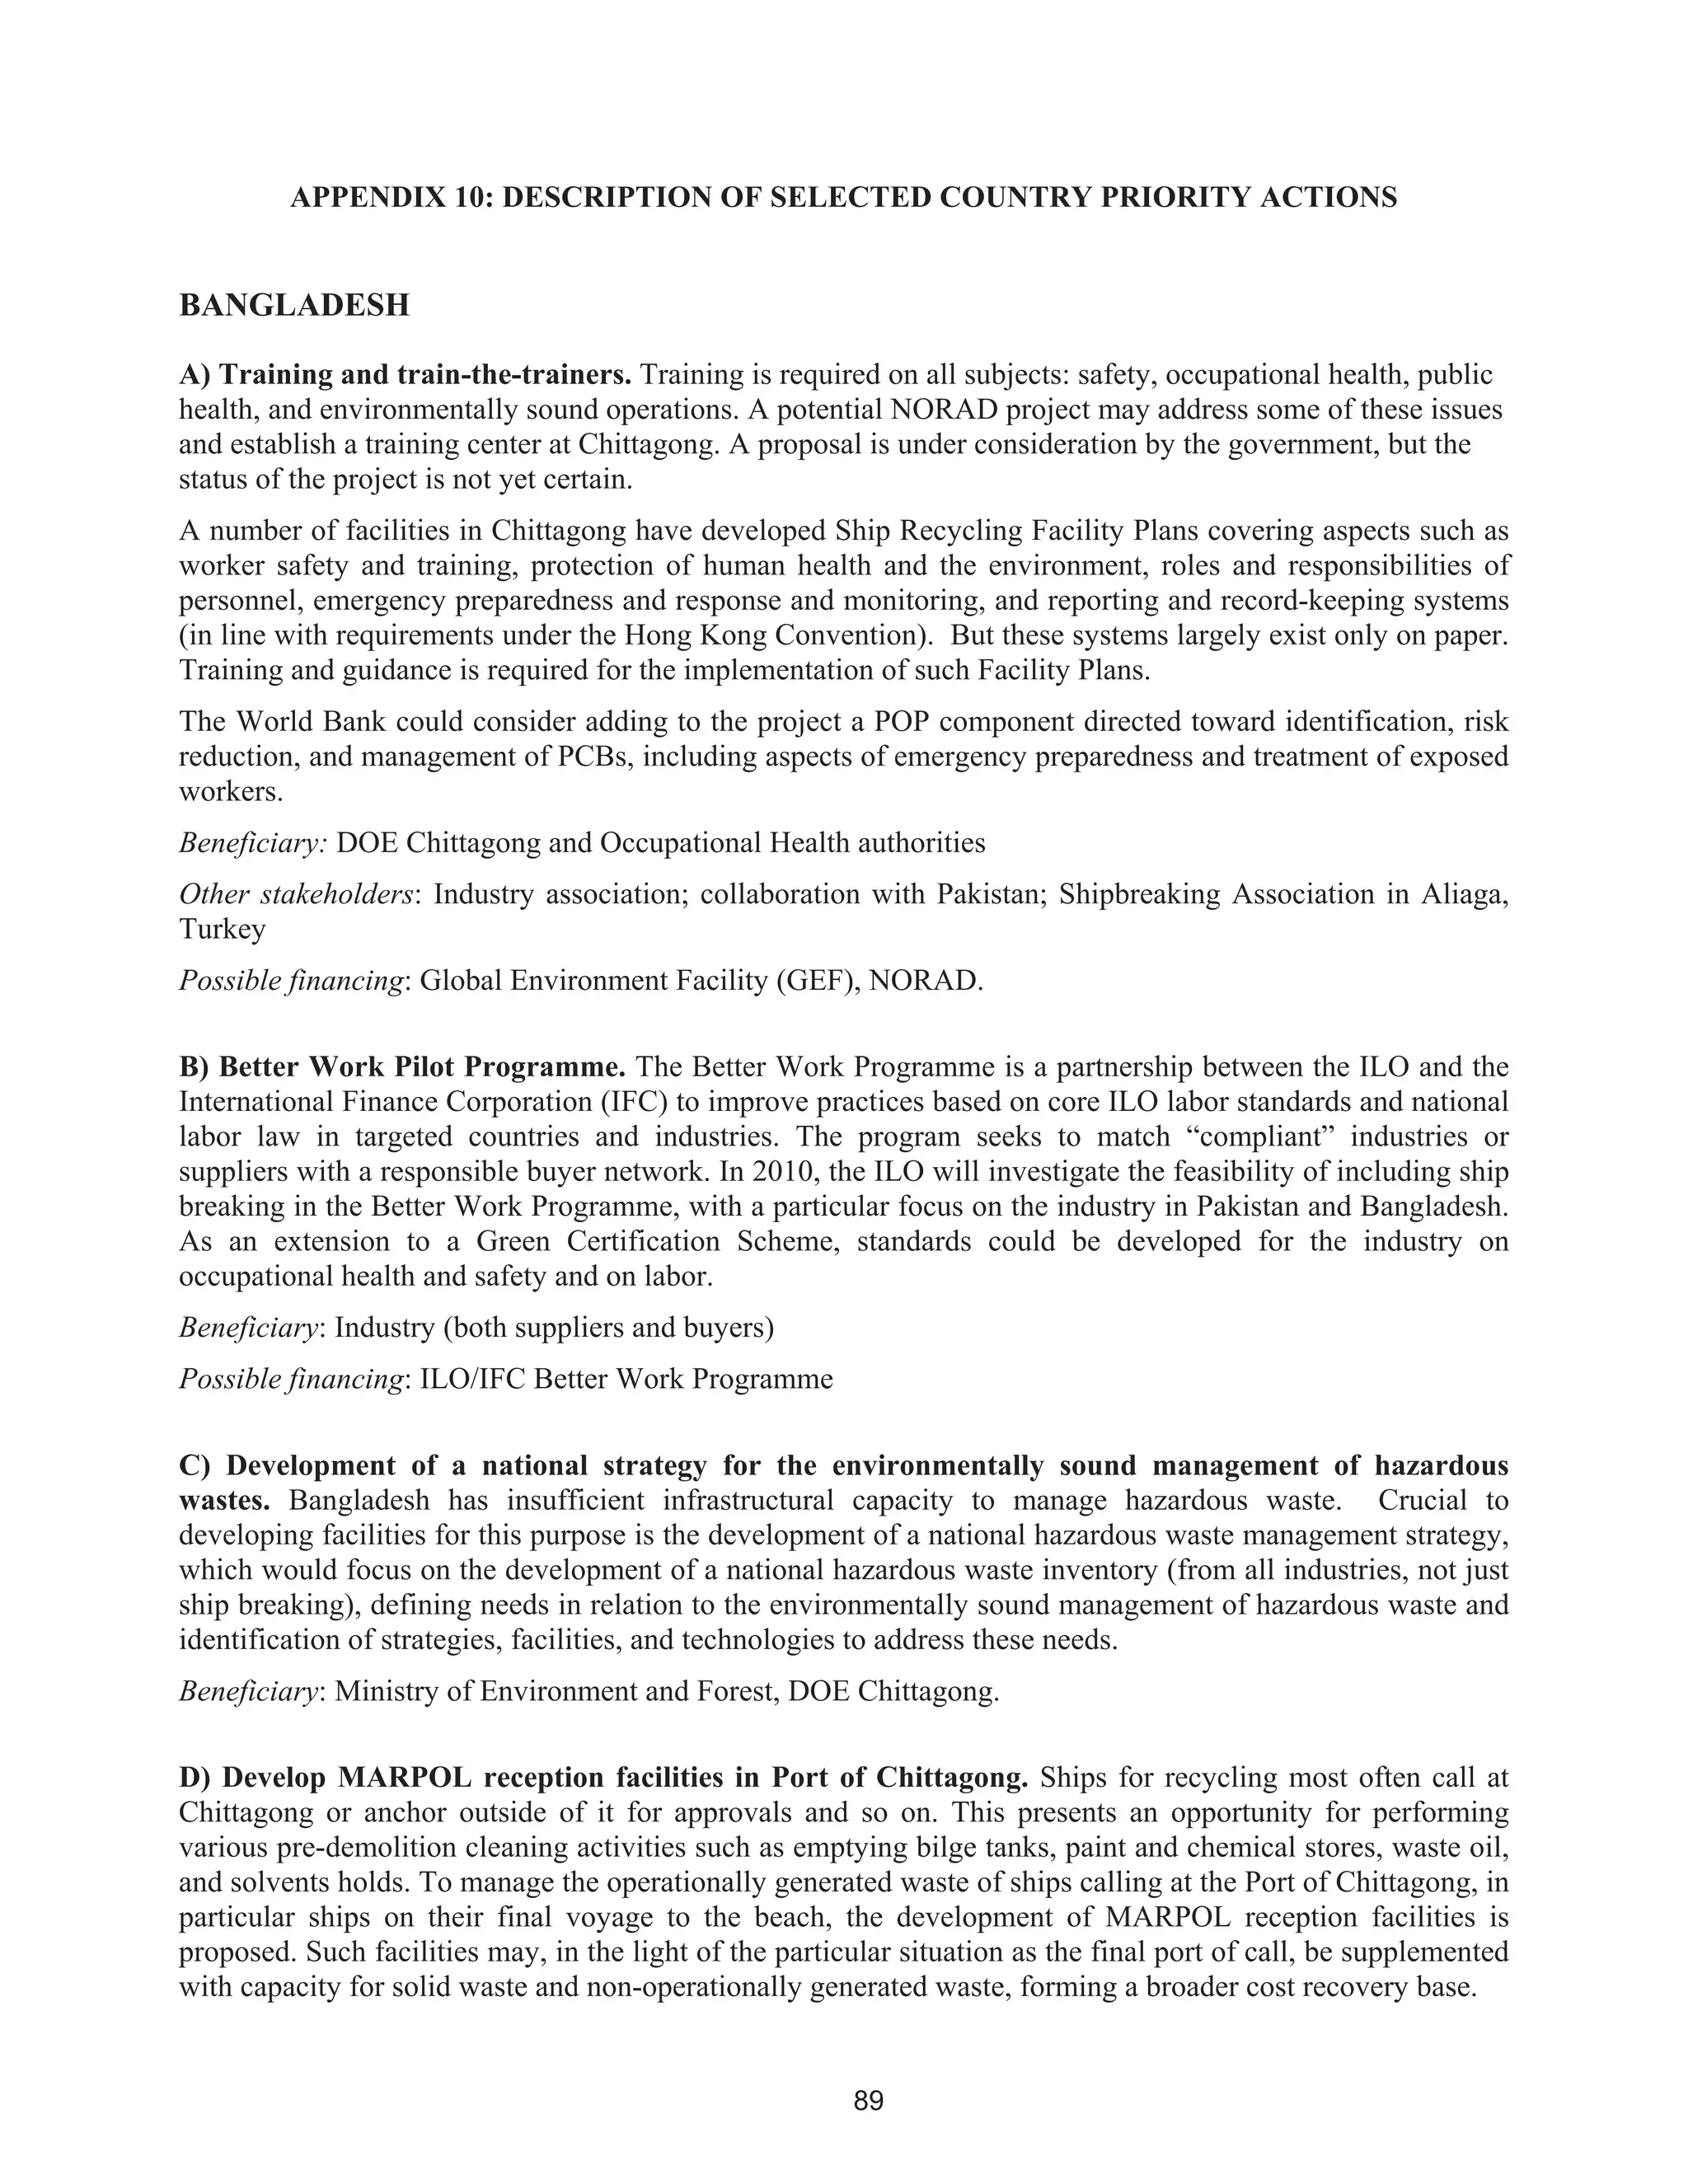
APPENDIX5:SHIPAUDITS
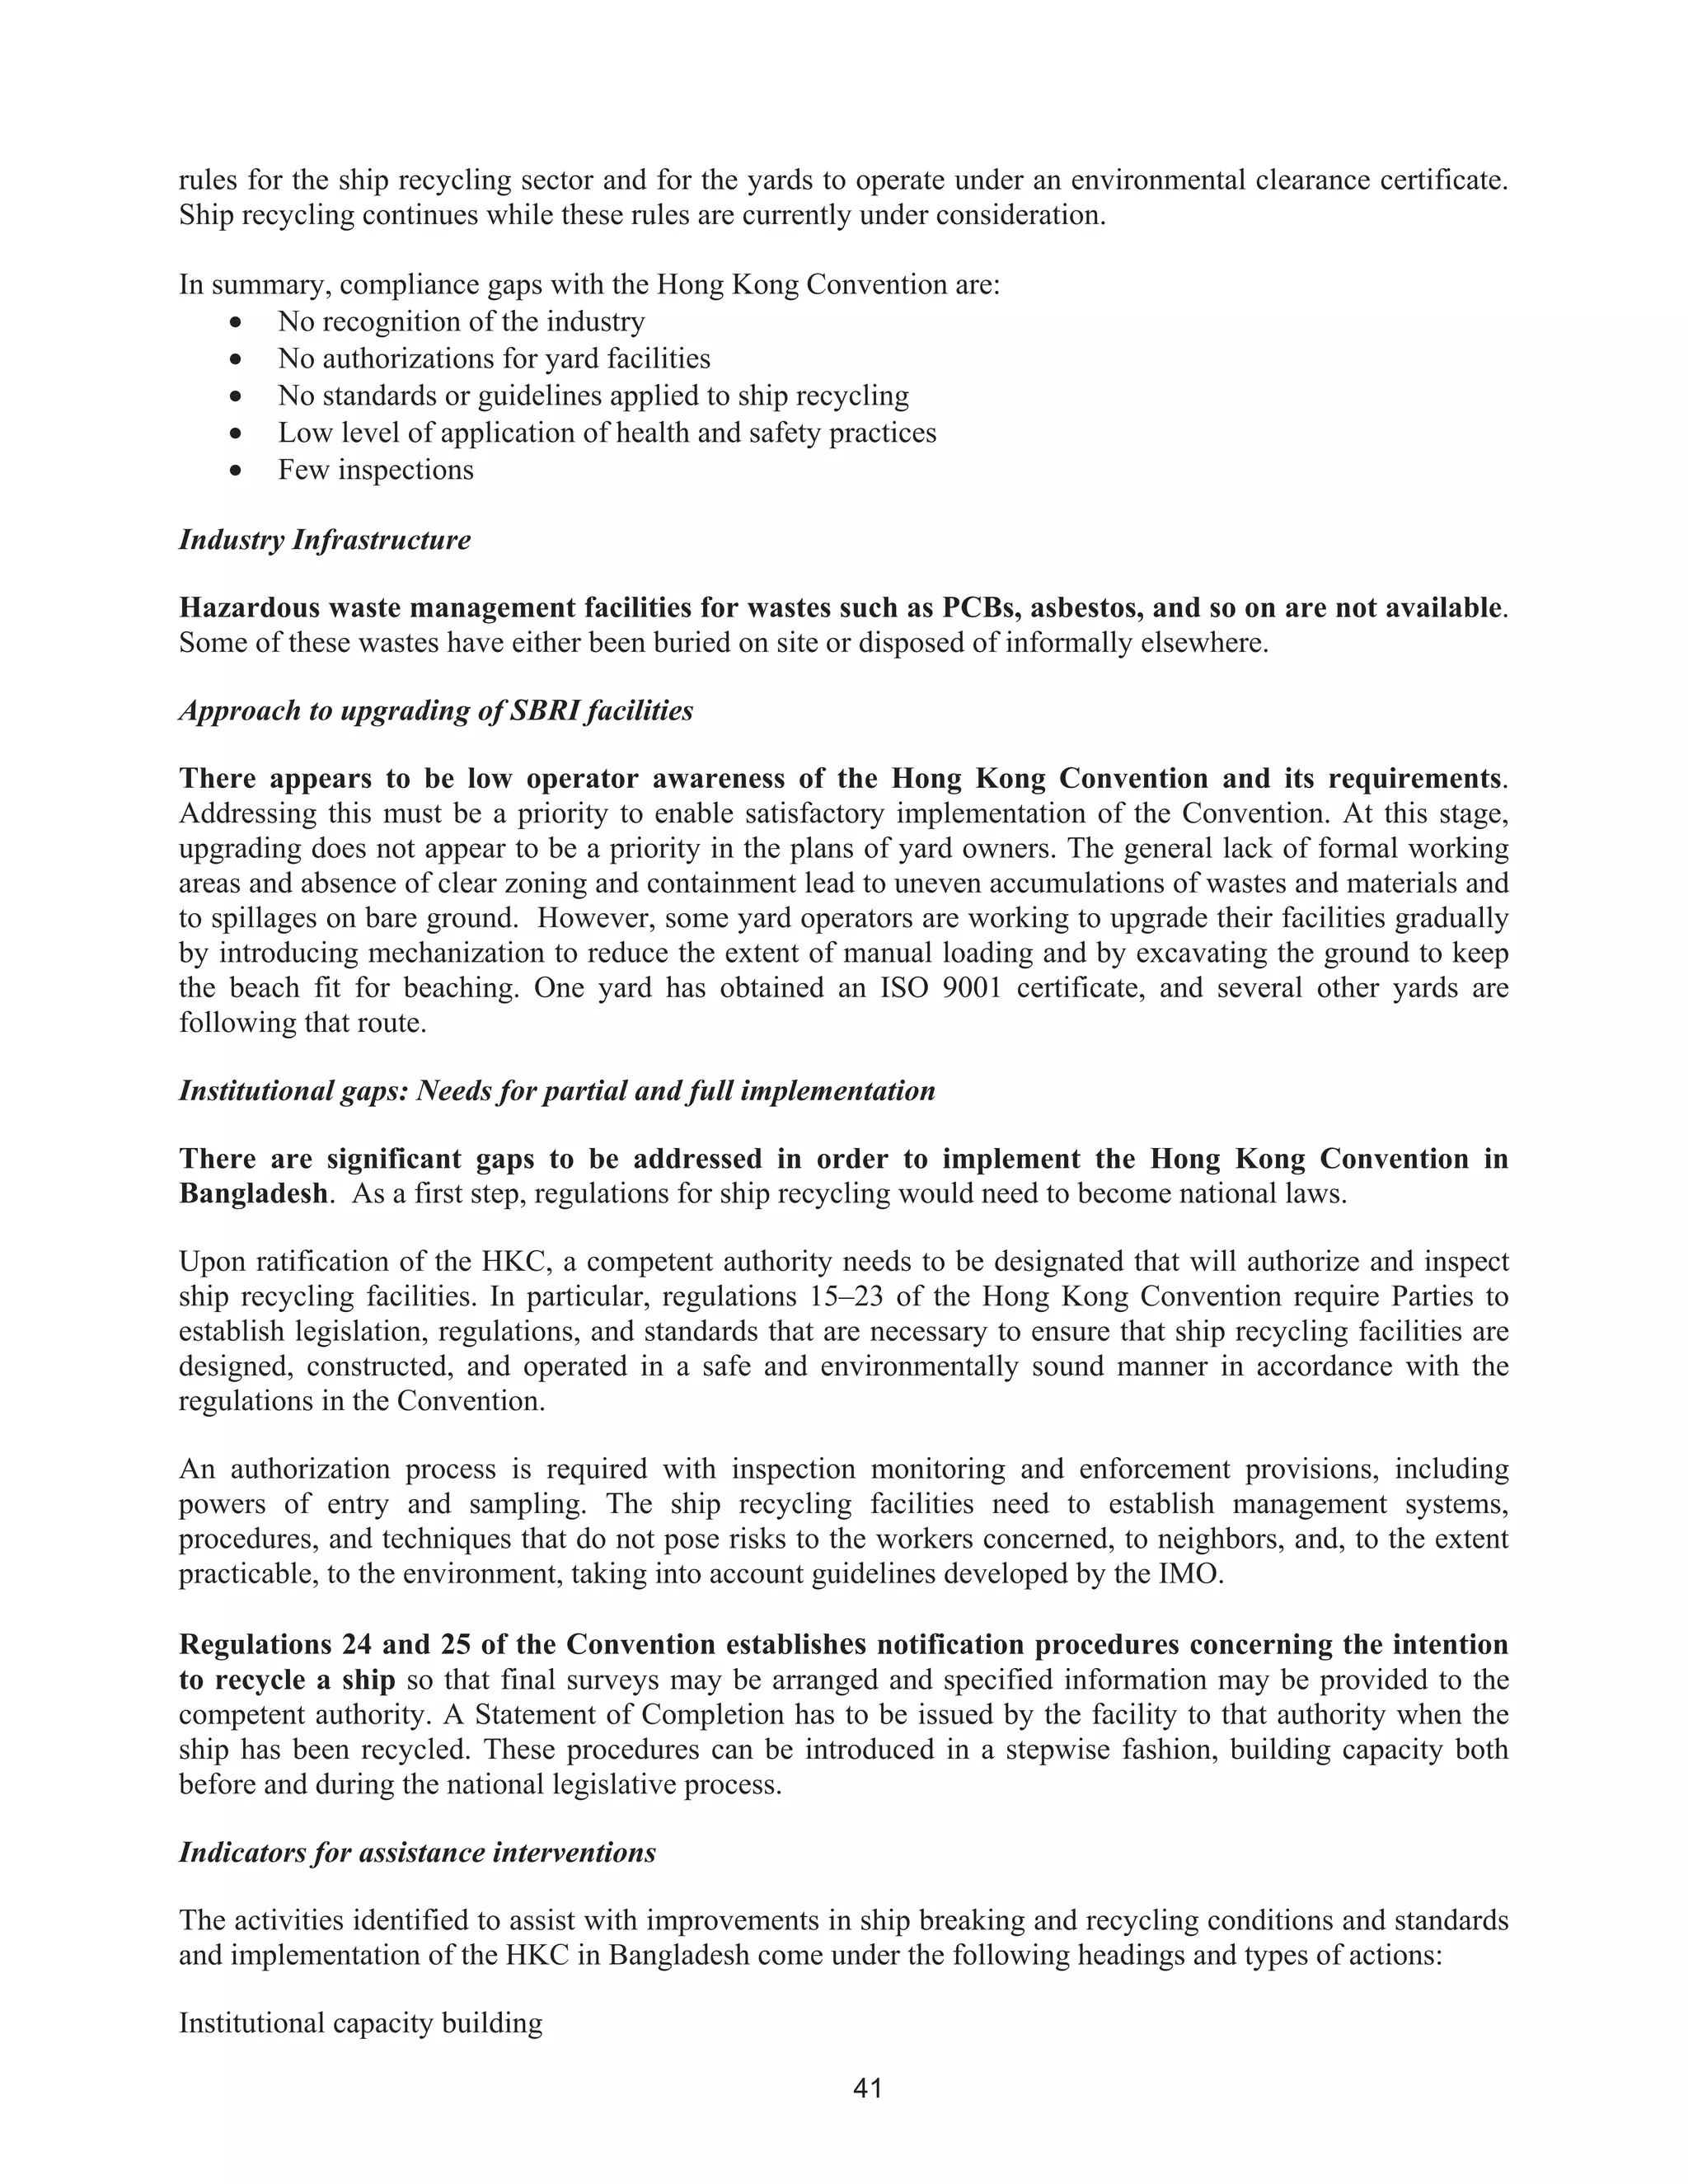
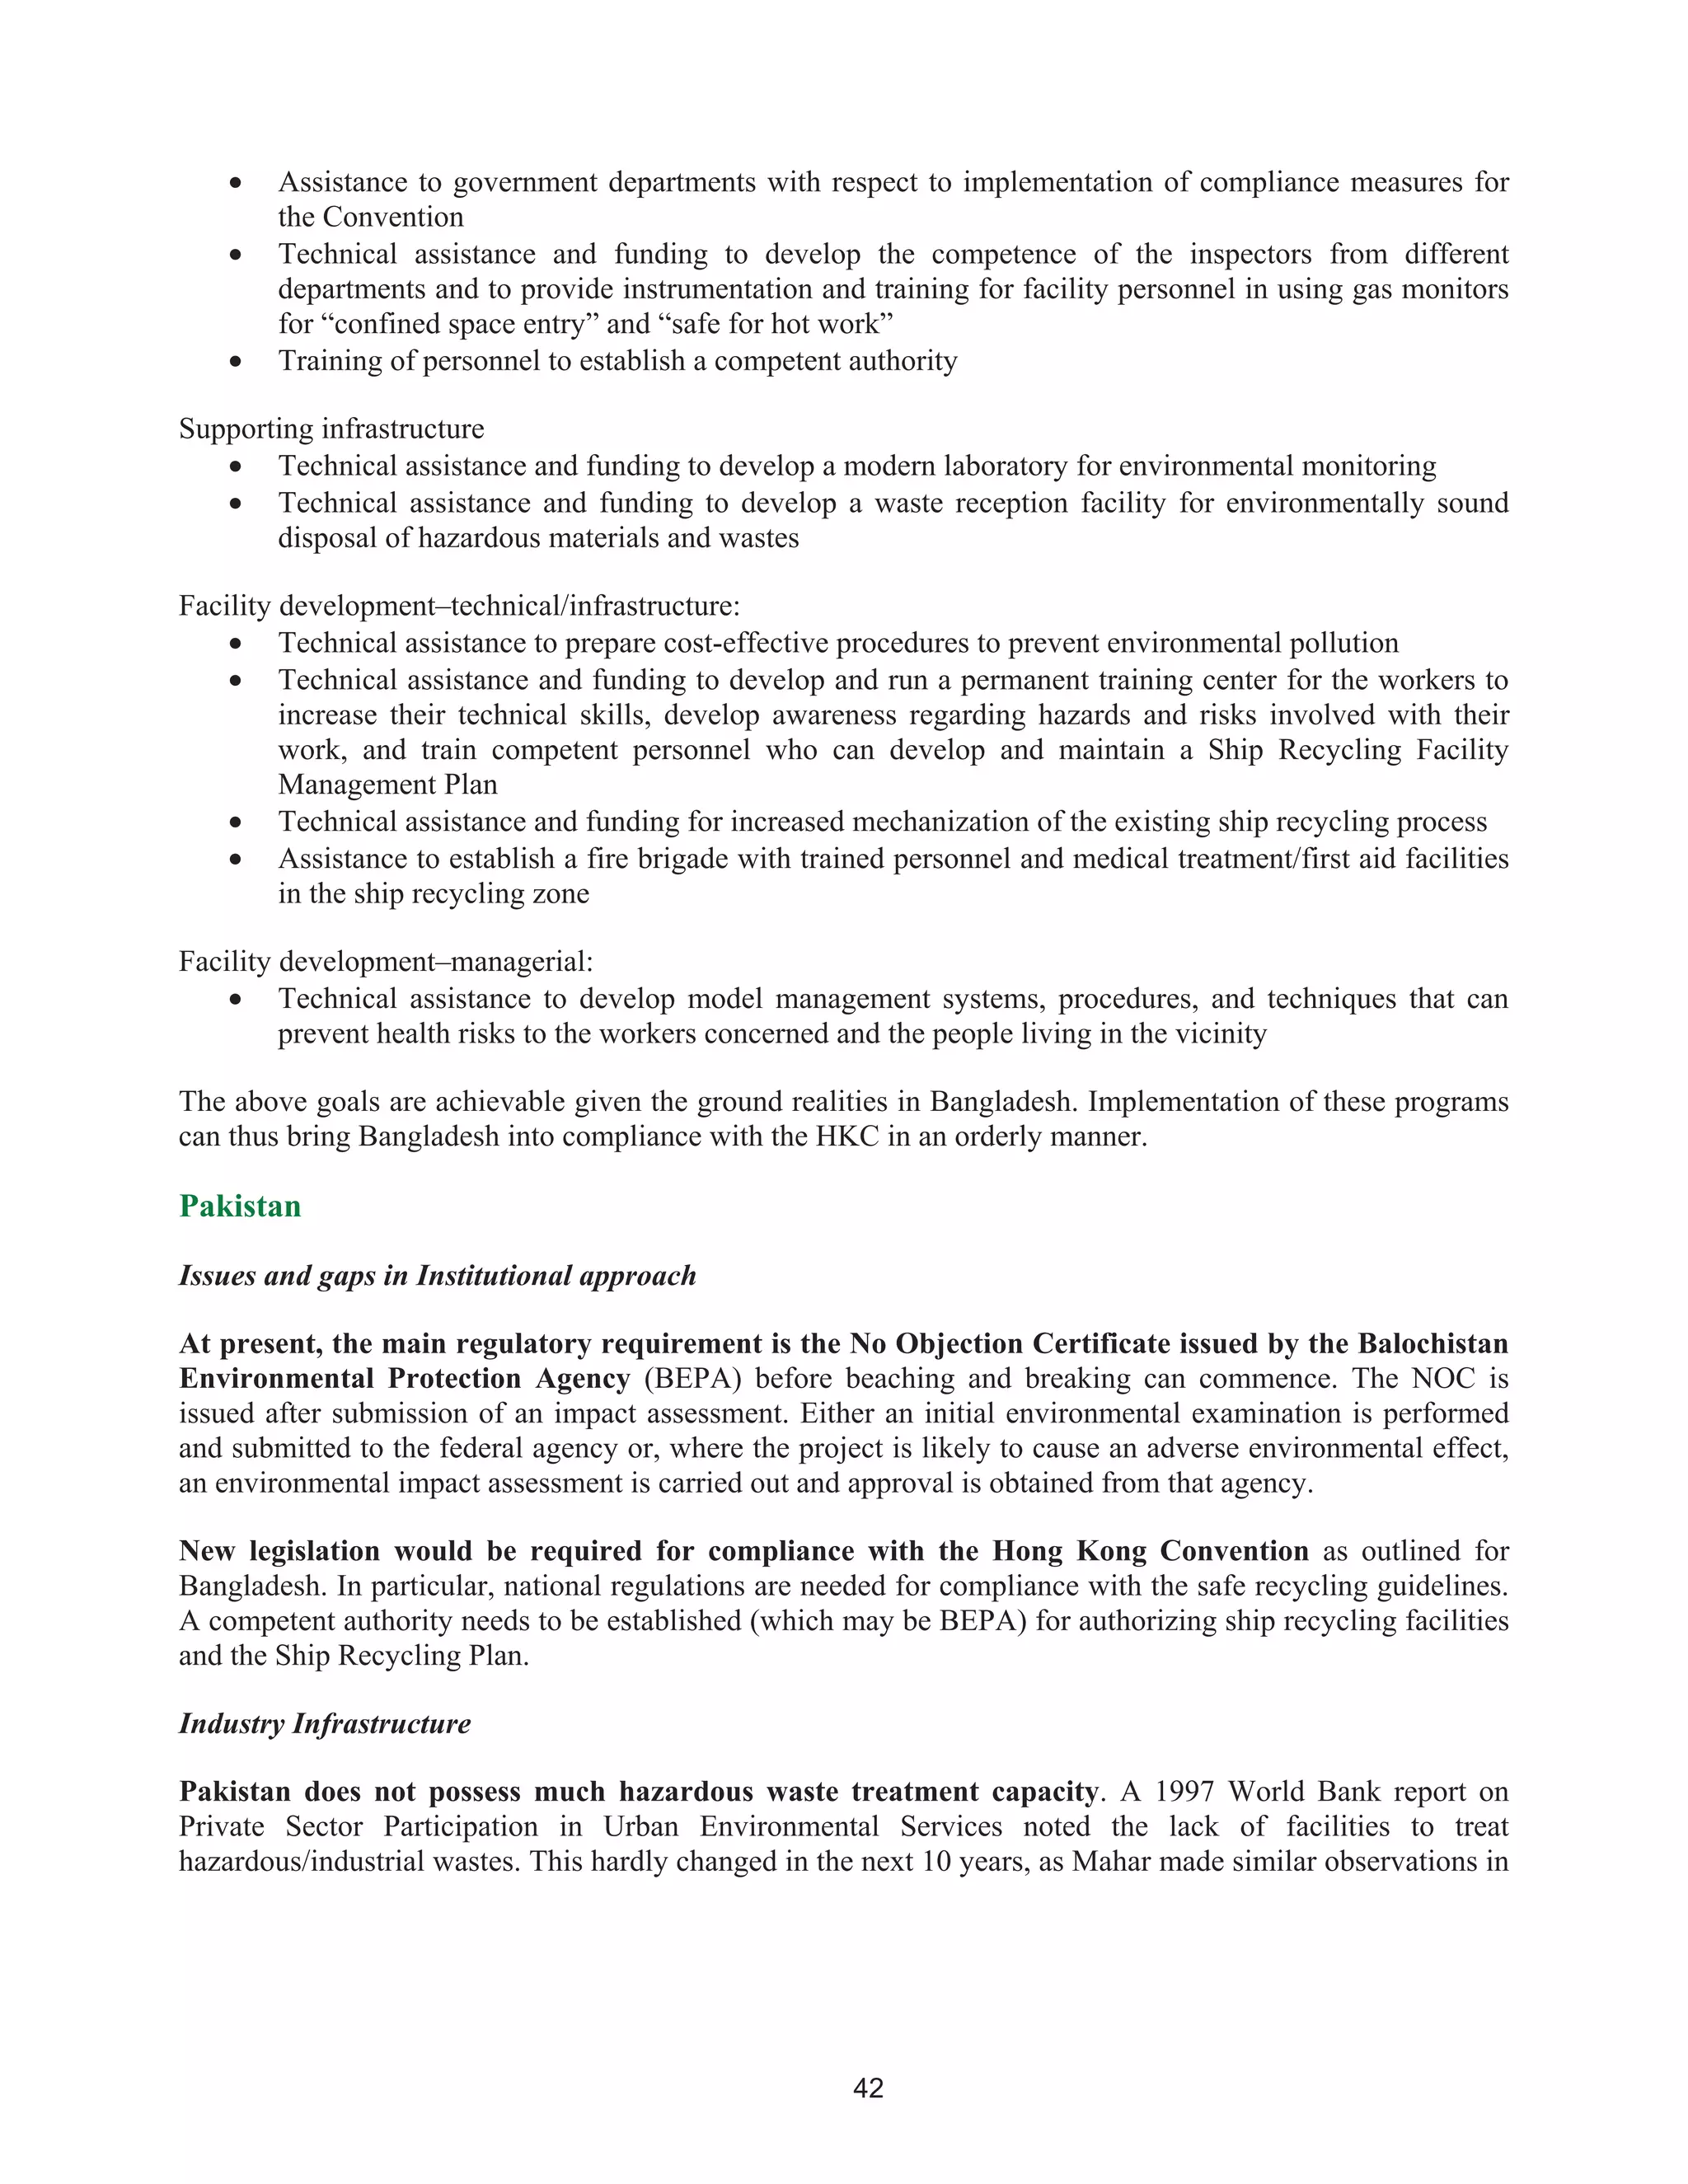
TABLEA5.1MERCHANTFLEET(calculationsareonthebasisofdeclaredhazardousmaterialsfromthefollowingnumberandtypesofships:
onecontainership,fourro-ros,fiveoiltankers,threechemicaltankers,andonenon-cargoship)
MerchantFleet-MeanTotal
HazardousMaterialUnit
Material
Total
1000
GT
total
Material/
millionGT
Rangeof
Shipsize
[GT]
Rangeof
material
Rangeof
material/
millionGT
No.
observations
Compiled
fromentry
no.
1
Asbestoston335659509
960-
156,8150.05-150
0.76-
3666.9413/14
2PCB
2.1
PCBliquids(transformers,etc)kg0.004520.00
960-
156,815NorangeNorange8/14
2.2
PCBssolids(capacitors,ballasts,
etc)kg0.352081.66
51,071-
156,8150.300-0.0450.29-5.872/14
3
Hydraulicoilton18158113
960-
156,8152.22-16.0
99.86-
2312.52/14
4ODS
4.1
ODSliquids(CFC,Halons,etc)ton2.523507
960-
156,8150.16-0.915.29-167.086/14
4.2
ODSsolids(e.gPU)ton3031731753
35,431-
51,0710.03-300
0.75-
8467.064/14
5Paints
5.1Paintsnoinfoton65157415norangenorangenorange1/14
5.2
Paintscont.TBTton430514
960-
156,8150.00-2.987.65-66.255/14
5.3Paintscont.PCBtonNoinformationavailable
5.4Paintscont.MetalstonNoinformationavailable
6Heavymetals
6.2Cadmiumton
0.301581.90
960-
156,8150.0002-0.30.21-1.912/14
6.4Mercurykg
16.2337143.75
960-
156,8150-50-146.066/14
7RadioactivesubstanceskgNoinformationavailable
8
Wasteliquidsorganicm319233405654
960-
156,8150.056-1820
1.25-
11,606.057/288.1-8.2](https://image.slidesharecdn.com/shipbreaking-myanmar-2014-140611041422-phpapp02/75/Shipbreaking-myanmar-2014-95-2048.jpg)
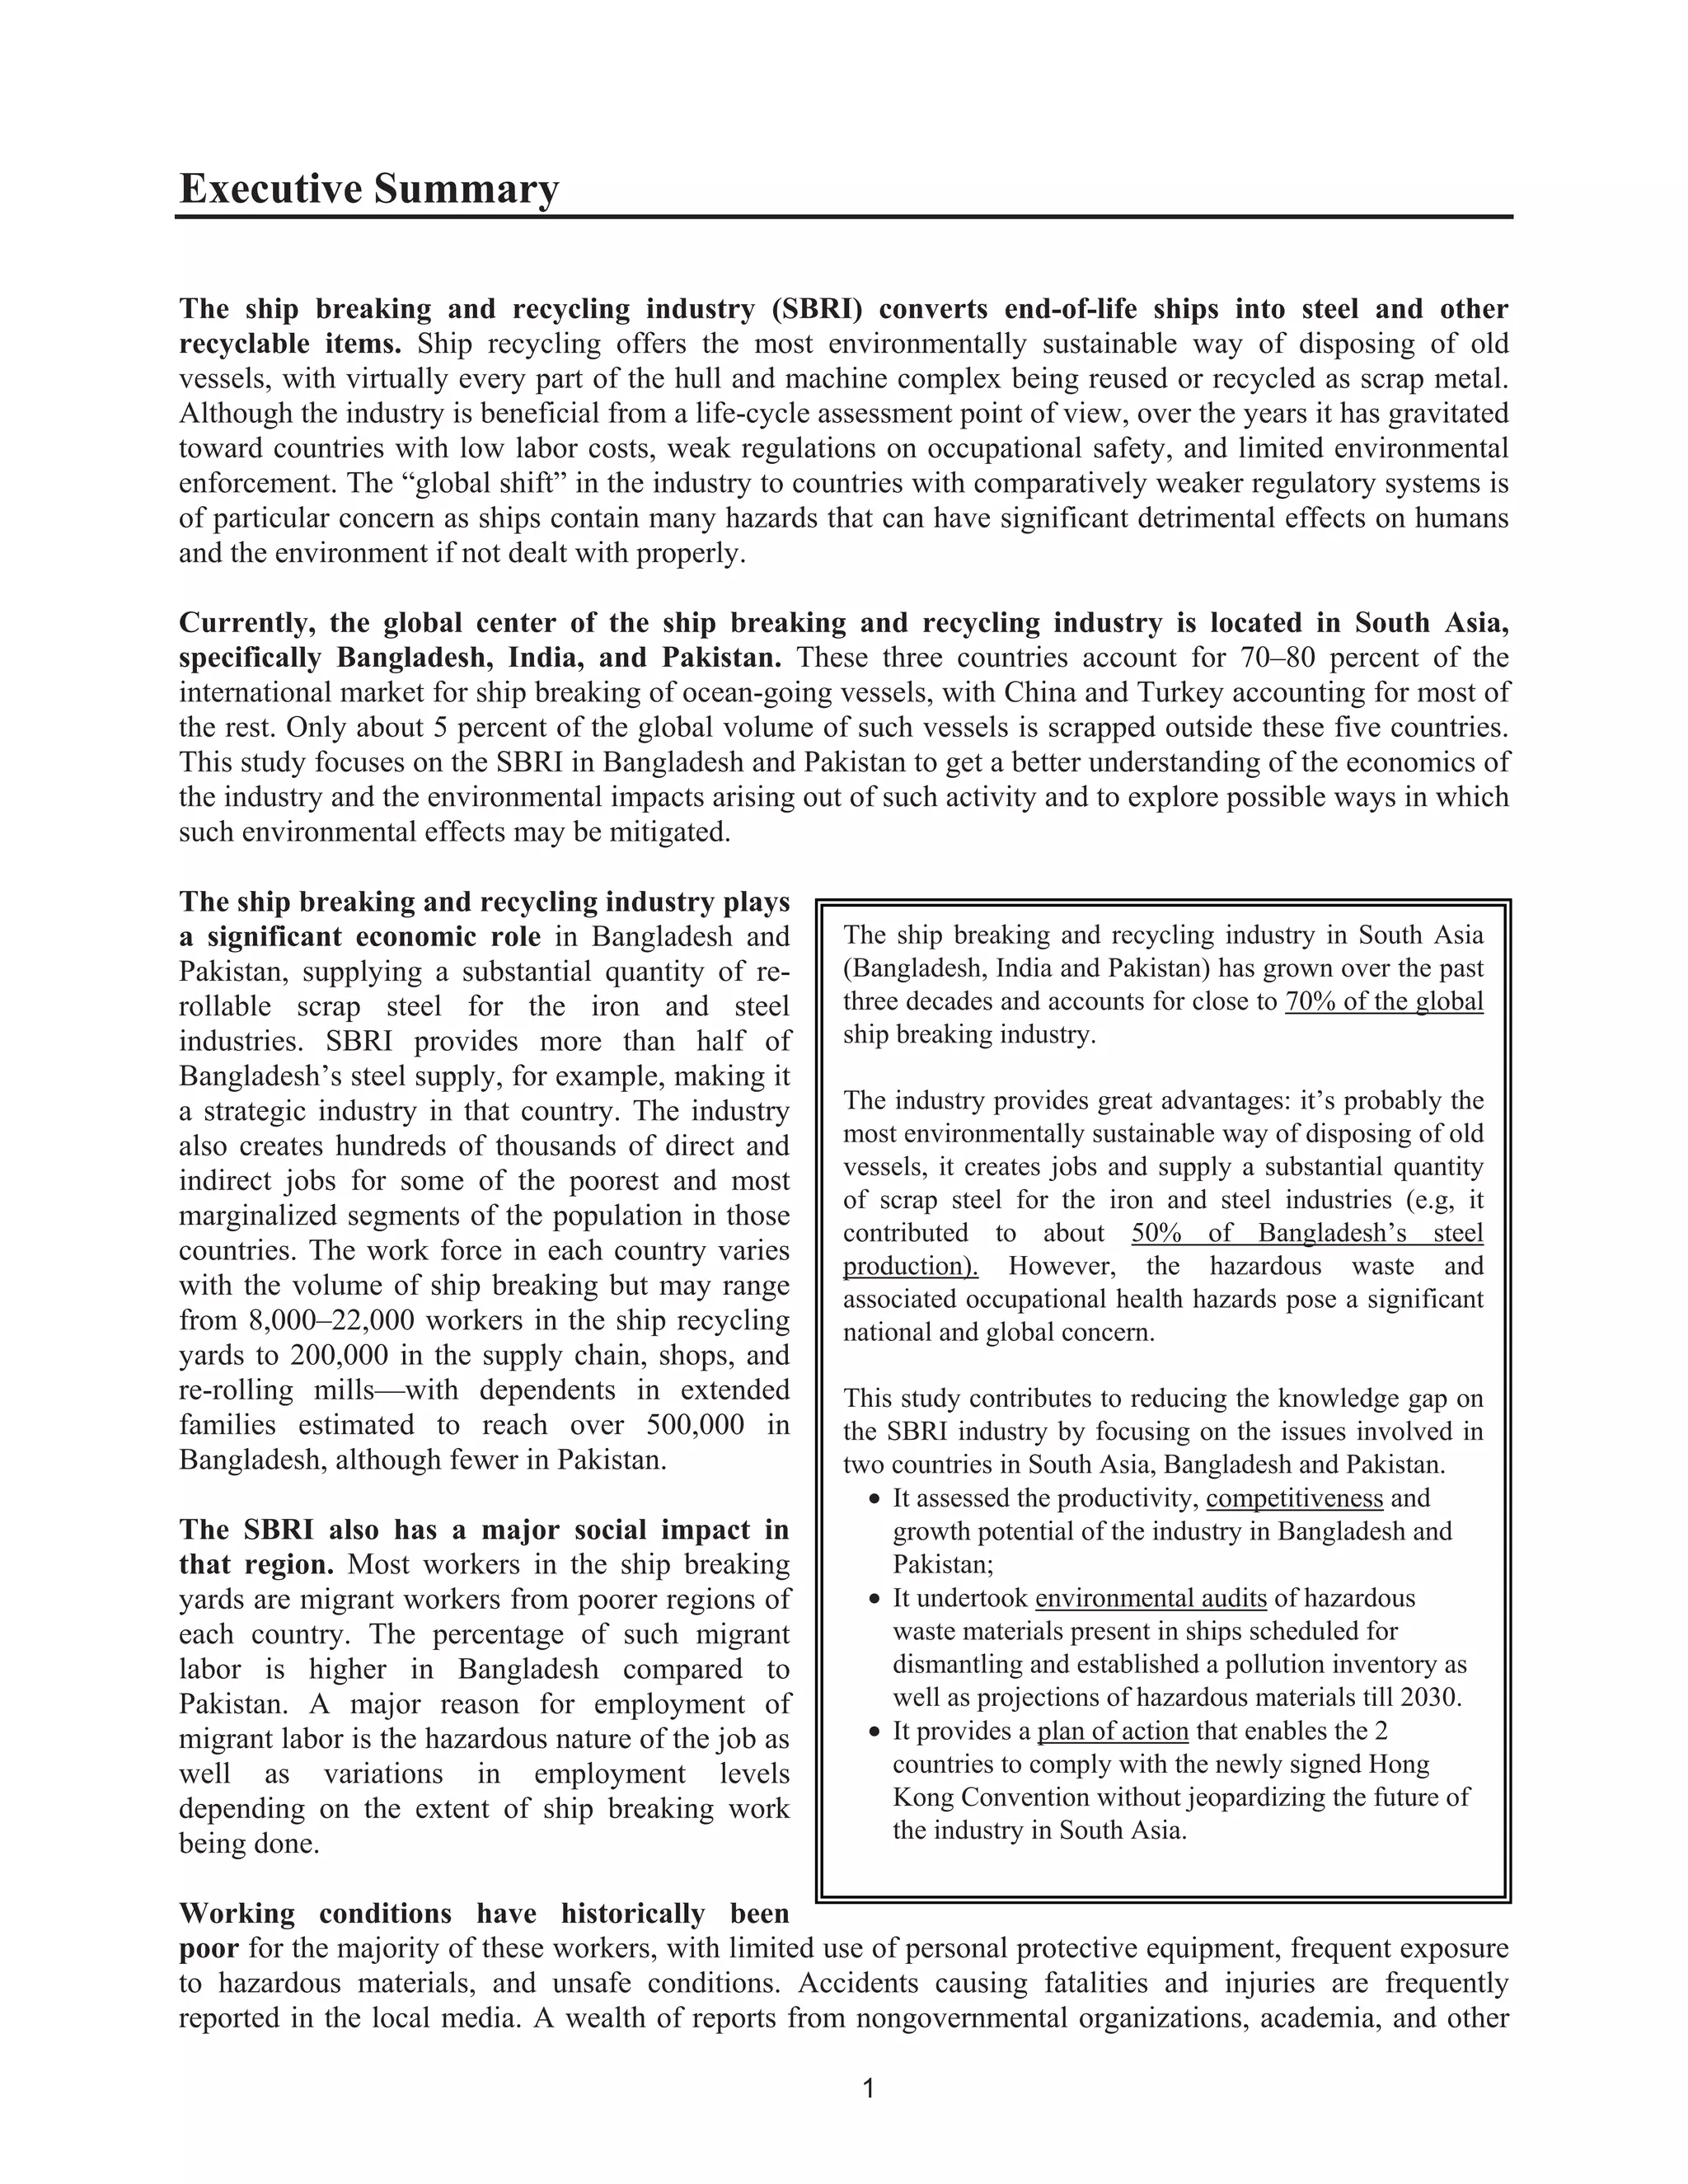
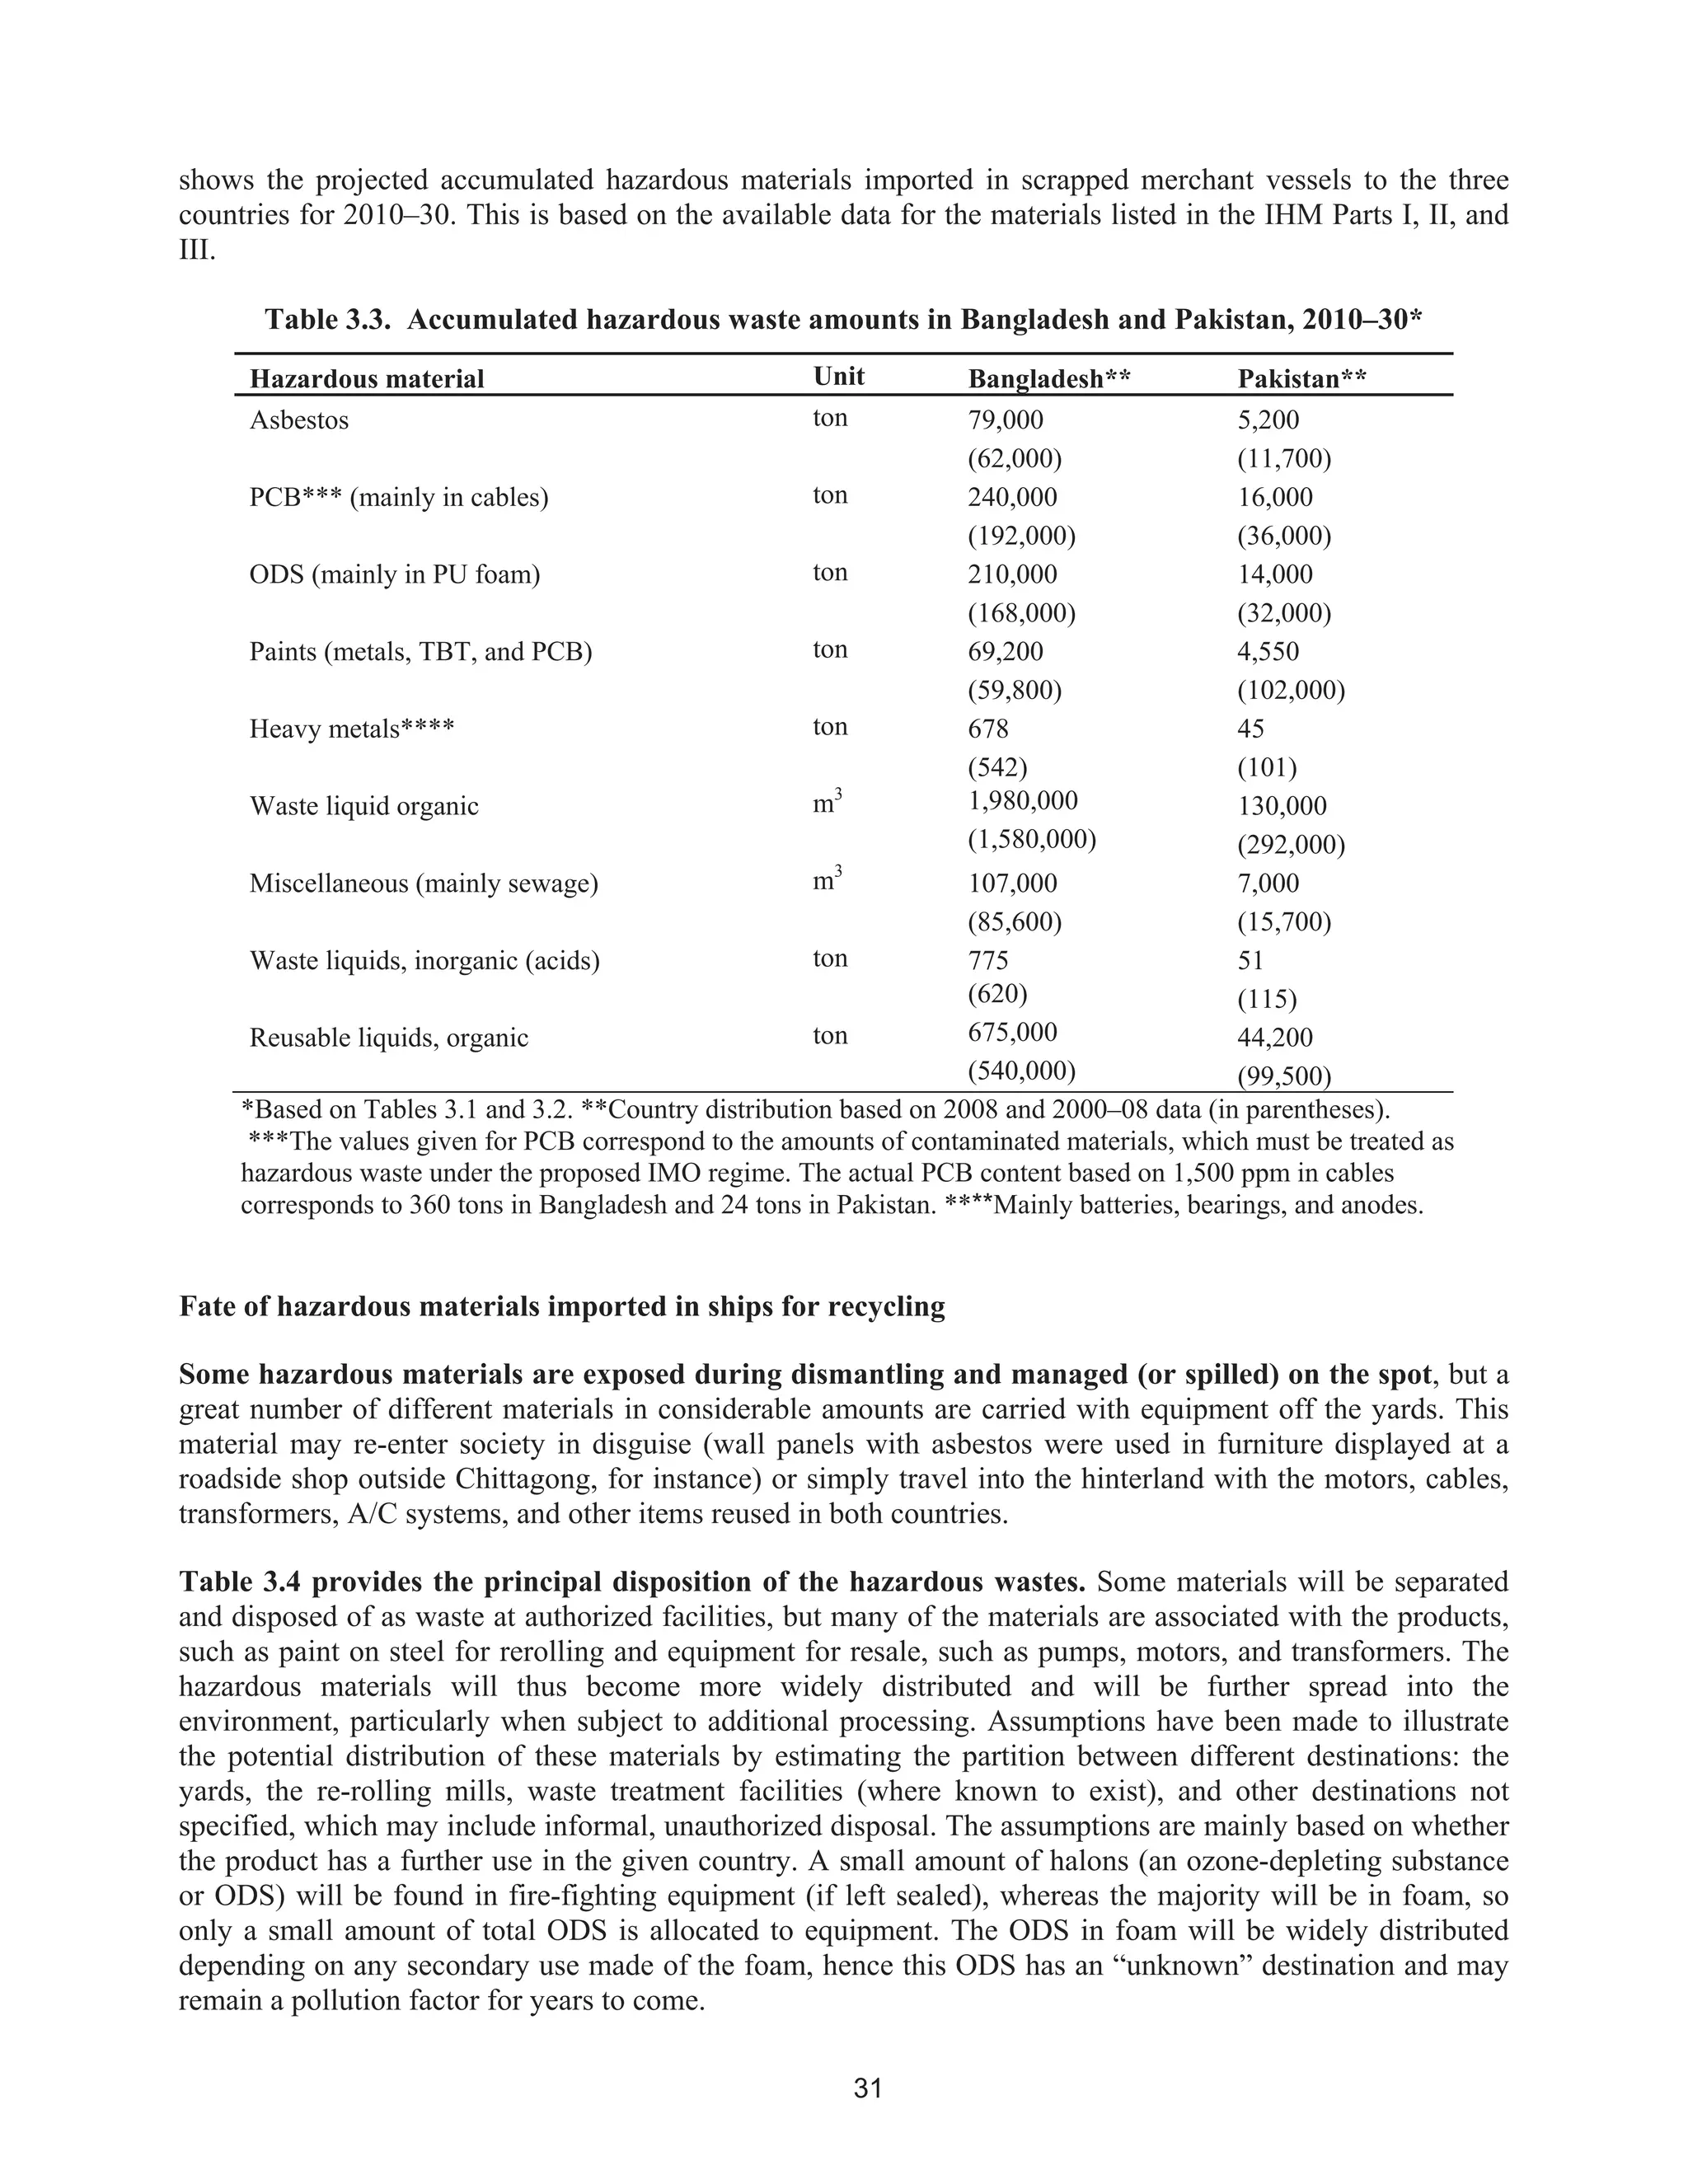
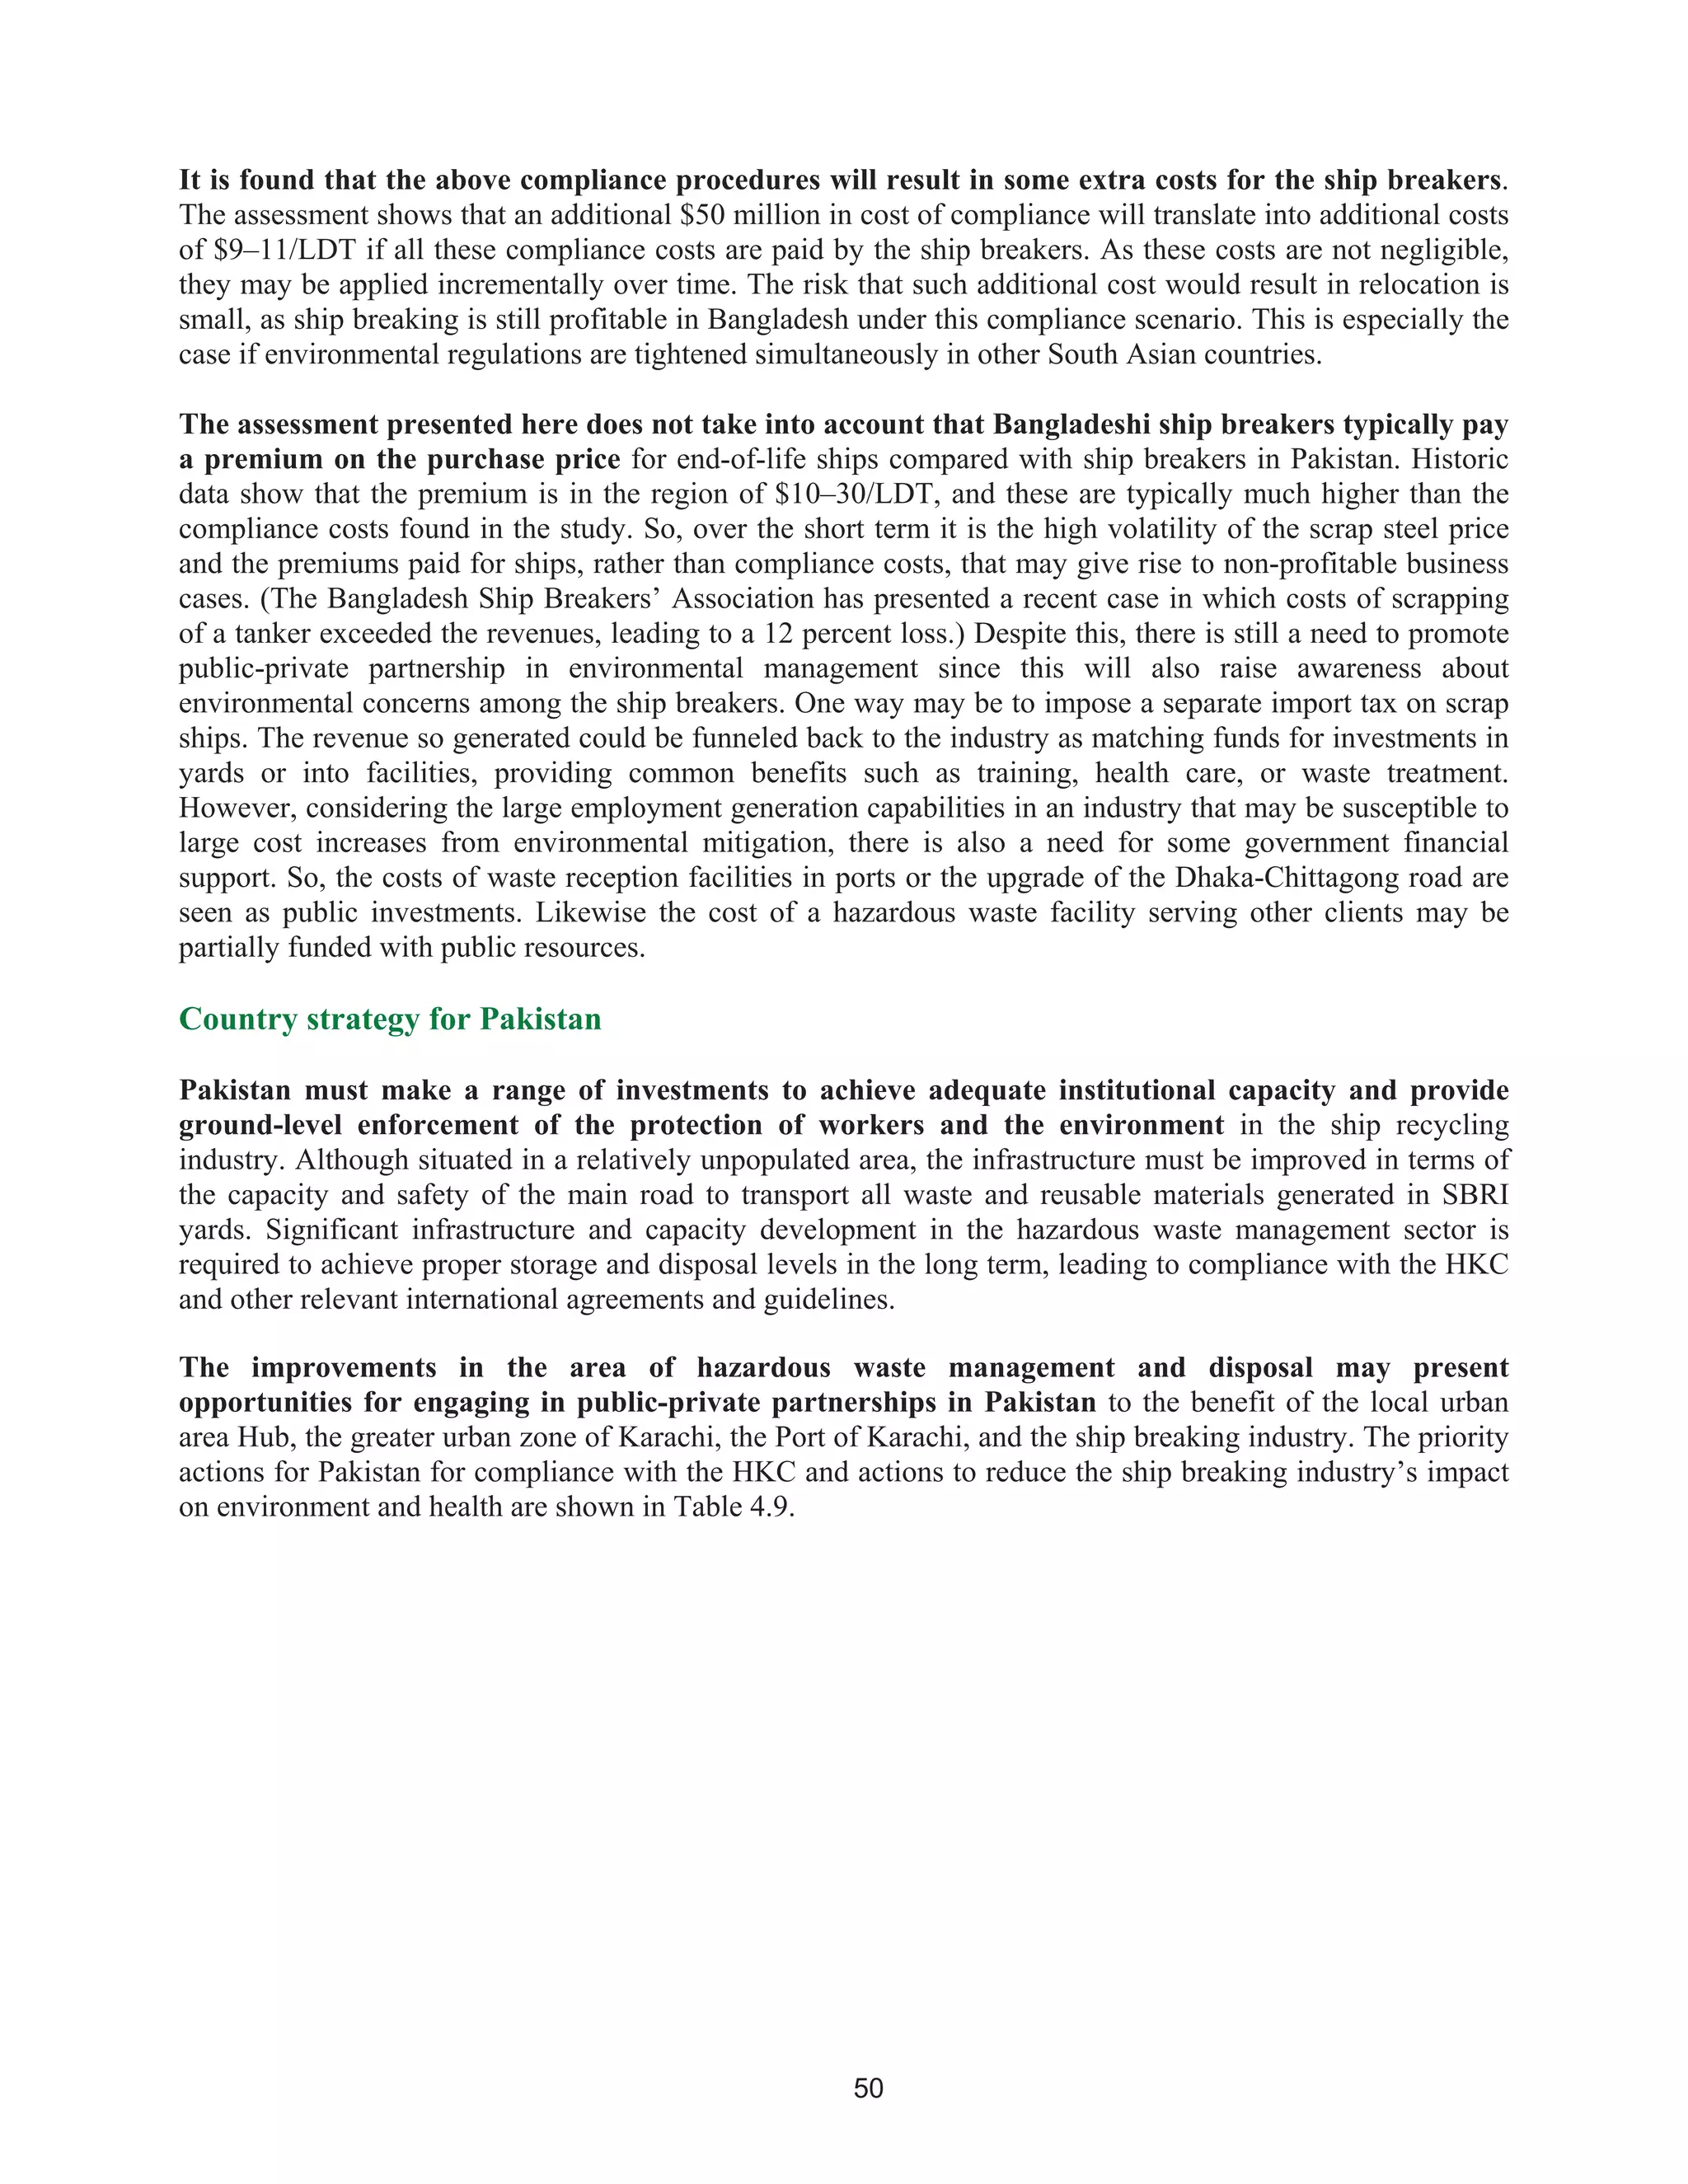
![70
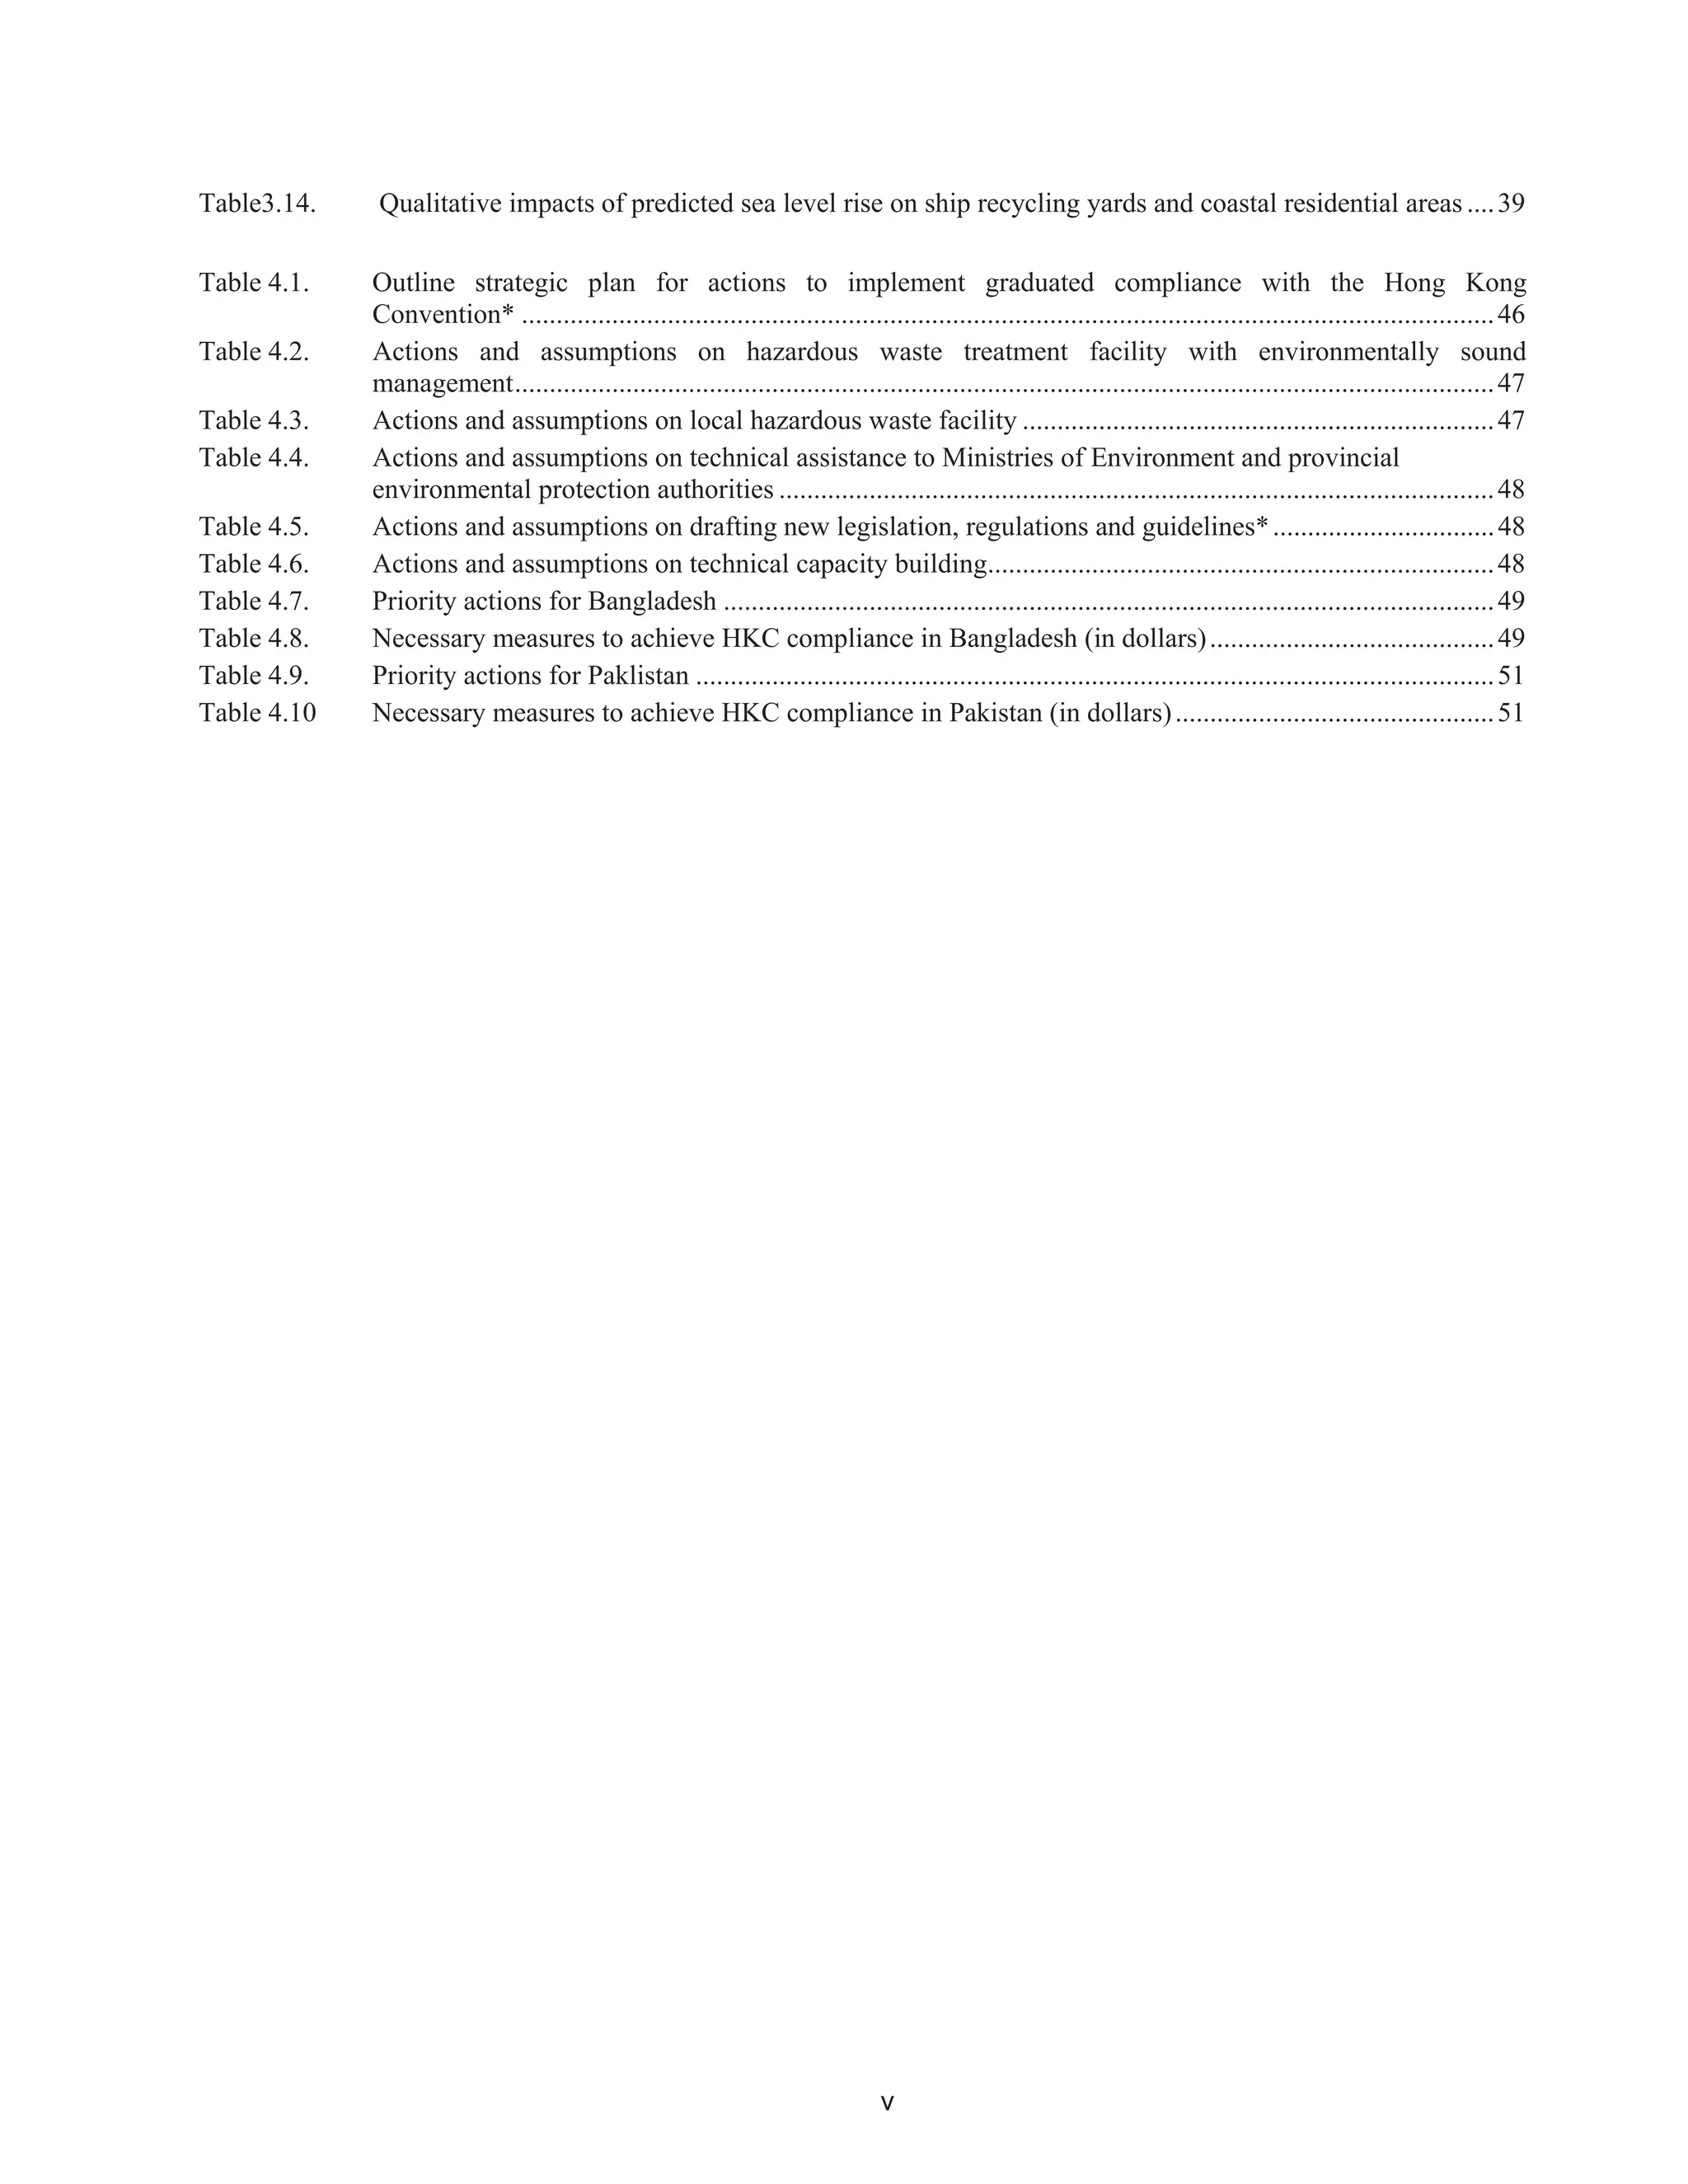
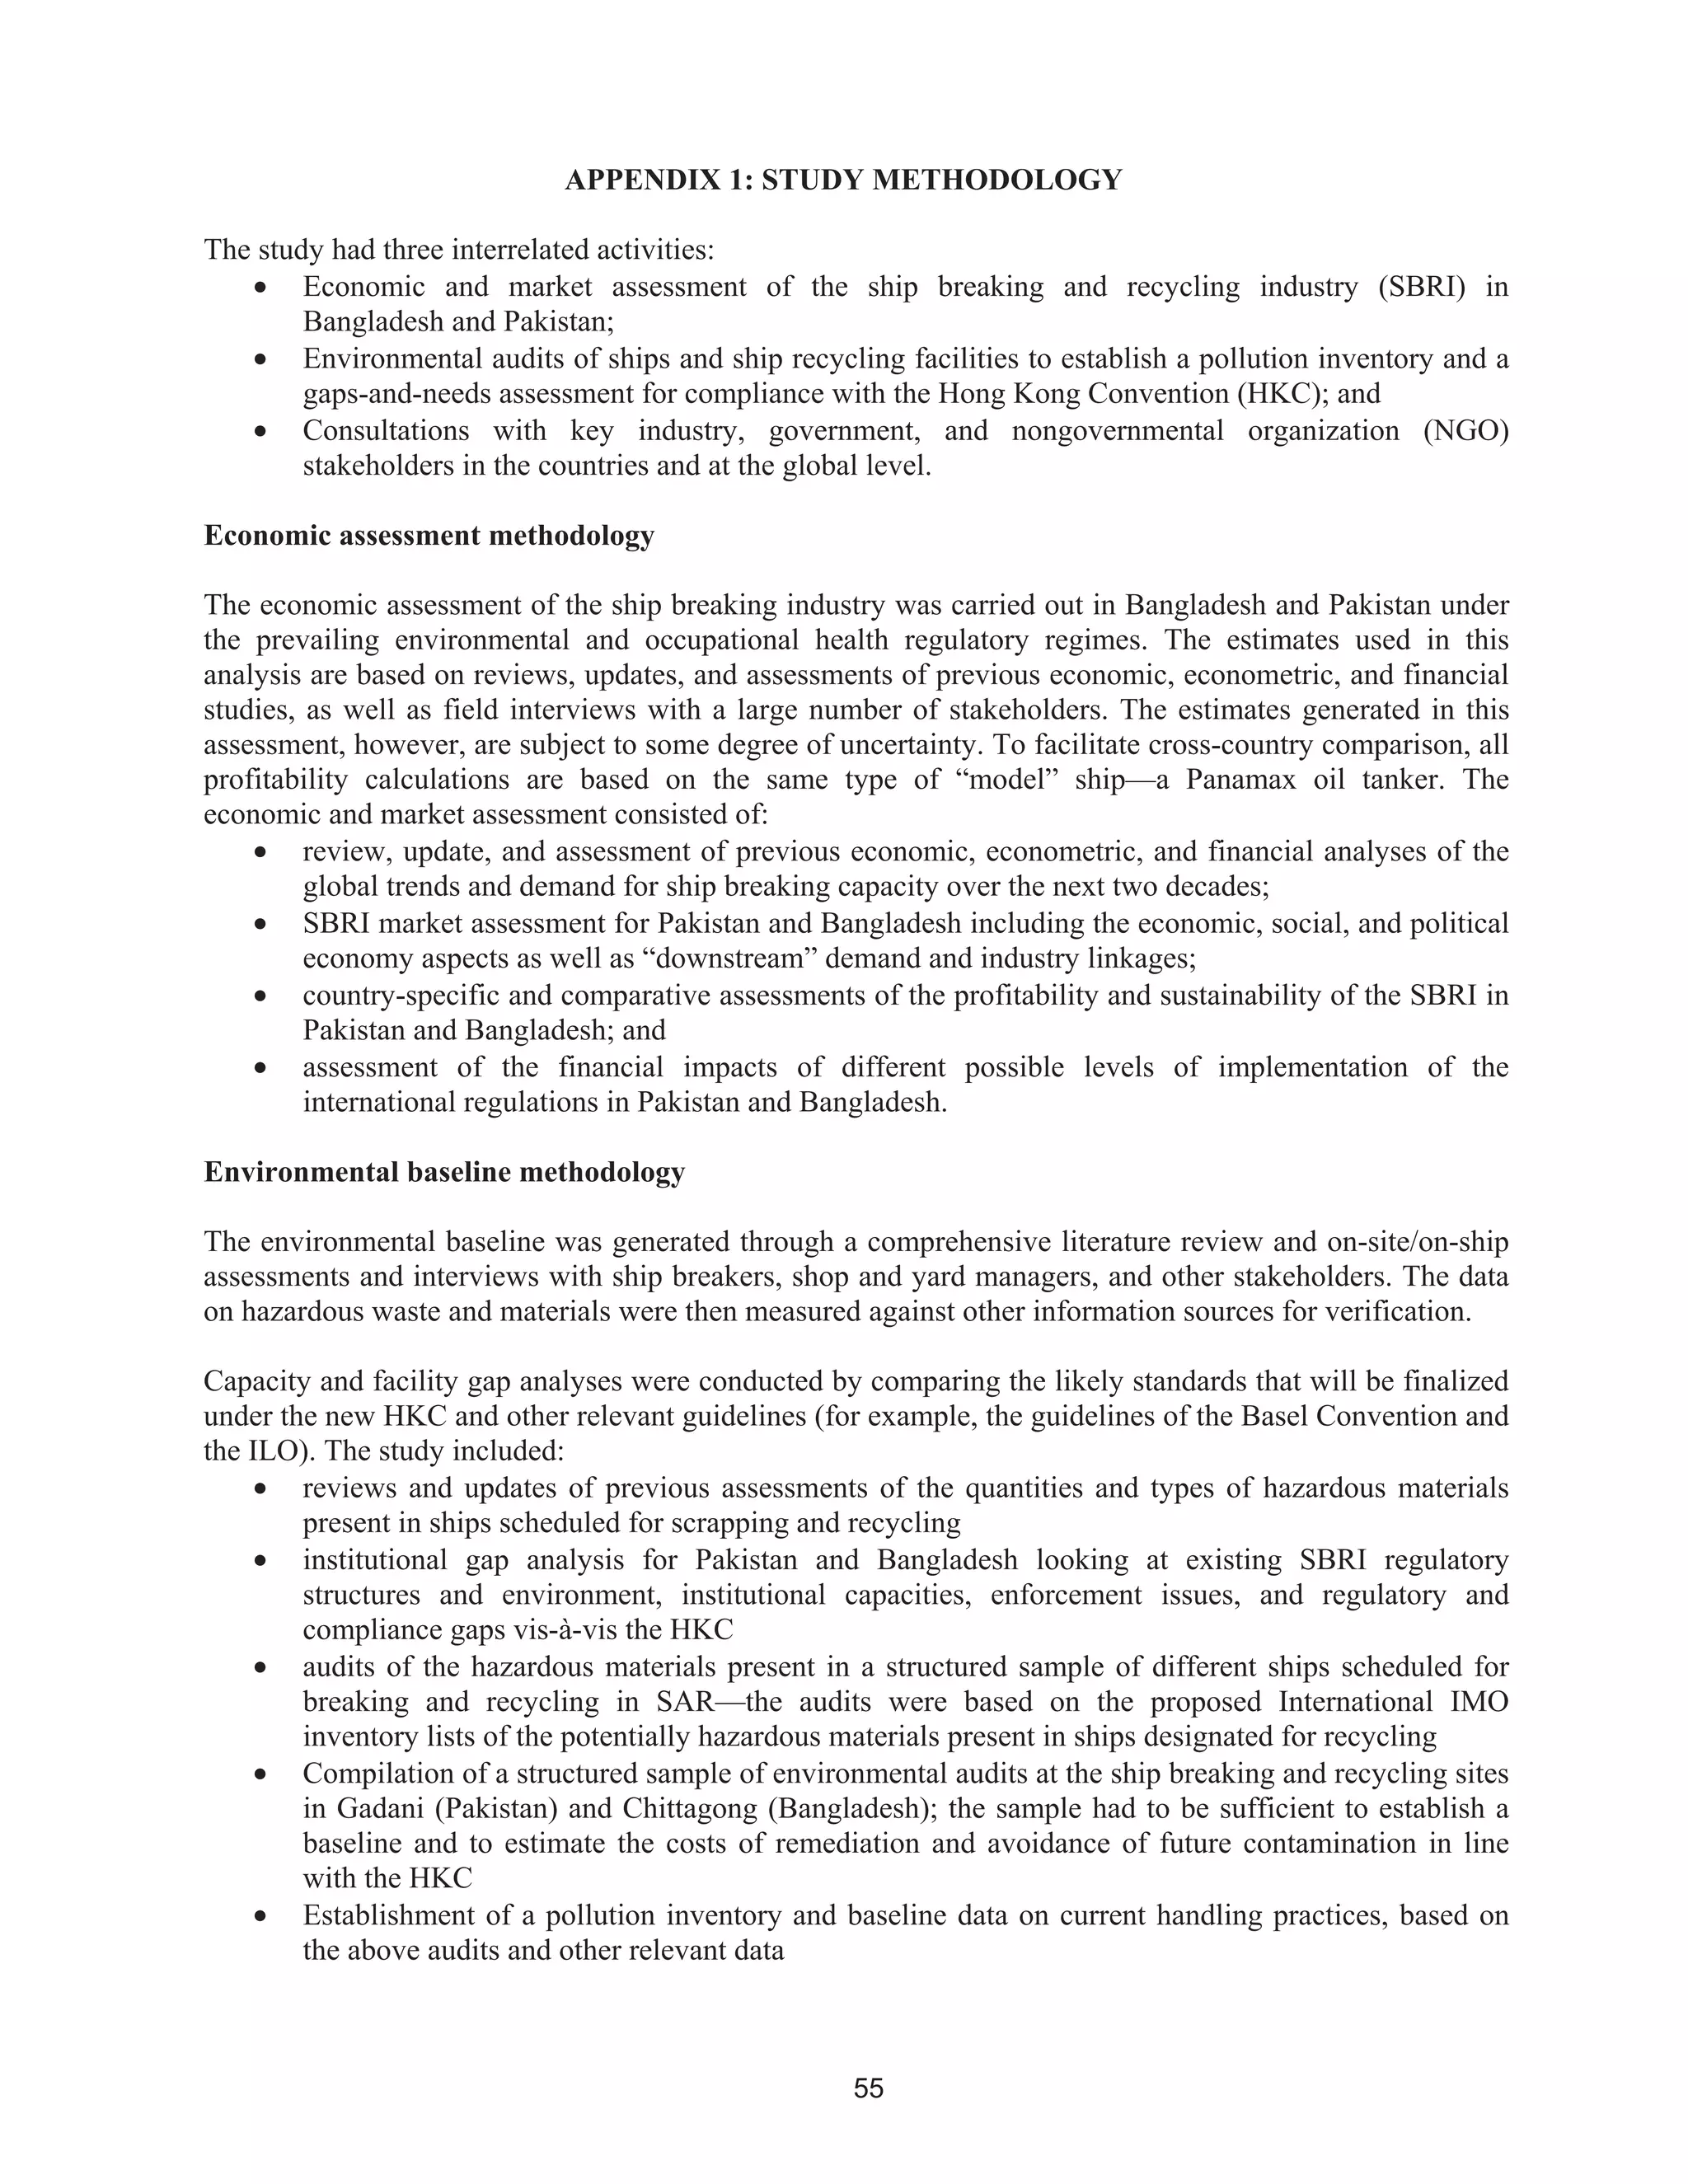
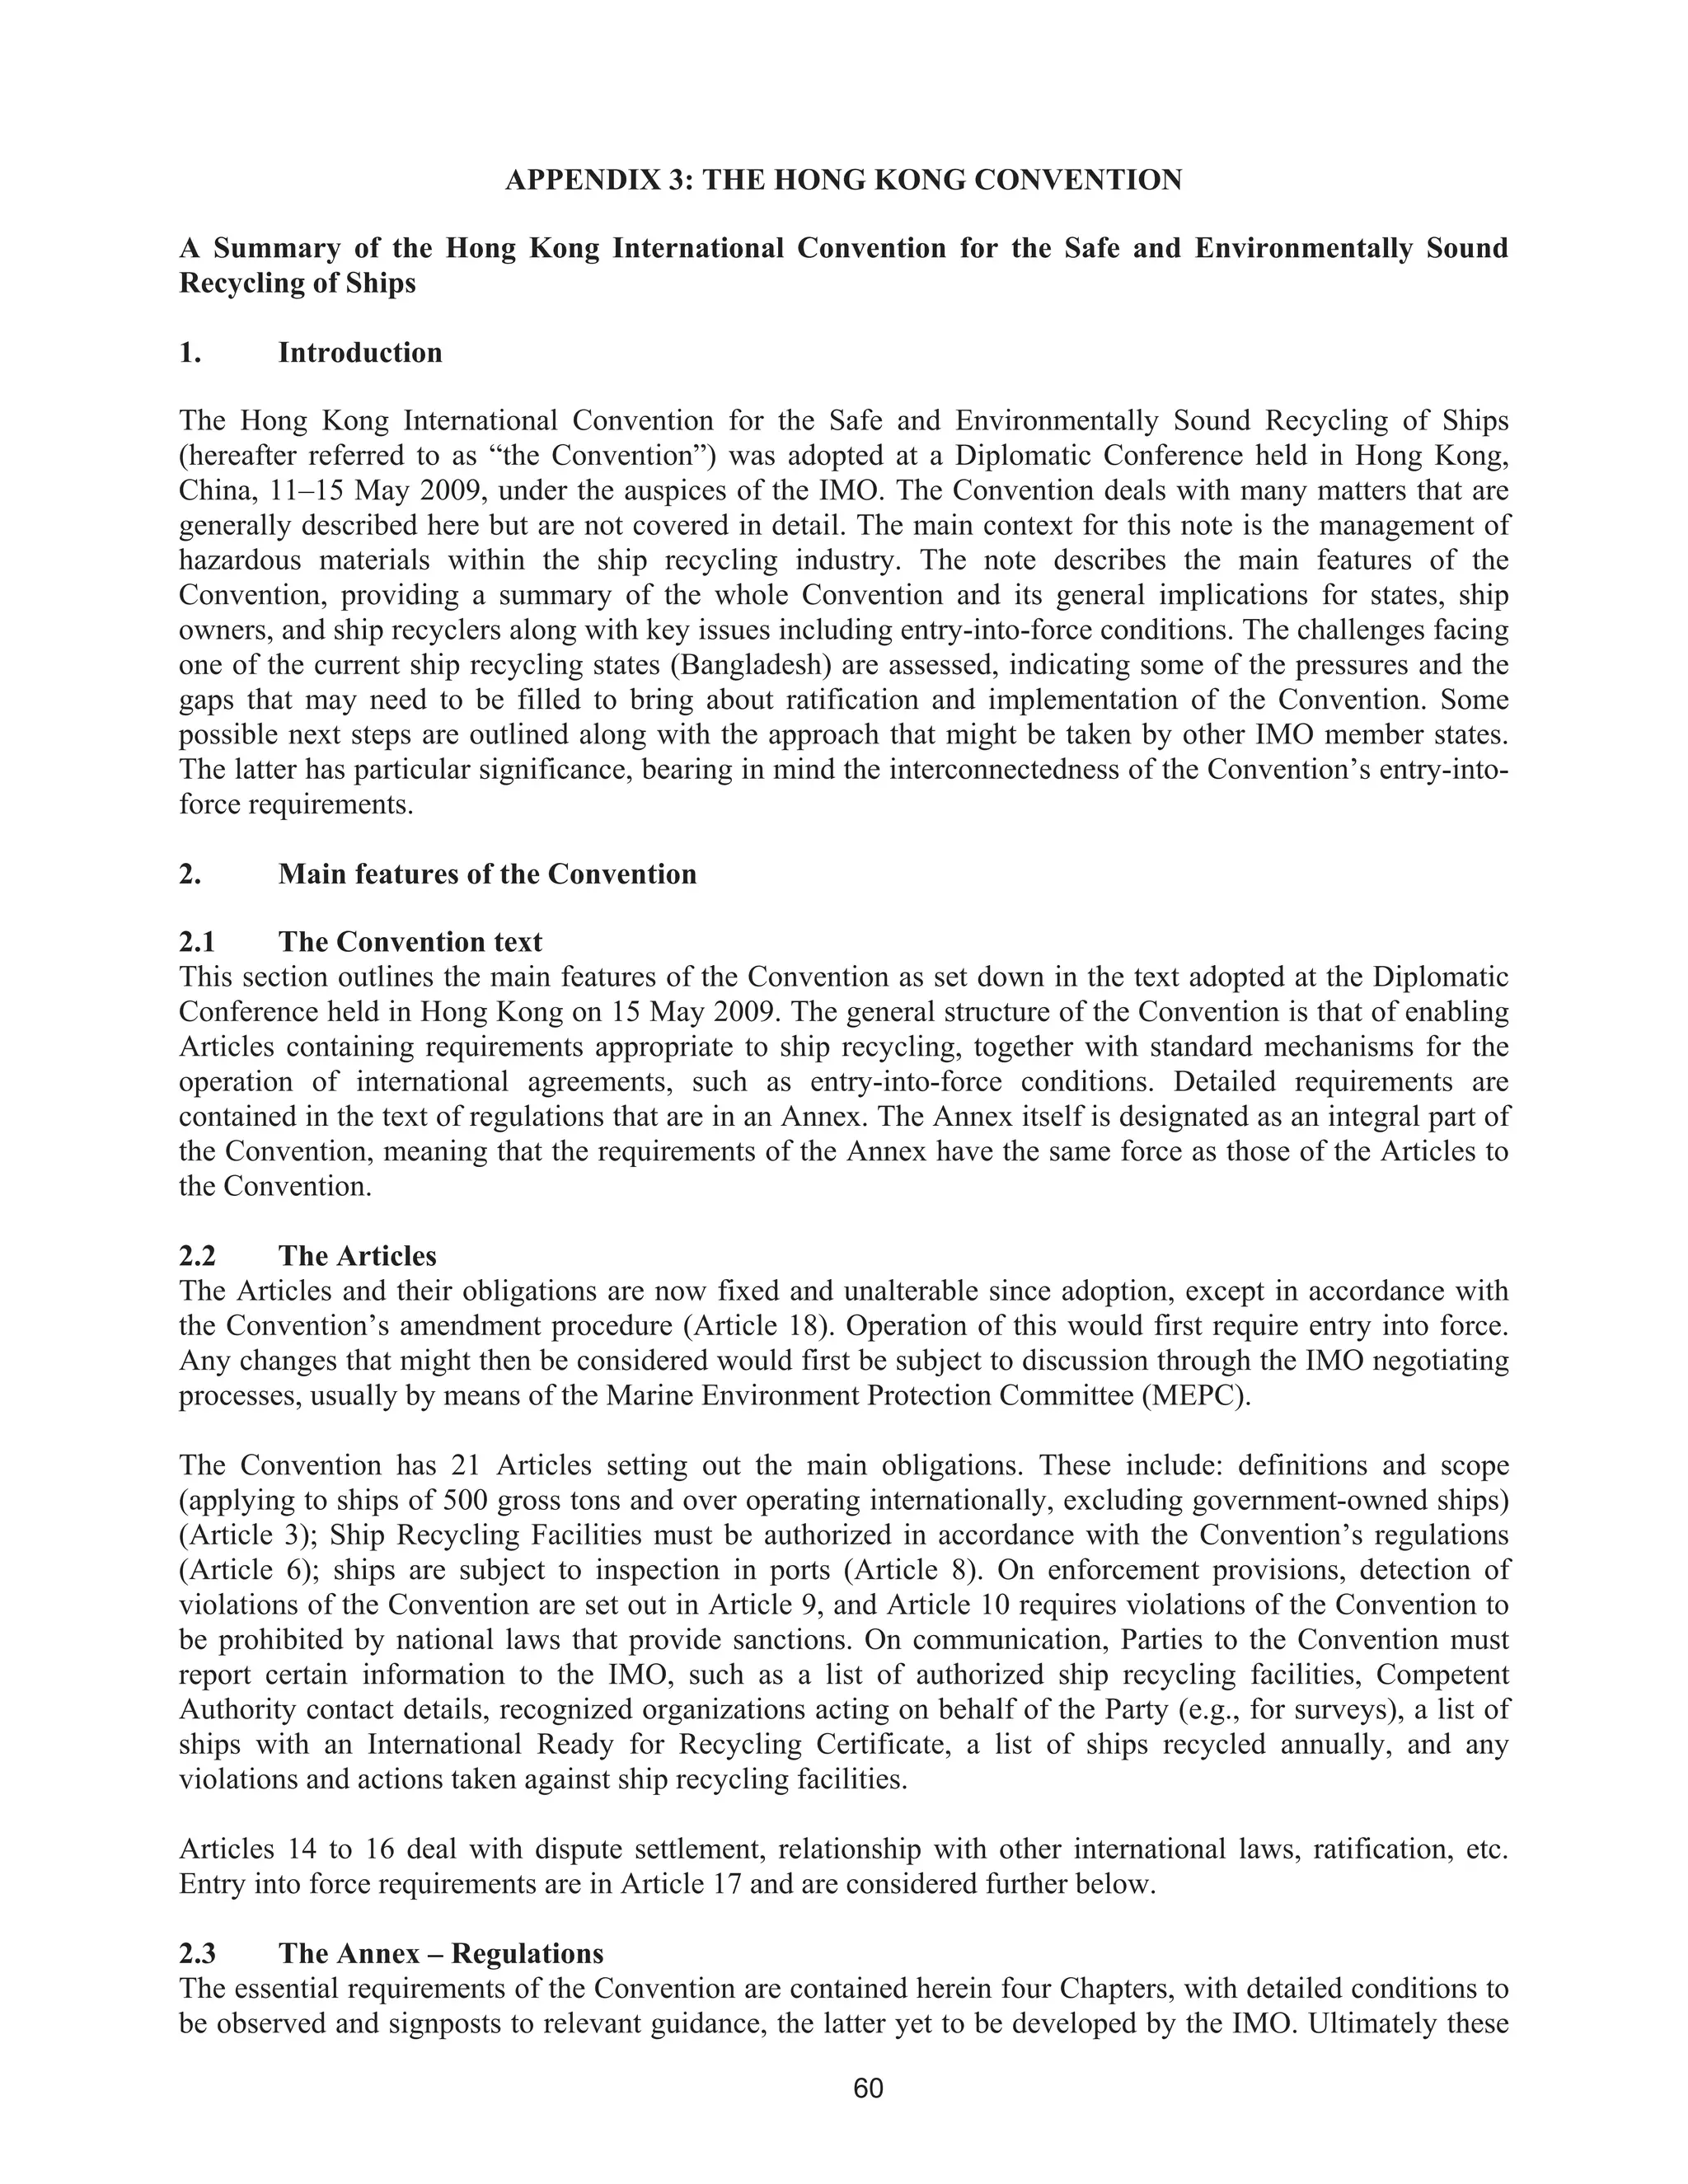
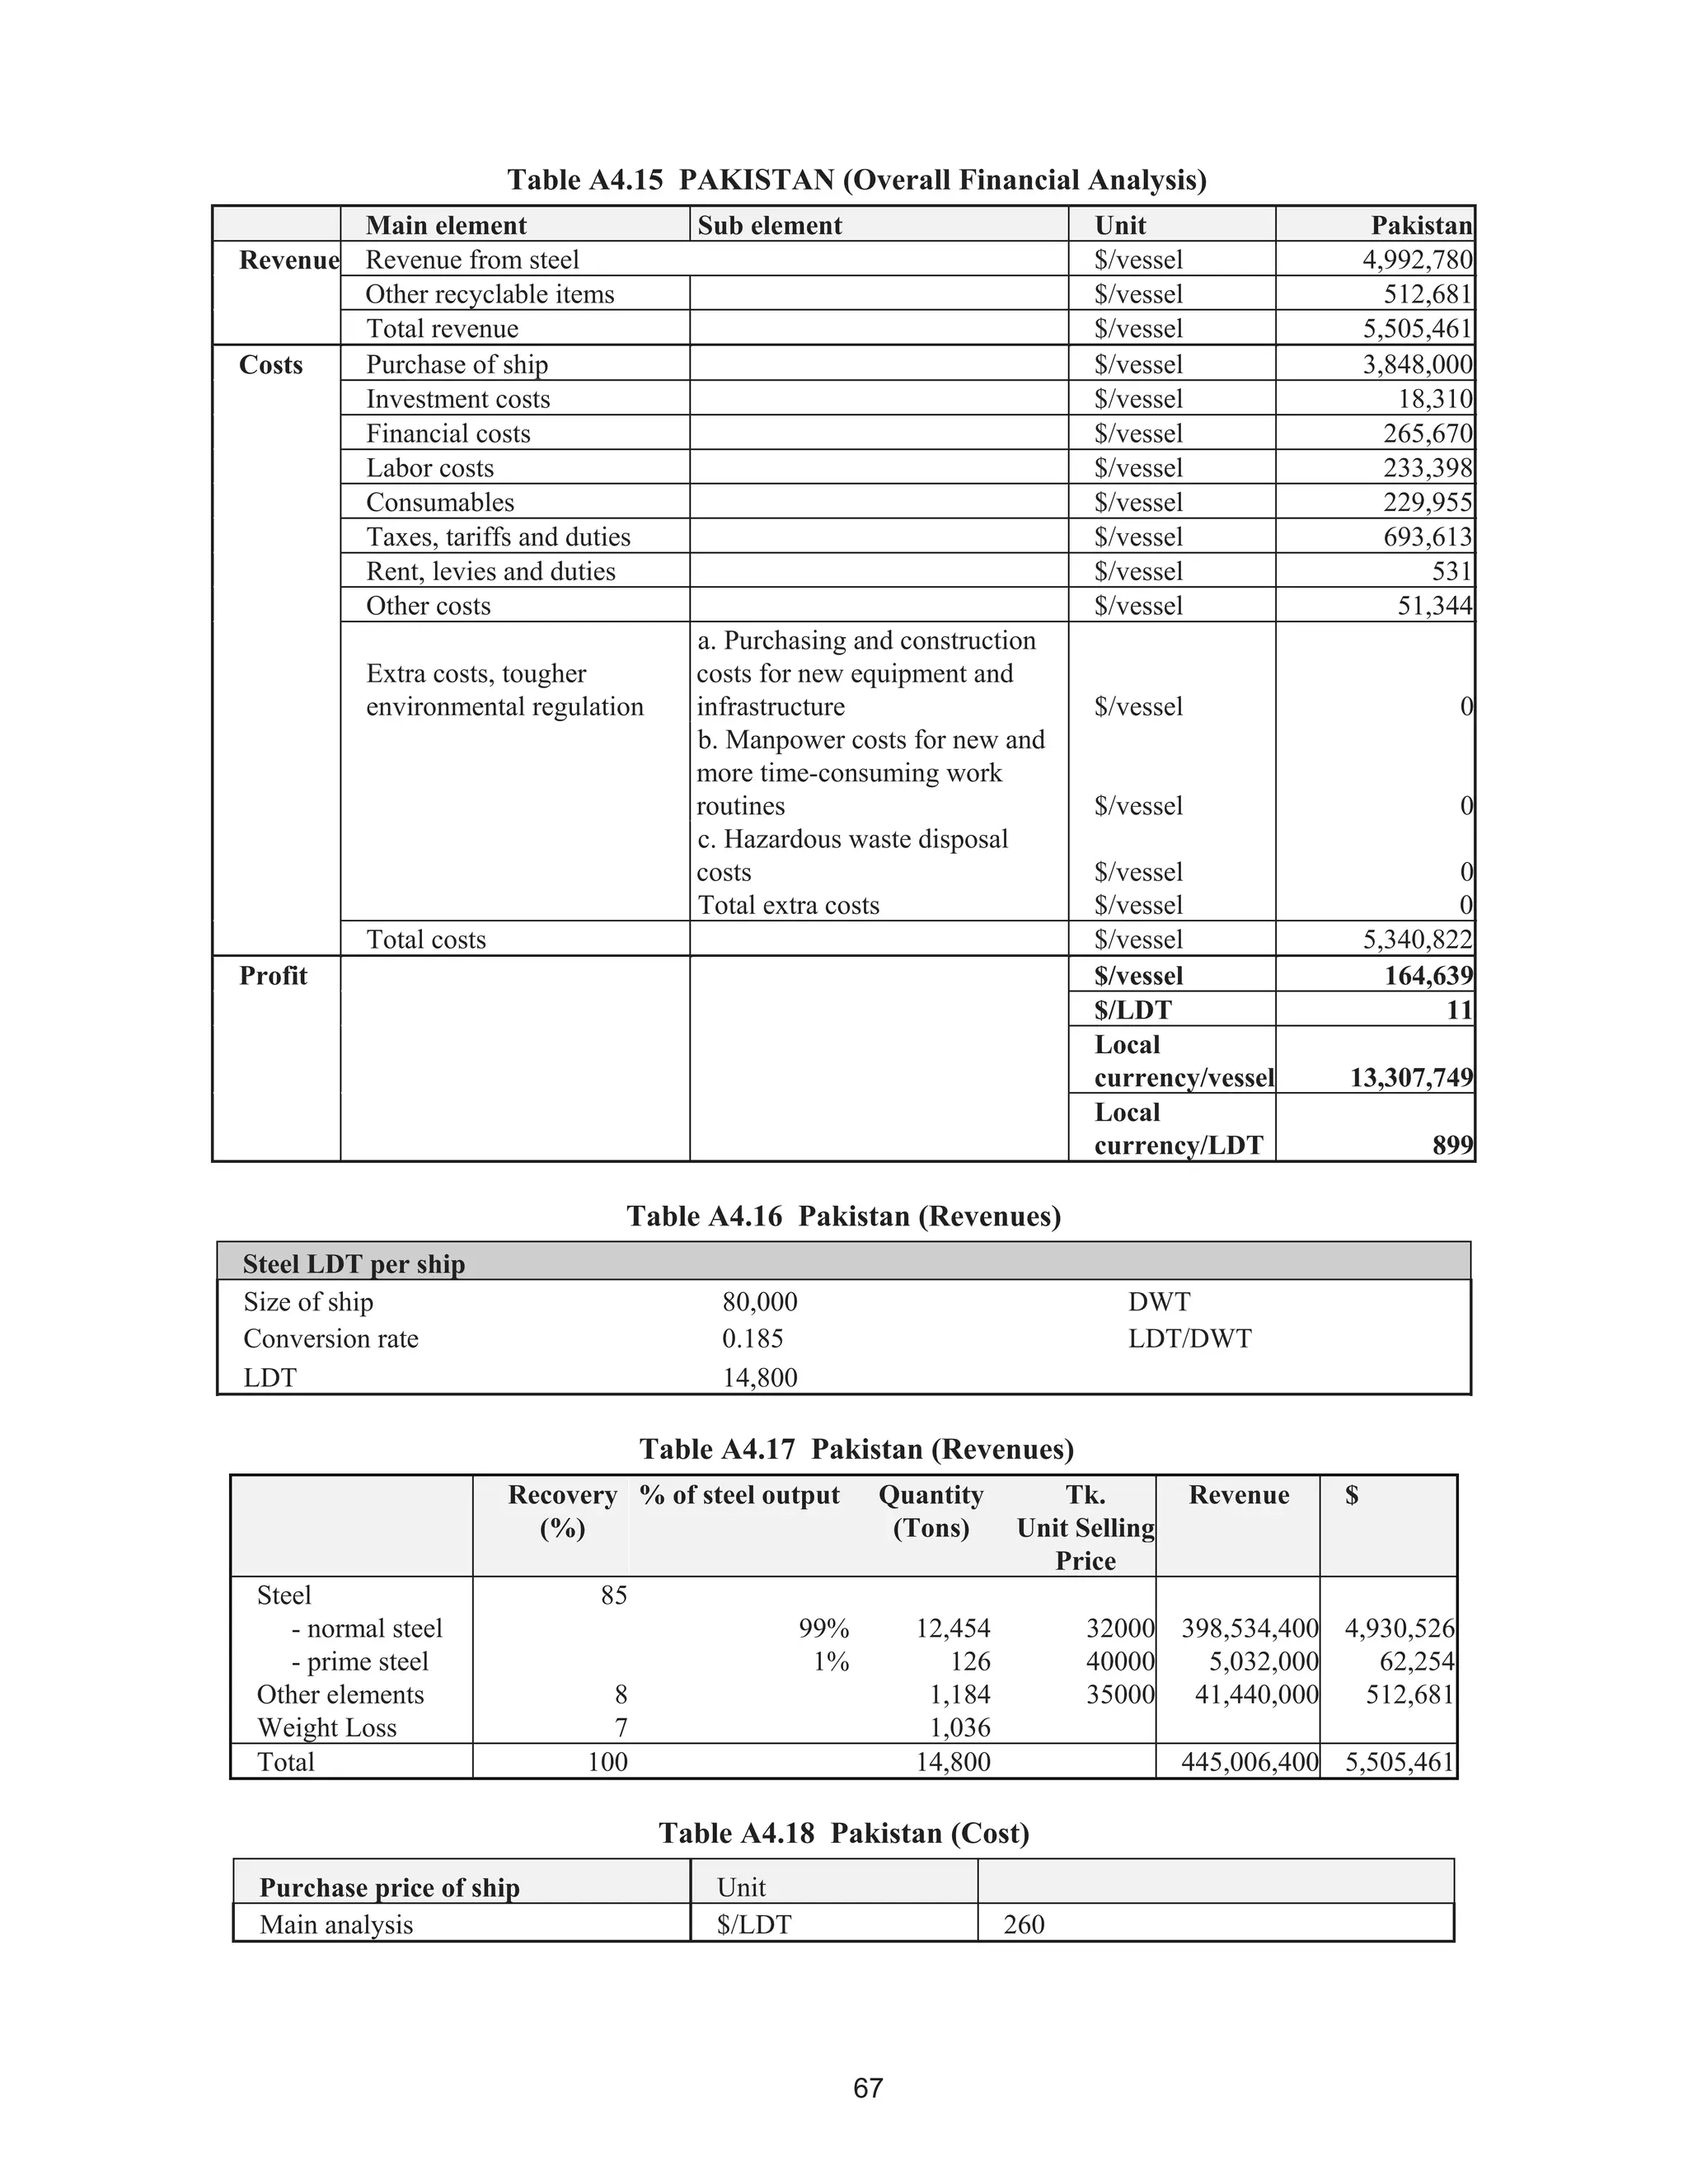
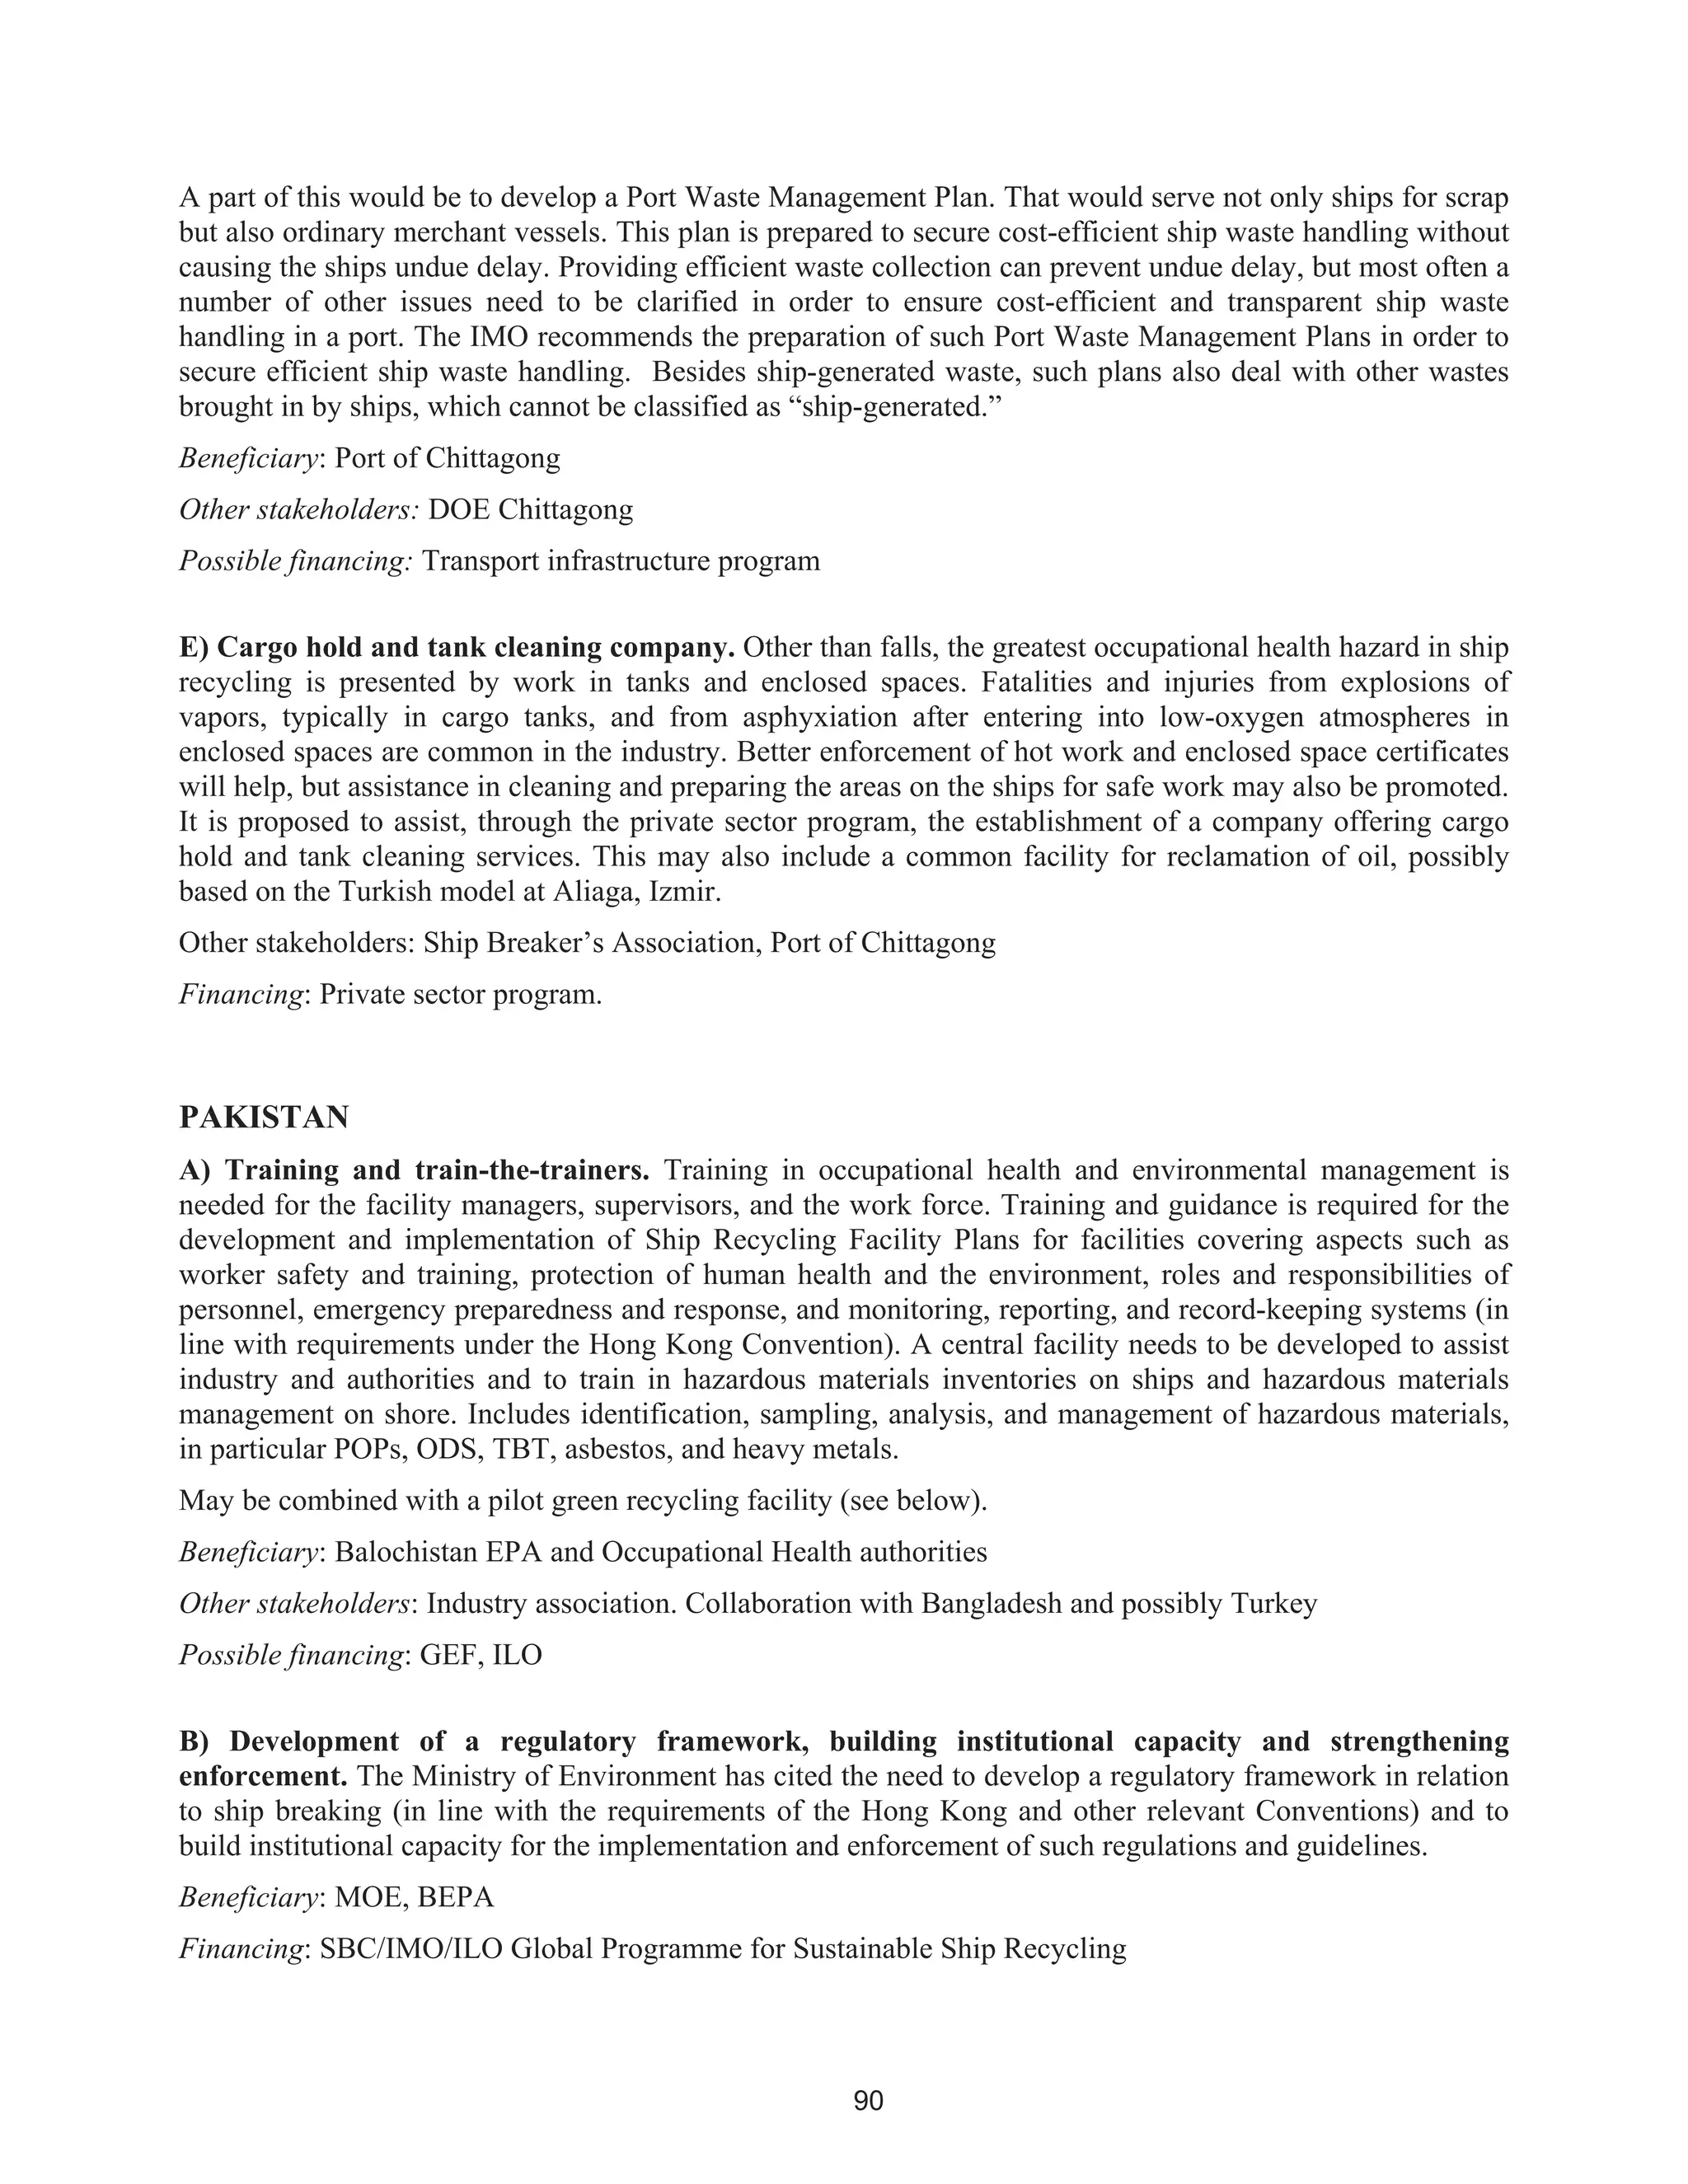
MerchantFleet-MeanTotal-cont’d
HazardousMaterialUnit
Material
Total
1000
GT
total
Material/
millionGT
Rangeof
Shipsize
[GT]
Rangeof
material
Rangeof
material/
millionGT
No.
observations
Compiled
fromentry
no.
9
Reusableliquidsorganic(HFO,
diesel)ton15504833208
960-
156,8155.21-567
907.18-
12,802.199/14
10Misc
10.1BallastWater(C-34)ton25184259485Norangenorangenorange1/14
10.2sewage(C-35)m32842661Norangenorangenorange1/14
10.3Garbage(C-42)ton0.10442.3Norangenorangenorange1/14
10.4Incineratorash(C-41)ton0.05261.9Norangenorangenorange1/14
10.5
Oilyrags(C-45)ton0.22703.1
35,431-
44,2890.02-0.20.0006-0.004522/1410.5
10.7
Batteriesnickel/cadmium
unit
s742165Norangenorangenorange1/14
11Wasteliquidsinorganic(acids)m30.041570.28NorangeNorangeNorange1/14
12
Reusableliquidsorganic(other)m3151246615
960-
156,8150.24-86.0250-23,177.086/42
12.1,12.2,
12.4
13Misc
13.4Batterieslead(C46)ton0.351572.23156,815norangenorange1/14](https://image.slidesharecdn.com/shipbreaking-myanmar-2014-140611041422-phpapp02/75/Shipbreaking-myanmar-2014-96-2048.jpg)
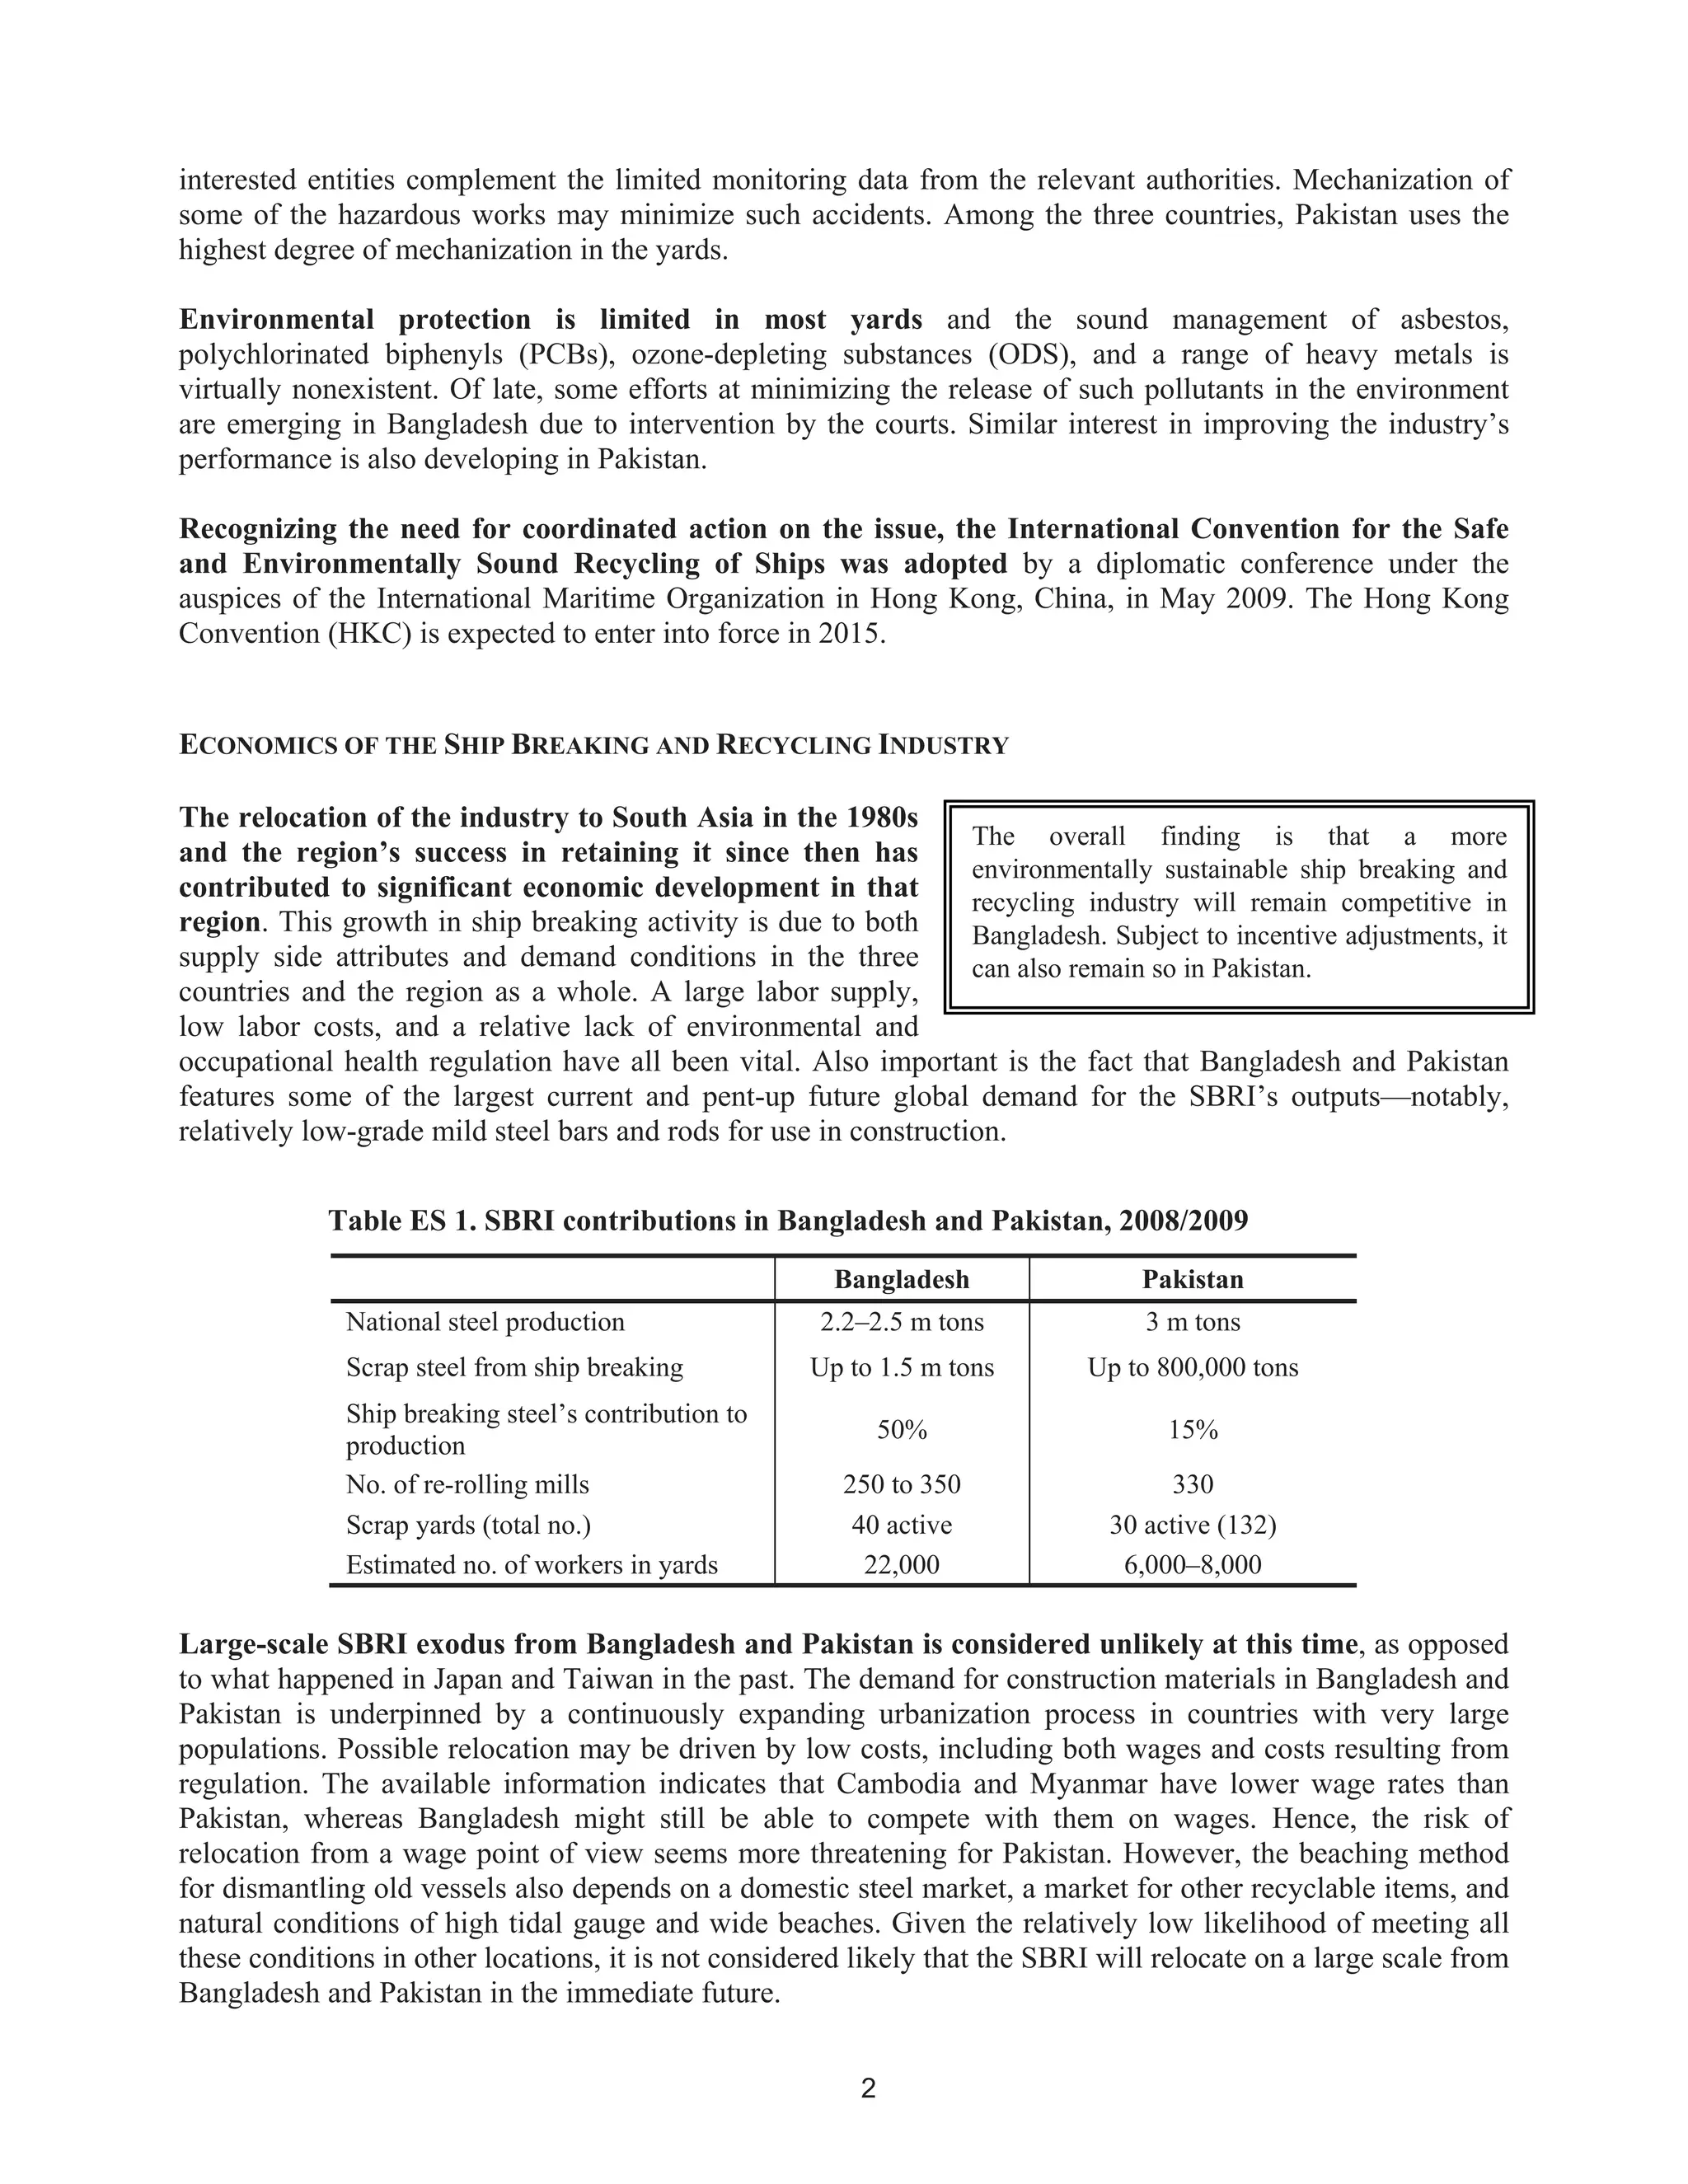
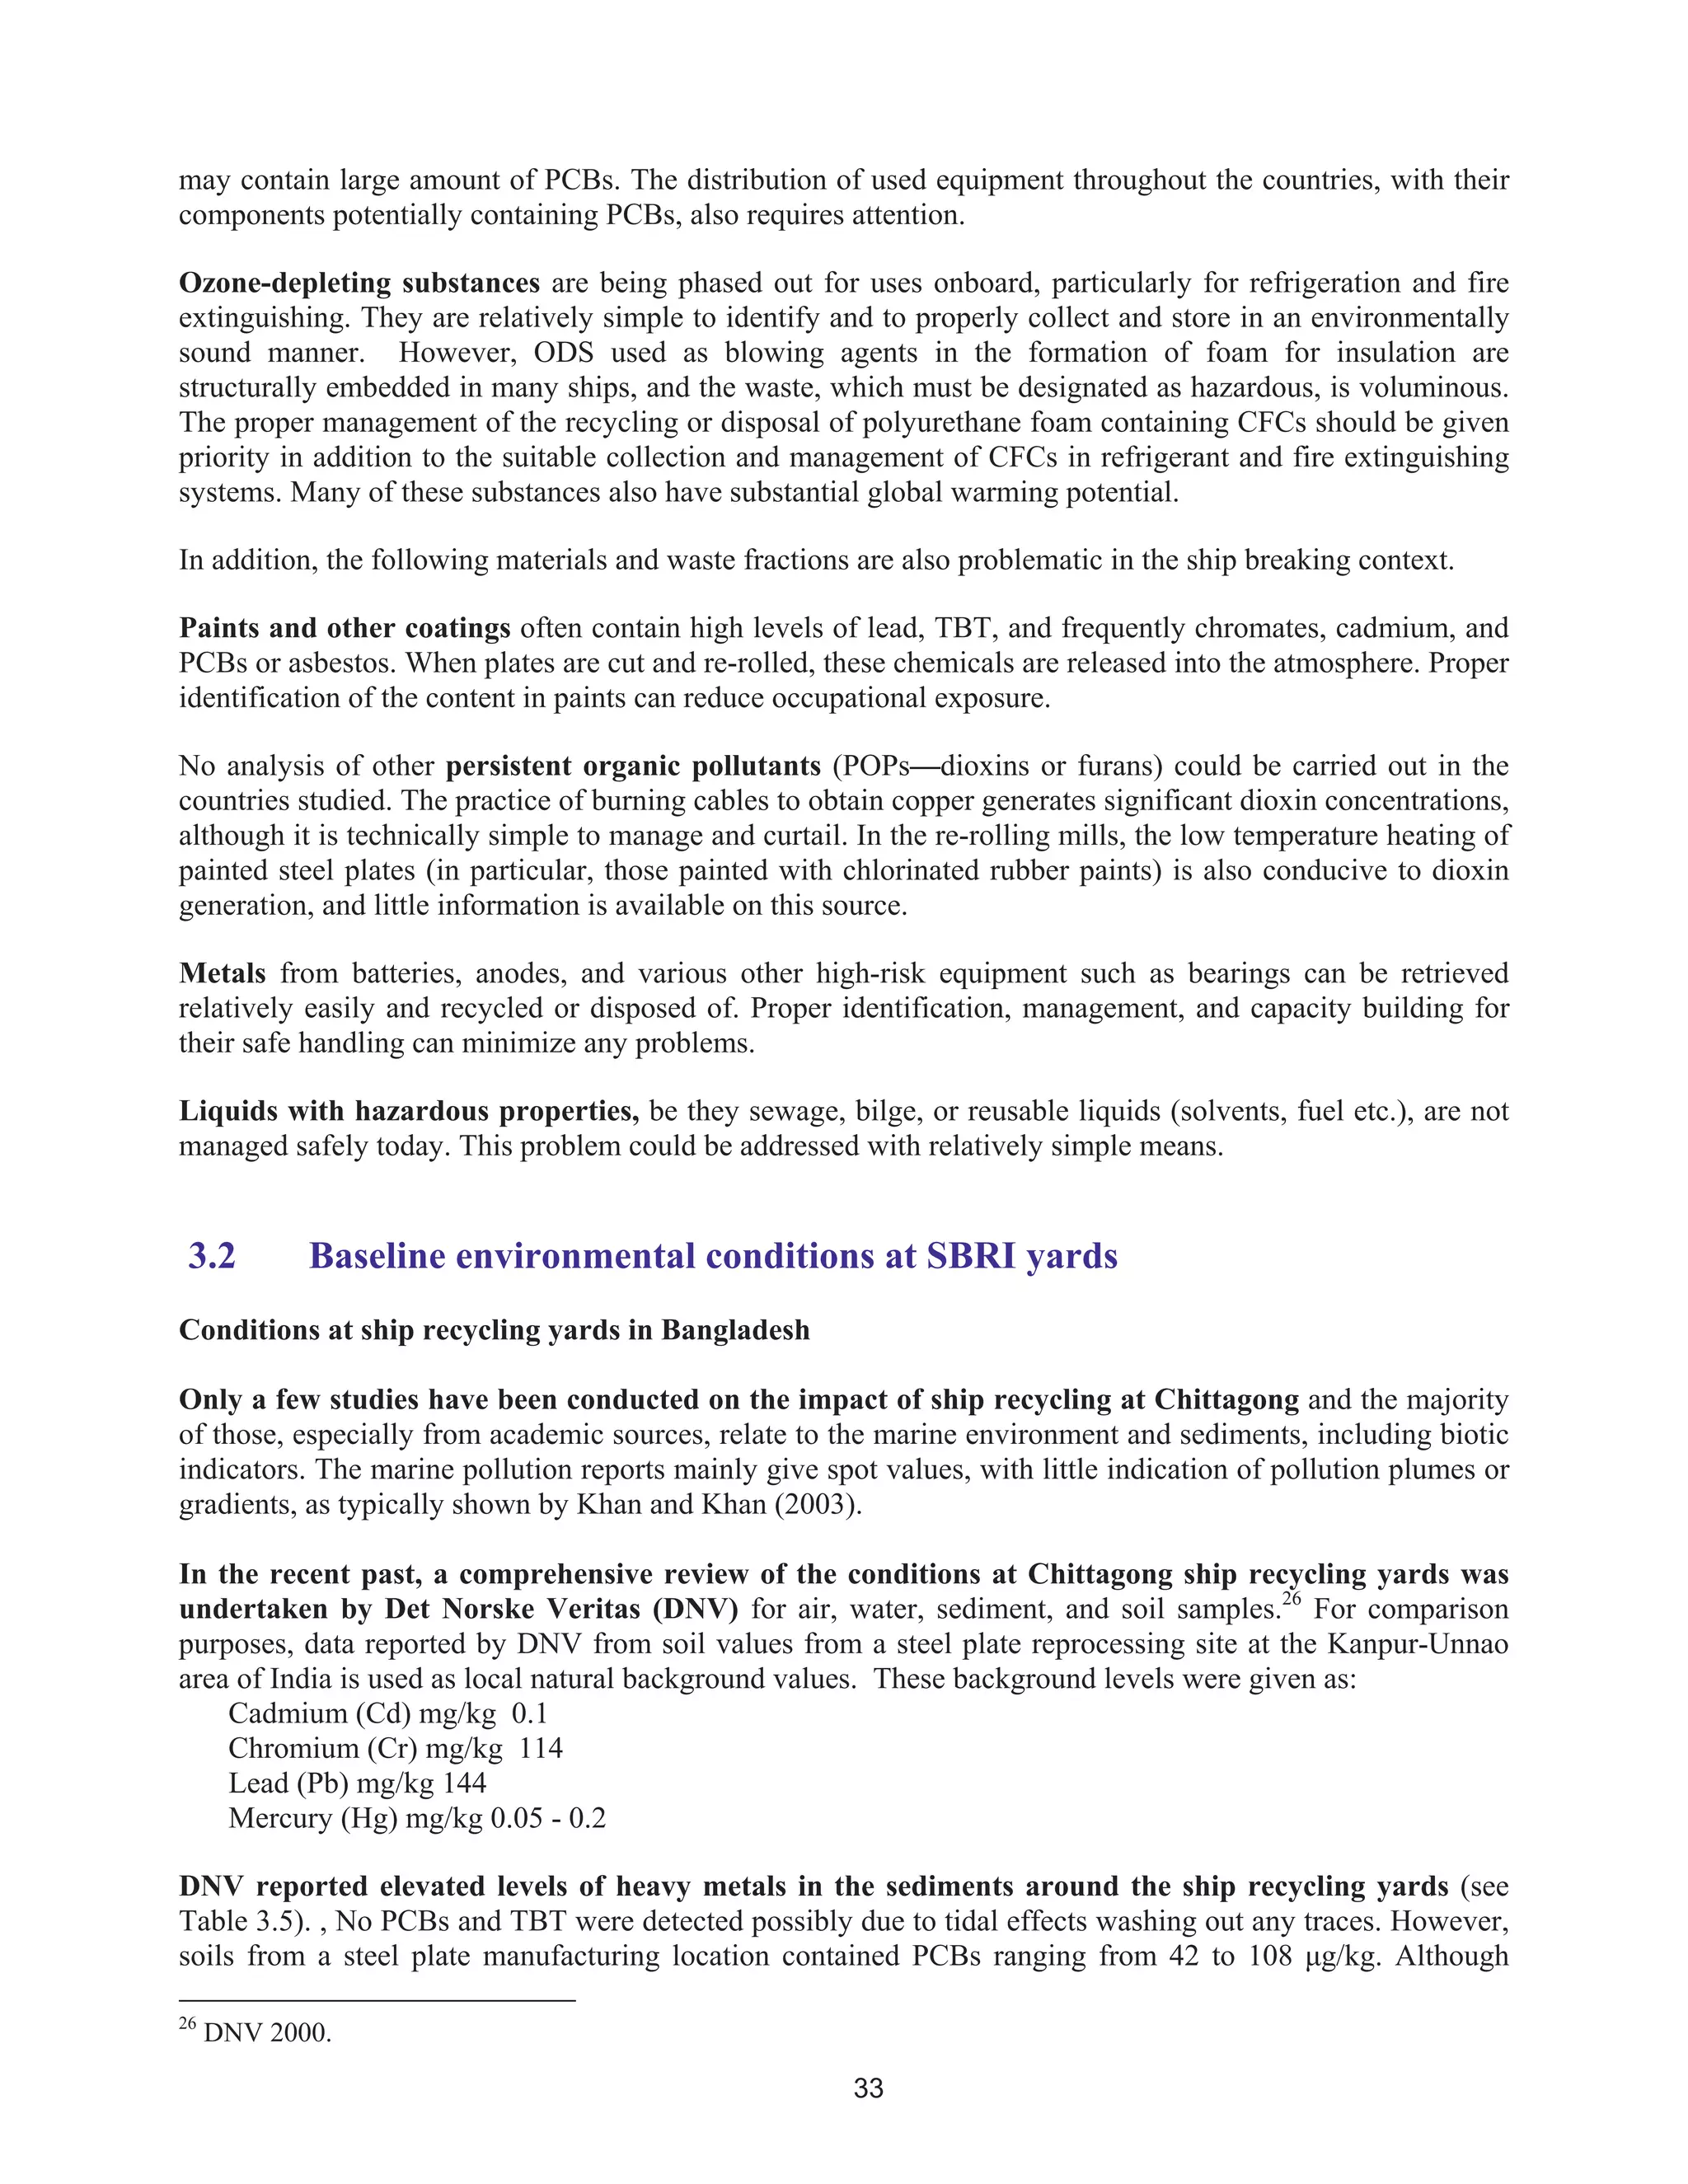
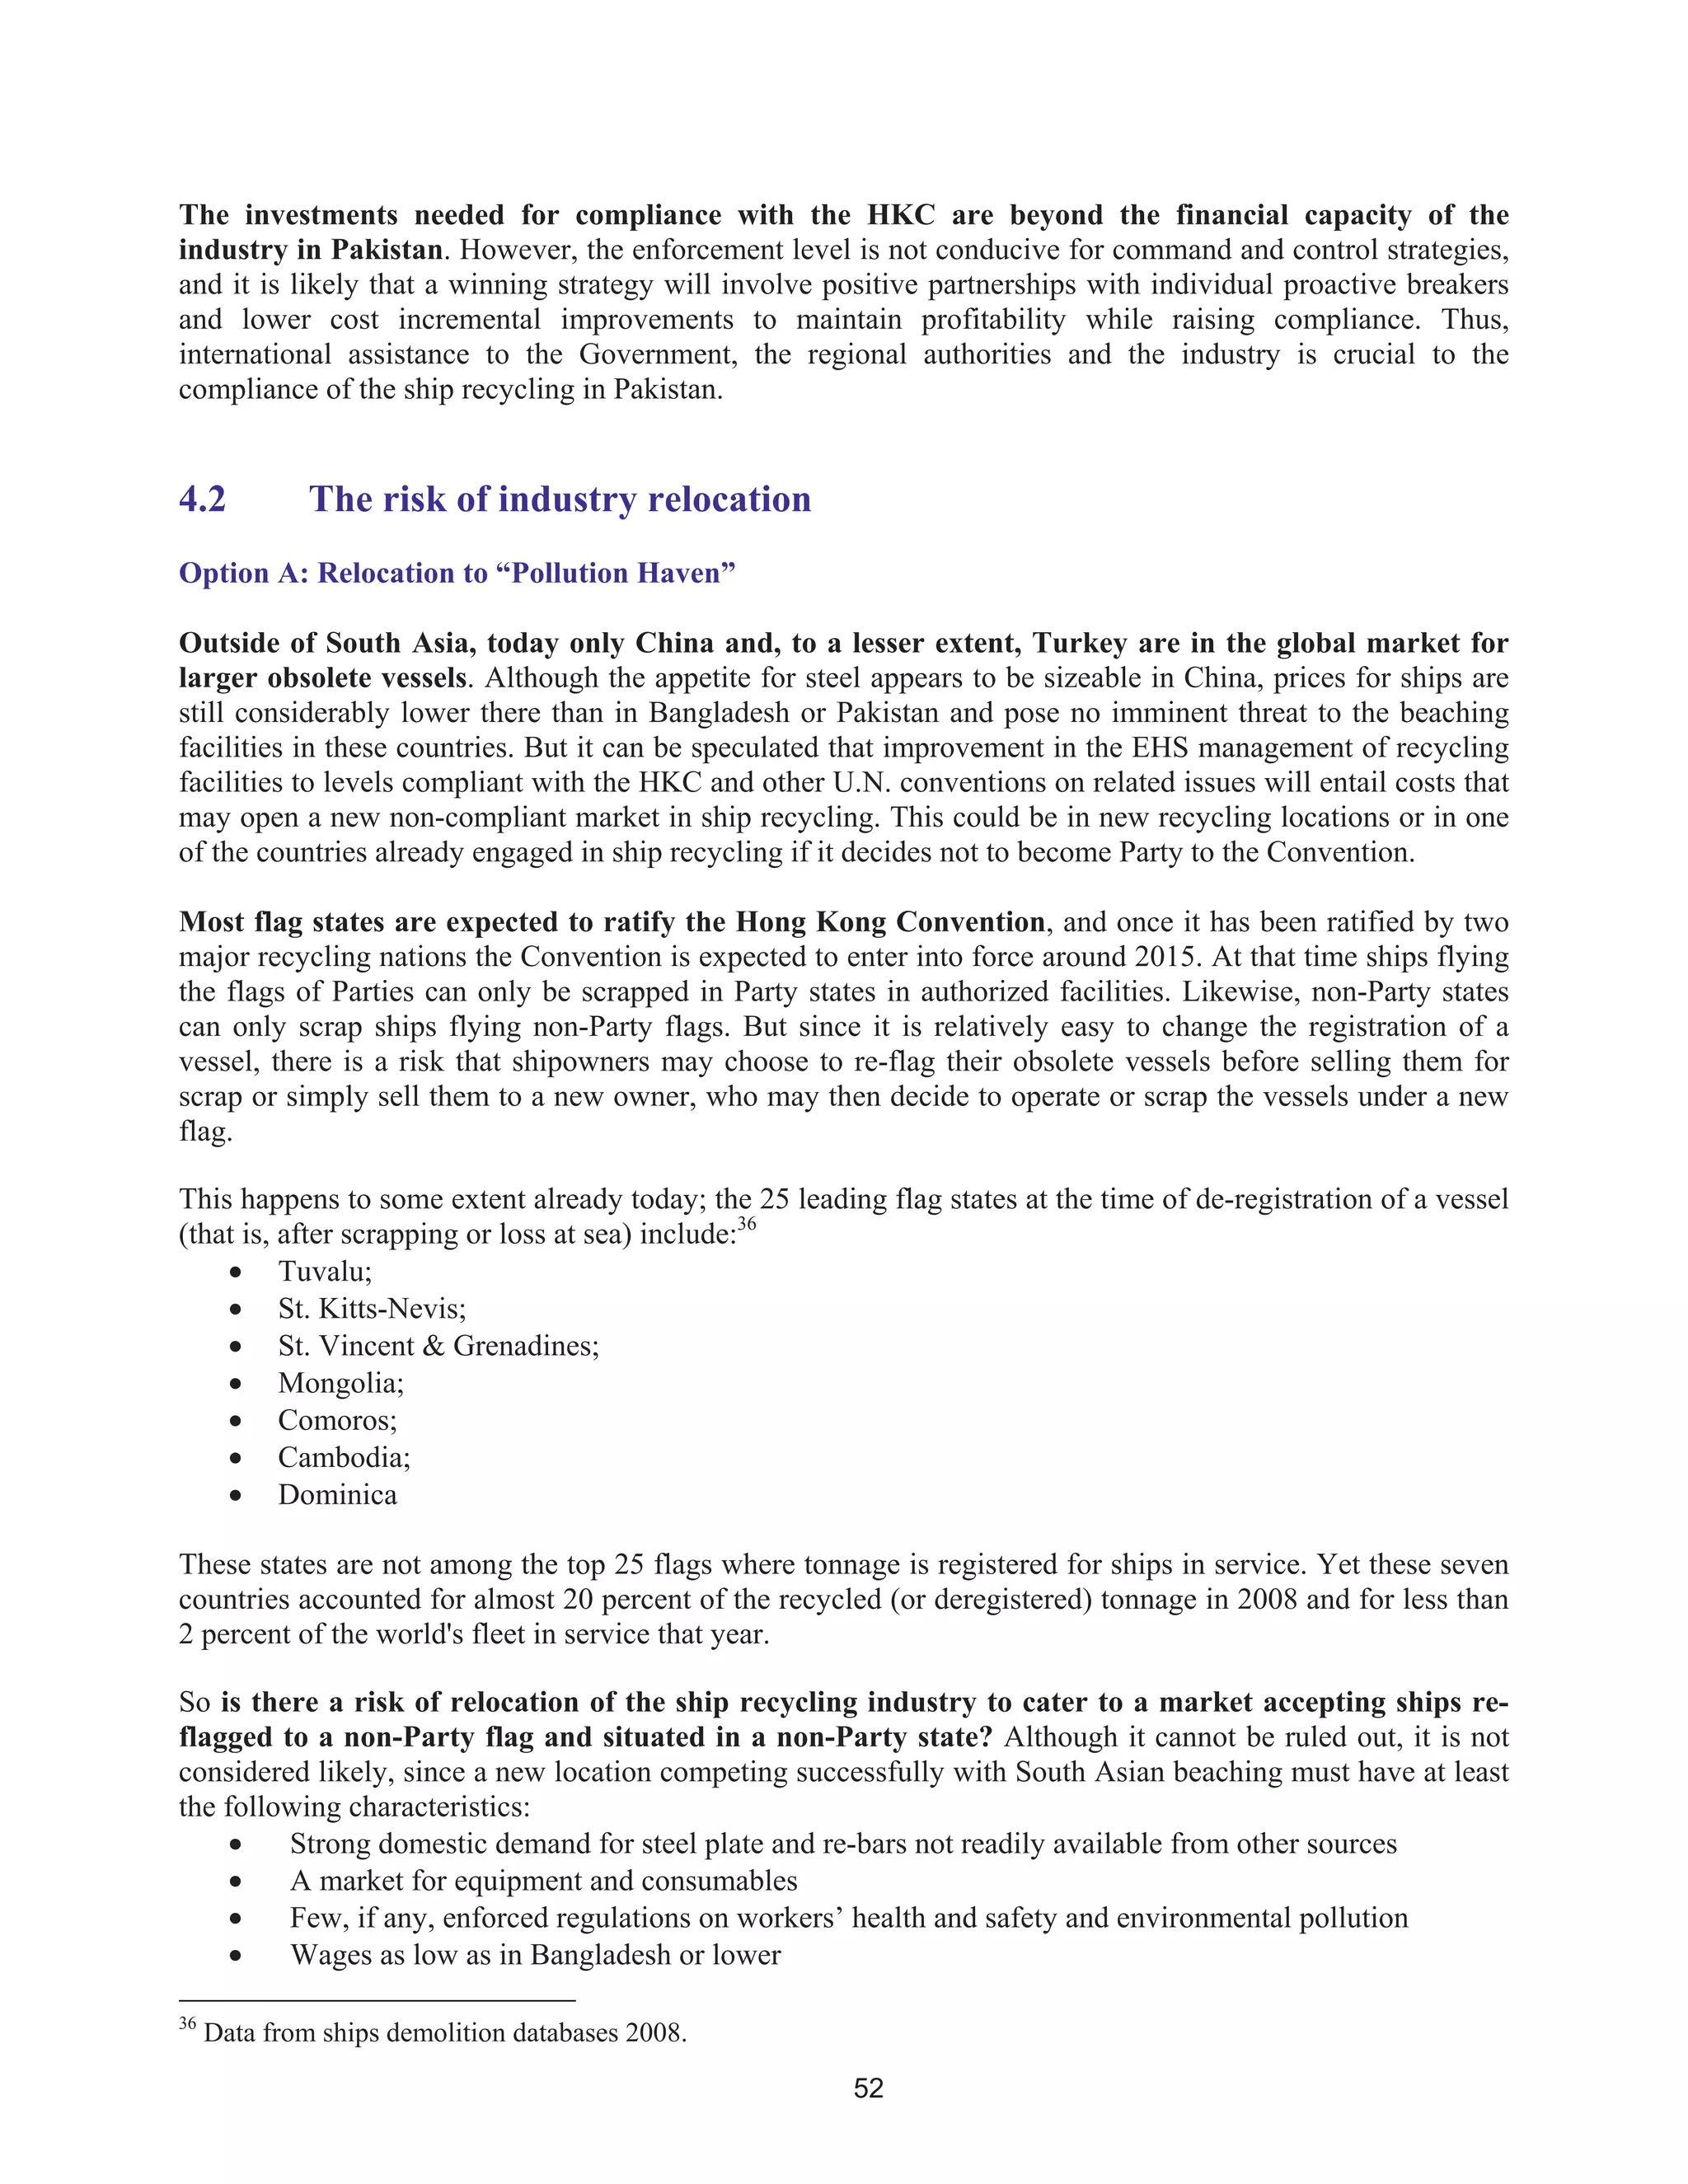
![71
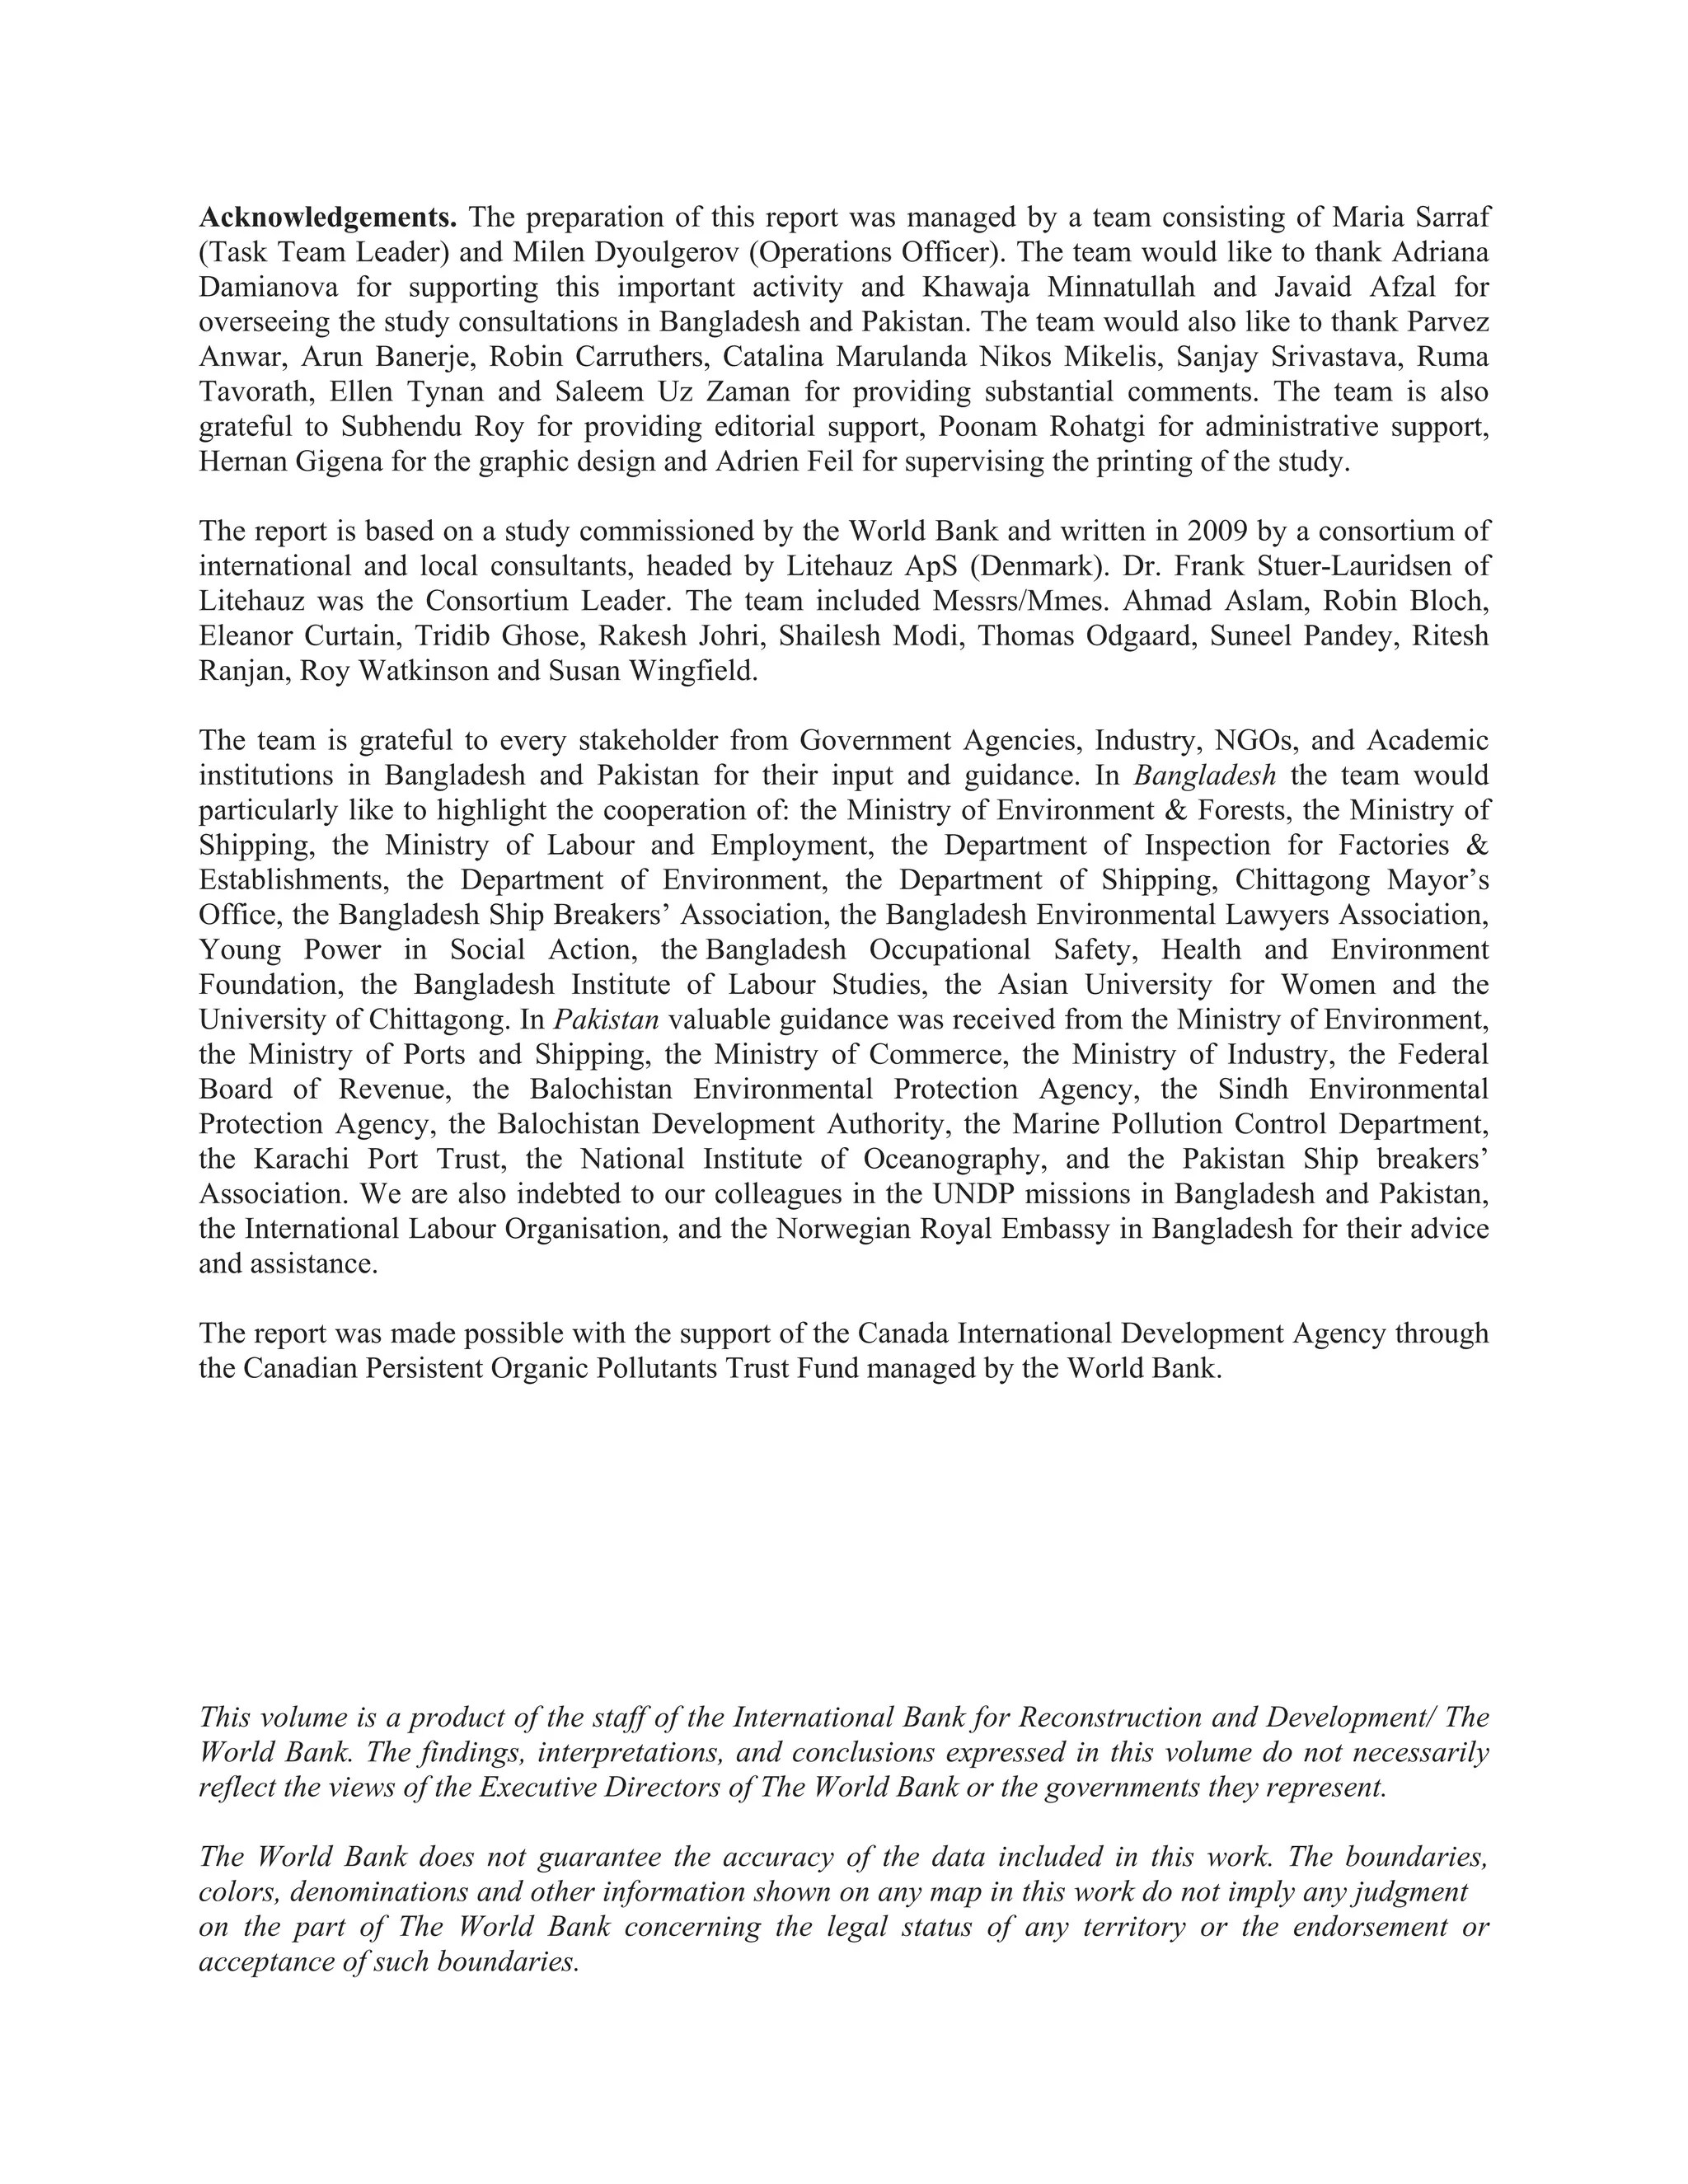
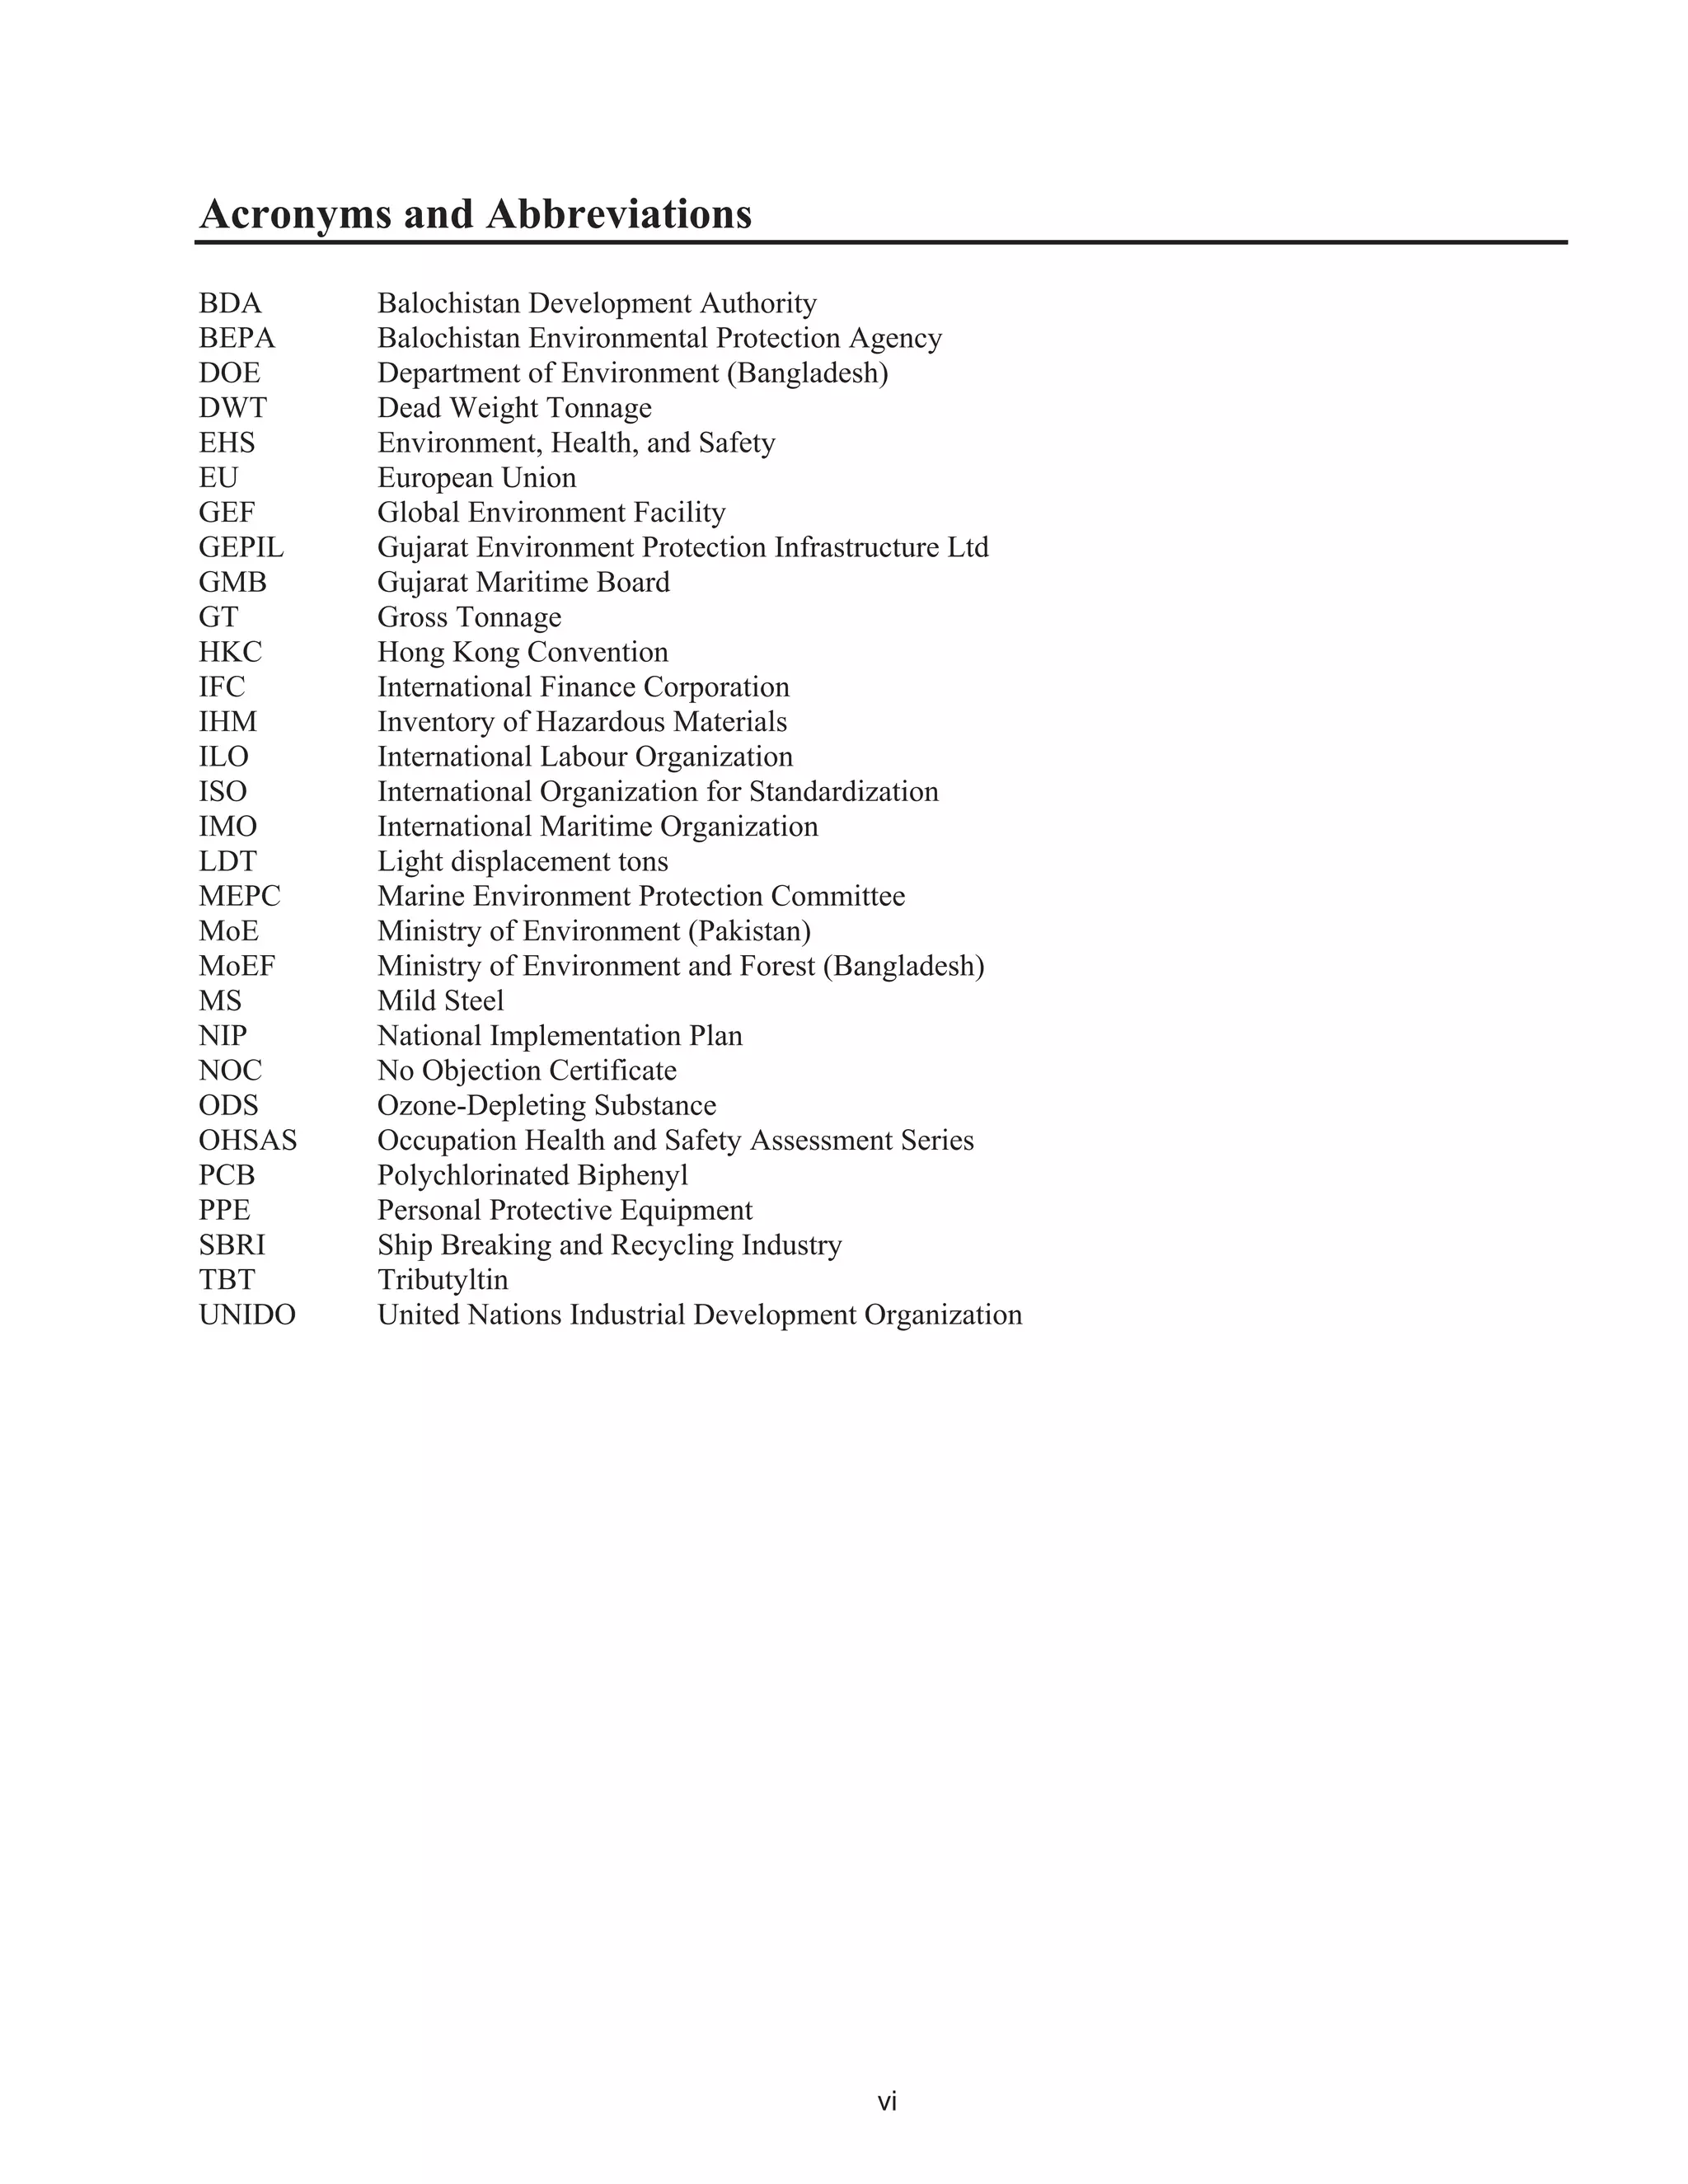
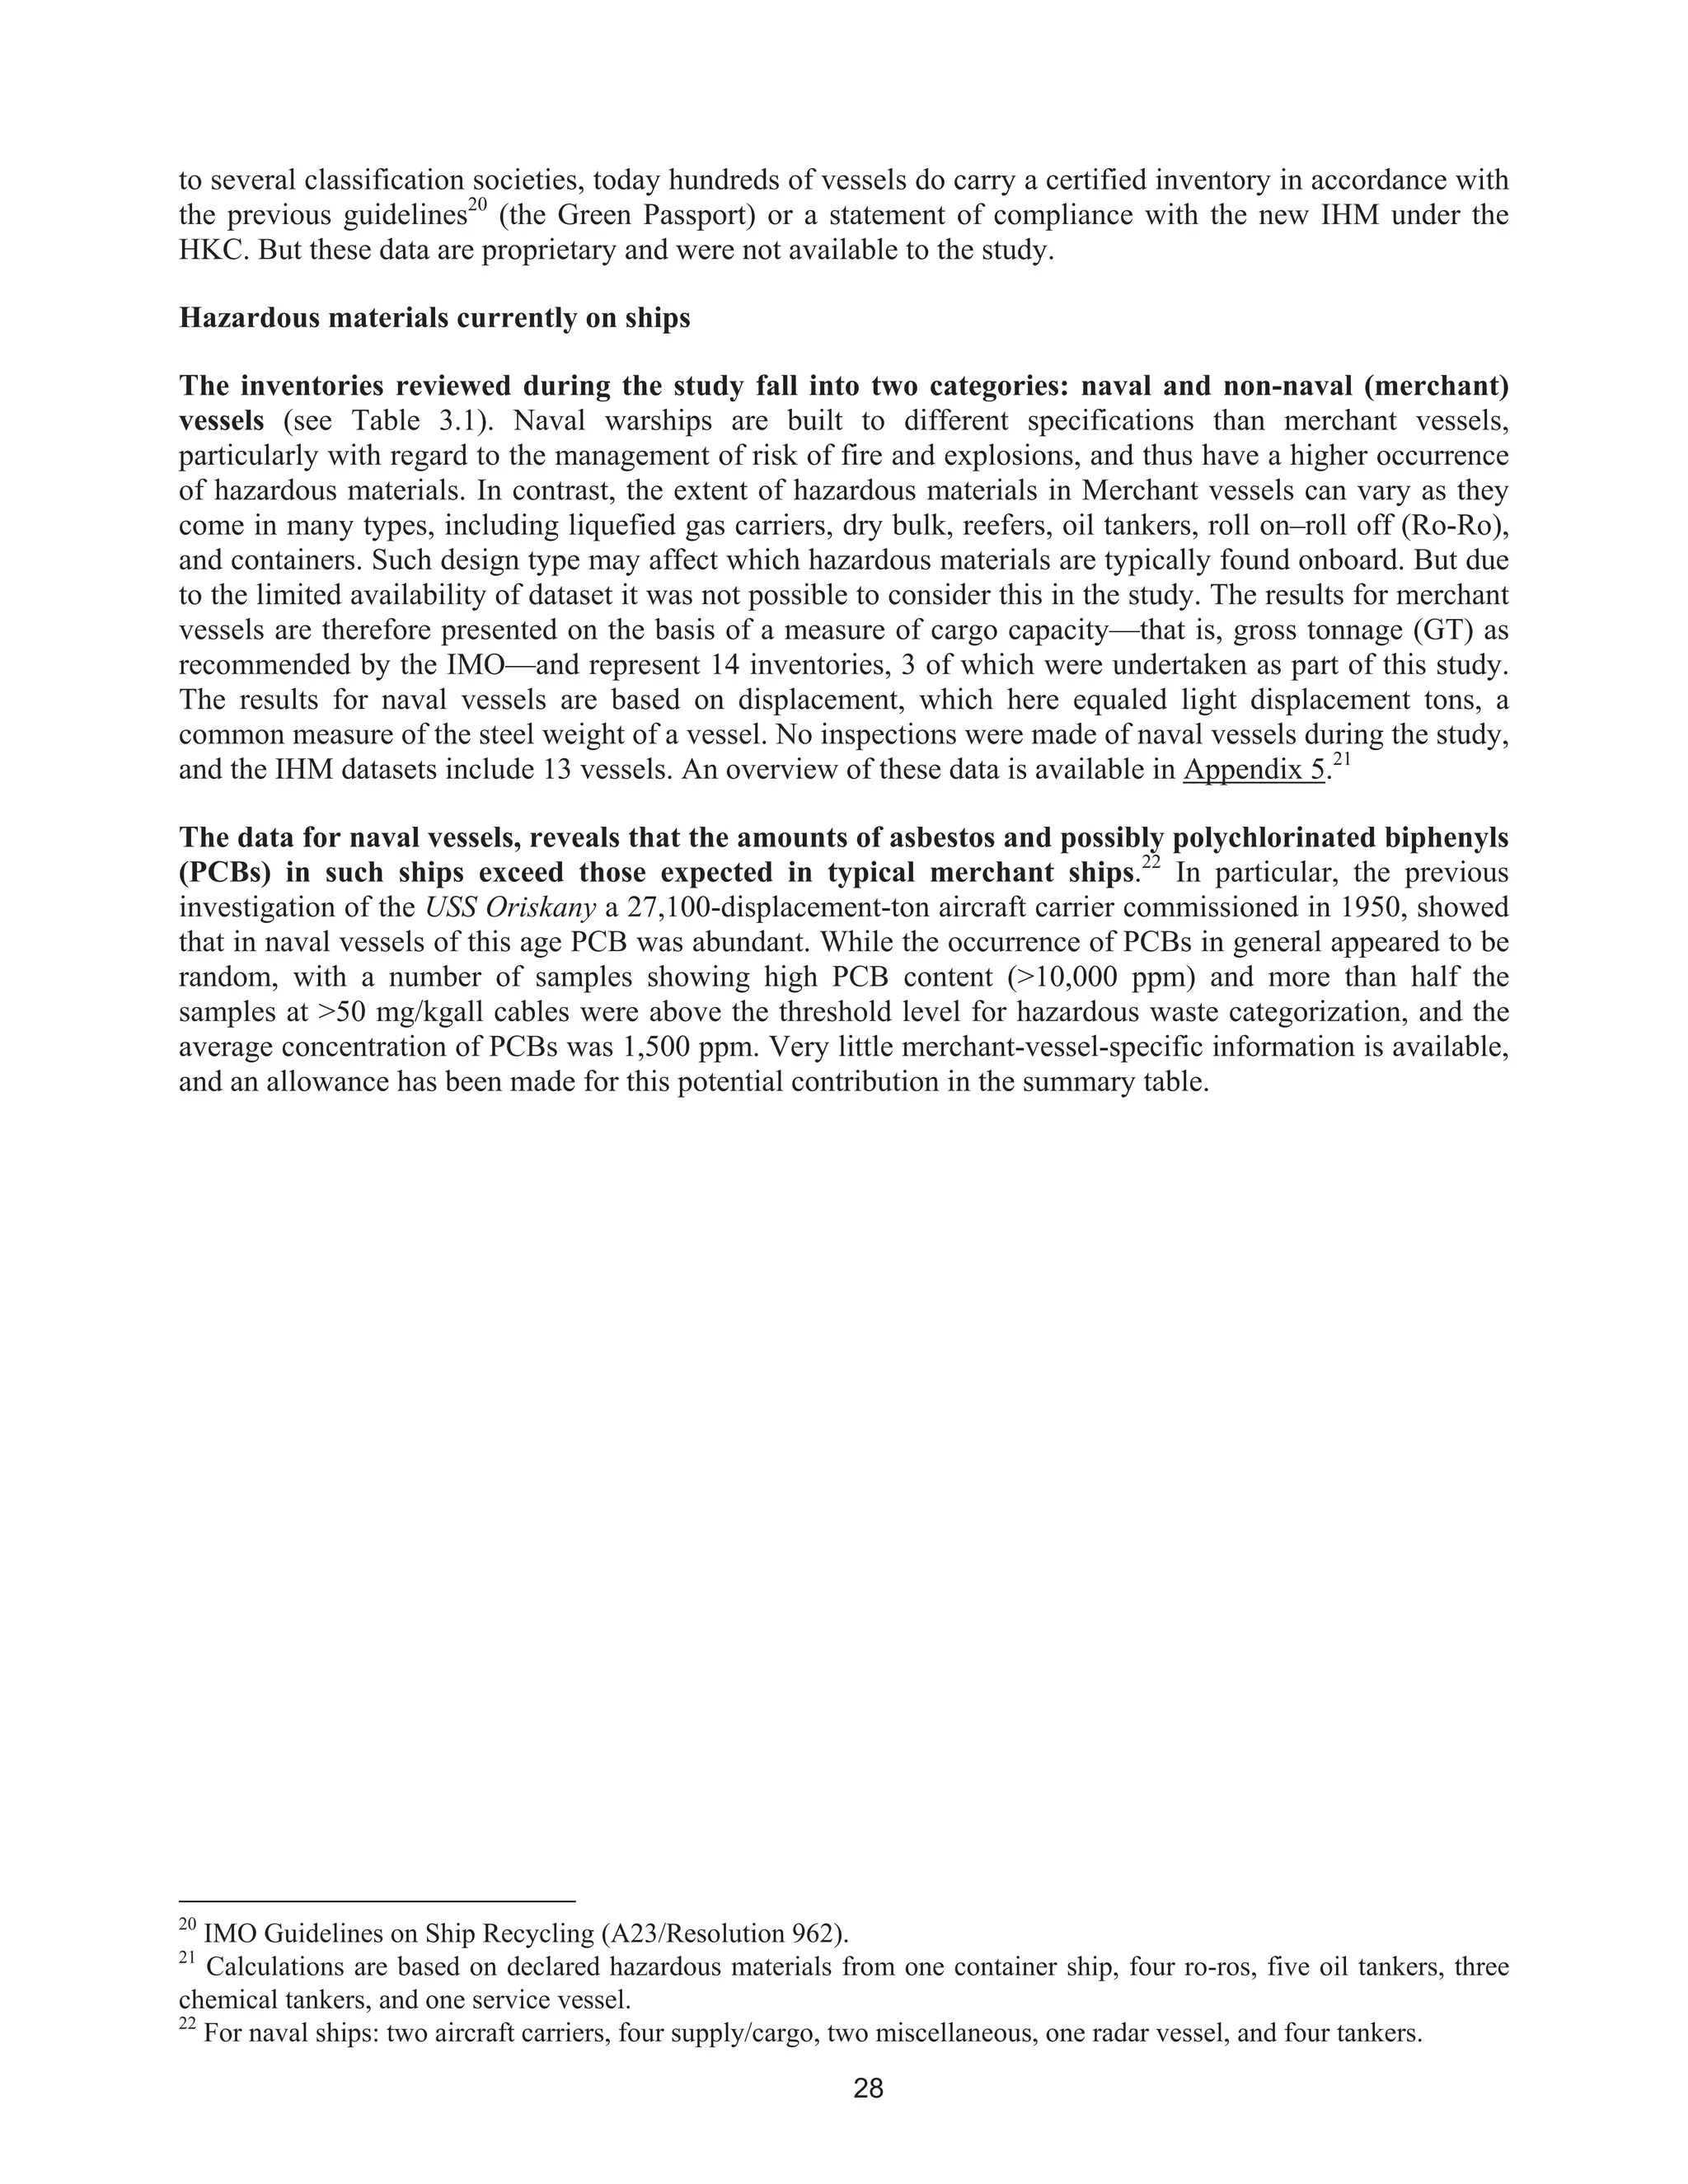
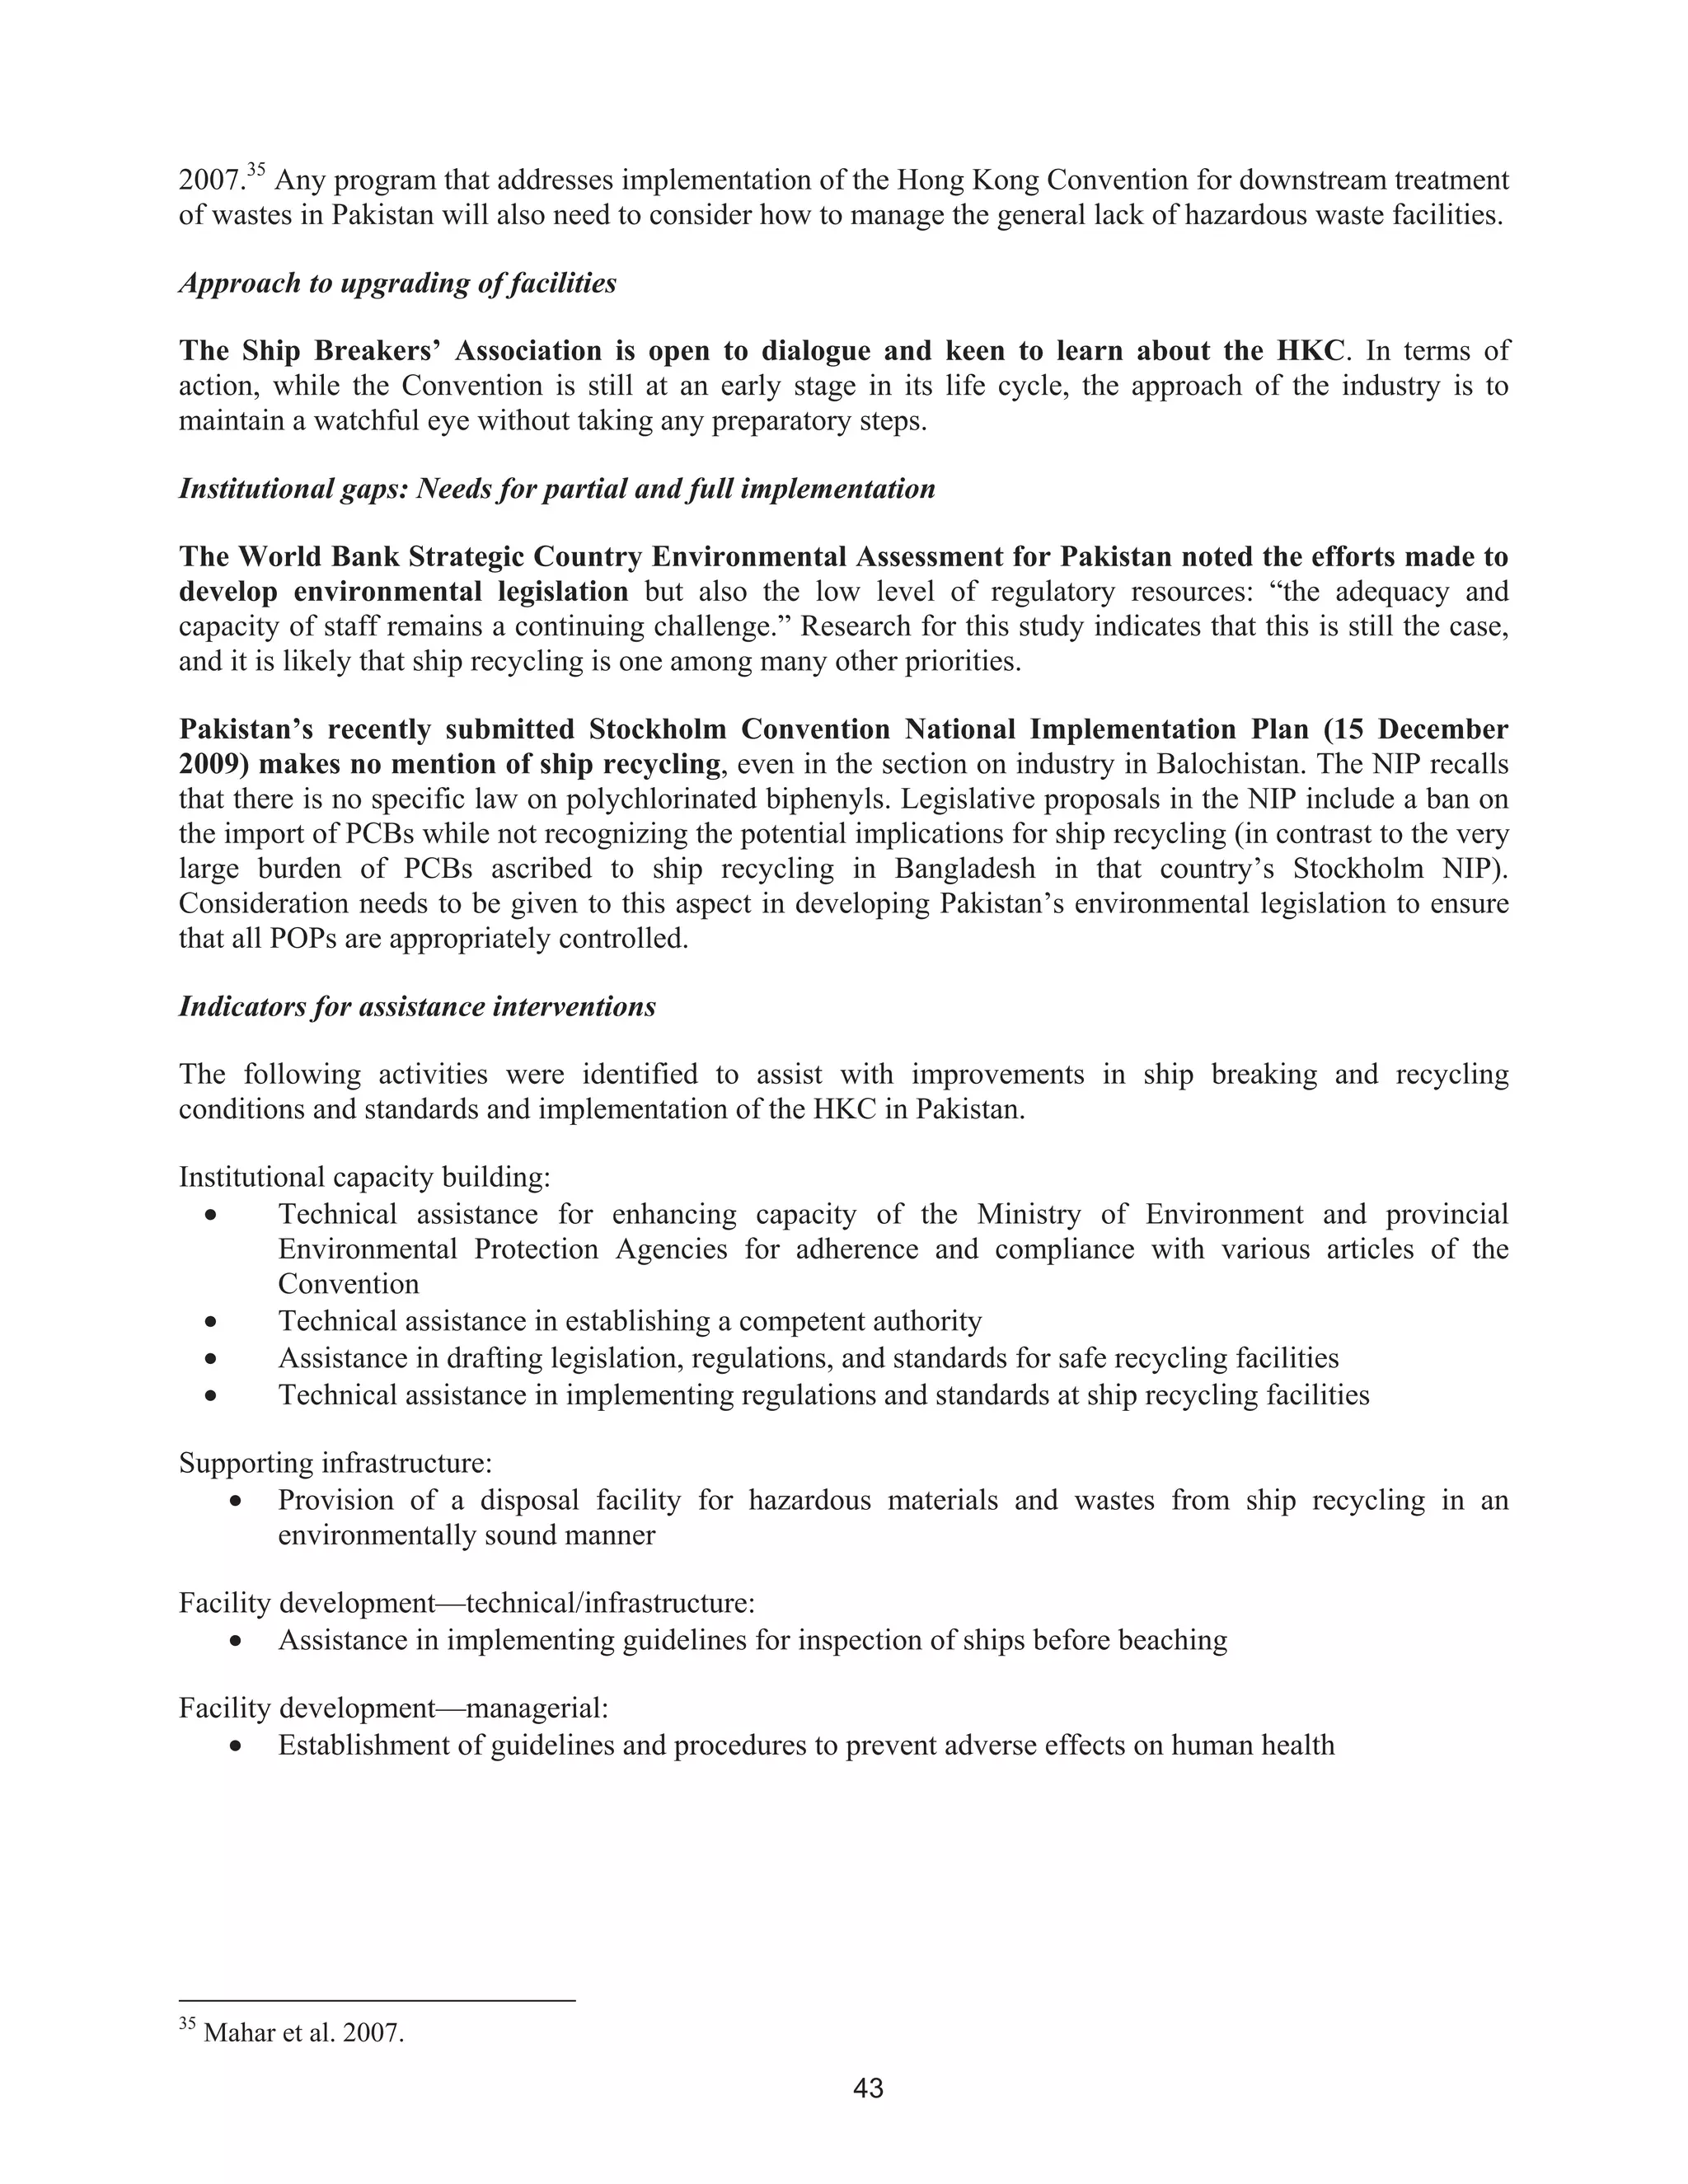
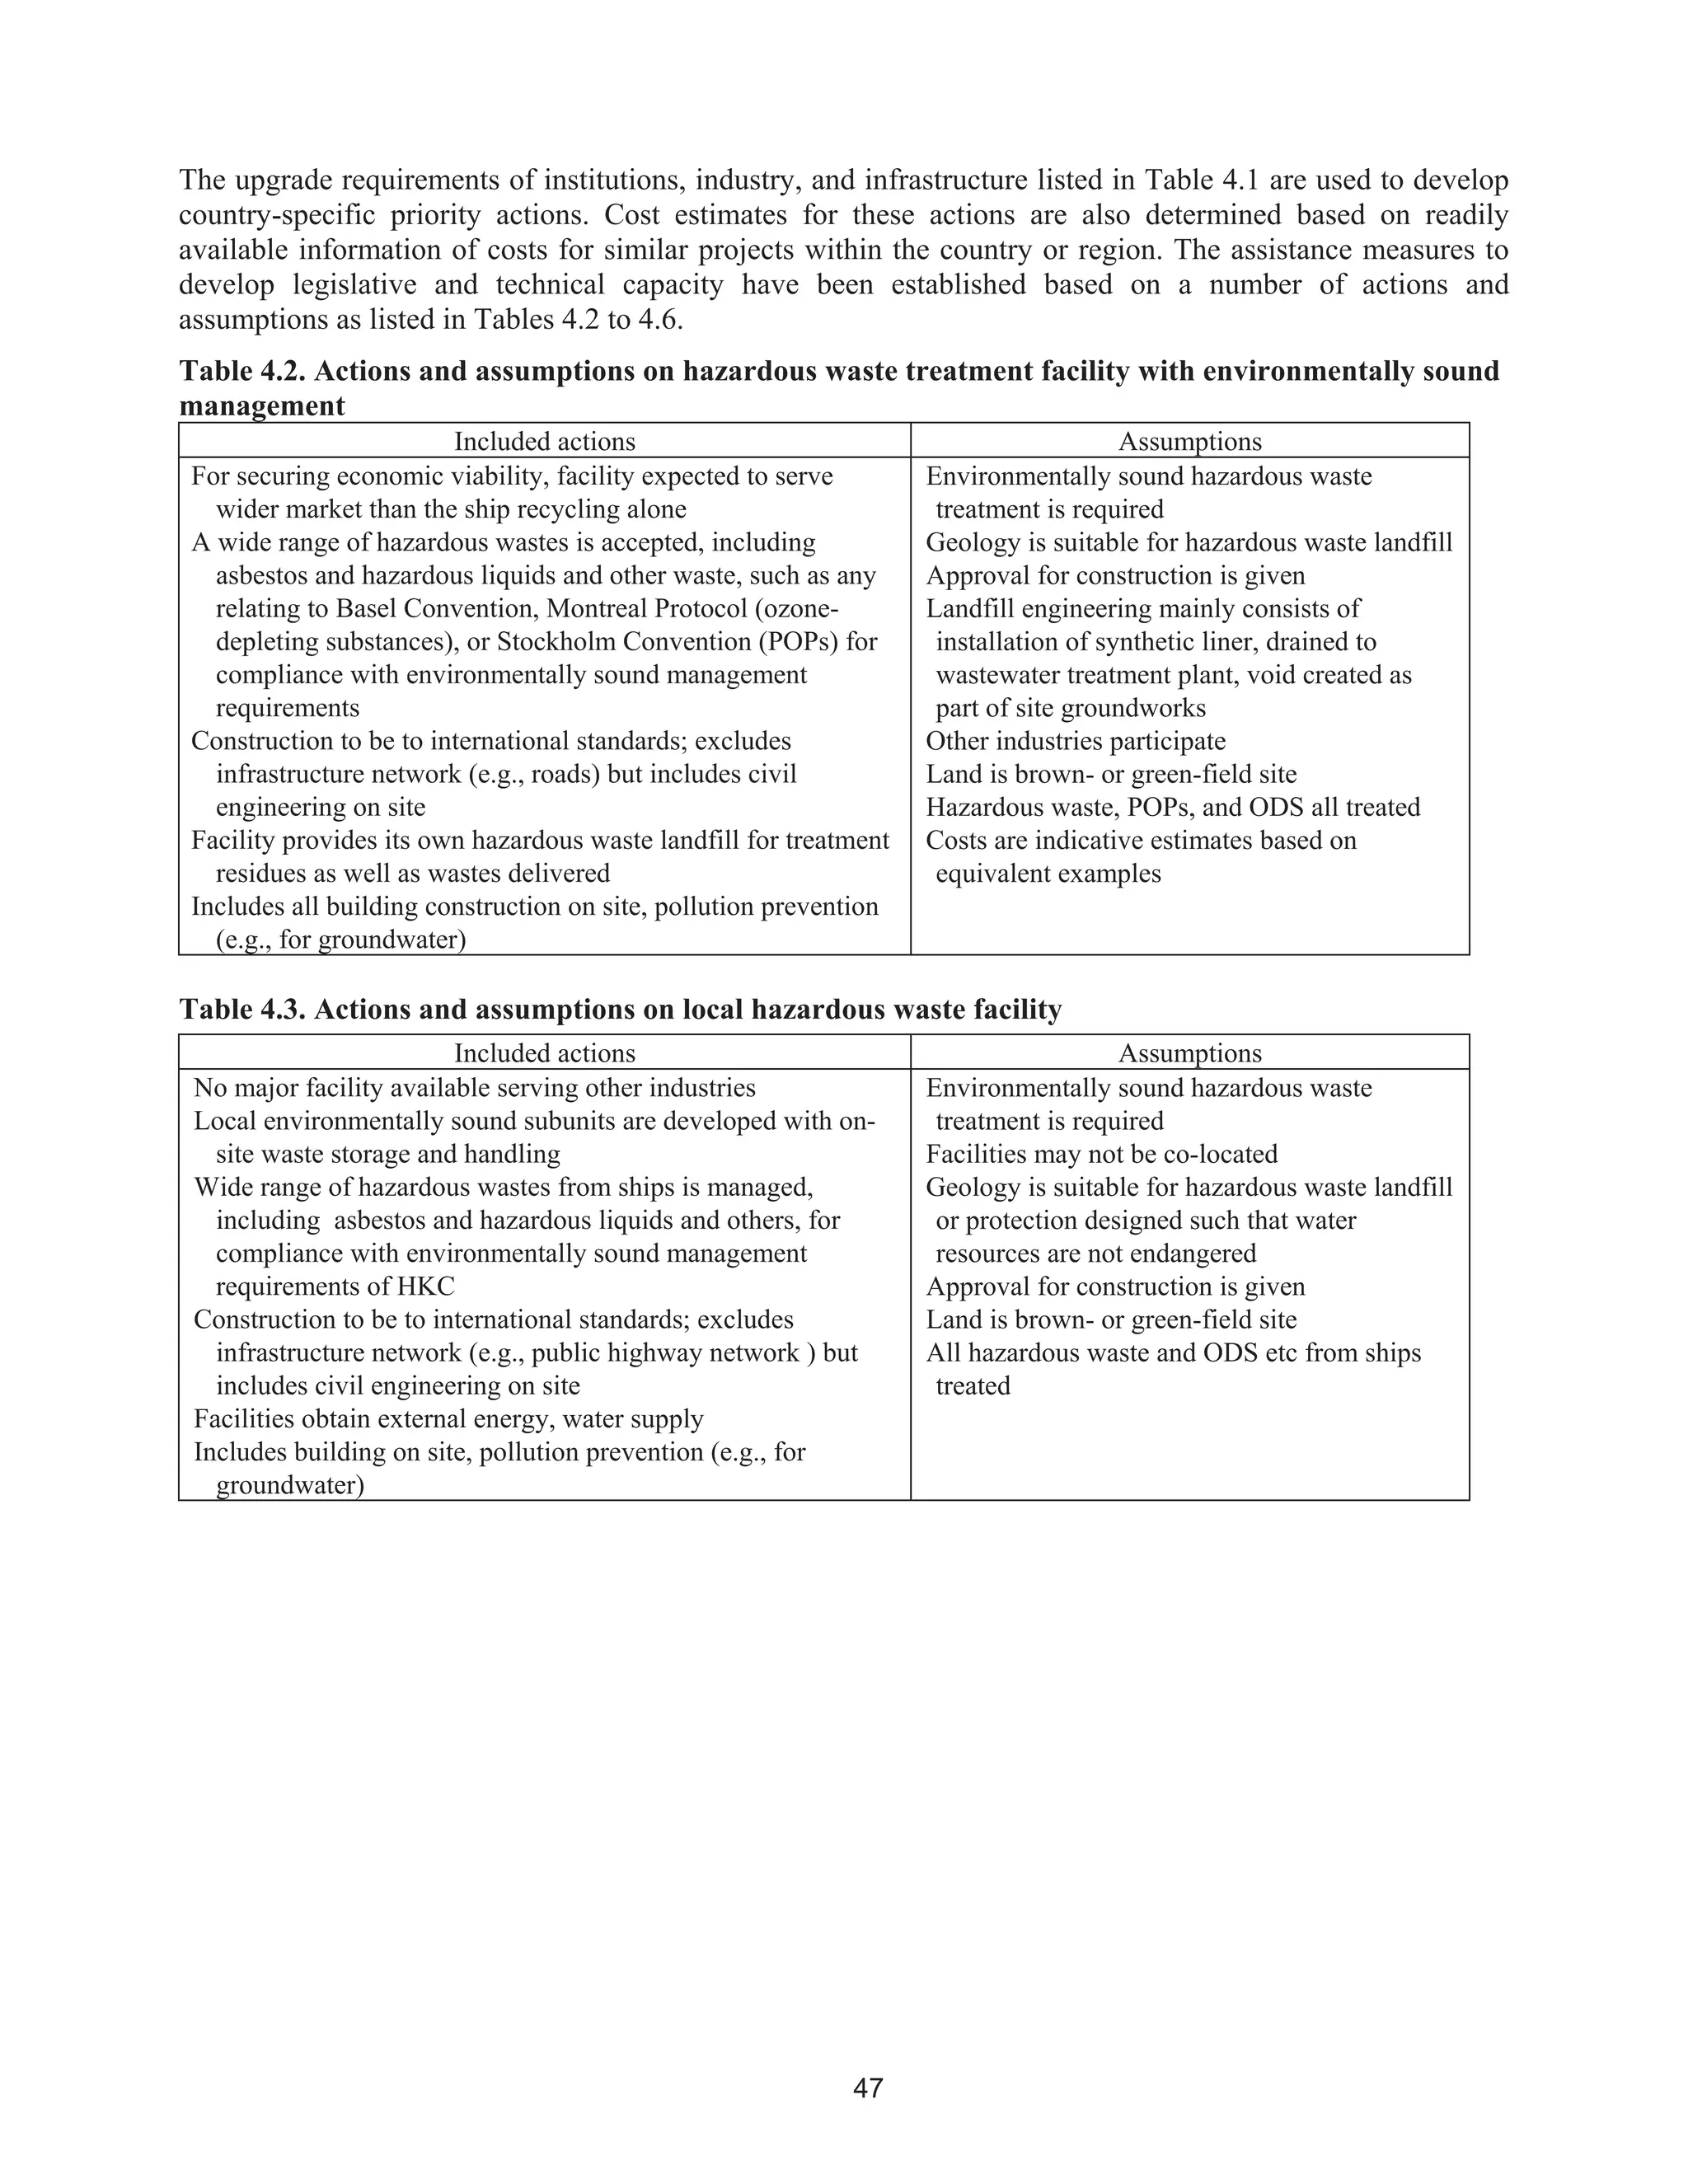
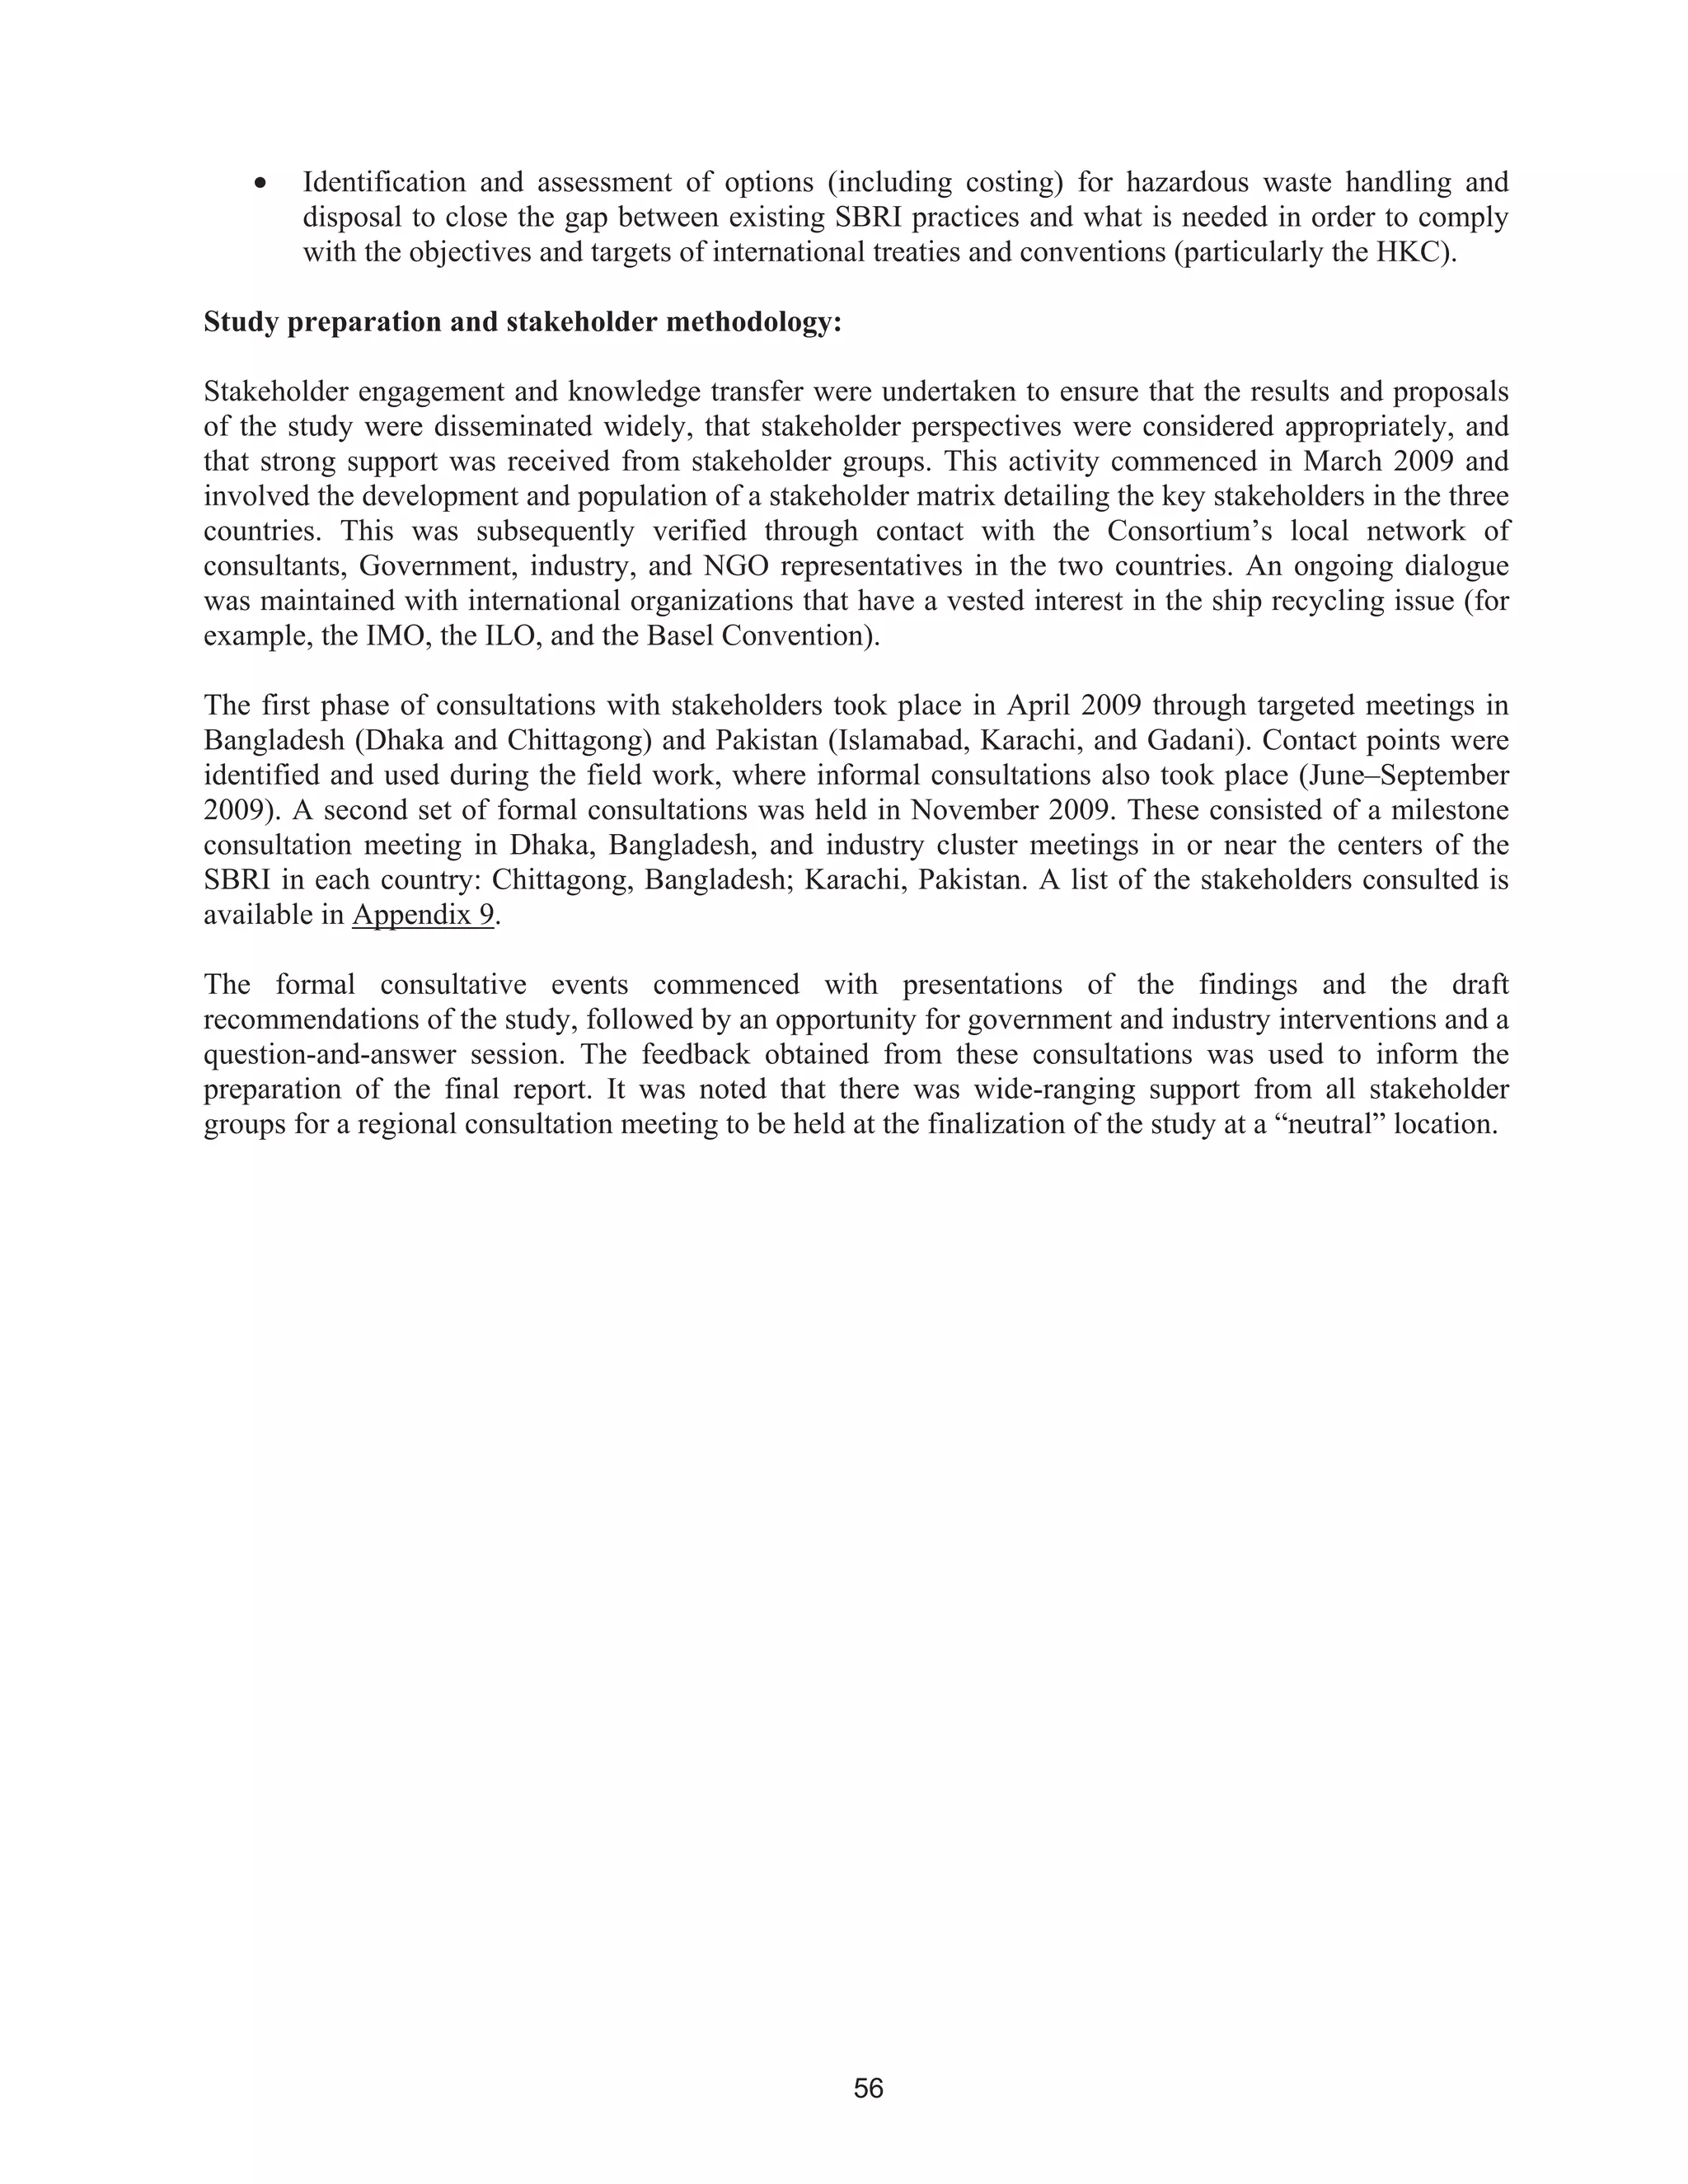
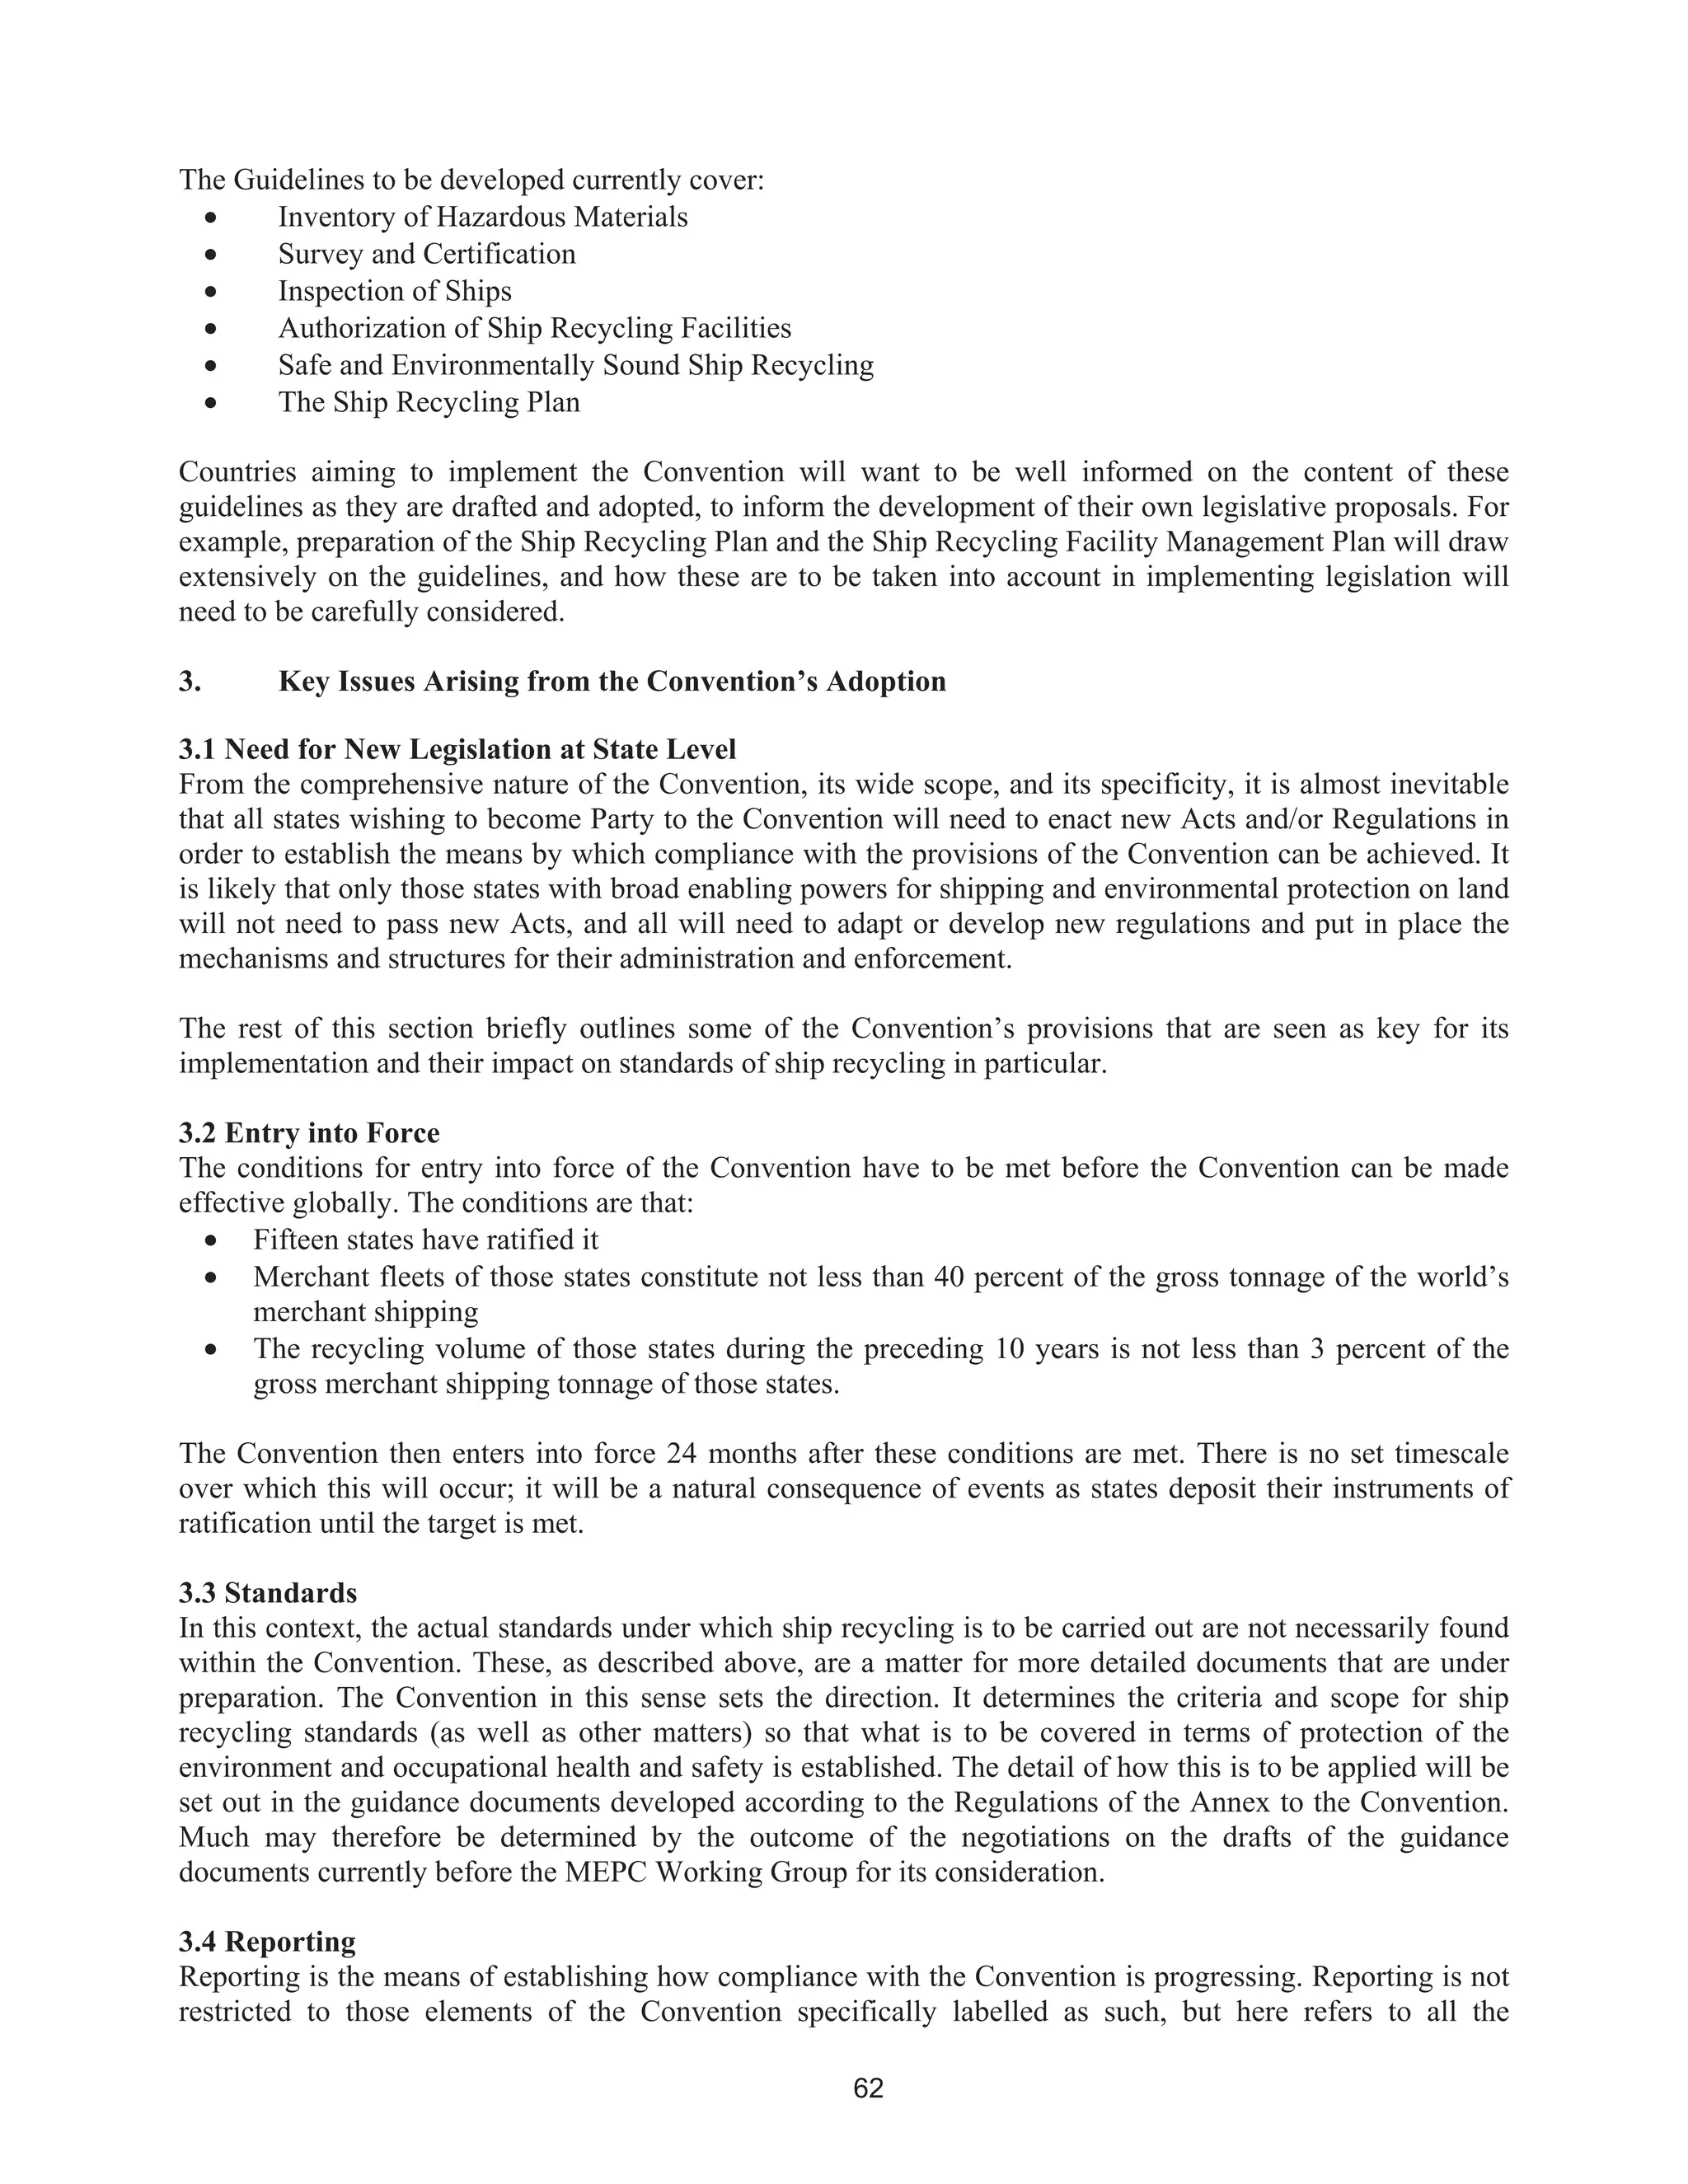
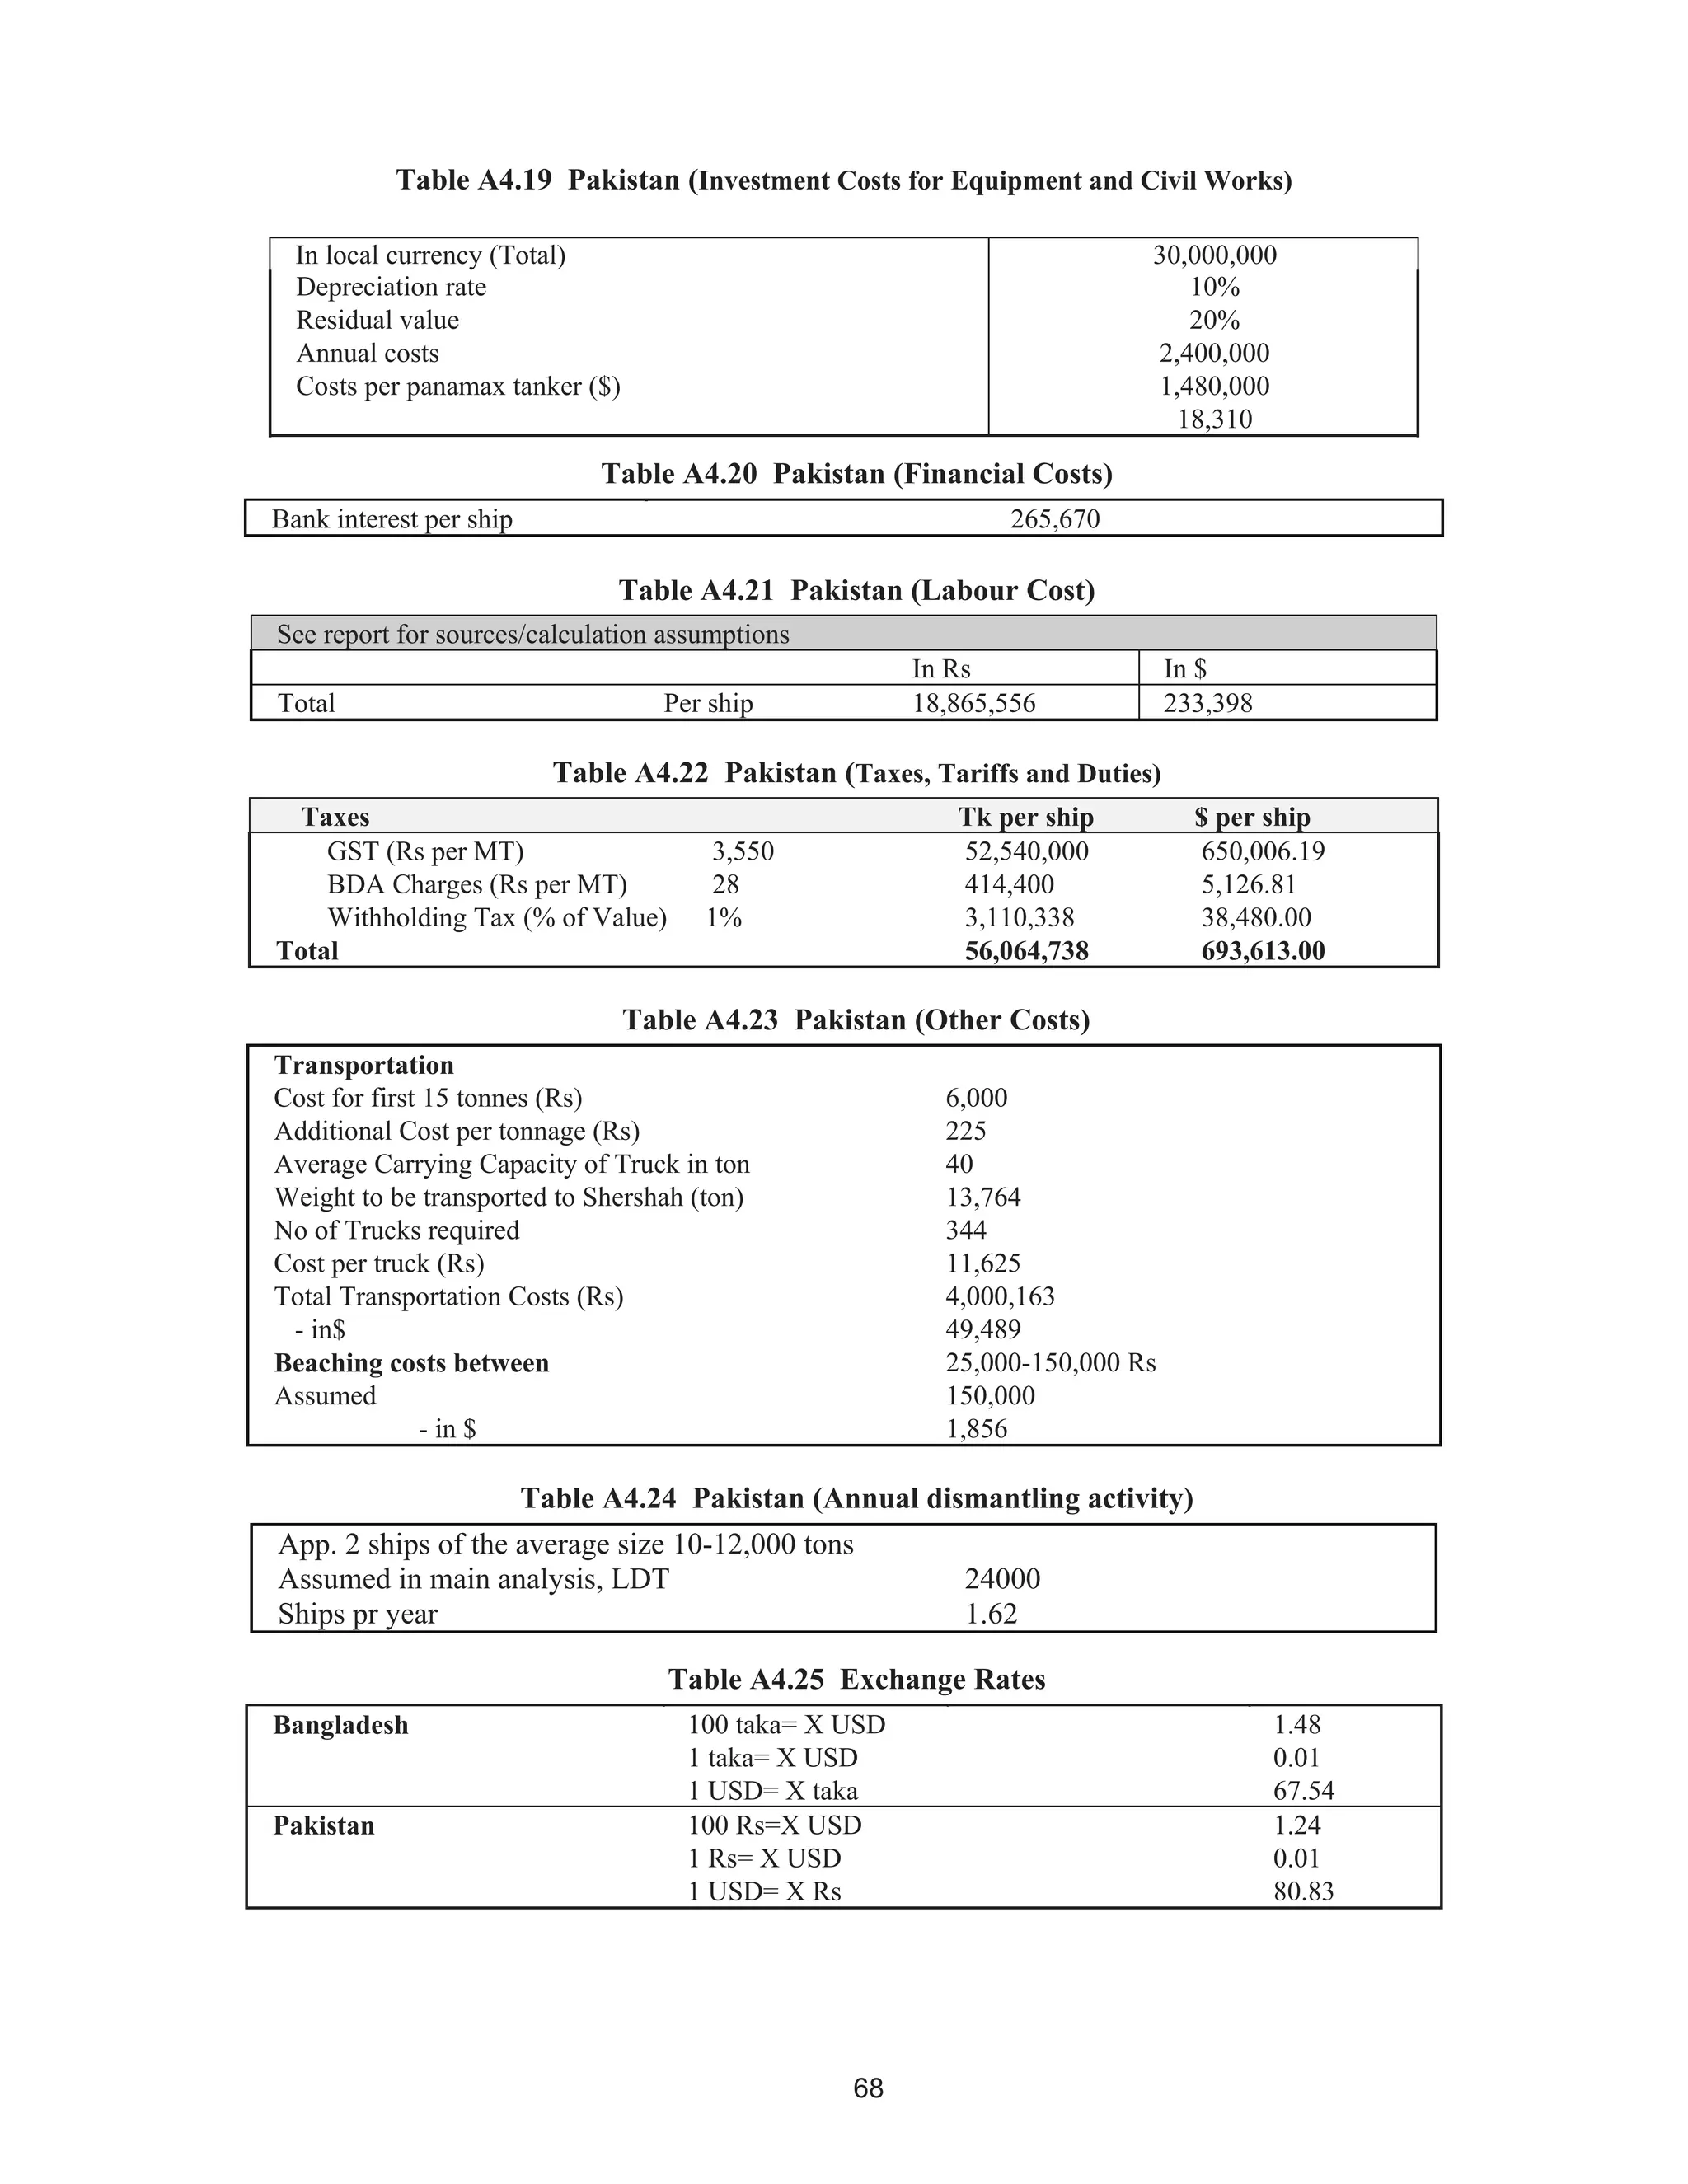
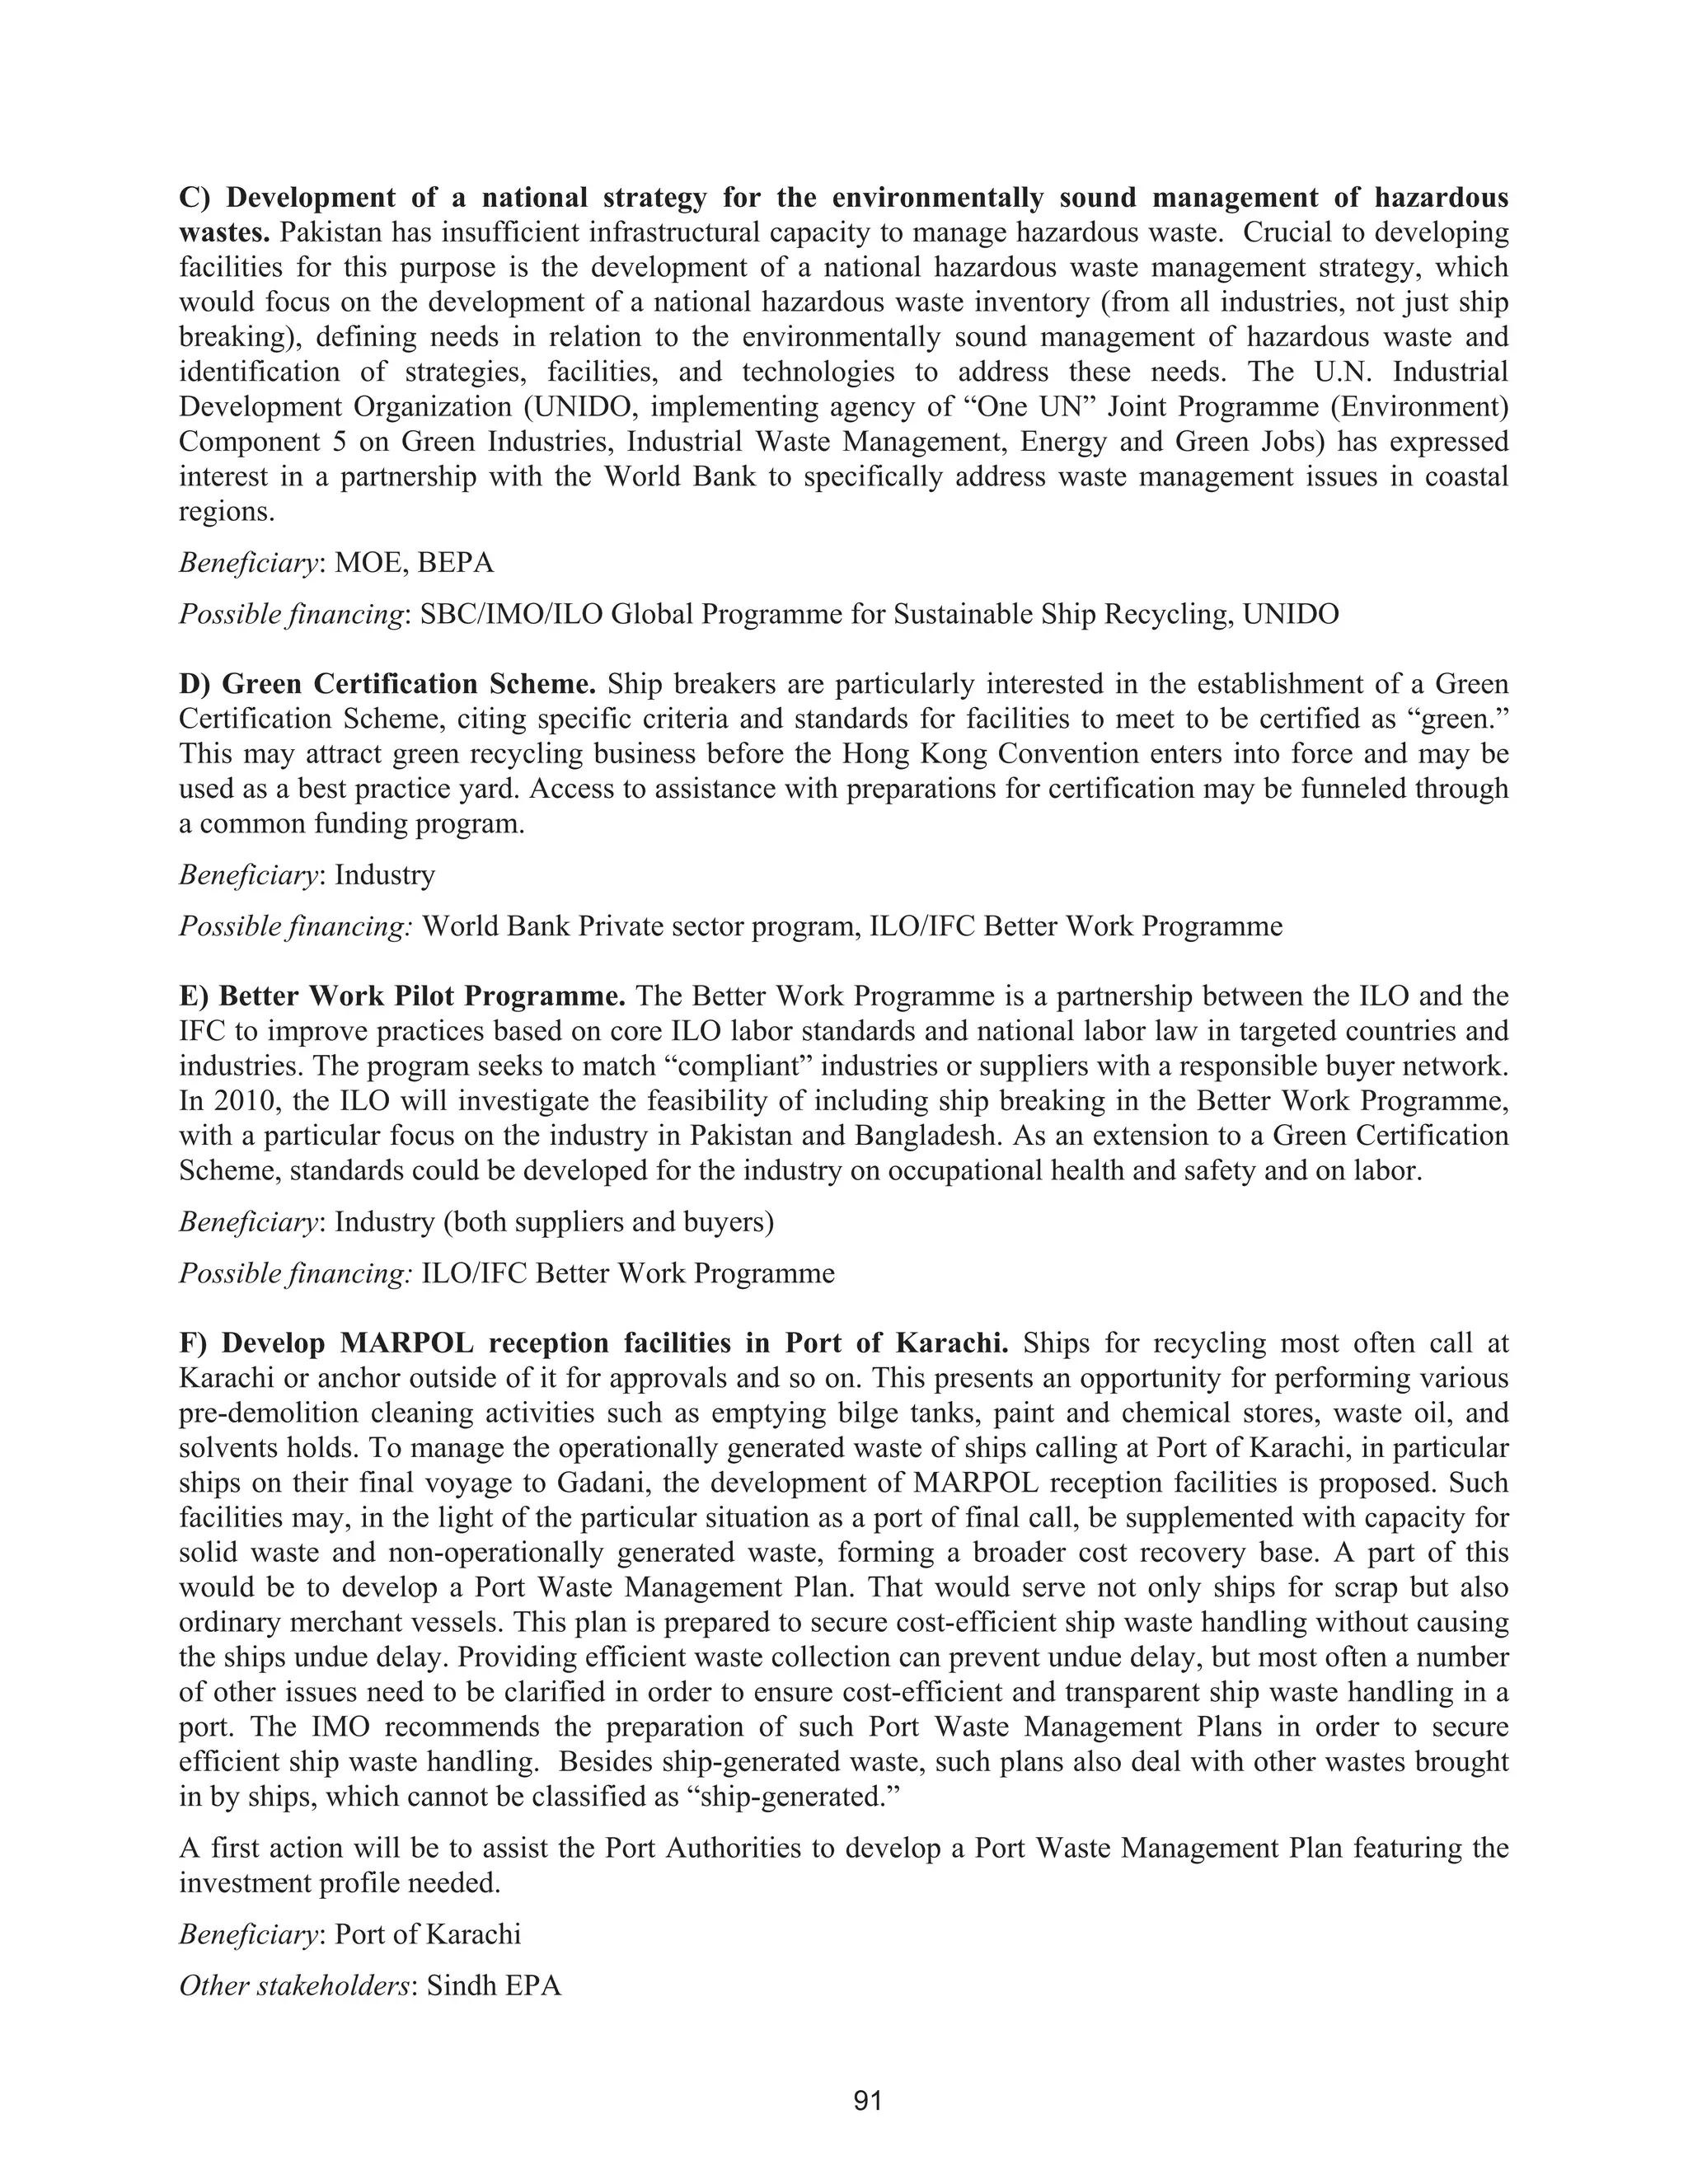
TABLEA5.2NAVALFLEET(calculationsareonthebasisofdeclaredhazardousmaterialsfromthefollowingtypesandnumbersofnavalships:two
aircraftcarriers,foursupply/cargo,twomisc.,oneradar,andfourtankers)
NavalFleet-MeanTotal
HazardousMaterialUnit
Material
Total
1000
LDT
Total
Material
/million
LDT
Rangeof
shipsize
[LDT]
Rangeof
material
Rangeof
material/
millionLDT
No.
observations
Compiledfrom
entryno.
1Asbestoston265515417222
4,700-
26,705
76-7717,088-26,41715/15
2PCB
2.1PCBliquids(transformers,etc)tonNoinformationavailable
2.2
PCBssolids(capacitors,ballasts,
etc)
ton8231495508
5,174-
26,705
13.7-286.02,574-23,83314/15
3Hydraulicoilston49311560
4,700-
26,705
749-6,1702/15
4ODS
4.1ODSliquids(CFC,Halons,etc)tonNoinformationavailable
4.2ODSsolids(e.gPU)tonNoinformationavailable
5Paints
5.1Paintsnoinfoton183538936NorangeNorangeNorange1/15
5.2Paintscont.TBTtonNoinformationavailable
5.3Paintscont.PCBtonNoinformationavailable
5.4Paintscont.Metalston120525532NorangeNorangeNorange1/15
6heavymetals
6.1Leadton0.16534NorangeNorangeNorange1/15
6.4Mercuryton2.002775NorangeNorangeNorange1/15
7RadioactivesubstanceskgNoinformationavailable
8Wasteliquidsorganicm32481321880
4,700-
14,170
0.20-237.1043-22,11115/308.1,8.2
9
Reusableliquidsorganic(HFO,
diesel)
ton347215422522
4,700-
26,705
7.0-813.575-157,22815/15
NavalFleet-MeanTotal–cont’d
HazardousMaterialUnit
Material
Total
1000
LDT
Total
Material
/million
LDT
Rangeof
shipsize
[LDT]
Rangeof
material
Rangeof
material/
millionLDT
No.
observations
Compiledfrom
entryno.](https://image.slidesharecdn.com/shipbreaking-myanmar-2014-140611041422-phpapp02/75/Shipbreaking-myanmar-2014-97-2048.jpg)

![79
Ministryof
Petroleum&
Natural
Resources
Noactiveroleorknown
legislationdirectlyaffecting
operationsofshipbreaking
activitiesatGadani
NoneGasforcuttingisprocuredfromtwomultinationalcompaniesandsogasutility
companyorgovernmentdepartmenthasnorole.
ThereisnoroutineinspectionbyGovernmentregulatoryauthorityordepartmenton
gaspipinginstalledatyards.
Oil&Gas
Regulatory
Authority
(OGRA).Or
BalochistanEPA
Noknownlegislationinplace
thatwouldrequireNOCorany
kindofapprovaltobegincutting
NOCforGasFreefor
HotWorks
Notmonitoredorcontrolledatthepresentstate.
ThisisanewrequirementunderHKConvention–Notcontrolledatthe
present.(Notyetclearwhichdepartment/authoritywouldbeinvolved)
Noknownlegislationinplace
thatwouldrequireanykindof
approvalforstartingship
breakingandrecycling
activities.
BallastWaterdisposalNotmonitoredorcontrolledatthepresentstate.
Planning&
Development
Department,
Balochistan
Government
Balochistan
Development
Authority
Balochistandevelopmentlevy/
charges
Renewalofleaseforyards
ownedbyBDA
“NoObjection
Certificate”(NOC)for
startingshipbreaking
activities
NOCisrequiredbeforeshipbreakingactivitiescanbestarted.Itisstrictly
enforced.
NOCnotissuedifdevelopmentlevy/chargesareoutstanding.
Ministryof
Finance,
Economic
Affairs,
Statistics&
Revenue
Revenue
Division-
Customs
SalesTax
[SalesTaxNotificationSRO
678(1)/2007]
WithholdingTax
“NoObjection
Certificate”(NOC)for
startingshipbreaking
operations
NOCisrequiredbeforeshipbreakingactivitiescanbestarted.Itisstrictly
enforced.
SalesTaxpaymentscheduleandwithholdingtaxpaymentisnecessaryforissuance
ofNOCbyCustoms.
Withholdingtaxisafixedratetax(1%ofthevalue)chargedregardlessof
profitabilityoftheyards.Itisstrictlyenforced.](https://image.slidesharecdn.com/shipbreaking-myanmar-2014-140611041422-phpapp02/75/Shipbreaking-myanmar-2014-105-2048.jpg)


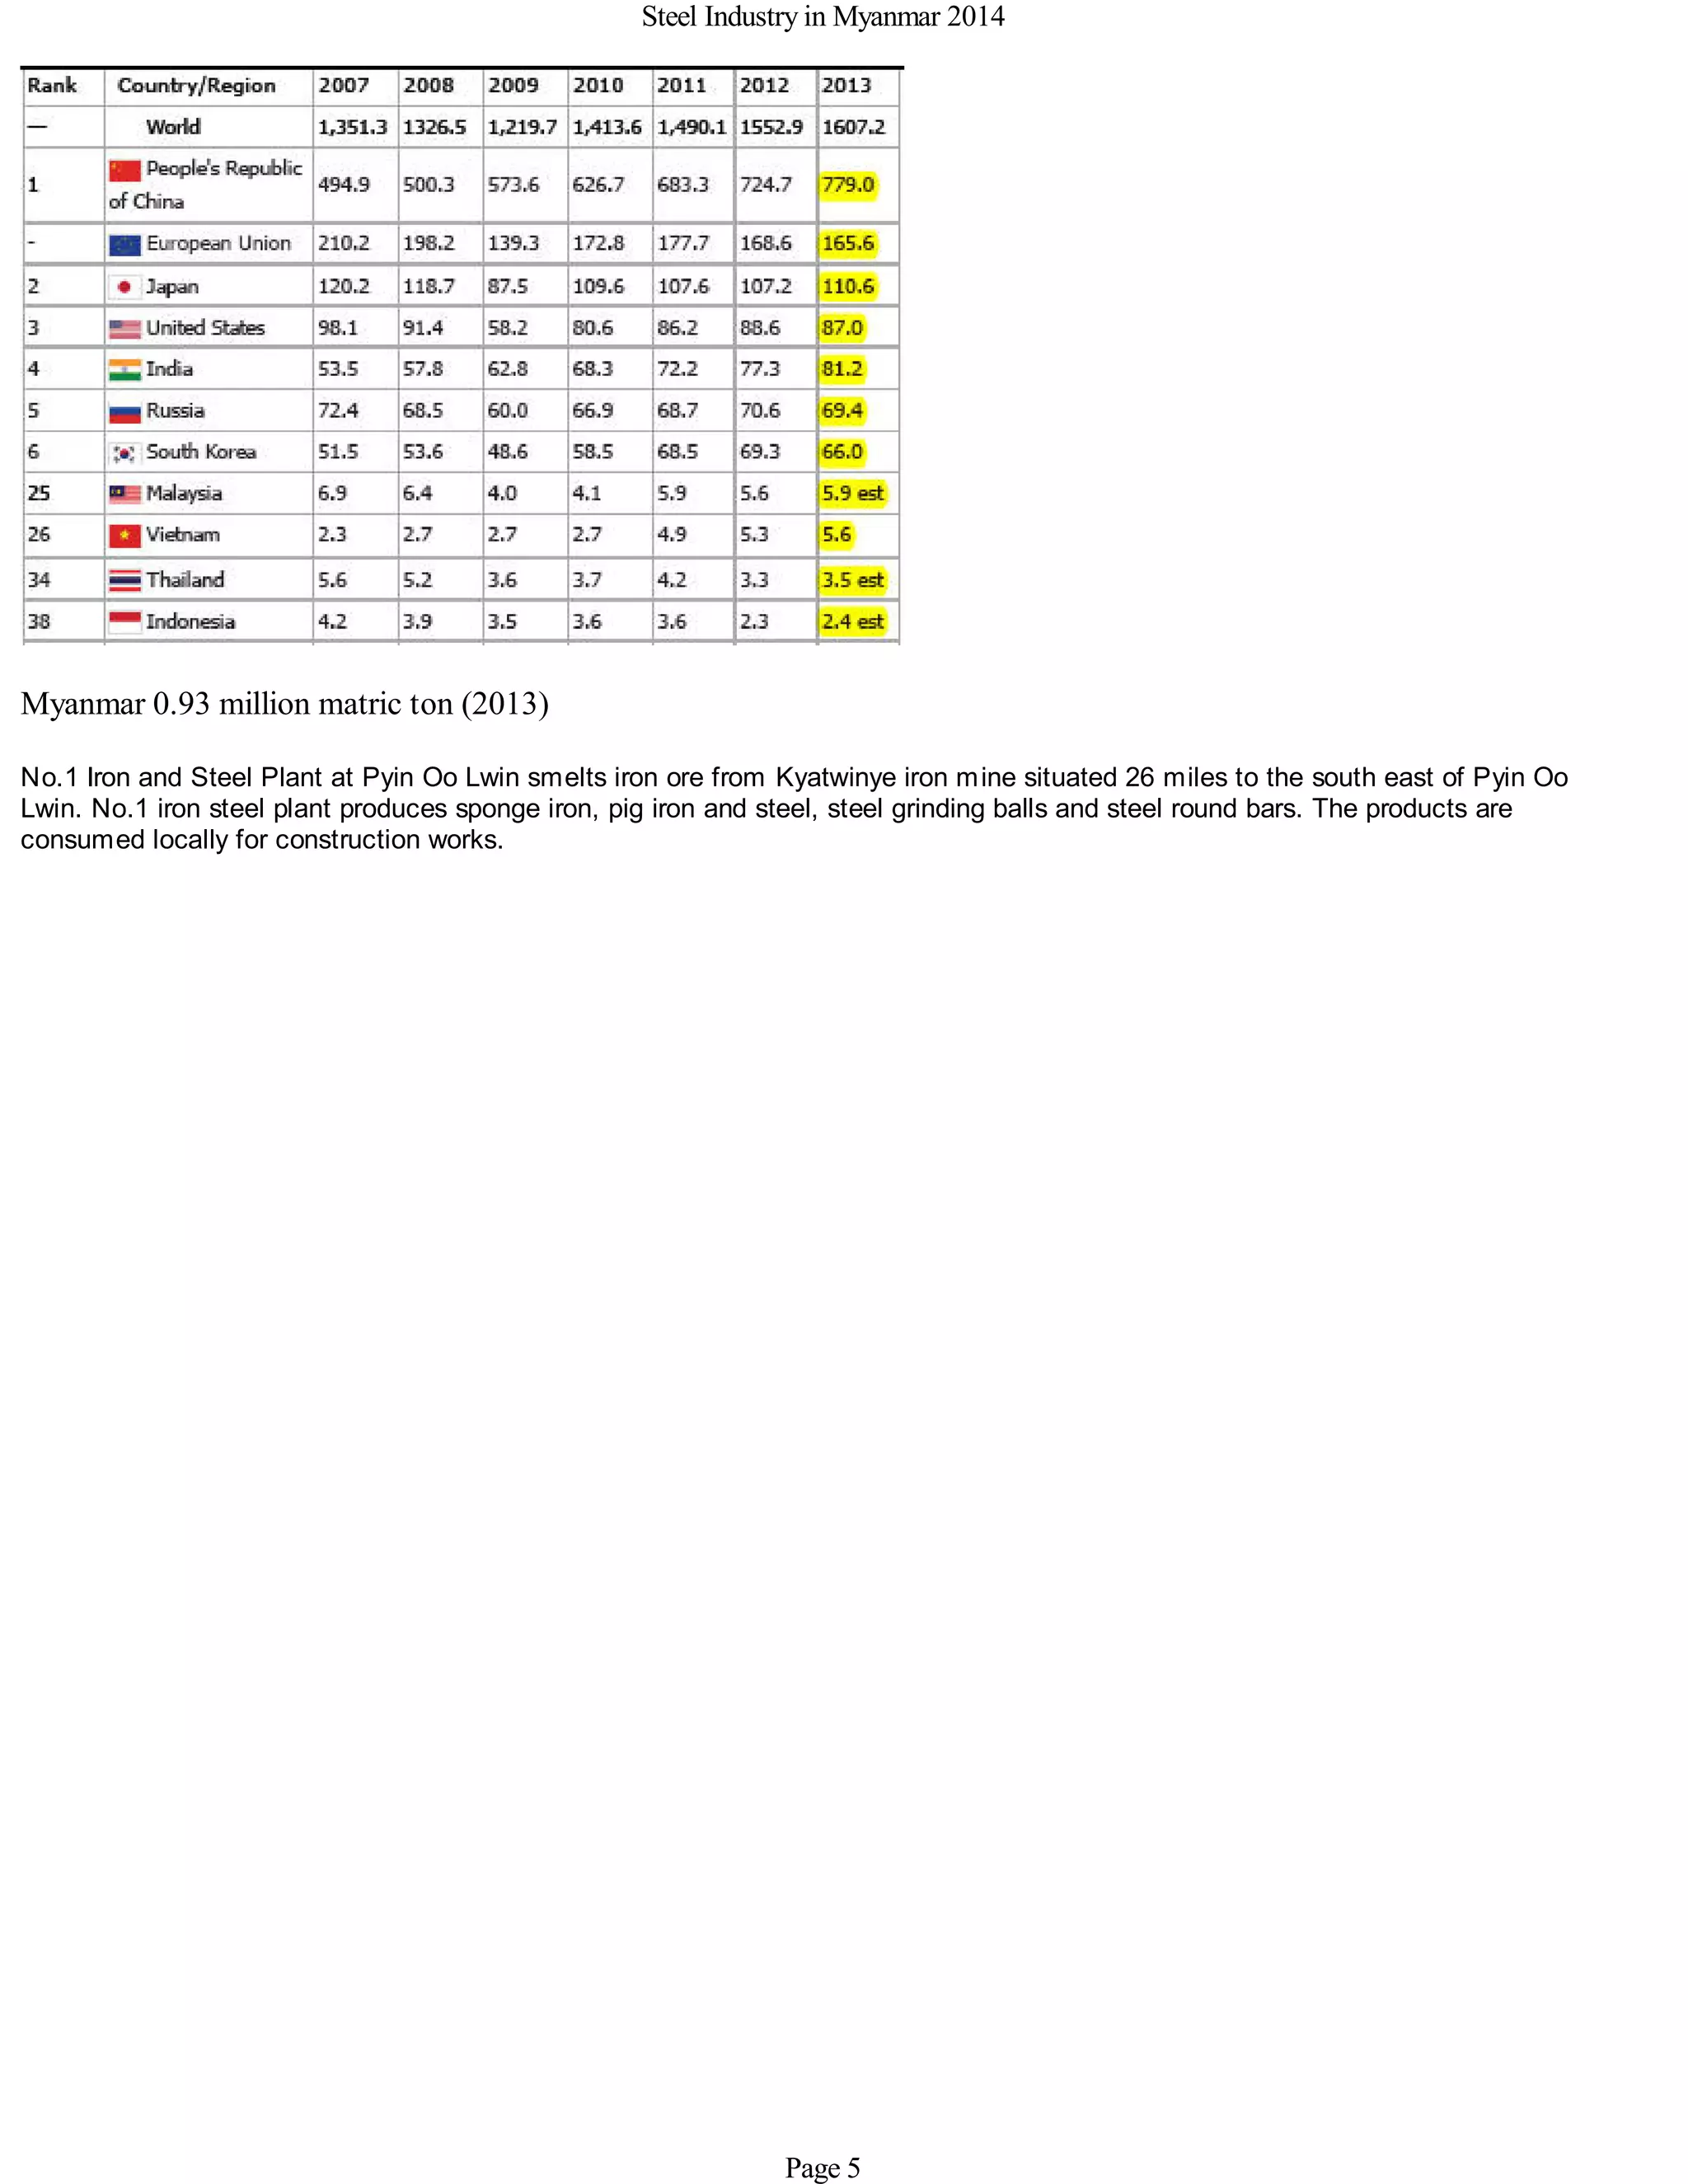
The steel industry is important for developing countries and steel production has increased significantly in countries like Europe, America, and Japan. China produces around 40% of the world's steel and has many steel mills to support its large-scale construction industry. However, China's construction industry and steel production are declining due to the slowing global economy. Steel prices in China have fallen substantially from 2007 to their lowest level in 2014. In 2013, China produced the most steel at 779 million tons, followed by Europe-CIS countries, Japan, the US, and India. Southeast Asian countries produce much less steel, with Malaysia the largest producer at 5.9 million tons. Many Southeast Asian countries import steel to support industrialization. China imports steel sheets


