CEE's Home Energy Efficiency Index Webinar
•Download as PPTX, PDF•
0 likes•700 views


Recommended
Recommended
More Related Content
Viewers also liked
Viewers also liked (15)
Similar to CEE's Home Energy Efficiency Index Webinar
Similar to CEE's Home Energy Efficiency Index Webinar (20)
More from Center for Energy and Environment
More from Center for Energy and Environment (20)
CEE's Home Energy Efficiency Index Webinar
- 1. Welcome to CEE’s Home Energy Efficiency Index Webinar Jenny Edwards and Carl Nelson September 13, 2012 We’ll start the presentation shortly. Hover your cursor at the top of your screen to access the WebEx menu bar and open your Chat window. We will use the chat function for Q&A at the end of the presentation, but feel free to ask clarifying or technical support questions throughout
- 2. Page 2
- 3. Community Energy Services key features • Extensive community engagement • Comprehensive pathway to energy savings • Good energy habits • Direct install of materials • Major energy upgrades • Contractor program w. quality assurance • Follow-up services / financing Page 3
- 4. Home Energy Visits 1½ - 2 hour visit 2 energy experts Direct installation of materials Blower door test and insulation checks iPad data collection; print report at site Page 4
- 5. [insert slide on recommendations] Frequency of Different Upgrade Recommendations Page 5
- 6. Design Features of the Energy Index Page 6
- 7. Page 7
- 8. Minnesota Home Energy Score Pilot 10 “Zone of Unattainability” 8 7 Potential Score 6 Score 5 Current Score 4 3 2 1 1 Page 8 1 Pilot Homes 154
- 9. Common approach to building asset ratings Building Energy Simulation Estimated Energy Use Model Site Data Collection Rating or Score Occupancy Assumptions Page 9
- 10. CEE Scoring Methodology Representative Housing Types SIMPLE Building Energy Model Number of Stories, House Age, Floor Area Point distribution for each retrofit Page 10 (1 story home)
- 11. CEE Scoring Methodology CEE Energy Index API In-Home Data Collection Page 11
- 12. Example: Wall Insulation 40 35 30 25 Wall Total Points 20 Insulation 27 points 15 Wall cavity of R-3 1-story 1920’s home; gives 9 points Recommended 10 insulation: R-11 9 Total points = 27 5 points 18 available Points 0 Page 12
- 13. Summary of Early Experience + CEE has delivered 447 scores in Minneapolis and St Louis Park + Score does not add appreciable time increase to visit + Positive reaction: Homeowners respond to having a good grade, and staff have tool to back up recommendations + Priorities of action are clear from point system + Compared to giving recommendations without a score: + Low available points can be a hurdle for action + However, this is justified – we are applying the pressure to act where there are more savings Page 13
- 14. Score Distribution 100 90 50% of homes score 80 a 73 or higher 70 CEE Energy Index 20% of homes score 60 an 85 or higher 50 40 30 20 10 Based on 447 Homes 0 0% 20% 40% 60% 80% 100% Page 14 Percent of Homes
- 15. How different housing types score Percent of Total Page 15 Home Energy Index
- 16. Which upgrades offer the most points? 76% of points come from immediate, cost- effective recommendations Page 16
- 17. Relationship between Index and Site Energy Use 10 9 8 Gas Use Intensity Index 7 6 5 4 3 2 y = -0.046x + 8.062 R² = 0.308 1 0 0 20 40 60 80 100 Page 17 CEE Energy Index
- 18. Next Steps + Partner with other groups to deliver the score in new regions + Offer certificate of completion when homeowners have made upgrades + Investigate the impact of the score on homeowner follow through. + Consider refinements such as accounting for ‘above- and-beyond’ energy retrofits, e.g. PV Page 18
- 19. For More Information Visit the Innovation Exchange website: http://mncee.org/Innovation-Exchange/Home/ Contact Jenny Edwards: jedwards@mncee.org (612) 335-5873 Next Webinar: Using Tablets to Collect Data in the Field November 8, 2012 – 12:00 pm CST http://mncee.org/Innovation-Exchange/ Events-and-Webinars
Editor's Notes
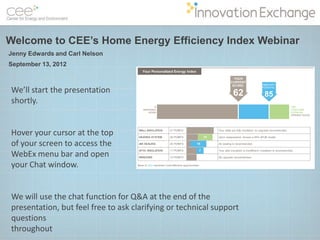
- JennyPrimarily designed for existing-home retrofits.Used by field staff during a home audit to help communication what needs to be doneGoal was: something easy and quick to apply for staff; quantitative rigor; easy visual design and communication for the homeowner25 data points
- Community Energy Services is a residential energy-efficiency program started nearly 3 years ago. Started in Mpls. – 5,000 homes. Recently started in adjacent suburb – SLP – and plan to expand to other cities comprehensive home performance program Marketing for the program involves extensive community engagement; partnering with neigh. groups, hosting community workshops, active presence at community events The program is designed to be a comprehensive pathway to energy savings and, we work to get energy savings through good energy habits (behavior change), direct install of materials like CFLs, and most importantly through major energy upgrades, including air sealing, insulation and HVAC replacement We maintain a list of qualified insulation contractors, who are required to go through our training and become BPI certified (insulation/air sealing installer cert) We also provide assistance to homeowners in completing upgrades, including providing financing The program is primarily funded by Xcel Energy and CenterPoint Energy, with additional assistance from the cities, and the in-home visit component of the program is part of the utility’s Home Energy Squad program.
- The Home Energy Visit itself is conducted by two energy experts – an energy counselor and an energy technician. The counselor primarily assists with the direct installation of materials, including door weatherstripping, programmable thermostats, showerheads, CFLs, and a couple other items. The energy technician conducts a blower door test, checks and records insulation levels, conducts a combustion safety test, and prepares the recommendations report for the homeowner. All data is collected by iPad, and the report for the homeowner is printed out at the site.
- Our primary objective in creating our energy rating was to help increase the number of CES participants that completed upgrades. We wanted to create a tool that would provide a clear prioritization of the upgrades needed in the home, and -- by tapping into all of our natural desire to achieve good grades – to provide an additional mechanism to persuade the homeowner to complete upgrades.This goal led to the following design Principles:First and foremost we wanted to provide actionable information about upgrades needed in the home; that is, we wanted the score to link directly to the recommendations that our technicians were making in the home related to major upgrades. Thus, the points in our score should be based on what the homeowner can do; in our case, there are 5 categories. The homeowner is not going to change their window orientation, so we didn’t want to include a value for that in the score. We just wanted to include what can be cost-effectively done in that particular house, and whether or not it has been done or not. And we wanted to include immediate and long term recommendations. Typically, a long-term recommendation would be to replace upon failure with the most efficient model. It is worth pointing out that our focus on major upgrades means that we were looking for what is called an “asset rating”, or one that focuses on the home, and not the energy implications of the behavior of the occupants. So, actionable information.We also wanted homeowners to be able to achieve a perfect score – when homeowner has done everything cost-effective for that house type. This is really important if the tool is to be motivating for the homeowner. We want the homeowner to feel the satisfaction of getting a perfect score when they’ve done what we recommend.Easy-to-understand design to clearly communicate to homeowners.Minimal time to collect data. We wanted to minimize adding any unnecessary time to collect additional data that we wouldn’t already be collecting for our recommendations. We wanted something with sufficient quantitative rigor that is appropriate for good homeowner decision making. You don’t need a complicated building simulation model to support sound, science-based decision making.
- CarlHomeowner receives the score as part of a full report
- A lot of people say to us why another rating system? Doesn’t the world have enough rating systems? Well, we agree, and we looked quite carefully at several others before we decided that none of them would meet our design criteria. One of the main contenders was the DOE’s Home Energy Score. We like a lot of the aspects of this, enough so that we signed up to be one of the 11? Home Energy Score pilot cities. What you are looking at are the results of the scores from the 154 homes in this pilot. In gray is the distribution of current scores, and the blue is the increase they would receive in the score if they implemented all of our recommendations. As you can see, none of the homes are able to get to a perfect score after implementing the recommendations, and some of them are still quite low scores. We call this the “zone of unattainability”. While this is a more accurate method of comparing scores across homes, we found that it did not help with motivating homeowners to do the upgrades. Since this is our primary goal in implementing the rating, this was a major reason we chose to create our own rating. Another reason was that we can customize the rating to the specific recommendations that we make in the home, which is different than other parts of the country. Minnesota homes, for example, do not typically have ducts outside the conditioned space of the home, so this is not a major recommendation for us, although it may be in many other areas of the country.
- In theory this is a direct way to understand the energy use of a home, but there are challenges:it is also a challenge to collect all the necessary data in a timeframe that is reasonable for residential audits. And you are often spending time collecting information that impacts the energy use, but that a homeowner cant change, such as the color of the roof or the orientationThis approach provides a consistent way to compare across a populaition homes, but that means many homes end up scoring poorlAlso it is very hard to predict building energy use. It is easier if you have perfect information, but in the case of a field tool for retrofits, you rarely have the resources to collect perfect info about the home. So for these reasons CEE took a different approach.
- What CEE did is different in a fundamental way. Instead of modeling a specific houseThe points available reflect what is cost effective for that home. So for example the points available for wall insulation will be the energy savings available from insulating a home up to its full cost-effective level. For homes here that is (R-30??) – Different for newer homes?
- Then, at the time of the home visit, we collect data on the specific state of the house. We arent modeling its enegry use, but we are measuring how close it is to its full cost-effective potential. Our staff send the data to our Index APIMeasure weights are based on housing type, and the score is based on the homeWe call this a “prescriptive approach with quantitative weighting”
- For this example a home was built in 1910 and it is 1 story – so it has a 2x4 wall cavity. The recommended level of insulation is R-30. plugging that into an energy model gives the weighted value of wall insulation at 27 points. So that takes into account the fact that a one story home has less wall area than a two story home – it will have fewer points available. 2x6 home is R-19…The state of the actual home is (empty walls)MAYBE use the label we actually have
- Carl
- Overall distribution of scores
- This shows where homeowners can get the most points. Like carl’s slide from earlier it shows which measures are being recommended, but also what the relative savings from those different upgrades is. About ¾ of all points are from near-term, cost effective measures. Wall insulation offers the largest potential, but a fairly even distribution across the different measures. The exception is windows, less than 1% of points is from windows. Future points are mostly from the heating system, when we recommend that the owner get a more efficient version when they replace their current model.
- For those of you that know something about energy model, the R2 for a field asset tool this is pretty good. Obviously a lot of other factors – occupant behavior is a huge oneAccurate enough for us to feel confident giving recommendations
- Ultimate questions is: does this get people to do what we want them to?