Privatization and Disinvestment - Meaning, Objectives, Advantages and Disadva...
Indionesia
1. INDONESIA
A. MARKET FOR FRESH FRUITS AND VEGETABLES
1. Market Trends and Opportunities
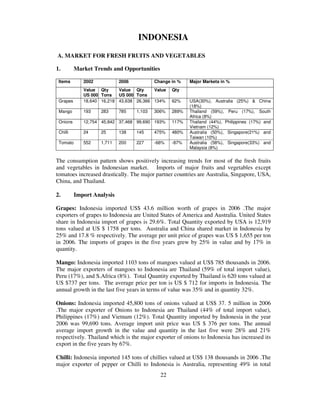
Items 2002 2006 Change in % Major Markets in %
Value Qty Value Qty Value Qty
US 000 Tons US 000 Tons
Grapes 18,640 16,218 43,638 26,366 134% 62% USA(30%), Australia (25%) & China
(18%)
Mango 193 283 785 1,103 306% 289% Thailand (59%), Peru (17%), South
Africa (8%)
Onions 12,754 45,842 37,468 99,690 193% 117% Thailand (44%), Philippines (17%) and
Vietnam (12%)
Chilli 24 25 138 145 475% 480% Australia (50%), Singapore(21%) and
Taiwan (10%)
Tomato 552 1,711 200 227 -66% -87% Australia (58%), Singapore(33%) and
Malaysia (8%)
The consumption pattern shows positively increasing trends for most of the fresh fruits
and vegetables in Indonesian market. Imports of major fruits and vegetables except
tomatoes increased drastically. The major partner countries are Australia, Singapore, USA,
China, and Thailand.
2. Import Analysis
Grapes: Indonesia imported US$ 43.6 million worth of grapes in 2006 .The major
exporters of grapes to Indonesia are United States of America and Australia. United States
share in Indonesia import of grapes is 29.6%. Total Quantity exported by USA is 12,919
tons valued at US $ 1758 per tons. Australia and China shared market in Indonesia by
25% and 17.8 % respectively. The average per unit price of grapes was US $ 1,655 per ton
in 2006. The imports of grapes in the five years grew by 25% in value and by 17% in
quantity.
Mango: Indonesia imported 1103 tons of mangoes valued at US$ 785 thousands in 2006.
The major exporters of mangoes to Indonesia are Thailand (59% of total import value),
Peru (17%), and S.Africa (8%). Total Quantity exported by Thailand is 620 tons valued at
US $737 per tons. The average price per ton is US $ 712 for imports in Indonesia. The
annual growth in the last five years in terms of value was 35% and in quantity 32%.
Onions: Indonesia imported 45,800 tons of onions valued at US$ 37. 5 million in 2006
.The major exporter of Onions to Indonesia are Thailand (44% of total import value),
Philippines (17%) and Vietnam (12%). Total Quantity imported by Indonesia in the year
2006 was 99,690 tons. Average import unit price was US $ 376 per tons. The annual
average import growth in the value and quantity in the last five were 28% and 21%
respectively. Thailand which is the major exporter of onions to Indonesia has increased its
export in the five years by 67%.
Chilli: Indonesia imported 145 tons of chillies valued at US$ 138 thousands in 2006 .The
major exporter of pepper or Chilli to Indonesia is Australia, representing 49% in total
22
2. import value. Total quantity exported by Australia is 68 tons. Unit export value of
Australia was US $ 1659 per tons while the average price of total import volume was US $
952 per ton. Singapore and Taiwan took 21% and 9.4% of market share respectively.
Australia’s export increased from 22 tons in 2002 to 68 tons in 2006. Annual average
import growth rates between 2002 – 2006 were 68% in value and 76% in quantity.
Tomatoes: Indonesia imported 227 tons of tomatoes valued at US$ 200 thousands in
2006. The leading exporter of tomatoes to Indonesia is Australia representing 58% in total
import of Indonesia. Total quantity exported by Australia is 71 tons valued at US $ 1634
per ton. After Australia, Singapore and Malaysia took the market share of 33% and 8 %
respectively.
The import growth in the last five years is negative: -23% in terms of value and -40% in
terms of volume.
23
3. a. Grapes
Table – I: Imports of Grapes from 2002 – 2006 in Value in USD '000
Exporters 2002 2003 2004 2005 2006
'World 18,640 18,090 25,642 30,812 43,638
'United States of America 10,072 8,475 11,401 17,777 12,919
'Australia 6,813 5,305 7,985 6,039 10,931
'China 510 797 1,020 1,477 7,748
'Chile 264 1,325 1,939 1,514 6,727
'South Africa 279 1,067 1,733 971 2,120
'Peru 0 1 199 313 1,146
'Argentina 67 186 324 570 1,082
'Singapore 47 24 103 1,101 352
'Hong Kong (SARC) 32 33 87 131 215
'Egypt 10 17 16 64 125
Table – II: Imports of Grapes from 2003 – 2007 in Quantity in Tons
‘World 16,218 14,469 28,715 25,330 26,366
'United States of America 7,241 6,959 11,605 11,011 7,350
'Australia 7,338 4,060 10,547 7,164 6,387
'China 420 802 1,446 1,269 4,720
'Chile 274 967 2,169 1,835 4,322
'South Africa 280 782 1,474 881 1,292
'Argentina 75 142 265 578 717
'Peru 0 1 238 360 702
'Singapore 52 34 126 1,268 448
'Hong Kong (SARC) 27 27 83 141 124
'New Zealand 27 3 0 18 103
'Egypt 7 12 14 61 60
24
13. B. MARKET FOR TURMERIC
1. Market Trends and Opportunities
Items 2002 2006 Change in % Major Markets in %
Value Qty Value Qty Value Qty
US '000 Tons US'000 Tons
Turmeric 15 17 20 1 33 -95 India, UK, Hong Kong
Annual 9 -46
Average
Growth 2002-
2006
The import of Turmeric has gone down by 95% in terms of quantity in the five years
period. However, the data indicated that import value increased by 33%. The major
partner countries for import of Turmeric powder in Indonesia are India, UK & Hong
Kong.
2. Import Analysis
Indonesia imported US$ 20 thousands worth of turmeric in 2006. The major exporter of
turmeric to Indonesia is India. Total Quantity exported by India is 1 tons. The export
value was in US $16,000 per tons.
Shares of Myanmar and china in imports of turmeric into Indonesia are minimums. India's
export increased from 2750 tons in 2002 to 3258 tons in 2006 representing a growth of
87% in the five years time.
Table – I : Imports of Turmeric Powder from 2002– 2006 in USD '000
Exporters 2002 2003 2004 2005 2006
'World 15 13 7 18 20
'India 1 0 0 2 16
'United Kingdom 2 1 4 9 3
'Malaysia 2 1 0 0 0
'United States of America 0 1 0 1 0
Table – II : Imports of Turmeric Powder from 2002– 2006 in Quantity in Tons
Exporters 2002 2003 2004 2005 2006
'World 17 5 1 3 1
'India 2 0 0 2 1
'Malaysia 14 4 0 0 0
34
15. C. MARKETS FOR SESAMUM SEEDS
1 Market Trends and Opportunities
Items 2002 2006 Change in % Major
Markets in
%
Value Quantity Value Quantity Value Quantity
(US ' 000) (Tons) (US ' (Tons) (US ' (Tons)
000) 000)
Sesamum 2,004 4,669 1,535 3,413 -25% -27% India(93%)
Seeds
Imports of sesamum seeds into Indonesia are decreased both in terms of values and in the
quantities. The major partner country in importing of Sesamum seeds is India with the
market share of 93%
2. Import Analysis
According to a recent available data, Indonesia imported 3413 tons of Sesamum seeds
valued at US $ 1.5 million 2006. The major exporter of Sesames seeds to Indonesia is
India. Total Quantity exported by India was 3,258 tons in 2006representing 92.2% in total
import. Export was followed by Malaysia and United States of America, whose shares
were 2.5 % and 1.8 % respectively. India's export increased from 2,750 tons in 2002 to
3,258 tons in 2006.
36
16. Table – I: Imports of Sesame Seeds from 2003 – 2007 in USD '000
Imported Imported Imported Imported Imported
Exporters value in value in value in value in value in
2002 2003 2004 2005 2006
'World 2,004 1,119 865 1,189 1,535
'India 1,254 924 769 1,085 1,415
'Malaysia 10 1 20 36 39
'United States of America 15 0 36 26 28
'China 261 176 12 2 27
'Singapore 0 7 3 0 18
'Thailand 2 11 0 0 4
'Mexico 0 0 15 29 3
'Australia 4 1 4 3 1
'Viet Nam 459 0 5 3 0
'Germany 0 0 0 4 0
Table – II: Imports of Sesame Seeds from 2003 – 2007 in Quantity in Tons
Exporters 2002 2003 2004 2005 2006
'World 4,669 2,994 2,114 2,804 3,413
'India 2,750 2,396 2,013 2,676 3,258
'Malaysia 27 2 25 81 66
'China 706 536 31 5 55
'USA 8 0 25 19 20
'Thailand 6 20 0 0 6
'Singapore 0 39 2 0 5
'Viet Nam 1,172 0 8 9 0
37
18. D. MARKETS FOR SOYA MEALS
1 Market Trends and Opportunities
Items 2002 2006 Change in Major Markets in
% %
Value Quantity Value Quantity Value Qty
US Million 000Tons US Million 000Tons
Soya-bean 278 1,326 493 2,116 77% 60% Argentina 44, India
Oil-cake 32 & Brazil 20
Annual 15% 12%
Growth
between
2002-2006
The consumption and imports of Soya-bean cake have increased in Indonesia in the recent
past. The major partner countries for import are Argentina, India and Brazil. The change in
percentage of the value of Soya meal is 77% in the five years, similarly the import
quantity increased by 60%.
2. Import Analysis
Indonesia imported US$ 493 million worth of Soya-bean cake in 2006 .The leading
exporter to Indonesia is Argentina. Total Quantity exported by Argentina is 925 thousand
tons valued at $ 215 million, representing 43% in total import. After Argentina there is
India and Brazil, whose shares in import into Indonesia are 31.5% and 19.8 %
respectively. India's export increased from 483,323 tons in 2002 to 691,246 tons in 2006.
The average price per ton was US $ 233 in 2006, where as price paid to Indian origin
recorded at $ 225 per ton.
Table – I: Imports of Soya meals from 2002 – 2006 in Value in USD '000
Imported Imported Imported Imported Imported
Exporters value in value in value in value in value in
2002 2003 2004 2005 2006
'World 278,405 362,161 532,000 474,166 493,327
'Argentina 25,733 46,486 154,725 200,962 215,442
'India 96,653 53,306 195,572 107,234 155,215
'Brazil 87,139 139,713 136,116 115,730 97,456
'United States of America 62,709 120,505 30,990 41,912 13,494
'United Arab Emirates 0 0 13,121 7,078 9,485
'Singapore 22 570 656 843 1,455
'Malaysia 741 287 81 59 268
'Indonesia 0 0 0 0 197
'China 5,211 530 35 174 154
'Bulgaria 0 0 0 42 83
'Netherlands 75 15 8 75 60
'Denmark 0 8 19 9 16
'Taiwan, Province of China 42 483 172 0 3
39
21. E. MARKET FOR COTTON
1. Market Trends and Opportunities
Items 2002 2006 Change in % Major Markets in
%
Value Qty Value Qty ’000 Value Qty
US 'Million 000 Tons US 'Million Tons
Cotton, not 705 625 620 463 -13% -25% USA (35%),
carded and Australia (21%),
not combed India (8%)
Use of imported cotton in Indonesian textile industry is declining in the recent past. In the
last five years the import value of Cotton decrease by 13% from 2002 to 2006 and import
in quantity also decrease by 25%. This also shows that Indonesia is becoming strong itself
in cotton production or cotton textile mills are reducing their capacities. The major market
leaders in export to Indonesia are USA, Australia and India.
2. Import Analysis
According to a recent available data Indonesia imported 463 thousand tons of cotton
valued at US$ 620 million in 2006 .The major leading of Cotton to Indonesia is United
States of America. United States share in Indonesia's import of cotton is 35.8%. Total
Quantity exported by USA is 159,301 tons. The export value was in US $ 1,393 per tons.
Australia and India other major exporters, whose shares in export of cotton to Indonesia
are 21.6 % and 8.4 % respectively.
Between 2002- 2006 in India’s export of cotton to Indonesia grew by 278% in terms of
value. India's export in volume increased from 204 tons in 2002 to 52, 051 tons in 2006.
The reason behind the increase in India's export is comparatively lower price than other
countries. The unit price in the year 2006 is US $1,222 per ton.
Indonesia is also the major destination of India for the Cotton export. Indonesia comes
under top 5 places for the export of cotton. Indonesia share is 5.1 % of India total cotton
export. The growth in India export to Indonesia is 238 % in Value and 210 % in Quantity.
42
22. Table -I: Cotton, not carded and not combed imported from 2002 – 2006 in USD
'000
Exporters 2002 2003 2004 2005 2006
'World 704,792 644,483 679,914 576,004 619,895
'United States of America 222,357 226,315 224,150 224,802 221,840
'Australia 285,827 218,093 144,109 121,651 133,928
'India 204 1,006 19,508 9,163 52,051
'Brazil 11,980 10,876 54,347 50,537 46,318
'South Africa 13,558 10,249 35,688 13,987 20,341
'Burkina Faso 4,339 3,807 10,861 8,418 12,055
'Côte d'Ivoire 24,623 15,225 13,655 9,639 9,747
'Uzbekistan 1,953 2,928 2,705 10,257 9,287
'Mali 3,890 4,470 8,024 6,874 9,182
'United Republic of Tanzania 5,922 10,939 10,745 8,215 8,079
Table – II: Cotton, not carded and not combed imported from 2002 – 2006 in Quantity in
Tons
Exporters 2002 2003 2004 2005 2006
'World 625,153 523,124 448,690 455,384 463,205
'United States of America 197,803 182,890 143,543 180,605 159,301
'Australia 240,139 168,038 89,736 84,495 92,326
'India 356 768 12,456 8,030 42,596
'Brazil 10,614 8,957 40,022 40,378 36,626
'South Africa 12,130 8,790 24,095 10,402 15,522
'Burkina Faso 4,026 3,531 7,018 7,291 9,720
'Côte d'Ivoire 22,640 13,056 10,187 8,056 7,634
'Mali 3,992 3,997 5,887 6,218 7,438
'United Republic of Tanzania 5,158 9,372 8,032 6,824 7,314
'Uzbekistan 2,100 2,622 2,061 8,908 7,237
43