
Recommended
Recommended
More Related Content
What's hot
What's hot (19)
Similar to What if this is a "normal" bull market correction?
Similar to What if this is a "normal" bull market correction? (20)
Recently uploaded
Recently uploaded (20)
What if this is a "normal" bull market correction?
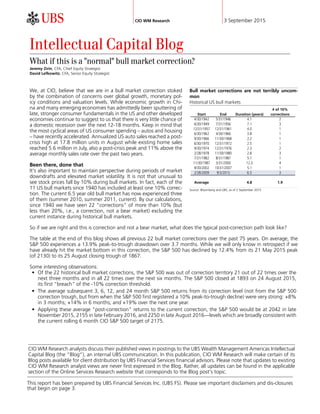
- 1. CIO WM Research 3 September 2015 CIO WM Research analysts discuss their published views in postings to the UBS Wealth Management Americas Intellectual Capital Blog (the “Blog”), an internal UBS communication. In this publication, CIO WM Research will make certain of its Blog posts available for client distribution by UBS Financial Services financial advisors. Please note that updates to existing CIO WM Research analyst views are never first expressed in the Blog. Rather, all updates can be found in the applicable section of the Online Services Research website that corresponds to the Blog post's topic. Intellectual Capital Blog What if this is a "normal" bull market correction? Jeremy Zirin, CFA, Chief Equity Strategist David Lefkowitz, CFA, Senior Equity Strategist We, at CIO, believe that we are in a bull market correction stoked by the combination of concerns over global growth, monetary pol- icy conditions and valuation levels. While economic growth in Chi- na and many emerging economies has admittedly been sputtering of late, stronger consumer fundamentals in the US and other developed economies continue to suggest to us that there is very little chance of a domestic recession over the next 12-18 months. Keep in mind that the most cyclical areas of US consumer spending – autos and housing – have recently accelerated. Annualized US auto sales reached a post- crisis high at 17.8 million units in August while existing home sales reached 5.6 million in July, also a post-crisis peak and 11% above the average monthly sales rate over the past two years. Been there, done that It's also important to maintain perspective during periods of market downdrafts and elevated market volatility. It is not that unusual to see stock prices fall by 10% during bull markets. In fact, each of the 11 US bull markets since 1940 has included at least one 10% correc- tion. The current 6.5 year old bull market has now experienced three of them (summer 2010, summer 2011, current). By our calculations, since 1940 we have seen 22 "corrections" of more than 10% (but less than 20%, i.e., a correction, not a bear market) excluding the current instance during historical bull markets. Bull market corrections are not terribly uncom- mon Historical US bull markets # of 10% Start End Duration (years) corrections Average 4.8 1.9 Source: Bloomberg and UBS, as of 2 September 2015 So if we are right and this is correction and not a bear market, what does the typical post-correction path look like? The table at the end of this blog shows all previous 22 bull market corrections over the past 75 years. On average, the S&P 500 experiences a 13.9% peak-to-trough drawdown over 3.7 months. While we will only know in retrospect if we have already hit the market bottom in this correction, the S&P 500 has declined by 12.4% from its 21 May 2015 peak (of 2130) to its 25 August closing trough of 1867. Some interesting observations: • Of the 22 historical bull market corrections, the S&P 500 was out of correction territory 21 out of 22 times over the next three months and in all 22 times over the next six months. The S&P 500 closed at 1893 on 24 August 2015, its first "breach" of the -10% correction threshold. • The average subsequent 3, 6, 12, and 24 month S&P 500 returns from its correction level (not from the S&P 500 correction trough, but from when the S&P 500 first registered a 10% peak-to-trough decline) were very strong: +8% in 3 months; +14% in 6 months; and +19% over the next one year. • Applying these average "post-correction" returns to the current correction, the S&P 500 would be at 2042 in late November 2015, 2155 in late February 2016, and 2250 in late August 2016—levels which are broadly consistent with the current rolling 6 month CIO S&P 500 target of 2175. This report has been prepared by UBS Financial Services Inc. (UBS FS). Please see important disclaimers and dis-closures that begin on page 3.
- 2. Historical "bull market corrections" Corrections in the S&P 500 greater than 10% but less than 20% (i.e., during a bull market) Source: Bloomberg and UBS, as of 2 September 2015 Intellectual Capital Blog UBS CIO WM Research 3 September 2015 2
- 3. Disclaimer Chief Investment Office (CIO) Wealth Management (WM) Research is published by UBS Wealth Management and UBS Wealth Management Americas, Business Divisions of UBS AG (UBS) or an affiliate thereof. CIO WM Research reports published outside the US are branded as Chief Investment Office WM. In certain countries UBS AG is referred to as UBS SA. This publication is for your information only and is not intended as an offer, or a solicitation of an offer, to buy or sell any investment or other specific product. The analysis contained herein does not constitute a personal recommendation or take into account the particular investment objectives, investment strategies, financial situation and needs of any specific recipient. It is based on numerous assumptions. Different assumptions could result in materially different results. We recommend that you obtain financial and/or tax advice as to the implications (including tax) of investing in the manner described or in any of the products mentioned herein. Certain services and products are subject to legal restrictions and cannot be offered worldwide on an unrestricted basis and/ or may not be eligible for sale to all investors. All information and opinions expressed in this document were obtained from sources believed to be reliable and in good faith, but no representation or warranty, express or implied, is made as to its accuracy or completeness (other than disclosures relating to UBS and its affiliates). All information and opinions as well as any prices indicated are currently only as of the date of this report, and are subject to change without notice. Opinions expressed herein may differ or be contrary to those expressed by other business areas or divisions of UBS as a result of using different assumptions and/or criteria. At any time, investment decisions (including whether to buy, sell or hold securities) made by UBS AG, its affiliates, subsidiaries and employees may differ from or be contrary to the opinions expressed in UBS research publications. Some investments may not be readily realizable since the market in the securities is illiquid and therefore valuing the investment and identifying the risk to which you are exposed may be difficult to quantify. UBS relies on information barriers to control the flow of information contained in one or more areas within UBS, into other areas, units, divisions or affiliates of UBS. Futures and options trading is considered risky. Past performance of an investment is no guarantee for its future performance. Some investments may be subject to sudden and large falls in value and on realization you may receive back less than you invested or may be required to pay more. Changes in FX rates may have an adverse effect on the price, value or income of an investment. This report is for distribution only under such circumstances as may be permitted by applicable law. Distributed to US persons by UBS Financial Services Inc., a subsidiary of UBS AG. UBS Securities LLC is a subsidiary of UBS AG and an affiliate of UBS Financial Services Inc. UBS Financial Services Incorporated of Puerto Rico is a subsidiary of UBS Financial Services Inc. UBS Financial Services Inc. accepts responsibility for the content of a report prepared by a non-US affiliate when it distributes reports to US persons. All transactions by a US person in the securities mentioned in this report should be effected through a US-registered broker dealer affiliated with UBS, and not through a non-US affiliate. The contents of this report have not been and will not be approved by any securities or investment authority in the United States or elsewhere. UBS specifically prohibits the redistribution or reproduction of this material in whole or in part without the prior written permission of UBS and UBS accepts no liability whatsoever for the actions of third parties in this respect. Version as per April 2015. UBS specifically prohibits the redistribution or reproduction of this material in whole or in part without the prior written permission of UBS and UBS accepts no liability whatsoever for the actions of third parties in this respect. © UBS 2015. The key symbol and UBS are among the registered and unregistered trademarks of UBS. All rights reserved. Intellectual Capital Blog UBS CIO WM Research 3 September 2015 3