Oz Metals 20150329
•
1 like•567 views

Update on metals market and junior mining companies listed on the Australian Securities Exchange

Recommended
Recommended
More Related Content
More from J-François Bertincourt
More from J-François Bertincourt (20)
Recently uploaded
Recently uploaded (20)
Oz Metals 20150329
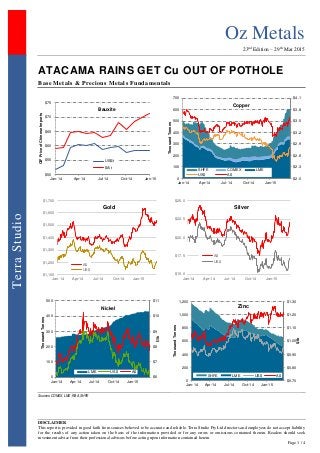
- 1. Oz Metals 23nd Edition – 29th Mar 2015 DISCLAIMER This report is provided in good faith from sources believed to be accurate and reliable. Terra Studio Pty Ltd directors and employees do not accept liability for the results of any action taken on the basis of the information provided or for any errors or omissions contained therein. Readers should seek investment advice from their professional advisors before acting upon information contained herein. Page 1 / 4 TerraStudio ATACAMA RAINS GET Cu OUT OF POTHOLE Base Metals & Precious Metals Fundamentals Sources: COMEX, LME, RBA, SHFE $50 $55 $60 $65 $70 $75 Jan-14 Apr-14 Jul-14 Oct-14 Jan-15 CIFPriceofChineseImports Bauxite US$/t $A/t $2.0 $2.3 $2.6 $2.9 $3.2 $3.5 $3.8 $4.1 0 100 200 300 400 500 600 700 Jan-14 Apr-14 Jul-14 Oct-14 Jan-15 ThousandTonnes Copper SHFE COMEX LME US$ A$ $1,100 $1,200 $1,300 $1,400 $1,500 $1,600 $1,700 Jan-14 Apr-14 Jul-14 Oct-14 Jan-15 Gold A$ US$ $15.0 $17.5 $20.0 $22.5 $25.0 Jan-14 Apr-14 Jul-14 Oct-14 Jan-15 Silver A$ US$ $6 $7 $8 $9 $10 $11 0 100 200 300 400 500 Jan-14 Apr-14 Jul-14 Oct-14 Jan-15 $/lb ThousandTonnes Nickel LME US$ A$ $0.70 $0.80 $0.90 $1.00 $1.10 $1.20 $1.30 0 200 400 600 800 1,000 1,200 Jan-14 Apr-14 Jul-14 Oct-14 Jan-15 $/lb ThousandTonnes Zinc SHFE LME US$ A$
- 2. Oz Metals 23nd Edition – 29th Mar 2015 DISCLAIMER This report is provided in good faith from sources believed to be accurate and reliable. Terra Studio Pty Ltd directors and employees do not accept liability for the results of any action taken on the basis of the information provided or for any errors or omissions contained therein. Readers should seek investment advice from their professional advisors before acting upon information contained herein. Page 2 / 4 TerraStudio Markets & Majors mining.com - Chile is responsible for a third of the world's mined output of copper with many of the largest mines located in the Atacama Desert. Before the unusual weather this week, a drought was reducing production as a result of water restrictions imposed by the authorities. In April 2014 a major earthquake also temporarily halted output at a number of large mines. State-owned giant Codelco confirmed it had restarted mining operations at its Chuquicamata, Ministro Hales, Radomiro Tomic, Gabriela Mistral, and Salvador mines after a three-day hiatus due to the state of access roads, power problems and safety concerns following the downpours. Codelco was forecast to produce 1.6 million tonnes of copper this year – already down 5% from 2014 – and the affected mines represented some 60% of the Santiago-based company's production capacity. Other mines suspended after the rains included Antofagasta's Michilla mine and Centinela copper complex (its largest operation Los Pelambres wasn't affected), Anglo American's Mantoverde and Mantos Blancos, Lundin Mining's recently acquired Candelaria and Barrick Gold's Zaldivar. BHP Billiton, operator of the world's largest copper mine Escondida, said mining was not affected while Chile's number two operation Collahuasi, owned by Anglo and Glencore also operated throughout the period. Anglo's Los Bronces also operated normally. Most analysts expect copper to move into a surplus this year in excess of 200,000 tonnes after a largely balanced 2014, but the copper industry has a long history of supply disruptions. Thomson Reuters - Weak prices for gold will increase the amount of the precious metal that is made into jewelry, coins and other items by more than 4 percent in 2015, while values are expected to struggle to move higher, CPM Group said on Tuesday. The fabrication of gold, which involves manufacturing the yellow metal into semi-finished or final products, is forecast to rise to 96.9 million ounces in 2015, New York-based CPM Group said in its "Gold Yearbook 2015." That is up from 93 million ounces in 2014, due to softer prices and the base formation at a relatively low level, said CPM, a commodities market research, consulting and advisory firm. Total supply was pegged at 129.9 million ounces in 2015, up 2.5 percent from 2014, marking the second straight annual rise. The London Metal Exchange (LME) has started talking to the main bullion trading banks about reinstating end-of-day gold and silver forward curves, which could be part of a bigger structural change in the precious metals market. A forward curve, which consists of a series of prices reflecting tradable values for future dates, is a key indicator of market sentiment and is widely used by banks as a reference point for clients' forward positions at the end of each trading day. The LME stopped providing forward curves late last year, when increased regulatory scrutiny of the way banks provide data to determine financial benchmarks made bullion market makers less inclined to participate in price- setting processes. Forward market makers include Barclays, UBS and JP Morgan among others. mining.com - Barrick Gold said it will continue operations at its Lumwana copper mine in Zambia while the government tweaks a new royalty regime announced last year. In December, after the country increased mining royalties on open pits from 6% to 20% starting January 1, Barrick said the hikes left the company "no choice" but to phase out operations at its open pit mine. Zambian President Edgar Lungu on Wednesday ordered finance and mining ministers to rejig the new royalties by April 8. The royalty rates on underground operations were also hiked 6% to 8%. Major job cuts at the mine, which employs about 4,000 people directly, were planned to begin this month, following the legally required notice period for putting the mine in care and maintenance. Barrick recorded a $3.8 billion impairment charge related to Lumwana, acquired when it bought Equinox Minerals in 2011. In 2014 the mine produced 214 million pounds (97,000 tonnes) of copper at fully allocated costs of $2.76 per pound. The mine had 3.3 billion pounds of proven and probable copper in reserves as of 31 Dec 2014. SNL - Rio Tinto is reportedly initiating consultation regarding potential job cuts at its London headquarters as the mining giant looks to lay off at least 1,500 employees across its global operations. Separately, Anglo Australian miner Rio Tinto plans to cut jobs in mergers and acquisitions and business development, three sources said, to cut costs as it battles a slump in commodity prices. The plan signals diminished interest in deal making at the world's second-largest mining company, which rebuffed a takeover approach by rival Glencore last summer. "M&A is just not on the cards for now. There is no shareholder mandate for that,” a banking source said, adding that Rio was planning to more than halve the number of M&A roles. Funding, Mergers & Acquisitions Thomson Reuters - Just two weeks before Glencore can make a new approach for Rio Tinto, the rival that rejected it last summer, the Swiss firm once seen as a deal machine seems unlikely to strike again or charm investors with any other major move soon. The trading and mining company's shares were hit by a slump in copper prices this year, and its debt is high, diminishing its deal making ability and focusing attention instead on the quality of assets that it bought in previous spending sprees. Glencore's portfolio includes some high costs and problematic assets. While Rio Tinto and BHP have the largest, lowest cost iron ore assets
- 3. Oz Metals 23nd Edition – 29th Mar 2015 DISCLAIMER This report is provided in good faith from sources believed to be accurate and reliable. Terra Studio Pty Ltd directors and employees do not accept liability for the results of any action taken on the basis of the information provided or for any errors or omissions contained therein. Readers should seek investment advice from their professional advisors before acting upon information contained herein. Page 3 / 4 TerraStudio in the world in Australia, Glencore relies for a big chunk of earnings on operations in risky countries such as the Democratic Republic of Congo. It's also struggling with some oil and mining assets, having bought Chad-focused oil business Caracal ahead of a collapse in oil prices and being forced to post a US$8 billion write-down on mining assets acquired in its re-cord breaking US$46 billion buy of Xstrata in 2013 - the largest ever mining acquisition. Bauxite Sector Source: Bloomberg, SNL, Terra Studio Lithium-Tantalum Sector Source: SNL, Terra Studio Tin Sector Source: SNL Nickel Sector Source: SNL Copper Producers Source: SNL Copper Developers & Explorers Source: SNL, Terra Studio Zinc & Poly-metallic Sector Source: SNL Gold Producers Source: SNL Code Company Name Close Price Week Δ YTD Δ 52 Week Range Market Cap (A$m) Cash (A$m) TEV (A$m) ABX Australian Bauxite 0.36 ▲ 33% 18% 46 5 41 BAU Bauxite Resources 0.075 ▼ (1%) (23%) 17 25 (7) CAY Canyon Resources 0.046 — 0% (8%) 6 1 5 MLM Metallica Minerals 0.056 ▲ 2% 2% 9 1 8 MMI Metro Mining 0.060 ▲ 33% 122% 17 8 10 Code Company Name Close Price Week Δ YTD Δ 52 Week Range Market Cap (A$m) Cash (A$m) TEV (A$m) AJM Altura Mining 0.024 ▲ 20% (63%) 11 3 11 GXY Galaxy Resources 0.025 — 0% 0% 27 3 93 ORE Orocobre 2.25 ▲ 2% (19%) 346 26 347 PLS Pilbara Minerals Ltd. 0.040 — 0% (5%) 25 2 21 RDR Reed Resources 0.034 ▼ (8%) (11%) 17 7 15 Code Company Name Close Price Week Δ YTD Δ 52 Week Range Market Cap (A$m) Cash (A$m) TEV (A$m) CSD Consolidated Tin Mines 0.049 ▼ (2%) 20% 14 0 13 ELT Elementos 0.007 — 0% (13%) 5 1 4 KAS Kasbah Resources 0.037 ▼ (8%) (31%) 17 4 11 MLX Metals X 1.23 ▲ 6% 56% 510 57 403 MOO Monto Minerals 0.001 — 0% (50%) 1 1 1 SRZ Stellar Resources 0.042 ▲ 8% 45% 13 4 10 VMS Venture Minerals 0.028 ▼ (7%) (10%) 8 7 4 Code Company Name Close Price Week Δ YTD Δ 52 Week Range Market Cap (A$m) Cash (A$m) TEV (A$m) TEV/ EBITDA IGO Independence Group 5.65 ▲ 3% 28% 1,324 57 1,232 NA MBN Mirabella Nickel 0.125 ▼ (14%) 331% 116 18 225 0.4x MCR Mincor Resources 0.69 ▲ 1% 17% 129 26 111 NA PAN Panoramic Resources 0.58 ▼ (2%) 38% 186 64 128 1.7x WSA Western Areas 3.87 ▼ (1%) 3% 900 231 849 NA AVQ Axiom Mining 0.012 ▲ 9% (20%) 43 2 41 NM CZI Cassini Resources 0.08 ▼ (9%) (35%) 9 8 7 NA DKM Duketon Mining 0.17 ▼ (8%) (37%) 13 7 6 NA LEG Legend Mining 0.007 — 0% 0% 14 7 7 NM MAT Matsa Resources 0.160 ▼ (18%) (6%) 23 3 23 NA MLM Metallica Minerals 0.056 ▲ 2% 2% 9 1 8 NA PIO Pioneer Resources 0.019 ▲ 6% 46% 13 1 11 NA POS Poseidon Nickel 0.12 ▲ 4% 0% 82 4 99 NA SEG Segue Resources 0.006 — 0% 10% 11 1 10 NA SGQ St George Mining 0.059 ▼ (11%) (6%) 7 1 5 NA SIR Sirius Resources 2.89 ▲ 1% 13% 987 59 742 NM TLM Talisman Mining 0.18 ▲ 3% 13% 23 16 8 NA WIN Winward Resources 0.41 ▲ 16% 153% 36 6 32 NA Code Company Name Close Price Week Δ YTD Δ 52 Week Range Market Cap (A$m) Cash (A$m) TEV (A$m) TEV/ EBITDA ABY Aditya Birla Minerals 0.19 ▼ (3%) (5%) 58 137 (46) NA HGO Hillgrove Resources 0.36 ▲ 3% (20%) 53 9 63 1.3x KBL KBL Mining 0.021 — 0% (30%) 10 7 33 NA MWE Mawson West 0.050 — 0% 0% 20 48 48 NM OZL OZ Minerals 3.87 ▲ 2% 11% 1,174 219 956 2.7x PNA PanAust 1.23 ▲ 7% (13%) 748 74 970 NM SFR Sandfire Resources 4.30 ▲ 2% (5%) 671 58 755 NA SRQ Straits Resources 0.004 — 0% (20%) 5 13 162 NA TGS Tiger Resources 0.055 — 0% (58%) 63 80 210 NA 985 CST Mining 0.047 ▼ (4%) 7% 1,274 136 180 0.4x 1208 MMG 2.44 ▲ 13% 2% 12,907 251 84,593 14.6x 3993 China Molybdenum 4.97 ▲ 0% 10% 68,944 9,326 70,500 18.4x Code Company Name Close Price Week Δ YTD Δ 52 Week Range Market Cap (A$m) Cash (A$m) TEV (A$m) AOH Altona Mining 0.099 ▲ 1% (59%) 53 129 (76) ARE Argonaut Resources 0.010 — 0% (38%) 4 1 3 AVB Avanco Resources 0.070 ▲ 3% (8%) 116 20 97 AVI Avalon Minerals 0.030 — 0% 50% 5 1 4 AZS Azure Minerals 0.014 ▲ 4% (42%) 14 1 13 CDU CuDeco (suspended) 1.41 — 0% (28%) 351 7 406 CVV Caravel Minerals 0.008 — 0% 0% 6 1 5 ENR Encounter Resources 0.10 — 0% (23%) 13 4 11 ERM Emmerson Resources 0.027 ▲ 13% (13%) 10 2 7 FND Finders Resources 0.15 ▲ 7% (3%) 96 48 96 GCR Golden Cross Resources 0.057 ▲ 8% (19%) 5 2 5 GPR Geopacific Resources 0.038 — 0% (27%) 15 4 11 HAV Havilah Resources 0.25 ▲ 4% 79% 39 3 36 HCH Hot Chili 0.12 ▲ 4% (25%) 42 6 48 HMX Hammer Metals 0.080 ▼ (6%) (2%) 8 1 8 IAU Intrepid Mines 0.11 ▼ (9%) (22%) 39 74 (35) KDR Kidman Resources 0.040 ▼ (18%) (40%) 5 3 4 KGL KGL Resources 0.16 ▲ 10% (29%) 23 7 9 MEP Minotaur Exploration 0.10 — 0% (31%) 18 5 12 MNC Metminco 0.005 — 0% (38%) 10 1 8 MTH Mithril Resources 0.006 ▲ 20% (14%) 3 2 1 PEX Peel Mining 0.067 ▲ 3% (3%) 9 3 7 RDM Red Metal 0.043 ▼ (9%) (47%) 8 2 3 RER Regal Resources 0.045 — 0% (2%) 10 2 7 RTG RTG Mining 0.550 ▼ (8%) (5%) 71 2 68 RXM Rex Minerals 0.087 ▲ 1% (21%) 19 3 12 SMD Syndicated Metals 0.020 — 0% (38%) 5 2 4 SRI Sipa Resources 0.075 ▲ 15% 103% 47 4 46 SUH Southern Hemisphere 0.010 ▼ (29%) (77%) 2 2 2 THX Thundelarra Resources 0.068 ▼ (1%) (38%) 22 7 14 XAM Xanadu Mines 0.090 — 0% (10%) 33 8 33 Code Company Name Close Price Week Δ YTD Δ 52 Week Range Market Cap (A$m) Cash (A$m) TEV (A$m) AQR Aeon Metals 0.070 ▼ (13%) (30%) 21 5 33 DGR DGR Global 0.046 ▲ 28% 44% 19 0 21 HRR Heron Resources 0.14 ▲ 4% 8% 49 28 24 IBG Ironbark Zinc 0.091 ▲ 12% 14% 40 3 37 IPT Impact Minerals 0.012 ▼ (8%) (50%) 7 1 5 IVR Investigator Resources 0.011 ▼ (8%) (31%) 5 3 0 MRP MacPhersons Resources 0.130 ▲ 13% 4% 41 5 36 PNX Phoenix Copper 0.018 ▼ (10%) (40%) 6 3 4 RDM Red Metal 0.043 ▼ (9%) (47%) 8 8 (0) RVR Red River Resources 0.15 ▲ 11% 36% 26 4 23 RXL Rox Resources 0.031 ▲ 29% 11% 26 3 23 TZN Terramin Australia 0.125 — 0% 14% 189 1 188 VXR Venturex Resources 0.004 — 0% (20%) 6 1 5 Code Company Name Close Price Week Δ YTD Δ 52 Week Range Market Cap (A$m) Cash (A$m) TEV (A$m) TEV/ EBITDA AGD Austral Gold 0.12 ▼ (8%) (8%) 57 NA 49 NA ALK Alkane Resources 0.30 ▼ (12%) 36% 124 16 105 NA AMI Aurelia Metals 0.28 ▲ 4% 15% 107 22 207 NA BDR Beadell Resources 0.27 ▼ (2%) 18% 212 13 316 4.9x BOK Black Oak Minerals 0.38 ▼ (5%) 41% 17 11 31 NA DRM Doray Minerals 0.47 ▲ 2% (2%) 113 16 112 NA EVN Evolution Mining 0.84 ▲ 11% 30% 601 32 730 3.6x IGO Independence Group 5.65 ▲ 3% 28% 1,324 57 1,232 NA KCN Kingsgate Consolidated 0.69 ▲ 6% 5% 154 54 238 NA KRM Kingsrose Mining 0.24 ▼ (2%) (8%) 84 7 95 NA LSA Lachlan Star 0.024 — 0% 20% 4 2 22 NA MIZ Minera Gold 0.002 — 0% (33%) 6 0 11 NA MLX Metals X 1.23 ▲ 6% 56% 510 57 403 NA MML Medusa Mining 0.90 ▲ 10% 38% 187 13 180 NA MOY Millennium Minerals 0.030 ▼ (6%) (19%) 7 2 45 NA NCM Newcrest Mining 13.65 ▲ 5% 25% 10,463 141 14,880 NA NGF Norton Gold Fields 0.20 — 0% 60% 186 19 314 4.8x NST Northern Star Resources 2.32 ▼ (3%) 56% 1,374 82 1,346 NA OGC OceanaGold Corp. 2.51 ▲ 0% 24% 762 NA 846 2.8x PGI PanTerra Gold 0.135 ▼ (7%) (25%) 11 3 73 NM PRU Perseus Mining 0.30 ▲ 9% 13% 155 37 121 2.1x RMS Ramelius Resources 0.115 ▲ 10% 125% 54 12 37 NA RRL Regis Resources 1.35 ▲ 8% (30%) 675 7 684 NA RSG Resolute Mining 0.29 ▼ (2%) 9% 186 19 217 NA SAR Saracen Mineral Holdings 0.43 ▲ 2% 67% 337 36 317 NA SBM St Barbara 0.23 ▲ 7% 114% 111 79 434 NA SLR Silver Lake Resources 0.20 ▲ 11% 0% 98 24 105 NA TBR Tribune Resources 3.30 ▲ 2% 25% 165 11 180 10.4x TRY Troy Resources 0.51 ▲ 10% 10% 99 43 139 NA UML Unity Mining 0.008 — 0% 14% 9 7 (3) NA
- 4. Oz Metals 23nd Edition – 29th Mar 2015 DISCLAIMER This report is provided in good faith from sources believed to be accurate and reliable. Terra Studio Pty Ltd directors and employees do not accept liability for the results of any action taken on the basis of the information provided or for any errors or omissions contained therein. Readers should seek investment advice from their professional advisors before acting upon information contained herein. Page 4 / 4 TerraStudio Gold Developers & Explorers Source: SNL, Terra Studio For further information, please contact: J-François Bertincourt m +61 406 998 779 jf@terrastudio.biz au.linkedin.com/in/jfbertincourt Code Company Name Close Price Week Δ YTD Δ 52 Week Range Market Cap (A$m) Cash (A$m) TEV (A$m) AYC A1 Consolidated 0.040 ▲ 33% 0% 11 0 10 ABU ABM Resources 0.23 ▲ 2% (22%) 77 11 66 AWV Anova Metals 0.046 ▲ 7% 70% 13 1 12 AZM Azumah Resources 0.021 ▼ (5%) 5% 8 4 7 BLK Blackham Resources 0.145 ▲ 4% 184% 26 3 23 BSR Bassari Resources 0.012 ▲ 9% 0% 14 - 14 CHN Chalice Gold Mines 0.12 — 0% 10% 33 43 (10) CHZ Chesser Resources 0.035 ▲ 3% (3%) 8 1 3 DCN Dacian Gold 0.49 ▲ 7% 75% 47 8 40 EXC Exterra Resources 0.013 — 0% 0% 2 1 2 EXG Excelsior Gold 0.093 ▼ (4%) 52% 43 2 43 FML Focus Minerals 0.007 ▲ 8% (7%) 59 81 59 GCY Gascoyne Resources 0.090 — 0% 27% 15 1 14 GMR Golden Rim Resources 0.009 ▲ 20% 80% 13 1 13 GOR Gold Road Resources 0.37 ▲ 7% 51% 220 21 199 GRY Gryphon Minerals 0.064 ▲ 16% 0% 26 34 2 IDC Indochine Mining 0.006 — 0% (50%) 8 0 10 KGD Kula Gold 0.042 — 0% (5%) 11 3 11 MSR Manas Resources 0.016 — 0% 14% 8 6 6 MUX Mungana Goldmines 0.120 ▲ 9% (4%) 29 5 34 OGX Orinoco Gold 0.080 ▲ 7% 36% 12 1 11 PNR Pacific Niugini 0.067 ▲ 3% 34% 26 1 25 PXG Phoenix Gold 0.088 ▼ (6%) (10%) 37 6 31 RED Red 5 0.110 ▼ (8%) 20% 84 38 66 RNI Resource & Investment 0.079 ▲ 32% 5% 40 5 56 RNS Renaissance Minerals 0.040 ▼ (9%) (38%) 16 4 12 SAU Southern Gold 0.012 — 0% 50% 6 1 6 SIH Sihayo Gold 0.011 — 0% 38% 12 0 7 TAM Tanami Gold 0.029 ▲ 16% 107% 34 1 44 WAF West African Resources 0.076 ▼ (5%) (24%) 21 3 20 WPG WPG Resources 0.034 ▼ (6%) (11%) 9 3 6