
Recommended
Recommended
More Related Content
What's hot
What's hot (20)
Viewers also liked
Viewers also liked (12)
Similar to The Economics of Offshore Drilling Uncertainty: A Look at Sensitivity Analysis
Similar to The Economics of Offshore Drilling Uncertainty: A Look at Sensitivity Analysis (20)
More from jclark_selc
More from jclark_selc (8)
Recently uploaded
Recently uploaded (20)
The Economics of Offshore Drilling Uncertainty: A Look at Sensitivity Analysis
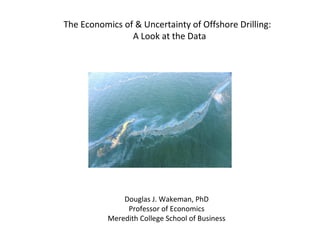
- 1. The Economics of & Uncertainty of Offshore Drilling: A Look at the Data Douglas J. Wakeman, PhD Professor of Economics Meredith College School of Business
- 2. Two reports produced in 2013 have served as the basis for discussion of the possible economic benefits of offshore drilling in the South Atlantic: Offshore Oil and Natural Gas Resources in the Atlantic, produced by Quest Offshore Resources, on behalf of the American Petroleum Institute (API) and National Ocean Industries Association (NOIA) http://questoffshore.com/wp-content/uploads/Economic-Benefits-Full-Dec.13.pdf This document is hereinafter referred to as the "API Report.“ And, The Economic Potential from Developing North Carolina's On-Shore and Off-Shore Energy Resources, by Professor Michael Walden, Deptartment of Agricultural and Resource Economics, NCSU. http://ag-econ.ncsu.edu/sites/ag-econ.ncsu.edu/files/faculty/walden/drillingnc.pdf This document is hereinafter referred to as the "Walden Report."
- 3. Much attention has been given to the very large estimates of economic benefit in the API report. Some estimates adapted from Table 1 from that report, which shows estimated impact in all of the affected states, are reproduced below: 2020 2025 2035 Employment 11,400 78,100 280,000 Contribution to GDP ($millions) 1,010 6,410 23,430 Source: Adapted from API Report, page 3, Table 1
- 4. Close to home, the API report summarizes the likely effect in the Carolinas and Virginia. Rounded values for the annual impacts in NC in 2035 will be used for comparison to other estimates: $4 billion in additions to the NC Economy & 55,000 jobs 2035 Employment 2035 Contribution to State Economies ($millions) North Carolina 55,400 4,080 South Carolina 35,600 2,730 Virginia 25,000 2,180 Source: Adapted from API Report, page 11, Table 3
- 5. Estimates of the value of offshore resources depend crucially upon the assumed path of future oil prices, for two reasons. First, higher prices will create larger benefits for any given quantity of oil and gas that is produced. Second, the amount of petroleum products that can be extracted at a profit is much larger when prices are higher. When oil sells for $120 per barrel, as it did a few years ago, many economically-marginal deposits become profitable. When the price of a barrel of oil is less than $50, as it has been recently, a large amount of production in high-cost areas ceases to be profitable, and does not occur.
- 6. The estimates of future petroleum prices used in the API Report are taken from the Annual Energy Outlook for 2013, a publication of the US Department of Energy. http://www.eia.gov/forecasts/aeo/pdf/0383%282013%29.pdf However, it is not immediately clear which specific estimates from this report are used. This is important, because as seen in the table from that report that is reproduced in the next slide, there is substantial uncertainty in the future path of oil prices.
- 7. Oil markets have changed dramatically since 2013: recent values for the price of oil have often been below the “Low Oil Price” line in the chart above. This calls into question any forecast based on values presumed to be substantially higher. All economic estimates in the API report may be regarded as likely overestimates.
- 8. An essential element of a useful forecast is Sensitivity Analysis. This is the process of determining the extent to which predicted values depend upon the assumed values of the parameters of the forecasting model. We must ask: to what extent do those estimates of $4 billion in economic value, and 55 K jobs, depend upon the assumed values of future oil prices? Not only is the API report silent regarding which specific estimates of future prices are used, it makes no attempt to enlighten the reader regarding the way that the important estimates will change if different price estimates are used. We know that there is great uncertainty, but we do not know its impact on the estimates. For that we must turn to the Walden Report.
- 9. The data in the Walden Report are not completely comparable to those in the API Report. However, some approximate comparisons can be made for certain annual values. Estimates adapted from Table 3 in the Walden Report are shown in the next slide. Although the API report used peak annual values for 2035, and Walden reports annual averages for the entire production period, the same phenomenon is being estimated.
- 10. Employment Contribution to State Economy North Carolina: Annual Averages for 30-year production period 16,910 $1.9 billion Source: Adapted from Walden Report, p. 24, Table 3
- 11. This table summarizes the key estimated outcomes, in their most comparable form. Walden’s “Spending” variable is comparable to the API economic contribution variable. Again, note the discrepancy between API’s peak annual values for 2035, versus Walden’s annual averages for the entire production period. The two reports are closer than these summary data make it appear: peak production values from the Walden estimates are fairly close to the 2035 estimates in the API report. The methods and outcomes are similar.
- 12. This table adapts Walden’s estimates of the sensitivity of the estimates of spending impact. Across any row, we see the effect of changing the estimate of the amount of petroleum resource to be recovered; high estimates of economic impact are 40 to 50 times as large as the low estimates. Going down each column, we see the effect of varying the assumptions about future oil and natural gas prices; the high estimates of economic impact are 10 to 20 times the low estimates. Combining these effects, going from the top left to the bottom right, the high estimate is 800 times as large as the low estimate. Source: adapted from Walden Report, page 29, Table 5. Sensitivity Analysis: variation in estimated Annual Economic Spending Impact ($billions) Discoverable Quantity of Oil & Gas: Low Mean High Assumed Prices for Oil & Gas: Low 0.01 0.4 0.6 Medium 0.09 2 3.9 High 0.19 4 8.1
- 13. This table adapts Walden’s estimates of similar data for the employment estimates. Across any row, he examines impact of changing the estimate of the amount of petroleum resource to be recovered; high estimates of employment impact are 40 to 50 times as large as the low estimates. Going down each column, he shows the effect of varying the assumptions about future oil and natural gas prices; the high estimates of economic impact are 12 to 14 times the low estimates. Combining these effects, going from the top left to the bottom right, the high estimate is 610 times as large as the low estimate. Source: adapted from the Walden Report, page 29, Table 5. Sensitivity Analysis: variation in estimated Annual Employment Discoverable Quantity of Oil & Gas: Low Mean High Assumed Prices for Oil & Gas: Low 118 2900 5902 Medium 809 17,437 34,400 High 1686 35,918 72,005
- 14. In contrast to the huge uncertainty in the value of drilling, recent (2011) values of tourism and fisheries in the seven coastal counties most likely to be affected by drilling are known. Absent a disaster, the upward growth path of these values over the next 40 years is much easier to anticipate. 2011 Annual Value of Tourism & Fishing in Seven Coastal NC Counties Spending Employment $3.1 Billion 37,872 Source: adapted from Walden Report, p. 33, Table 7.
- 15. This table compares the known economic value in 2011 of Tourism & Fisheries with the exceedingly speculative impacts of offshore drilling in North Carolina.
- 16. Lagniappe: How much has really changed in terms of technology and regulatory enforcement in the last decade? The photo below is of a lesser-known spill in the Gulf known as the Taylor Well. It has been leaking oil since Hurricane Ivan destroyed equipment on the sea floor in 2004. Reasonable estimates are that it continues to leak between 100 and 400 gallons per day, even after being “capped.” The resulting slick is between 10 and 30 miles long, depending on the day and the person doing the observation and estimation. Seemingly-endless litigation has attempted to force the stopping of the leak, and the release of all pertinent information to the public, with no real success.