Green-Roof Integrated Photovoltaic Canopy (GRIPV-c)

Green-Roof Integrated Photovoltaic Canopy (GRIPV-c) is a study being conducted by Marc Perez, Christina Ho, and Nathaniel Wight with the support of Columbia University and Alfred E. Smith CTE High School students (Ashley Grant, Brandon Harvey, Michael Smith, William Alicea, Jared Hatcher, Marco Dwyer, Warrick Balfour). GRIP-c aims to evaluate data collected from four model houses, one housing a control roof, another with a green roof, a standard fixed photovoltaic system, and a GRIPV-c system. The study is ongoing and is looking at temperature, relative humidity, and solar insolation data to qualitatively and quantitatively assess the positive impact of a combined green roof and photovoltaic canopy system on the health of the green roof vegetation, the PV canopy system efficiencies, and the efficiency of roof mounted HVAC air handling units.

Recommended
More Related Content
What's hot
Similar to Green-Roof Integrated Photovoltaic Canopy (GRIPV-c)
Similar to Green-Roof Integrated Photovoltaic Canopy (GRIPV-c) (20)
More from Geert Elemans
More from Geert Elemans (20)
Recently uploaded
Recently uploaded (20)
Green-Roof Integrated Photovoltaic Canopy (GRIPV-c)
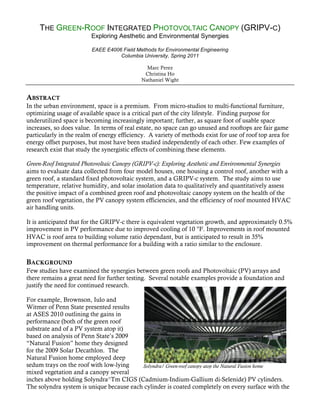
- 1. THE GREEN-ROOF INTEGRATED PHOTOVOLTAIC CANOPY (GRIPV-C) Exploring Aesthetic and Environmental Synergies EAEE E4006 Field Methods for Environmental Engineering Columbia University, Spring 2011 Marc Perez Christina Ho Nathaniel Wight ABSTRACT In the urban environment, space is a premium. From micro-studios to multi-functional furniture, optimizing usage of available space is a critical part of the city lifestyle. Finding purpose for underutilized space is becoming increasingly important; further, as square foot of usable space increases, so does value. In terms of real estate, no space can go unused and rooftops are fair game particularly in the realm of energy efficiency. A variety of methods exist for use of roof top area for energy offset purposes, but most have been studied independently of each other. Few examples of research exist that study the synergistic effects of combining these elements. Green-Roof Integrated Photovoltaic Canopy (GRIPV-c): Exploring Aesthetic and Environmental Synergies aims to evaluate data collected from four model houses, one housing a control roof, another with a green roof, a standard fixed photovoltaic system, and a GRIPV-c system. The study aims to use temperature, relative humidity, and solar insolation data to qualitatively and quantitatively assess the positive impact of a combined green roof and photovoltaic canopy system on the health of the green roof vegetation, the PV canopy system efficiencies, and the efficiency of roof mounted HVAC air handling units. It is anticipated that for the GRIPV-c there is equivalent vegetation growth, and approximately 0.5% improvement in PV performance due to improved cooling of 10 °F. Improvements in roof mounted HVAC is roof area to building volume ratio dependant, but is anticipated to result in 35% improvement on thermal performance for a building with a ratio similar to the enclosure. BACKGROUND Few studies have examined the synergies between green roofs and Photovoltaic (PV) arrays and there remains a great need for further testing. Several notable examples provide a foundation and justify the need for continued research. For example, Brownson, Iulo and Witmer of Penn State presented results at ASES 2010 outlining the gains in performance (both of the green roof substrate and of a PV system atop it) based on analysis of Penn State’s 2009 “Natural Fusion” home they designed for the 2009 Solar Decathlon. The Natural Fusion home employed deep sedum trays on the roof with low-lying Solyndra/ Green-roof canopy atop the Natural Fusion home mixed vegetation and a canopy several inches above holding Solyndra^Tm CIGS (Cadmium-Indium-Gallium di-Selenide) PV cylinders. The solyndra system is unique because each cylinder is coated completely on every surface with the
- 2. CIGS semiconductor material. The idea behind the cylinders that performance can be improved vis- a-vis a traditional fixed-tilt PV array by always having some portion of the cylinder normal to the sun’s position--and to use reflected radiation from the underlying roof surface that passes through the spaces between the cylinders. Although the Natural Fusion GRIPV system described in the papers by Brownson et. al provides a summary description of this interesting application of a novel PV technology, a 2002 paper by Kohler et. al, presented at Rio ‘02, examines and identifies the key synergies unique to GRIPV systems in much more thorough detail. Furthermore, Kohler et. al examine somewhat un- conventional GRIPV designs in that their green roof incorporates plants growing up to a height of 40 cm and required periodic (annual trimming) to maintain height. The picture at left displays one of these GRIPV-tested systems which features 1-axis tracking and multi-crystalline PV modules. The positive interactions measured and identified in the study were: 1) Green roofs reduce operation temperature of the PV system, thus increasing efficiency and energy yield 2) The PV array offers shading for the green roof, thus improving growth of plants and increasing species variety. We also seek to measure this reduction in back-of- module temperature, given the temperature drop in the local micro-climate from the green roof’s evapotranspiration in our study and thereby simulate performance gains vis-a-vis a more traditional PV system. Both the GRIPV systems referenced above share the common shortcoming of not allowing for synergistic use of space on the roof. On buildings were point-loading considerations are not an issue and green roofs provide the potential for a recreational park-setting for the occupants, the PV array would be better situated at an elevation above head-height. Our experimental study hopes to explore and quantify the benefits outlined by Kohler et. al under a new design paradigm: the GRIPV-canopy. In addition to these benefits, we will be simulating the reduced burden on HVAC loads given reduction in surface temperatures and addition of The GRIPV system with intensive green roof and moncrystalline PV in Kohler et al, 2002 photovoltaic generating capacity. 2
- 3. STUDY SITE Bronx Design & Construction Academy1 is located in The South Bronx, one of the poorest congressional districts in the United States. BDCA’s certified Career and Technical Educational (CTE) programs allows economically disadvantaged students to get unparalleled hand-on instruction in the trades, thereby provide a way out of the poverty cycle. A majority of BDCA graduates will find jobs upon graduation. BDCA high school offers endorsed diplomas in the Building Trades including plumbing, carpentry, electrical practice and installation, architectural drafting, and Heating, Ventilating, and Air Conditioning. These diplomas enable graduates to obtain Master Licenses from the NYC Department of Buildings. Once licensed, graduates can open their own contracting firms. Additionally, BDCA (formally Alfred E. Smith CTE HS) partners with Edward J. Molloy for Initiative for Construction Skills that provides students the unique opportunity to enter NYC Unions upon graduation. Since 2001 Alfred E. Smith has repeatedly helped place over 20 percent of each graduating class in high-level union jobs, including MTA, Metro North, Long Island Railroad, Smalls Electrical Construction Inc., and New York City School Construction Authority to name a few. Many others find professional jobs in Plumbing, Electrical, Carpentry, Auto Mechanics, HVAC as well as Pre Engineering. AES is associated with New York Electrical Contracting Association, New York Building Congress, New York Building and Construction Trades Council of Greater New York, Building Trades Employers Association, Architectural Construction and Engineering (ACE) Mentoring program Alfred E. Smith CTE HS also offers the training to put technical education to the test in regional and National competitions. Year after year Smith students practice what they've learned, compete, and consistently take home trophies from Skills USA and the National Automotive Technology Competition. BDCA provides CTE opportunities for special needs students. Specifically, 20 percent of the AES’ student body has an Individualized Education Program (IEP). Smith is one of the last standing schools in this city that provides self-contained classes and integrated Career & Technical Education shop classes for a large IEP population. Many of these IEP students have excelled in their respective trades and have gone on to secure employment. In addition, Alfred E. Smith CTE HS provides free adult classes at night for the community; Smith is not only an educational facility for adolescents, but also for the community. 1 http://bxdca.com/director-letter/ 3
- 4. For partial fulfillment of our grade in the course E4006 Field Methods for Environmental Engineers, we collaborated with students on the Smith campus to construct model homes. We are currently monitoring the different rooftop systems in an effort to demonstrate that solar photovoltaic and green roof technology are not mutually exclusive. With the help of BDCA students we designed and built four model homes, each with a different rooftop coverage types: Control with gravel bed, Greenroof only, Mock solar PV coverage only, Green roof with mock solar PV coverage. METHODOLOGY 1. Experimental Set Up To assure that the data collected is consistent and comparable, specially designed monitoring enclosures were constructed and co-located adjacent to each other. Four enclosures were designed to collect the data used to calculate the performance and efficiency improvements of the GRIPV-c system. Additionally, a stand to hold a pyranometer and ambient temperature and relative humidity monitor was constructed and located with the monitoring enclosures. The enclosures are designed to withstand the loading of the maximum roofing weights and to be highly sealed to prevent air/energy leakage. They are approximately 2’ x 2’ x 4’ long and are constructed from 2” x2” cedar dowels, 1” rigid insulation, and sealed with silicon sealant. They are painted with a flat black paint so that the enclosures act as a black body to absorb maximum radiation energy. 4
- 5. Enclosure 1 is the control with a standard gravel bed roof. Monitoring parameters for this enclosure include internal temperature, and near surface roof temperature. Enclosure 2 is the standard green roof installation. Monitoring parameters for this enclosure include internal temperature, and near surface green roof temperature. Varietal sedum trays were used for the green roof materials. The tray depths are approximately 4”. Enclosure 3 is the standard solar roof installation. Monitoring parameters for this enclosure include internal temperature, near surface roof temperature and rear solar panel temperature. Enclosure 4 is the GRIPV-c system. Monitoring parameters for this enclosure include internal temperature, near surface roof temperature and rear solar canopy temperature. The below pictures show Smith students framing the model homes and calibrating and labeling the sensors. 5
- 6. 2. Modeling Photovoltaic System Performance from Empirical Data Silicon-based Photovoltaics are adversely affected (in terms of solar/electric conversion efficiency) by elevated temperatures and to a lesser extent by decreased solar radiation. In this section, we develop a modeling tool to interpret Irradiance and back-of-module temperature data from our experimental setup and calculate expected energy generation and therefore, expected cost savings. We have chosen to model the JAMS(L) 72-180 solar module as the physical basis for our modeling because the manufacturer, JA Solar was as of Q1 2011 the dominant player in solar module sales worldwide. It was thought that by using specifications from the best selling solar module as such, our results would best allow themselves to be generalized. 2.1 Deriving Current/Voltage Characteristics from the Shockley Diode Equation: To model the dependencies, we needed to estimate the current/voltage (I/V) characteristic curve for this module using the Shockley diode equation. We model these I/V curves as a function of many parameters (which will be detailed below) as such: ⎛ qV ⎞ IL − I0 ⎜e nkT −1⎟ ⎝ ⎠ Imod = ⎛ qV ⎞ R I 1+ I0 ⎜e nkT −1⎟ s L ⎝ ⎠ nKT In the equation above, Imod is the module current given the module voltage (V) and temperature (T). (It is a modified version of the Shockley-Diode equation, solved for the module current instead of for € voltage as it is typically given.) The light-induced current, IL , is calculated as such: 6 €
- 7. IL = ISC ⋅ E + K 0 (T t − TSTC ) Above, the ISC is the short-circuit current (a characteristic taken from the module’s specification sheet,) E is the instantaneous radiation in terms of suns (at time ‘t’), Tt is the module temperature at € time ‘t’, TSTC is the “Standard Test Conditions” (STC) temperature at which modules are tested at and Ko is a parameter that changes the temperature to reference the Normal Operating Cell € Temperature (NOCT) instead of STC. Ko is calculated as such: ISC NOCT − ISC STC K0 = (TNOCT − TSTC ) Above, ISC NOCT is the short-circuit current evaluated at the NOCT and ISC STC is the short-circuit current evaluated at the STC. € Both of these values are given on module specification sheets. I0 is known as the ‘dark saturation current’ and this is calculated as such: € 3 −qV ⎛ € ⎞ ⎛ T ⎞ n nK g ⎜ T1 − T 1 ⎟ ⎜ ⎟ I0 = I0 STC ⎜ t ⎟ ⋅ e ⎝ t STC ⎠ ⎝ TSTC ⎠ In the equation above, Tt is the temperature at time ‘t’, TSTC is the STC temperature, ‘n’ is the diode factor (which we assume to be 2), q is the intrinsic charge of an electron, Vg is the band-gap voltage € of mono-crystalline Silicon, k is Boltzmann’s constant, and I0 STC is the dark saturation current evaluated at STC which we evaluate as such: ISC I0 STC = €qVOC ⎛ ⎞ ⎜ e nkTSTC −1⎟ ⎜ ⎟ ⎝ ⎠ Note that the above is a fixed constant a function of module-specific parameters from the specification sheet: VOC (open circuit voltage) and ISC (short circuit current.) € Finally, the shunt resistance, Rs is calculated as such: ∂V 1 RS = − ∂IVOC X V ∂V We assume to be a fixed constant (-9 x 10⁻³) that is a function of the number of cells on the ∂IVOC € module (in the case of the JAMS(L), the number of cells is 72) and the VOC of the cell. XV is the impedance at STC: € q⋅ I0 STC qVOC nkTSTC XV = ⋅e nkTSTC From these equations, we can simulate the I-V curves for any combination of T, E by modulating the appropriate parameters. € 7
- 8. 2.2 Testing the Model: Synthesized Performance Curves: Above is a plot showing the characteristic I/V curves for our chosen solar module, modeled as previously outlined for various cell temperatures. Note how the warmer the cell temperature becomes, the lower the open-circuit voltage (V0C). The drop in VOC is what has the detrimental effect on conversion efficiency. Modern inverters (DC/AC conversion) have built-in algorithms to calculate the voltage to set the string of solar modules at in order to maximize the area under the I/V curve. This position is known as the maximum power-point (MPP.) As can be seen in the plot below, where we’ve calculated Power output as a function of module voltage for the same set of temperatures, we can identify the MPP as the location where each curve peaks. As can also be deduced from the above plot, the maximum power output of the module decreases with increasing temperature. 8
- 9. 2.3 Simplifying the Model for quickly calculating performance from Time-Series Data: From this complex model, we can also modulate incident radiation at each temperature to determine relationships between the two. In the following (surface) plot, we show how the module conversion efficiency (from sunlight to DC electricity) as a function of both incident radiation and temperature. Note that the only reason efficiency changes as a function of irradiance is because the maximum power point will have to slightly shift—this is an artifact of the I/V curve shape. This yields a much- simplified model for calculating efficiency for simple integration into our modeling of power production: η = ( mb E + bb ) + TB .O.M ( ms E + bs ) The factors mi and bi are derived from linear regression of the modeled I/V curves and E is in terms of Suns (i.e. 1000 W/m2 = 1 sun) € Finally, our AC-side Power output is calculated as such: PAC = E W ( m )⋅ ∂ ⋅ η 2 r T, E where ∂r is the de-rate factor (we’ve assumed this to be ~78% as a result of losses from conversion from DC/AC in the inverter, wiring, voltage mis-match, deviation from the name-plate power output in the specification sheet, etc.) E is the radiation in W/m2. From this simplified formula, we € have a model to calculate power production (per m2 at any T and E) for our module. € 3. Modeling Expected HVAC Loading from Empirical Data 9
- 10. In order to estimate the impact each individual roof design has on HVAC loads—in lieu of an actual AC unit in operation—is to simulate the performance of one based on physical measurements and empirical relationships. In this section, we discuss how we modeled these performances from derived R-values of the different roof substrates based on exterior surface, interior and exterior ambient temperature readings. 3.1 Modeling R-values from data: From a recent report from the DOE2 Energy Efficiency and Renewable Energy division, we extracted an empirical relationship between the temperature of an internal wall (TW,INT ), the temperature of an external-facing wall (TW,EXT ) and the ambient external temperature (TEXT,A.) Internal wall temperature we take as mean air temperature from our thermistor hanging in the center of each box, but external wall temperature, we will need to calculate periodically using an IR thermometer or equivalent as this is not a quantity we are directly measuring in real-time. External temperature we are also measuring directly. From this DOE report, which is reproduced by the North Dakota Department of Commerce in a handy table3, we used multiple ordinary least squares regression to build empirical relationships for any combination of TW,EXT TW,INT and TEXT,A. In fact the only quantity we care about at this point is the difference between the temperatures of the internal facing wall and the external facing wall: ΔT = TW ,EXT − TW ,INT After examining the data roughly, a power-model of the form: € B ΔT R T = AΔT ( ΔT ) Is determined to best fit R values (we fit the imperial R values in BTU to the ΔT readings. Using o.l.s. regression, we fit the parameters AΔT and BΔT from empirical data with an R2 of over 99% for € each discrete exterior temperature given, (hence R T ). Following this, we examined the change in both AΔT and BΔT with external temperature. The result being that€ ΔT can be approximated by A linear regression quite well and that BΔT shows no trend so we took the mean across all discrete € € temperatures: € € € € AΔT = mm (TEXT ,A ) + bm € BΔT = BΔT In excel, extracting the 0th and 1st order moments from a regression is simple using a combination of index() and linest() functions. € the end, we end up with a combined formula for the R value of: In € [ ] R = mm (TEXT ,A ) + bm ⋅ [ ΔT ] B ΔT 2 € U.S. Department of Energy. EERE. (2006, 0530). Insulation. Retrieved March 10, 2008,from Energy Savers, Tips on saving energy and money at home: www1.eere.energy.gov/ consumer/tips/insulation.html 3 Pedersen, C., Hellevang, K.. NDSU. (2010, March.) Determining Insulation and Infiltration Levels Using an Infrared Thermometer: 10
- 11. ft 2 °F⋅ hr The above form was derived such that R is in units of --it is not as easy to visualize in BTU metric units with the Temperatures in terms of °C. Below are the values: € Using these empirical relationships, we are now able to determine an R value for any combination of the three key temperature readings (TW,EXT TW,INT and TEXT,A.) However, as there might be some error in the measurements we take on the exterior wall surface, we will calculate an R value at each time all pieces of data are available and take a moving cumulative average. In the plot above, we see the results of modeling this empirical data from DOE. As ΔT increases, the R-value experiences exponential decay, while the higher the ambient external temperature, the expected R-value sees a linear decrease. Because the data from which these relationships were derived only represents external temperatures from -40°C to 10°C, that is the only range of € temperatures at which we will calculate R. 3.2 Modeling Heat Transfer out of the Boxes: Using these derived R values—which we will calculate for each interior surface of the boxes, we can • calculate the heat flux ( Q ) at any given time. Using an ASHRAE standard for thermal comfort (we choose ~23°C for our model), we keep the internal temperature fixed at this level and measuring the temperature difference between this value and the ambient external temperature. This gives us a new ΔTop (op for operational), and along with the R-values, we calculate the flux as such: € 11 €
- 12. • ΔTop Q= R Fluxes are calculated for each surface within the boxes corresponding to their respective R-values and a relative weight is given to each depending on the fraction (fi) of the interior surface area covered by each: € • i • QTOT = ∑ Qi f i 1 Our model is flexible enough to take any house dimensions and calculate these weighting factors and the corresponding fluxes for each surface (and net flux). These flux values are ostensibly in W 2 , € m and the final step is to convert these values—which are required HVAC loads—to the required electrical load by dividing by the SEER rating (Btu/Wh) given as a badge of efficiency to HVAC units. These can range widely—from near zero to over 26 for the best, most modern units—so we have left it as a user parameter. Our total energy flux for a given time period (t = 0€ t = t ) is just to the integral of the instantaneous heat fluxes… in our discrete case it will be a sum of these fluxes multiplied by the length of the recording interval: t • E tot,electrical = ∫Q 0 TOT dt € RESULTS & DISCUSSION 12
- 13. As limited data is available at the time of this report, simulated time series data has been used to produce anticipated results for the following areas of concern. 1. Comparison of Simulated HVAC Loads This plot shows expected results using our model to interpret the predicted time series data. This model used data simulated from a Typical Meteorological Year from the National Solar Radiation Database in New York State for solar radiation. Using the methods discussed previously for thermal energy transfer, our model outputs estimated energy loads for each house (on a /m3 basis) based on the internal temperatures, solar radiation and estimated R- value. ASHRAE Standard 55 - Thermal Environmental Conditions for Human Occupancy is used to define indoor conditions. The envelopes, or shaded regions, define a range of comfortable temperatures and humidity levels for two reasonable insulation levels for the occupants (0.5-1.0 CLO). This allowed for calculation of the required energy to bring the internal temperature into to the ASHRAE standard envelope. The results below reflect the net energy load for a 1-story house (360 m3) with 120 m2 of roof space from each of our individual houses. This house model was chosen as it most closely resembles the relative dimensions of the monitoring enclosures. The dramatic reduction in net energy for the PV based systems accounts for the offset in net energy required due to the supply of energy from the PV system itself. As this graphic shows, there is a real reduction in energy requirements for HVAC loads anticipated due to the insulating value of the green roof itself. Coupled with the significant offset of net energy required for the system due to the PV power generation, a combined system is anticipated to have excellent gains over a traditional gravel roof. One shortcoming of Key: GRAV gravel roof only, GR_1 Green roof only, GRAV-pv gravel roof with PV, GRIPV-c this model is that it geen roof with pv canopy can only describes 13
- 14. savings for buildings with roof area to building volume ratios similar to the enclosure. 2. Comparison of Net Energy Costs Based on the annual energy saving described in the pervious section, we have calculated the estimated cost savings for each module type for a house with dimensions mentioned in the previous section. Here, we have assumed the cost of electricity to be $0.12/kWh (NYPA’s average rate throughout 2010), and net metering to occur at the same rate for the PV. PV system size is 11 kW and considered to be flat for the purposes of testing the model. These costs are relative operating costs; they do not take into account amortized capital outlays for the Green Roof or for the PV. These will be an addition to the models over the course of the summer. FUTURE STEPS To improve data collection results, a number of changes to the experimental set up and data analysis methods will be considered. These include: • Calibrate probes periodically to ensure monitoring values are representative • Relocation of the experimental monitoring enclosures to a location with a higher percentage of daily solar insolation exposure • Potential expansion of the data collection set up to other high schools/locations in the area for additional data sets • Evaluation of capital costs of installations • Develop method to compare impact on HVAC system loads with varying roof area to building volume ratios. • Secure funding and construct GRIPV-c monitoring enclosure with real solar PV panels to demonstrate the calculated performance levels 14
- 15. In the future we also plan to conduct a qualitative and quantitative assessment of Green Roof’s health. Using an NDVI (Normalized Difference Vegetation Index) camera, we will use image analysis to conduct various types of measurements, color quantification and classifications. A Normalized Difference Vegetation Index camera will allow us to measure the diseased area on our green roof sedum leaves, and quantify plant health and vigor. Additionally, students at Bronx Design & Construction Academy & Alfred E. Smith Career & Technical Education high school have already began planning to set up a blog site and Facebook page in an effort to communicate and document their work and continued involvement in this project. Furthermore, teachers and students at Alfred E. Smith Career & Technical Education high school will engage in activities that will strengthen their understanding of science, enhance school curriculum, as well as provide content that meets below National Science Standards4. Standard 1: Analysis, Inquiry, and Design Students will use mathematical analysis, scientific inquiry, and engineering design, as appropriate, to pose questions, seek answers, and develop solutions. Standard 4: Science Students will understand and apply scientific concepts, principles, and theories pertaining to the physical setting and living environment and recognize the historical development of ideas in science. Standard 5: Technology Students will apply technological knowledge and skills to design, construct, use, and evaluate products and systems to satisfy human and environmental needs. Standard 6: Interconnectedness: Common Themes Students will understand the relationships and common themes that connect mathematics, science, and technology and apply the themes to these and other areas of learning. Finally, future work on this project will provide students and staff at Bronx Design & Construction Academy & Alfred E. Smith Career & Technical Education high school 1. Integrate Career and Technical Education and content-based curricula, 2. Project-based learning opportunities, 3. Students the opportunity to identify, evaluate and reflect on environmental issues in the community and in our world, 4. Strengthen the ability of students to make predictions and decisions based on measurement, observations, and calculations, and 5. Heightened awareness of environmental awareness and stewardships ACKNOWLEDGMENTS 4 http://www.nap.edu/ 15
- 16. Many thanks to Wade McGillis, Nadine Els, and Diana Hsueh for their continued advisement and financial support, without which this project would not have happened. Additionally, thanks to all the students who participated from the Bronx Design & Construction Academy & Alfred E. Smith Career & Technical Education high school, specifically: Ashley Grant, Brandon Harvey, Michael Smith, William Alicea, Jared Hatcher, Marco Dwyer, Warrick Balfour. REFERENCES Brownson, J.R.S. and L.D. Iulo. Upsetting the Balance Beam: System Integrative Photovoltaics as Purposeful Manipulation of Energy Demand and Microclimate in the Built Environment. in proc. ASES National Solar Conference. 2010. Phoenix, AZ: American Solar Energy Society. Kohler, M., et al., Photovoltaic Panels on Greened Roofs: Positive Interaction Between two Elements of Sustainable Architecture, in RIO '02 - World Climate & Energy Event. January 6-11, 2002: Rio de Janiero. p. 151-158. Sui, J. and J. Munemoto, Shape Study on a Green Roof Integrated Photovoltaic System for Bi-objective Optimization of Investment Value and CO2 Emission. Journal of Asian Architecture and Building Engineering, 2007. 6 (2): p. 307-314. Witmer, L.T. and J.R.S. Brownson. System Integrative Design in the 2009 Penn State Solar Decathlon Net- Zero Energy Home. in Proc. ASES National Solar Conference. 2010. Phoenix, AZ: American Solar Energy Society. 16