Call Girls Service Mukherjee Nagar @9999965857 Delhi 🫦 No Advance VVIP 🍎 SER...
Eco Structure 4 2009
1. ecommercial By Scott Florida PhotoS courteSy oF u.S. General ServiceS adminiStration unleSS otherwiSe noted
SuStainable
Proof
While the rush to build sustainably may
be somewhat tempered by the economic
downturn, a 2008 study conducted by
the Washington, D.C.-based U.S. Gen-
eral Services Administration of 12 feder-
al buildings demonstrates that buildings
designed to be sustainable deliver on their
promise of resource savings and greater
occupant comfort.
Prepared by GSA’s Public Buildings
Service’s Office of Applied Science in
conjunction with Pacific Northwest Na-
tional Laboratory, Richland, Wash., and
the University of California Berkeley’s Cen-
ter for the Built Environment, the study
sought to answer the question, “Does
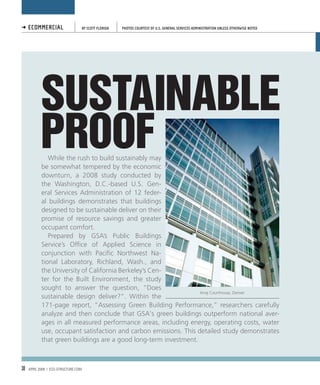
Arraj Courthouse, Denver
sustainable design deliver?”. Within the
171-page report, “Assessing Green Building Performance,” researchers carefully
analyze and then conclude that GSA's green buildings outperform national aver-
ages in all measured performance areas, including energy, operating costs, water
use, occupant satisfaction and carbon emissions. This detailed study demonstrates
that green buildings are a good long-term investment.
30 april 2009 i eco-structure.com
2. A Post-occuPAncy study of 12 federAl Buildings demonstrAtes the VAlue of going green
ReseaRch Design of California Berkeley’s Center for the Built Environment; and the Energy Information Ad-
GSA owns and leases more than 354 million square ministration, Washington. Because the researchers evaluated actual, not modeled, building
feet (33 million m²) of space in 8,600 buildings in more performance, the results were considered reliable and objective.
than 2,200 communities nationwide. It is America’s
largest public real-estate organization and bears a stuDy FinDings
unique responsibility to demonstrate sustainable lead- The study confirmed that specifically incorporating energy considerations, such as Energy Star
ership. As local, state and federal policy makers consider and Title 24, into design leads to improved energy performance. For example, those buildings
mandating green-building guidelines, it is important that received more LEED Optimize Energy Credits had lower energy-use-intensity estimates.
that government leaders demonstrate that require- The measured energy performance of each building also was compared to the Commer-
ments are workable and produce tangible benefits to cial Buildings Energy Consumption Survey, or CBECS, national; CBECS regional; and GSA
building owners and occupants.
Although GSA had been applying sustainable-
design principles to its buildings since 1999, in
2003, the group established a goal of achieving
Washington-based U.S. Green Building Council’s LEED although the 12 buildings in total only were 7
Silver for all new buildings. To determine the potential percent better than the national average for
added benefits of sustainable buildings, GSA commis- operations-and-maintenance costs, the
sioned a comprehensive post-occupancy evaluation of
top-performing one-third were 41 percent below
12 of its sustainably designed buildings in the summer
of 2007. The selected buildings reflect different U.S.
u.s. commercial buildings’ average.
regional climates, various uses (courthouses, offices,
etc.), and a mix of build-to-suit leases and federally
owned buildings. Seven of the buildings were LEED
certified at various levels and one was LEED regis-
tered. The remaining four were designed to meet
the requirements of other programs, including the
Washington-based U.S. Environmental Protection
Agency’s Energy Star and California’s Title 24 en-
ergy standard. The table, page 38, identifies the GSA
buildings evaluated as part of the study.
Several factors influenced the selection of buildings
for the study, including buildings built or remodeled
since 2000 that included sustainable design or ener-
gy efficiency as a key design consideration. Another
important factor was the ability to collect a minimum
of 12 months of operating data, beginning no sooner
than six months after the building-occupancy date,
and occupants’ willingness to participate in the post-
occupancy study.
Building representatives provided utility bills,
maintenance budgets and supported an occupant
survey for the key data inputs. The performance
data then was compared to industry baselines
developed from GSA; the U.S. Department of En-
ergy, Washington; International Facility Management
Association, Houston; Building Owners and Managers
Association International, Washington; EPA; University
Arraj Courthouse
eco-structure.com i april 2009 31
3. Key Findings
compared to national averages, buildings in the washington, d.c.-based u.s. general services administration’s
post-occupancy study achieved:
• 26 percent less energy use (65 kBtu per square foot per year vs. 88 kBtu per square foot per year)
• 13 percent lower aggregate maintenance costs ($2.88 per square foot vs. $3.30 per square foot)
• 27 percent higher occupant satisfaction
• 33 percent fewer carbon-dioxide emissions (19 pounds per square foot per year vs. 29 pounds
per square foot per year)
Curtis National Park Service Building, Omaha, Neb.
national averages. All the buildings performed
better, some up to 40 percent better, than their
respective CBECS averages and most performed
better than the GSA goal. (Every four years, the
Energy Information Administration collects CBECS
data on building characteristics and energy use
from thousands of buildings across the U.S. A
building’s comparison baseline is the average of
those buildings in the CBECS survey that have
similar building and operating characteristics.)
In addition, carbon-dioxide equivalents for
the buildings were calculated using the Energy
Star Portfolio Manager program, an interactive
energy-management tool developed by the EPA.
All buildings studied were below their CBECS
average, and all but one was below the ex-
pected CO2 equivalent emissions for Energy
Star-rated buildings.
For water use, researchers calculated a
building baseline based on occupancy. Approxi-
mately half the buildings used less domestic water
than their baseline, though all the buildings
together averaged only 3 percent better than
baseline-performance expectations. The study’s
authors cite the greatest difficulty in water
calculations because of the lack of metering
data on potable water use compared to landscape
and process water use. While some buildings im-
plemented low-flow devices, water conservation
CIRCLE NO. 31 or http://ecostructure.hotims.com
32 april 2009 i eco-structure.com
4. << ecommeRcial gsa’s oFFice oF
[continued from page 32]
high-PerFormance
was not a universal high priority across all 12
green Buildings Announced in early 2008, the Washington, D.C.-based U.S. General
Services Administration established an Office of High-Performance Green Buildings with a mandate to ensure all
buildings. Despite the complexity concerning federal buildings are meeting sustainable-design and energy-reduction targets of the Energy Independence and Se-
water savings, the top one-third of the build- curity Act of 2007. The office works in conjunction with the Washington-based U.S. Department of Energy’s Office
ings in the study were performing 39 percent of Commercial High-Performance Green Buildings, which has the same responsibility for private-sector buildings.
better than their baselines. The newly created GSA office will address new, renovated and leased buildings' life-cycle costs and operating
According to the occupancy surveys, GSA’s procedures, as well as design and construction. The legislated mandate requires federal buildings achieve a 30
sustainably designed buildings demonstrate a percent reduction in total energy use by 2015 relative to 2005 levels. It also requires new and renovated federal
27 percent higher occupant satisfaction rate buildings to achieve a 55 percent reduction in fossil-fuel use by 2010 from 2003 levels with complete elimination
than the national average. The Center for by 2030. For more information, visit www.gsa.gov.
the Built Environment developed the national
average based on more than 48,000 survey
responses across 335 buildings. In fact, all 12
Post-occuPancy-evaluated gsa Buildings
GSA buildings scored better than the national
average for U.S. commercial buildings in terms location name year Built/year green achievement
of overall building and workplace quality, IAQ, renovated
cleanliness and quality of maintenance. The
biggest factors adversely influencing occupant
Cleveland Metzenbaum Courthouse 1910 / 2005 LEED-NC Certified
satisfaction were poor acoustics, lighting and
Davenport, Iowa Davenport Courthouse 1933 / 2005 LEED registered
maintenance problems.
Denver Arraj Courthouse 2002 Green Building Challenge
gReateR integRation
yielDs Results
The two LEED Gold buildings in the study dem- Fresno, Calif. Coyle Courthouse and Federal Building 2001 California Energy
onstrate that integrated design—a necessity to standard title 24
achieve a Gold rating—consistently achieved
higher levels of performance on all measures. greeneville, tenn. Quillen courthouse 2001 energy star
The Curtis National Park Service Building, Oma-
ha, Neb., was in the top one-third for energy
Knoxville, Tenn. Duncan Federal Building 1986 / 2005 LEED-EB Silver,
energy star
performance while its water costs were 91
percent below baseline and its domestic wa-
Lakewood, Colo. Department of Transportation 2001 LEED-NC Silver
ter use was 50 percent below baseline. Its CO2
emissions were 34 percent lower than baseline,
averaging 1.9 tons (1.7 metric tons) per person. Ogden, Utah Scowcroft Federal Building 2001 LEED-NC Silver
The Omaha Department of Homeland Secu-
rity building’s Energy Star rating also placed Omaha, Neb. Department of Homeland Security 2001 LEED-NC Gold
it in the top one-third for energy efficien-
cies. Using rainwater harvesting and low- and Omaha Curtis National Park Service Building 2004 LEED-NC Gold
auto-flow fixtures resulted in water costs 66
percent below baseline with domestic water use
Santa Ana, Calif. Santa Ana Federal Building 1975 / 2005 California Energy
standard title 24
58 percent below baseline. (To read about
this project, see “ecommercial,” page 36 of
Youngstown, Ohio Jones Federal Building and Courthouse 2002 LEED-NC Certified
eco-structure’s January/February 2007 issue.)
Scowcroft Federal Building, Ogden, Utah
34 april 2009 i eco-structure.com
5. Metzenbaum Courthouse, Cleveland/Photo courteSy oF Kevin reeveS PhotoGraPhy
building representatives
provided utility bills,
maintenance budgets
and supported an
occupant survey for
the key data inputs.
Although the 12 buildings in total were only 7 percent better than the
national average for operations-and-maintenance costs, the top-performing
one-third were 41 percent below U.S. commercial buildings’ average. IFMA
and BOMA provide the main source of statistics on the state of commer-
cial buildings. Once again, the two LEED Gold buildings scored the highest,
partly because of lower utility and janitorial costs, recycling efforts and
green-cleaning practices.
long-teRm RamiFications
Although GSA’s study involved a small number of buildings, it included
more than one-third of the agency’s LEED-certified buildings. The best
performing buildings were those that took a fully integrated approach to
sustainable design. This approach has helped GSA meet its mandate to
deliver buildings that use substantially less energy, cost less to operate and
maintain, and lead to greater occupant satisfaction. During challenging
economic times, the entire building community—public and private—will
benefit from achieving these same performance standards.
scott floridA writes about architecture and sustainability from Oakland,
Calif.
CIRCLE NO. 4 or http://ecostructure.hotims.com
eco-structure.com i april 2009 35