More Related Content
Similar to indicadores macro (20)
indicadores macro
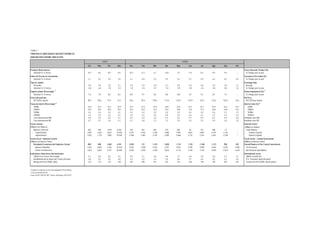
- 1. Cuadro 1
PRINCIPALES INDICADORES MACROECONÓMICOS
MAIN MACROECONOMIC INDICATORS
2007 2008
Oct Nov Dic Año Ene Feb Mar Abr May Jun Jul Ago Sep Oct
Producto Bruto Interno Gross Domestic Product (%)
Variación % 12 meses 10.7 8.6 10.1 8.9 10.7 12.7 6.1 14.0 7.5 11.5 8.3 8.9 9.9 -.- % Change year to year
Indice de Precios al Consumidor Consumer Price Index (%)
Variación % 12 meses 3.1 3.5 3.9 1.8 4.1 4.8 5.5 5.5 5.4 5.7 5.8 6.3 6.2 6.5 % Change year to year
Tipo de cambio Exchange Rate
Promedio 3.0 3.0 3.0 3.1 3.0 2.9 2.8 2.7 2.8 2.9 2.8 2.9 3.0 3.1 Average
Variación % 12 meses -5.8 -6.4 -7.0 -2.4 -1.0 -2.5 -5.7 -7.8 -5.9 -3.0 -4.4 -3.0 -0.5 3.2 % Change year to year
Empleo urbano (Porcentaje) 1/ Urban Employment (%) 1/
Variación % 12 meses 7.8 7.8 8.8 8.2 8.8 9.1 8.6 8.8 10.0 9.5 9.3 8.4 7.4 -.- % Change year to year
Precio del petroleo Oil Price
WTI (US$ x barril) 85.9 94.8 91.4 72.3 93.0 95.4 105.5 112.6 125.4 133.9 133.4 116.6 103.9 76.6 WTI (US$ per barrel)
Tasas de interés (Porcentaje) 2/ Interest rates (%) 2/
TAMN 22.8 22.5 22.3 22.9 23.3 23.3 23.9 23.8 23.6 23.7 23.7 23.9 24.3 24.1 TAMN
TAMEX 10.5 10.4 10.5 10.5 10.3 10.2 10.3 10.5 10.8 11.0 11.0 10.8 10.8 10.7 TAMEX
TIPMN 3.4 3.4 3.3 3.2 3.2 3.2 3.3 3.2 3.4 3.5 3.5 3.6 3.7 3.7 TIPMN
TIPMEX 2.4 2.4 2.5 2.3 2.6 2.4 2.6 2.8 2.9 2.6 2.2 2.3 2.3 2.4 TIPMEX
Tasa interbancaria MN 5.0 5.0 5.0 4.7 4.4 5.0 5.2 5.4 5.5 5.7 5.9 6.2 6.4 6.6 Interbank rates MN
Tasa interbancaria ME 6.1 5.3 5.9 5.7 5.7 6.6 7.3 7.2 7.8 4.3 2.5 4.9 2.6 3.2 Interbank rates ME
Sector externo External Sector
(Millones de Dólares) (Millions of Dollars)
Balanza Comercial 665 590 1,019 8,356 332 561 564 379 466 65 331 506 -15 -.- Trade Balance
Exportaciones 2,691 2,361 2,822 27,956 2,519 2,442 2,760 2,689 2,934 2,837 3,091 2,972 2,732 -.- Exports of goods
Importaciones 2,027 1,772 1,802 19,599 2,188 1,881 2,195 2,309 2,469 2,772 2,761 2,467 2,748 -.- Imports of goods
Sector fiscal - Gobierno Central Fiscal Sector - Central Government
(Millones de Nuevos Soles) (Millions of Nuevos Soles)
Resultado Económico del Gobierno Central 809 800 -2,867 6,181 2,598 121 1,475 3,838 1,174 1,170 -1,438 -1,121 990 492 Overall Balance of the Central Government
Ingresos tributarios 4,453 4,403 4,166 52,462 5,035 3,948 4,543 6,797 4,533 4,785 5,099 4,640 5,091 4,926 Tax Revenues
Gastos no financieros 3,814 3,832 7,537 49,509 3,028 3,593 3,428 3,812 4,112 4,128 7,155 5,829 4,679 4,678 Non financial expenditures
0
Indicadores financieros internacionales International sector
LIBOR a tres meses (Porcentaje) 5.1 5.0 5.0 5.3 4.0 3.1 2.8 2.8 2.7 2.8 2.8 2.8 3.1 4.1 LIBOR 3-month (%)
Rendimiento de los bonos del Tesoro (30 años) 4.8 4.5 4.5 4.8 4.3 4.5 4.4 4.4 4.6 4.7 4.6 4.5 4.3 4.2 U.S. Treasuries yield (30 years)
Riesgo país Perú EMBI+ (pbs) 139 175 175 138 195 209 221 182 154 160 198 195 258 475 Country risk Perú EMBI+ (basis points)
1/ Empleo en empresas de 10 y más trabajadores (Perú Urbano).
2/ Tasas promedio del mes.
Fuente: BCRP, SIAF/SP, MEF, Reuters, Bloomberg, SBS, MTPE.