1. BAXTER -- PAGE 6
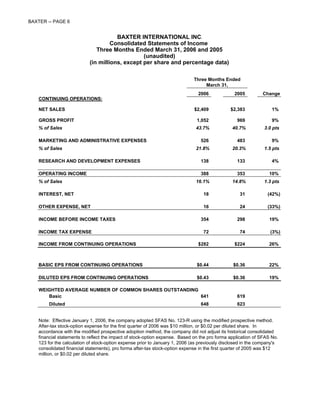
BAXTER INTERNATIONAL INC.
Consolidated Statements of Income
Three Months Ended March 31, 2006 and 2005
(unaudited)
(in millions, except per share and percentage data)
Three Months Ended
March 31,
2006 2005 Change
CONTINUING OPERATIONS:
NET SALES $2,409 $2,383 1%
GROSS PROFIT 1,052 969 9%
% of Sales 43.7% 40.7% 3.0 pts
MARKETING AND ADMINISTRATIVE EXPENSES 526 483 9%
% of Sales 21.8% 20.3% 1.5 pts
RESEARCH AND DEVELOPMENT EXPENSES 138 133 4%
OPERATING INCOME 388 353 10%
% of Sales 16.1% 14.8% 1.3 pts
INTEREST, NET 18 31 (42%)
OTHER EXPENSE, NET 16 24 (33%)
INCOME BEFORE INCOME TAXES 354 298 19%
INCOME TAX EXPENSE 72 74 (3%)
INCOME FROM CONTINUING OPERATIONS $282 $224 26%
BASIC EPS FROM CONTINUING OPERATIONS $0.44 $0.36 22%
DILUTED EPS FROM CONTINUING OPERATIONS $0.43 $0.36 19%
WEIGHTED AVERAGE NUMBER OF COMMON SHARES OUTSTANDING
Basic 641 619
Diluted 648 623
Note: Effective January 1, 2006, the company adopted SFAS No. 123-R using the modified prospective method.
After-tax stock-option expense for the first quarter of 2006 was $10 million, or $0.02 per diluted share. In
accordance with the modified prospective adoption method, the company did not adjust its historical consolidated
financial statements to reflect the impact of stock-option expense. Based on the pro forma application of SFAS No.
123 for the calculation of stock-option expense prior to January 1, 2006 (as previously disclosed in the company's
consolidated financial statements), pro forma after-tax stock-option expense in the first quarter of 2005 was $12
million, or $0.02 per diluted share.
2. BAXTER -- PAGE 7
BAXTER INTERNATIONAL INC.
Condensed Consolidated Balance Sheets
(unaudited)
($ in millions)
March 31, December 31,
2006 2005
ASSETS
Cash and equivalents $881 $841
Receivables 1,750 1,766
Inventories 2,006 1,925
Other current assets 594 584
Total current assets 5,231 5,116
Property, plant and equipment, net 4,122 4,144
Other long-term assets 3,427 3,467
Total assets $12,780 $12,727
LIABILITIES AND SHAREHOLDERS' EQUITY
Short-term debt $129 $924
Other current liabilities 2,796 3,241
Long-term debt 2,276 2,414
Other long-term liabilities 1,832 1,849
Shareholders' equity 5,747 4,299
Total liabilities and shareholders' equity $12,780 $12,727
3. BAXTER -- PAGE 8
BAXTER INTERNATIONAL INC.
Cash Flows from Operations and Changes in Net Debt
(unaudited)
($ in millions)
Cash Flows from Operations
(Brackets denote cash outflows) Three Months Ended
March 31,
2006 2005
Net income $282 $226
Adjustments
Depreciation and amortization 139 147
Deferred income taxes 2 23
Stock compensation 18 1
Other 18 17
Changes in balance sheet items
Receivables 38 59
Inventories (63) 19
Accounts payable and accrued liabilities (105) (259)
Restructuring payments (19) (43)
Other (5) 82
Cash flows from operations $305 $272
Changes in Net Debt
Increase (decrease) Three Months Ended
March 31,
2006 2005
Net debt, January 1 $2,497 $3,185
Cash flows from operations (305) (272)
Capital expenditures 76 65
Dividends 363 359
Issuances of common stock (1,249) -
Purchases of treasury stock 171 -
Other, including the effect of exchange rate changes (29) 156
Increase (decrease) in net debt (973) 308
Net debt, March 31 $1,524 $3,493
Key statistics, March 31:
Days sales outstanding 54.8 59.2
Inventory turns 2.6 2.6
Net-debt-to-capital ratio (A) 21.0% 34.9%
The decrease in the debt-to-capital ratio from March 31, 2005 to March 31, 2006 primarily related to the
(A)
settlement of the company's equity units. In February 2006, the purchase contracts included in the
company's equity units matured, and the company issued approximately 35 million common shares in
exchange for $1.25 billion. Management used a portion of the cash proceeds to pay down maturing debt.
The net-debt-to-capital ratio at March 31, 2005 was calculated in accordance with the company's primary
credit agreements, which gave 70% equity credit to the company's $1.25 billion equity units debt
outstanding on that date (the majority of which was repurchased and retired in the fourth quarter of 2005).
Refer to the company's Form 10-K for the year ended December 31, 2005 for additional information
regarding the equity units.
4. BAXTER -- PAGE 9
Baxter International Inc.
Net Sales from Continuing Operations
Period Ending March 31, 2006
(unaudited)
% Growth @ % Growth @
Q1 Q1
Actual Rates Constant Rates
($ in millions) 2006 2005
BioScience
United States $474 $398 19% 19%
International 526 504 4% 11%
Total $1,000 $902 11% 15%
Medication Delivery
United States $491 $552 (11%) (11%)
International 425 426 -% 4%
Total $916 $978 (6%) (4%)
Renal
United States $94 $94 -% -%
International 399 409 (2%) 1%
Total $493 $503 (2%) 1%
Baxter International Inc.
United States $1,059 $1,044 1% 1%
International 1,350 1,339 1% 6%
Total $2,409 $2,383 1% 4%
5. BAXTER -- PAGE 10
Baxter International Inc.
Key Product Line Sales
Period Ending March 31, 2006
(unaudited)
Q1 Q1 % Growth @ % Growth @
($ in millions) 2006 2005 Actual Rates Constant Rates
BioScience
Recombinants $374 $344 9% 14%
1
Plasma Proteins 192 170 13% 15%
Antibody Therapy 183 89 106% 110%
BioSurgery 2 69 66 5% 8%
Transfusion Therapies 124 133 (7%) (4%)
Other 3 58 100 (42%) (39%)
Total BioScience $1,000 $902 11% 15%
Medication Delivery
IV Therapies 4 $304 $296 3% 5%
Drug Delivery 195 204 (4%) (3%)
Infusion Systems 195 230 (15%) (14%)
Anesthesia 212 231 (8%) (6%)
Other 5 10 17 (41%) (35%)
Total Medication Delivery $916 $978 (6%) (4%)
Renal
PD Therapy $388 $377 3% 6%
HD Therapy 105 126 (17%) (16%)
Total Renal 6 $493 $503 (2%) 1%
TOTAL BAXTER $2,409 $2,383 1% 4%
1
Includes plasma-derived hemophilia (FVII, FVIII, FIX and FEIBA), albumin, and certain other plasma-based products. Sales of
Tisseel, sales of plasma to third parties, and contract manufacturing revenues were previously reported in Plasma Proteins,
and are now reported in other product lines, as detailed below.*
2
Includes sales of Tisseel and FloSeal/CoSeal, which were previously reported in Plasma Proteins and Other, respectively.*
3
Principally includes vaccines and sales of plasma to third parties. The sales of plasma to third parties were previously reported in Plasma
Proteins. The prior year sales include contract manufacturing revenues.*
4
Principally includes intravenous solutions and nutritional products.
5
Principally includes other hospital-distributed products.
6
Sales of pharmaceutical and certain other products, which were previously reported in Other, are now reported in PD Therapy.*
* Prior year sales data has been reclassified to reflect the above-mentioned changes.
6. BAXTER -- PAGE 11
Baxter International Inc.
Key Product Line Sales -- US/International
Period Ending March 31, 2006
(unaudited)
Q1 2006 Q1 2005 % Growth
($ in millions) US International Total US International Total US International Total
BioScience
Recombinants $161 $213 $374 $145 $199 $344 11% 7% 9%
Plasma Proteins 1 67 125 192 48 122 170 40% 2% 13%
Antibody Therapy 139 44 183 48 41 89 190% 7% 106%
BioSurgery 2 39 30 69 35 31 66 11% (3%) 5%
Transfusion Therapies 56 68 124 65 68 133 (14%) -% (7%)
Other 3 12 46 58 57 43 100 (79%) 7% (42%)
Total BioScience $474 $526 $1,000 $398 $504 $902 19% 4% 11%
Medication Delivery
IV Therapies 4 $104 $200 $304 $94 $202 $296 11% (1%) 3%
Drug Delivery 125 70 195 139 65 204 (10%) 8% (4%)
Infusion Systems 124 71 195 155 75 230 (20%) (5%) (15%)
Anesthesia 133 79 212 158 73 231 (16%) 8% (8%)
Other 5 5 5 10 6 11 17 (17%) (55%) (41%)
Total Medication Delivery $491 $425 $916 $552 $426 $978 (11%) -% (6%)
Renal
PD Therapy $66 $322 $388 $62 $315 $377 6% 2% 3%
HD Therapy 28 77 105 32 94 126 (13%) (18%) (17%)
Total Renal 6 $94 $399 $493 $94 $409 $503 -% (2%) (2%)
TOTAL BAXTER $1,059 $1,350 $2,409 $1,044 $1,339 $2,383 1% 1% 1%
1
Includes plasma-derived hemophilia (FVII, FVIII, FIX and FEIBA), albumin, and certain other plasma-based products. Sales of
Tisseel, sales of plasma to third parties, and contract manufacturing revenues were previously reported in Plasma Proteins,
and are now reported in other product lines, as detailed below.*
2
Includes sales of Tisseel and FloSeal/CoSeal, which were previously reported in Plasma Proteins and Other, respectively.*
3
Principally includes vaccines and sales of plasma to third parties. The sales of plasma to third parties were previously reported in Plasma
Proteins. The prior year sales include contract manufacturing revenues.*
4
Principally includes intravenous solutions and nutritional products.
5
Principally includes other hospital-distributed products.
6
Sales of pharmaceutical and certain other products, which were previously reported in Other, are now reported in PD Therapy.*
* Prior year sales data has been reclassified to reflect the above-mentioned changes.