SlideShare a Scribd company logo
1 of 27
Download to read offline
The TJX Companies, Inc.
                                 C O N S O L I D AT E D S TAT E M E N T S O F I N C O M E

                                                                                              Fiscal Year Ended
                                                                          J a n u a ry 31,       J a n u a ry 25,       J a n u a ry 27,
Dollars in Thousands Except Per Share Amounts                                        1998                   1997                   1996
                                                                            (53 weeks)

Net sales                                                              $7,389,069             $6,689,410             $3,975,115
Cost of sales, including buying and occupancy costs                     5,676,541              5,198,783              3,143,257
Selling, general and administrative expenses                            1,185,755              1,087,137                669,876
Store closing costs                                                             –                      –                 35,000
Interest expense, net                                                       4,502                 37,350                 38,186
Income from continuing operations before
   income taxes and extraordinary item                                     522,271                366,140                  88,796
Provision for income taxes                                                 215,679                152,314                  37,207
Income from continuing operations
   before extraordinary item                                               306,592                213,826                  51,589
Discontinued operations:
   Income from discontinued operations,
      net of income taxes                                                               –           29,361                   9,710
   Gain (loss) on disposal of discontinued
      operations, net of income taxes                                          –                  125,556                 (31,700)
Income before extraordinary item                                         306,592                  368,743                  29,599
Extraordinary (charge), net of income taxes                               (1,777)                   (5,620)                 (3,338)
Net income                                                               304,815                  363,123                  26,261
Preferred stock dividends                                                 11,668                   13,741                    9,407
Net income available to common shareholders                            $ 293,147             $    349,382           $      16,854
Basic earnings per share:
   Income from continuing operations
      before extraordinary item                                             $1.83                  $1.33                  $ .29
   Net income                                                               $1.82                  $2.32                  $ .12
   Weighted average common shares – basic                             160,737,023            150,463,452            144,830,352
Diluted earnings per share:
   Income from continuing operations
      before extraordinary item                                             $1.75                  $1.22                  $ .29
   Net income                                                               $1.74                  $2.07                  $ .12
   Weighted average common shares – diluted                           174,806,092            175,325,050            145,390,950
Cash dividends per share                                                    $ .20                  $ .14                  $.245

The accompanying notes are an integral part of the financial statements.


16
The TJX Companies, Inc.
                               CONSOLIDATED B ALANC E SHEE TS


                                                                                    J a n u a ry 31,        J a n u a ry 25,
In Thousands                                                                                   1998                    1997

Assets
   Current assets:
     Cash and cash equivalents                                                 $ 404,369               $     474,732
     Accounts receivable                                                           60,735                     57,275
     Merchandise inventories                                                    1,190,170                  1,059,505
     Prepaid expenses                                                              27,357                     16,379
     Net current assets of discontinued operations                                      –                     54,451
        Total current assets                                                    1,682,631                  1,662,342
   Property at cost:
     Land and buildings                                                           108,729                 103,067
     Leasehold costs and improvements                                             480,964                 428,836
     Furniture, fixtures and equipment                                            611,470                 527,710
                                                                                1,201,163               1,059,613
      Less: accumulated depreciation and amortization                             515,027                 419,129
                                                                                  686,136                 640,484
   Other assets                                                                    36,645                  42,259
   Goodwill and tradename, net of amortization                                    204,220                 216,127
        Total Assets                                                           $2,609,632              $2,561,212
Liabilities
   Current liabilities:
     Current installments of long-term debt                                    $      23,360           $      27,140
     Accounts payable                                                                582,791                 533,945
     Accrued expenses and other current liabilities                                  611,506                 621,211
        Total current liabilities                                                  1,217,657               1,182,296
   Long-term debt, exclusive of current installments                                 221,024                 244,410
   Deferred income taxes                                                               6,859                   7,320
Shareholders’ Equity
   Preferred stock at face value, authorized 5,000,000 shares, par value $1,
     issued and outstanding cumulative convertible stock of:
        727,300 and 1,500,000 shares of 7% Series E                                    72,730                150,000
   Common stock, authorized 300,000,000 shares, par value $1,
     issued and outstanding 159,901,247 and 79,576,438 shares                     159,901                  79,576
   Additional paid-in capital                                                     202,053                 429,017
   Retained earnings                                                              729,408                 468,593
        Total shareholders’ equity                                              1,164,092               1,127,186
        Total Liabilities and Shareholders’ Equity                             $2,609,632              $2,561,212

The accompanying notes are an integral part of the financial statements.


                                                                                                                         17
The TJX Companies, Inc.
                       C O N S O L I D ATED STATEMENT S OF CA SH FLO WS

                                                                                      Fiscal Year Ended
                                                                   J a n u a ry 31,      J a n u a ry 25,       J a n u a ry 27,
In Thousands                                                                  1998                  1997                   1996
                                                                     (53 weeks)

Cash flows from operating activities:
  Net income                                                   $ 304,815               $ 363,123            $      26,261
  Adjustments to reconcile net income to net cash
     provided by operating activities:
       (Income) from discontinued operations,
          net of income taxes                                             –                (29,361)                 (9,710)
       (Gain) loss on disposal of discontinued operations                 –              (125,556)                 31,700
       Extraordinary charge                                           1,777                  5,620                   3,338
       Depreciation and amortization                                124,891               126,830                  79,232
       (Gain) on sale of other assets                                (5,992)                     –                       –
       Property disposals and asset write-downs                      18,778                 25,399                   3,489
       Other, net                                                     2,064                   (732)                   (382)
       Changes in assets and liabilities, net of
          effect of acquisitions and dispositions:
          (Increase) in accounts receivable                          (3,460)               (2,131)                  (233)
          (Increase) decrease in merchandise inventories           (130,665)              198,983                211,168
          (Increase) decrease in prepaid expenses                   (10,978)                   27                  6,872
          Increase (decrease) in accounts payable                    48,846                95,677               (147,013)
          Increase in accrued expenses
             and other current liabilities                           39,184                11,928                  63,975
          (Decrease) in deferred income taxes                        (3,793)                (5,344)               (14,143)
Net cash provided by operating activities                           385,467               664,463                254,554
Cash flows from investing activities:
  Property additions                                               (192,382)             (119,153)              (105,864)
  Proceeds from sale of other assets                                 15,697                     –                      –
  Acquisition of Marshalls, net of cash acquired                          –               (49,327)              (378,733)
  Proceeds from (adjustments to) sale
     of discontinued operations                                     (33,190)              222,800                  3,000
Net cash provided by (used in) investing activities                (209,875)               54,320               (481,597)
Cash flows from financing activities:
  Payments on short-term debt                                          –                        –              (20,000)
  Proceeds from borrowings of long-term debt                           –                        –             574,861
  Principal payments on long-term debt                           (27,179)                 (46,506)             (31,271)
  Prepayment of long-term debt                                         –                (455,560)                    –
  Payment of debt issue expenses                                       –                        –              (14,776)
  Proceeds from sale and issuance of common stock, net            15,471                   34,395                1,040
  Stock repurchased                                             (245,198)                       –                    –
  Cash dividends paid                                            (43,500)                 (35,019)             (44,886)
Net cash provided by (used in) financing activities             (300,406)               (502,690)             464,968
Net cash provided by (used in) continuing operations            (124,814)                216,093              237,925
Net cash provided by (used in) discontinued operations            54,451                   49,413              (70,268)
Net increase (decrease) in cash and cash equivalents             (70,363)                265,506              167,657
Cash and cash equivalents at beginning of year                   474,732                 209,226                41,569
Cash and cash equivalents at end of year                       $ 404,369               $ 474,732            $ 209,226

The accompanying notes are an integral part of the financial statements.


18
The TJX Companies, Inc.
               C O N S O L I D AT E D S TAT E M E N T S O F S H A R E H O L D E R S ’ E Q U I T Y

                                                P re f e rre d      Common      Additional
                                                     Stock,       Stock, Par      Paid–in      Retained
In Thousands                                   Face Va l u e       Value $1        Capital     E a rn i n g s         To t a l

Balance, January 28, 1995                    $107,500            $ 72,401      $267,937      $159,114           $ 606,952
  Net income                                        –                   –             –        26,261              26,261
  Cash dividends:
     Preferred stock                                        –             –             –      (9,407)              (9,407)
     Common stock                                           –             –             –     (35,479)             (35,479)
  Issuance of cumulative
     convertible preferred stock:
        Series D                                25,000                    –             –                 –        25,000
        Series E                               150,000                    –             –                 –       150,000
  Issuance of common stock under
     stock incentive plans and
     related tax benefits                            –                 85           754             –                 839
  Other                                              –                  –           468             –                 468
Balance, January 27, 1996                      282,500             72,486       269,159       140,489             764,634
  Net income                                         –                  –             –       363,123             363,123
  Cash dividends:
     Preferred stock                                        –             –             –     (13,741)             (13,741)
     Common stock                                           –             –             –     (21,278)             (21,278)
  Conversion of cumulative preferred
     stock into common stock:
        Series A                               (25,000)             1,190        23,810                   –                –
        Series C                               (82,500)             3,178        79,322                   –                –
        Series D                               (25,000)             1,350        23,650                   –                –
  Issuance of common stock under
     stock incentive plans and
     related tax benefits                            –              1,372        32,786             –               34,158
  Other                                              –                  –           290             –                  290
Balance, January 25, 1997                      150,000             79,576       429,017       468,593            1,127,186
  Net income                                         –                  –             –       304,815              304,815
  Cash dividends:
     Preferred stock                                        –             –             –     (11,668)             (11,668)
     Common stock                                           –             –             –     (31,832)             (31,832)
  Conversion of cumulative Series E
     preferred stock into common stock         (77,020)             8,315        68,705                   –                –
  Stock repurchase:
     Preferred                                       (250)              –             –            (500)              (750)
     Common                                             –          (8,528)     (235,920)              –           (244,448)
  Stock split, two-for-one                              –          79,823       (79,823)              –                  –
  Issuance of common stock under
     stock incentive plans and
     related tax benefits                           –                 715        15,719             –               16,434
  Other                                             –                   –         4,355             –                4,355
Balance, January 31, 1998                    $ 72,730            $159,901      $202,053      $729,408           $1,164,092

The accompanying notes are an integral part of the financial statements.


                                                                                                                          19
The TJX Companies, Inc.
                     SE LECT ED INFO RM ATION BY MA JOR B US INE SS SEG ME NT


The following selected information by major business segment reflects the results of Marshalls in the
off-price family apparel segment for the periods following its acquisition on November 17, 1995.

                                                                                                          Fiscal Year Ended
                                                                                       J a n u a ry 31,      J a n u a ry 25,       J a n u a ry 27,
In Thousands                                                                                      1998                  1997                   1996
                                                                                         (53 weeks)

Net sales:
  Off-price family apparel stores                                                  $7,290,959             $6,602,391            $3,896,710
  Off-price home fashion stores                                                        98,110                 87,019                78,405
                                                                                   $7,389,069             $6,689,410            $3,975,115
Operating income (loss):
  Off-price family apparel stores (1)                                              $ 596,908              $ 463,419             $ 187,974
  Off-price home fashion stores (2)                                                   (8,615)                (14,018)              (13,375)
                                                                                     588,293                449,401               174,599
General corporate expense (3)                                                         58,906                  43,297                45,003
Goodwill amortization                                                                  2,614                   2,614                 2,614
Interest expense, net                                                                  4,502                  37,350                38,186
Income from continuing operations
   before income taxes and extraordinary item                                      $ 522,271              $ 366,140             $      88,796
Identifiable assets:
   Off-price family apparel stores                                                 $2,033,945             $1,801,779            $2,116,127
   Off-price home fashion stores                                                       39,074                 36,493                46,861
   Corporate, primarily cash and goodwill (4)                                         536,613                668,489               382,137
                                                                                   $2,609,632             $2,506,761            $2,545,125
Capital expenditures:
  Off-price family apparel stores                                                  $ 190,720              $ 104,955             $  87,037
  Off-price home fashion stores                                                        1,662                    731                 7,932
  Corporate (4)                                                                            –                 13,467                10,895
                                                                                   $ 192,382              $ 119,153             $ 105,864
Depreciation and amortization:
  Off-price family apparel stores                                                  $ 115,967              $ 113,479             $      69,596
  Off-price home fashion stores                                                        3,186                  2,104                     1,777
  Corporate, including goodwill (4)                                                    5,738                 11,247                     7,859
                                                                                   $ 124,891              $ 126,830             $      79,232

( 1 ) The period ended January 27, 1996 includes a charge of $35 million relating to the closing of certain T.J. Maxx store s .

( 2 ) The perio ds ended January 31, 1 998, Jan uary 25 , 199 7 and Janua ry 27, 1996 i ncl ud e a ch arge of $1.5 million, $3.1
      million an d $3.8 million, re s p e c t i v e l y, for certain store closings and other re s t ru cturing costs relating to Hom eGoods.

( 3 ) General corpo rate expense for the fiscal year ended January 31, 1998, in clu des a pre-tax cha rge of $15.2 millio n for costs
      associated with a deferred compen sation arrangement with the Company’s Chief Executive Officer and a pre-ta x gain of
      $6 million fo r the sale of Bryla ne, Inc. common stock. Gen eral corporate expen se fo r the fiscal years ended January 25,
      1997 and Janu ary 27, 1996 include the net operating resu lts of T.K. M axx. Fiscal yea r 1998 in cludes T. K. Maxx re s u l t s
      in off-price family apparel stores.

( 4 ) Periods prior to Jan uary 31, 1998 in clude assets and a ctivity of T.K. Ma xx. Fiscal year 1998 includes T.K. Maxx in
      o ff- price family appa rel stores.


20
The TJX Companies, Inc.
                      N O T E S T O C O N S O L I D AT E D F I N A N C I A L S TAT E M E N T S


                                    Summary of Accounting Policies
F i s c a l Ye a r : The Company’s fiscal year ends on the last Saturday in January. The fiscal year ended
J a n u a ry 31, 1998 (fiscal 1998) included 53 weeks. The fiscal years ended January 25, 1997 and
J a n u a ry 27, 1996 each included 52 weeks.

B a s i s o f P r e s e n t a t i o n : The consolidated financial statements of The TJX Companies, Inc. include the
financial statements of all the Company’s wholly-owned subsidiaries, including its foreign subsidiaries. The
financial statements for the applicable periods present the Company’s former Chadwick’s and Hit or Miss divi-
sions as discontinued operations. The notes pertain to continuing operations except where otherwise noted.
   The preparation of the financial statements, in conformity with generally accepted accounting princi-
ples, requires management to make estimates and assumptions that affect the reported amounts of assets
and liabilities, and disclosure of contingent liabilities, at the date of the financial statements as well as the
reported amounts of revenues and expenses during the reporting period. Actual results could differ from
those estimates.

C a s h E q u i v a l e n t s : The Company generally considers highly liquid investments with an initial maturity
of three months or less to be cash equivalents. The Company’s investments are primarily high grade com-
mercial paper, institutional money market funds and time deposits with major banks. The fair value of
cash equivalents approximates carrying value.

M e r c h a n d i s e I n v e n t o r i e s : Inventories are stated at the lower of cost or market. The Company uses the
retail method for valuing inventories on the first-in first-out basis.

D e p r e c i a t i o n a n d A m o r t i z a t i o n : For financial reporting purposes, the Company provides for deprecia-
tion and amortization of property principally by the use of the straight-line method over the estimated use-
ful lives of the assets. Buildings are depreciated over 33 years, leasehold costs and improvements are
generally amortized over the lease term or their estimated useful life, whichever is shorter, and furniture,
fixtures and equipment are depreciated over 3 to 10 years. Maintenance and repairs are charged to
expense as incurred. Upon retirement or sale, the cost of disposed assets and the related depreciation are
eliminated and any gain or loss is included in net income. Debt discount and related issue expenses are
amortized over the lives of the related debt issues. Pre-opening costs are charged to operations within the
fiscal year that a new store or facility opens.

G o o d w i l l a n d Tr a d e n a m e : Goodwill is primarily the excess of the purchase price incurred over the car-
rying value of the minority interest in the Company’s former 83%-owned subsidiary. The minority inter-
est was acquired pursuant to the Company’s fiscal 1990 restructuring. In addition, goodwill includes the
excess of cost over the estimated fair market value of the net assets of Winners Apparel Ltd., acquired by
the Company effective May 31, 1990. Goodwill totaled $82.0 million, net of amortization, as of January 31,
1998 and is being amortized over 40 years. Annual amortization of goodwill was $2.6 million in fiscal
years 1998, 1997 and 1996. Cumulative amortization as of January 31, 1998 and January 25, 1997 was
$22.5 million and $19.9 million, respectively.
   Tradename is the value assigned to the name “Marshalls” as a result of the Company’s acquisition of the
Marshalls chain on November 17, 1995. The final allocation of the purchase price of Marshalls, pursuant to
the purchase accounting method, resulted in $130.0 million being allocated to the tradename. The value of
the tradename was determined by the discounted present value of assumed after-tax royalty payments, off-
set by a reduction for its pro-rata share of the total negative goodwill acquired (see Note A). The tradename
is deemed to have an indefinite life and accordingly is being amortized over 40 years. Amortization expense
was $3.4 million and $3.7 million for fiscal years 1998 and 1997, respectively. Cumulative amortization as
of January 31, 1998 and January 25, 1997 was $7.8 million and $4.4 million, respectively.

I m p a i r m e n t o f L o n g - L i v e d A s s e t s : During fiscal 1997, the Company adopted the Statement of Financial
Accounting Standards (SFAS) No. 121 “Accounting for the Impairment of Long-Lived Assets and for Long-
Lived Assets to Be Disposed Of.” The Company periodically reviews the value of its property and intangible
assets in relation to the current and expected operating results of the related business segments in order
to assess whether there has been a permanent impairment of their carrying values.

                                                                                                                          21
As a result of the acquisition of Marshalls, and the development of a plan for the realignment of the distri-
bution center facilities at T.J. Maxx and Marshalls, certain distribution center assets have been written down
to their net estimated realizable value in anticipation of their sale or disposal. The plan is expected to be imple-
mented over the next several years. The amounts impacting Marshalls have been reflected in the final alloca-
tion of purchase price (see Note A) and those related to T.J. Maxx have been reflected as a $12.2 million
impairment charge which has been recorded in selling, general and administrative expenses for fiscal 1997.

A d v e r t i s i n g C o s t s : The Company expenses advertising costs during the fiscal year incurred.


E a r n i n g s P e r S h a r e : Beginning with the fourth quarter of fiscal 1998, the Company began to report
earnings per share in accordance with Statement of Financial Accounting Standards (SFAS) No. 128
“Earnings per Share.” SFAS No. 128 requires the presentation of “basic” and “diluted” earnings per share.
Basic earnings per share is based on a simple weighted average of common stock outstanding. Diluted
earnings per share includes the dilutive effect of convertible securities and other common stock equiva-
lents. See Note F for a computation of basic and diluted earnings per share. All earnings per share
amounts discussed refer to diluted earnings per share unless otherwise indicated.

F o r e i g n C u r r e n c y Tr a n s l a t i o n : The Company’s foreign assets and liabilities are translated at the year-
end exchange rate and income statement items are translated at the average exchange rates prevailing dur-
ing the year. A large portion of the Company’s net investment in foreign operations is hedged with
foreign currency swap agreements and forward contracts. The translation adjustment associated with the
foreign operations and the related hedging instruments are included in shareholders’ equity as a component
of additional paid-in capital. Cumulative foreign currency translation adjustments included in shareholders’
equity amounted to losses of $1.7 million as of January 31, 1998 and $1.0 million as of January 25, 1997.

N e w A c c o u n t i n g S t a n d a r d s : During 1997, the Financial Accounting Standards Board (FASB) issued
Statement of Financial Accounting Standards (SFAS) No. 130, “Reporting Comprehensive Income.” This
statement specifies the computation, presentation and disclosures for components of comprehensive
income. The Company will implement the standard in its fiscal year ending January 30, 1999. The
adoption of this standard will not have a material impact on the consolidated financial statements.
   During 1997, the Financial Accounting Standards Board (FASB) also issued Statement of Financial
Accounting Standards (SFAS) No. 131, “Disclosure about Segments of an Enterprise and Related Informa-
tion.” This statement changes the manner in which public companies report information about their operat-
ing segments. SFAS No. 131, which is based on the management approach to segment reporting, establishes
requirements to report selected segment information quarterly and to report entity-wide disclosures about
products and services, major customers, and the geographic locations in which the entity holds assets and
reports revenue. The Company is currently evaluating the effects of this change on its reporting of segment
information. The Company will adopt SFAS No. 131 in its fiscal year ending January 30, 1999.

O t h e r : Certain amounts in prior years’ financial statements have been reclassified for comparative purposes.


The Company is in the process of converting all necessary systems to be year 2000 compliant. The
Company expects to spend an aggregate of approximately $10 million on conversion costs, primarily in
fiscal 1998 and 1999.

                                   A. D ispo siti ons and A cq uisit ions
S a l e o f C h a d w i c k ’s o f B o s t o n : During the fourth quarter of fiscal 1997, the Company sold its Chadwick’s
of Boston catalog division to Brylane, L.P. Proceeds of approximately $300 million included cash, a 10 year
$20 million Convertible Subordinated Note at 6% interest (the “Brylane note”) and Chadwick’s consumer
credit card receivables. During the second quarter of fiscal 1998, the Company paid Brylane $28.8 million
as an estimated adjustment to the cash proceeds based on the closing balance sheet of Chadwick’s as of
December 7, 1996 as prepared by the Company. During the quarter ended October 1997, the Company paid
Brylane $4.4 million upon agreement of the final closing balance sheet of Chadwick’s as of December 7,
1996. The results of Chadwick’s for all periods prior to December 7, 1996 have been reclassified to discon-
tinued operations. The cash provided by discontinued operations for fiscal 1998 represents the collection of
the remaining balance of the Chadwick’s consumer credit card receivables outstanding as of January 25,
1997. During the quarter ended October 1997, the Company converted a portion of the Brylane note into
352,908 shares of Brylane, Inc. common stock which it sold for $15.7 million. This sale resulted in an

22
after-tax gain of $3.6 million, or $.02 per share. Subsequent to the end of the year, the Company converted
an additional portion of the Brylane note into 258,836 shares of Brylane, Inc. common stock. The Company
donated 181,818 of these shares to the Company’s charitable foundation and sold the remaining 77,018
shares during the first quarter of fiscal 1999. The net after-tax impact of these transactions on the
Company’s first quarter results is immaterial. Pursuant to the acquisition, the Company agreed to purchase
certain amounts of excess inventory from Chadwick’s through fiscal 2000.
   The Chadwick’s of Boston catalog division had net sales of $464.8 million and recorded income from
operations of $29.4 million, net of income taxes of $20.9 million, for the fiscal year ended January 25,
1997, which represents the results through December 7, 1996, the effective date of the transaction. The
results of Chadwick’s for all periods prior to December 7, 1996 have been reclassified to discontinued oper-
ations. The sale of the division resulted in a gain on disposal of $125.6 million, net of income taxes of
$15.2 million, or $.72 per share. This gain allowed the Company to utilize its $139 million capital loss
carryforward (see Note G). Interest expense was allocated to discontinued operations based on their
respective proportion of assets to total assets.
   Net sales for Chadwick’s were $472.4 million and income from operations was $12.0 million, net of
income taxes of $8.1 million, for fiscal 1996.

S a l e o f H i t o r M i s s : Effective September 30, 1995, the Company sold its Hit or Miss division to members
of Hit or Miss management and outside investors. The Company received $3 million in cash and a 7 year
$10 million note with interest at 10%. During fiscal year ended 1998, the Company forgave a portion of this
note and was released from certain obligations and guarantees which reduced the note to $5.5 million.
   The Hit or Miss division had net sales of $165.4 million and recorded an operating loss of $2.3 million,
net of income tax benefits of $1.4 million, for the fiscal year ended January 27, 1996, which represents
results through July 29, 1995, the measurement date of the transaction. Hit or Miss’ operating results for
all prior periods have been reclassified to discontinued operations. The sale of the division resulted in a
loss on disposal of $31.7 million (net of income tax benefits of $19.8 million) and includes the operating
results from July 30, 1995 through the closing date, as well as the cost to the Company of closing 69 Hit
or Miss stores. Interest expense was allocated to discontinued operations based on their respective pro-
portion of assets to total assets.

A c q u i s i t i o n o f M a r s h a l l s : On November 17, 1995, the Company acquired the Marshalls family apparel
chain from Melville Corporation. The Company paid $424.3 million in cash and $175 million in junior con-
vertible preferred stock. The total purchase price of Marshalls, including acquisition costs, was $606 million.
   The acquisition has been accounted for using the purchase method of accounting and accordingly, the
purchase price has been allocated to the assets purchased and the liabilities assumed based upon their fair
values at the date of acquisition. The purchase accounting method allows a one year period to finalize the
fair values of the net assets acquired. No further adjustments to fair market values are made after that
point. The final allocation of purchase price resulted in the fair value of the net assets acquired exceeding
the purchase price, creating negative goodwill of $86.4 million. The negative goodwill was allocated to the
long-term assets acquired. During fiscal 1998, the store closing and restructuring reserve established in
the final allocation of the purchase price was reduced by an additional $15.8 million as the Company
closed fewer stores than initially planned. The $15.8 million reserve reduction was offset by a reduction
of $10.0 million to property, plant and equipment and a reduction of $5.8 million to tradename. The final
allocation of purchase price as adjusted for the reserve adjustment in fiscal 1998 is summarized below:

In Thousands

Current assets                                                                                           $ 718,627
Property, plant and equipment                                                                              227,071
Tradename                                                                                                  130,046
Current liabilities                                                                                       (469,744)
Total purchase price                                                                                     $ 606,000

The operating results of Marshalls have been included in the consolidated results of the Company from the
date of acquisition on November 17, 1995. The following unaudited pro forma consolidated financial
results for the fiscal year ended January 1996, are presented as if the acquisition had taken place at the
beginning of the period:


                                                                                                                   23
Dollars in Thousands Except Per Share Amounts                                          Fiscal Year Ended January 2 7, 1996

Net sales                                                                                                    $   6,085,509
Income from continuing operations                                                                            $      20,838
Average shares outstanding for diluted earnings per share calculations                                         147,557,961
Income from continuing operations per share, diluted                                                         $         .02

The foregoing unaudited pro forma consolidated financial results give effect to, among other pro forma
adjustments, the following:
  (i) Interest expense and amortization of the related debt expenses on debt incurred to finance
           the acquisition.
  (ii) Depreciation and amortization adjustments related to fair market value of assets acquired.
  ( i i i )A m o rtization of tradename over 40 years.
  (iv) Adjustments to income tax expense related to the above.
  (v) Impact of preferred stock issued on earnings per share calculations.
The foregoing unaudited pro forma consolidated financial information is provided for illustrative pur-
poses only and does not purport to be indicative of results that actually would have been achieved had the
acquisition taken place on the first day of the period presented or of future results.

                                   B. L on g- Te r m De b t a nd C r e di t L i n es
At January 31, 1998 and January 25, 1997, long-term debt, exclusive of current installments, consisted
of the following:
                                                                                             J a n u a ry 3 1,   J a n u a ry 2 5,
In Thousands                                                                                            1998                1997

Real estate mortgages, interest at 10.48% maturing November 1, 1998                         $               –    $ 22,391
Equipment notes, interest at 11% to 11.25% maturing
  December 12, 2000 to December 30, 2001                                                           1,127               2,135
General corporate debt:
  Medium term notes, interest at 5.87% to 7.97%, $15 million maturing on
      October 21, 2003 and $5 million on September 20, 2004                                      20,000               20,000
  65⁄8% unsecured notes, maturing June 15, 2000                                                 100,000              100,000
  7% unsecured notes, maturing June 15, 2005 (effective interest rate of 7.02%
      after reduction of the unamortized debt discount of $103,000 and $116,000
      in fiscal 1998 and 1997, respectively)                                                  99,897               99,884
         Total general corporate debt                                                        219,897              219,884
Long-term debt, exclusive of current installments                                           $221,024             $244,410

The aggregate maturities of long-term debt, exclusive of current installments, at January 31, 1998 are as follows:

                                                                                                  General
                                                                                                Corporate
In Thousands                                                             Equipment Notes             Debt                  To t a l

Fiscal Year
2000                                                                      $ 697             $       –            $    697
2001                                                                         430             100,000              100,430
2002                                                                           –                    –                   –
2003                                                                           –                    –                   –
Later years                                                                    –              119,897             119,897
Aggregate maturities of long-term debt, exclusive of current installments $1,127            $219,897             $221,024

Real estate mortgages are collateralized by land and buildings. While the parent company is not directly
obligated with respect to the real estate mortgages, it or a wholly-owned subsidiary has either guaranteed
the debt or has guaranteed a lease, if applicable, which has been assigned as collateral for such debt.
    On September 16, 1996, pursuant to a call for redemption, the Company prepaid $88.8 million of its
 1
9 ⁄2% sinking fund debentures. The Company recorded an after-tax extraordinary charge of $2.9 million, or
$.02 per common share, related to the early retirement of this debt. The Company paid the outstanding
balance of $8.5 million during fiscal 1998 utilizing an optional sinking fund payment under the indenture.
    In June 1995, the Company filed a shelf registration statement with the Securities and Exchange
Commission which provided for the issuance of up to $250 million of long-term debt. This shelf registration

24
statement was replaced by a new shelf registration statement filed in fiscal 1997 which currently provides
for the issuance of up to $600 million of debt, common stock or preferred stock. In June 1995, the Company
issued $200 million of long-term notes under the original registration statement; $100 million of 65⁄8% notes
due June 15, 2000 and $100 million of 7% notes due June 15, 2005. The proceeds were used in part to repay
short-term borrowings and for general corporate purposes, including the repayment of scheduled maturities
of other outstanding long-term debt and for new store and other capital expenditures.
   On November 17, 1995, the Company entered into an unsecured $875 million bank credit agreement
under which the Company borrowed $375 million on a term loan basis to fund the cash portion of the
Marshalls purchase price. During the fourth quarter of the fiscal year ended January 25, 1997, the
Company prepaid the outstanding balance of the $375 million term loan and recorded an after-tax extra-
ordinary charge of $2.7 million, or $.02 per share, for the early retirement of this debt. The agreement
also allowed the Company to borrow up to an additional $500 million on a revolving loan basis to fund the
working capital needs of the Company. In September 1997, the Company replaced this $500 million revolv-
ing credit agreement with a new five year $500 million revolving credit facility. The Company recorded an
extraordinary charge of $1.8 million associated with the write-off of deferred financing costs of the for-
mer agreement. The new agreement provides for reduced commitment fees on the unused portion of the
line, as well as lower borrowing costs and has certain financial covenants which include a minimum net
worth requirement, and certain leverage and fixed charge covenants.
   As of January 31, 1998, all $500 million of the revolving credit facility was available for use. Interest
is payable on borrowings at rates equal to or less than prime. The revolving credit facility capability is
used as backup to the Company’s commercial paper program. The Company had no short-term borrowings
under this facility or its commercial paper program during fiscal 1998. Excluding the Company’s foreign
subsidiaries, the weighted average interest rate on the Company’s short-term borrowings under the for-
mer agreement was 5.81% and 6.25% in fiscal 1997 and 1996, respectively. The Company does not have
any compensating balance requirements under these arrangements. The Company also has C$30 million
of committed lines for its Canadian operation, all of which were available as of January 31, 1998.
   In connection with the $875 million bank credit agreement, during fiscal 1996 the Company prepaid its
$45 million real estate mortgage on the Chadwick’s fulfillment center and incurred an extraordinary after-
tax charge of $3.3 million in fiscal 1996 on the early retirement of this debt.

                                    C. Financial Instruments
The Company periodically enters into forward foreign exchange contracts to hedge firm U.S. dollar mer-
chandise purchase commitments made by its Canadian subsidiary. As of January 31, 1998, the Company
had $20.2 million of such contracts outstanding. The contracts cover commitments for the first quarter of
fiscal 1999 and any gain or loss on the contract will ultimately be reflected in the cost of the merchandise.
Deferred gains and losses on the contracts as of January 31, 1998 were immaterial.
   The Company also has entered into several foreign currency swap and forward contracts in both
Canadian dollars and British pounds sterling. Both the swap and forward agreements are accounted for
as a hedge against the Company’s investment in foreign subsidiaries; thus, foreign exchange gains and
losses on the agreements are recognized in shareholders’ equity thereby offsetting translation adjust-
ments associated with the Company’s investment in foreign operations. The gains or losses on this
hedging activity as of January 31, 1998 are immaterial.
   The Canadian swap and forward agreements will require the Company to pay C$41.7 million in
exchange for $31.2 million in U.S. currency between October 2003 and September 2004. The British
pounds sterling swap and forward agreements will require the Company to pay £59.9 million between
October 1999 and September 2002 in exchange for $94.1 million in U.S. currency.
   The agreements contain rights of offset which minimize the Company’s exposure to credit loss in the
event of nonperformance by one of the counterparties. The interest rates payable on the foreign currency
swap agreements are slightly higher than the interest rates receivable on the currency exchanged, result-
ing in deferred interest costs which are being amortized to interest expense over the term of the related
agreements. The premium cost or discount associated with the forward contracts is being amortized over
the term of the related agreements and is included with the gain or loss of the hedging instrument. The
unamortized balance of the net deferred costs was $4.3 million and $4.1 million as of January 31, 1998
and January 25, 1997, respectively.
   The counterparties to the exchange contracts and swap agreements are major international financial
institutions. The Company periodically monitors its position and the credit ratings of the counterparties
and does not anticipate losses resulting from the nonperformance of these institutions.

                                                                                                           25
The fair value of the Company’s long-term debt, including current installments, is estimated using dis-
counted cash flow analysis based upon the Company’s current incremental borrowing rates for similar
types of borrowing arrangements. The fair value of long-term debt, including current installments, at
January 31, 1998 is estimated to be $253 million compared to a carrying value of $244.4 million. These esti-
mates do not necessarily reflect certain provisions or restrictions in the various debt agreements which
might affect the Company’s ability to settle these obligations.

                                           D. Commitments
The Company is committed under long-term leases related to its continuing operations for the rental of real
estate, and fixtures and equipment. T.J. Maxx leases are generally for a ten year initial term with options
to extend for one or more five year periods. Marshalls leases, acquired in fiscal 1996, have remaining terms
ranging up to twenty-five years. In addition, the Company is generally required to pay insurance, real
estate taxes and other operating expenses including, in some cases, rentals based on a percentage of sales.
   Following is a schedule of future minimum lease payments for continuing operations as of January 31, 1998:

                                                                                                                         Operating
In Thousands                                                                                                                Leases

Fiscal Year
1999                                                                                                              $ 302,177
2000                                                                                                                 288,603
2001                                                                                                                 260,753
2002                                                                                                                 233,513
2003                                                                                                                 210,983
Later years                                                                                                        1,006,059
Total future minimum lease payments                                                                               $2,302,088

The rental expense under operating leases for continuing operations amounted to $301.9 million, $293.5
million and $162.5 million for fiscal years 1998, 1997 and 1996, respectively. The present value of the
Company’s operating lease obligations approximates $1,547.2 million as of January 31, 1998, including
$180.0 million payable in fiscal 1999.
  The Company had outstanding letters of credit in the amount of $55.9 million as of January 31, 1998.
Letters of credit are issued by the Company primarily for the purchase of inventory.

                                   E. Stock Compensation Plans
In the following note, all references to historical awards, outstanding awards and availability of shares for
future grants under the Company’s Stock Incentive Plan and related prices per share have been restated,
for comparability purposes, for the two-for-one stock split distributed in June 1997.
   The Company has a Stock Incentive Plan under which options and other stock awards may be granted
to certain officers and key employees. The Stock Incentive Plan, as amended, provides for the issuance of
up to 21 million shares with 8.7 million shares available for future grants as of January 31, 1998. The
Company also has a Directors Stock Option Plan under which stock options are granted to directors who
are not otherwise employed by the Company. This plan provides for the issuance of up to 100,000 shares.
There are 61,000 shares available for future grants under this plan as of January 31, 1998.
   Under its stock option plans, the Company has granted options for the purchase of common stock, gen-
erally within ten years from the grant date at option prices of 100% of market price on the grant date. Most
options outstanding are exercisable at various percentages starting one year after the grant, while certain
options are exercisable in their entirety three years after the grant date. Options granted to directors
become fully exercisable one year after the date of grant.
   A summary of the status of the Company’s stock options and related Weighted Average Exercise Prices
(“WAEP”), adjusted for the two-for-one stock split, for fiscal years ended January 1998, 1997 and 1996 is
presented below (shares in thousands):
                                                                              Fiscal Year Ended January
                                                              1998                          1997                       1996
                                                 S h a re s          WA E P      S h a re s      WA E P   S h a re s          WA E P

Outstanding, beginning of year                  4,096            $12.20         5,624      $ 9.18         5,389           $ 9.97
Granted                                         2,169             25.93         1,426       17.44         1,193             6.44
Exercised                                        (878)            10.61        (2,724)       8.89          (164)            7.04
Canceled                                         (134)            14.61          (230)       9.90          (794)           10.63
Outstanding, end of year                        5,253            $18.07         4,096      $12.20         5,624           $ 9.18
Options exercisable, end of year                1,966                           1,706                     3,496
26
The Company realizes an income tax benefit from the exercise or early disposition of certain stock options.
This benefit results in a decrease in current income taxes payable and an increase in additional paid-in
capital. Such benefits amounted to $6.1 million and $10.2 million for the fiscal years ended January 31,
1998 and January 25, 1997, respectively. Amounts for fiscal 1996 were immaterial.
   The Company has adopted the disclosure-only provisions of Statement of Financial Accounting
Standards (SFAS) No. 123 “Accounting for Stock-Based Compensation,” and continues to apply the provi-
sions of APB Opinion No. 25 “Accounting for Stock Issued to Employees” in accounting for compensation
expense under its stock option plans. The Company grants options at fair market value on the date of the
grant; accordingly, no compensation expense has been recognized for the stock options issued during fiscal
years 1998, 1997 or 1996. Had compensation expense been determined in accordance with SFAS No. 123,
the Company’s income from continuing operations, net income and related earnings per share amounts for
the fiscal years ended January 31, 1998 and January 25, 1997 would have been reduced to the unaudited
pro forma amounts indicated below:
                                                                                             Fiscal Year Ended
                                                                            As Report e d                        Unaudited Pro Form a
                                                                J a n u a ry 31,     J a n u a ry 25,     J a n u a ry 3 1,   J a n u a ry 2 5,
Dollars in Thousands Except Per Share Amounts                              1998                 1997                 1998                1997
                                                                  (53 weeks)                                (53 weeks)

Income from continuing operations                              $306,592                                   $301,129
                                                                                    $213,826                                   $211,893
Diluted earnings per share                                     $   1.75                                   $   1.72
                                                                                    $   1.22                                   $   1.21
Net income                                                     $304,815                                   $299,352
                                                                                    $363,123                                   $361,190
Diluted earnings per share                                     $   1.74                                   $   1.71
                                                                                    $   2.07                                   $   2.06

For purposes of applying the provisions of SFAS No. 123 for the pro forma calculations, the fair value of
each option grant issued during fiscal 1998 and 1997 is estimated on the date of grant using the Black-
Scholes option pricing model with the following assumptions: dividend yield 1% and expected volatility of
38% in both fiscal 1998 and 1997, a risk-free interest rate of 5.8% in fiscal 1998 and 6.67% in fiscal 1997
and expected holding periods of 6 years in both fiscal periods. The weighted average fair value of options
granted during fiscal 1998 and 1997 was $11.05 and $7.75 per share, respectively.
   The effects of applying SFAS No. 123 in this pro forma disclosure are not indicative of future amounts.
SFAS No. 123 does not apply to awards prior to 1995, and additional awards in future years are anticipated.
   The following table summarizes information about stock options outstanding as of January 31, 1998
(shares in thousands):
                                                               Options Outstanding                                  Options Exerc i s a b l e
                                                                   We i g h t e d  We i g h t e d                               We i g h t e d
Range of                                                            Av e r a g e    Av e r a g e                                   Av e r a g e
E x e rc i s e                                                   Remaining         E x e rc i s e                                E x e rc i s e
Prices                                            S h a re s   Contract Life             Price                   S h a re s             Price

$ 5.1250         –   $ 7.6875                       727        7.2   Years              $ 6.36                    398              $ 6.31
$ 7.6876         –   $12.1875                       772        5.8   Years               10.87                    772               10.87
$12.1876         –   $17.4375                     1,591        7.7   Years               16.25                    729               14.85
$17.4376         –   $21.5000                       700        9.2   Years               21.38                     67               21.38
$21.5001         –   $28.9375                     1,463        9.5   Years               28.09                      –                   –
                         Total                    5,253        8.0   Years              $18.07                  1,966              $11.78

During fiscal 1998, a special deferred compensation award was granted to the Company’s Chief Executive
Officer initially denominated in 450,000 shares of the Company’s stock with a fair value of $21.375 per
share at the date of grant. The shares vested at the time of the grant and the Company recorded a deferred
compensation charge of $9.6 million at the time of the grant. The executive may elect to have such grant
converted into other investments. The Company does not anticipate that the shares will be issued and
therefore does not consider them for diluted earnings per share calculations and adjusts the compensation
charge for changes in the market value of the stock. The Company recorded an additional expense of $5.6
million in fiscal 1998 due to the increase in market value of the shares from date of grant.
   The Company has also issued restricted stock and performance based stock awards under the Stock
Incentive Plan. Restricted stock awards are issued at par value, or at no cost, and have restrictions which gen-
erally lapse over three to five years from date of grant. As of January 31, 1998, the performance based stock
awards have either vested or been forfeited. The market value in excess of cost is charged to income ratably
over the period during which these awards vest, such pre-tax charges amounted to $2.7 million in fiscal 1998,
$2.5 million in fiscal 1997 and $0.4 million in fiscal 1996. The market value of the awards is determined at
date of grant for restricted stock awards, and at the date shares are earned for performance based awards.

                                                                                                                                            27
There has been a combined total of 511,917 shares, 35,000 shares and 20,000 shares for deferred,
restricted and performance based awards issued for the fiscal years ended January 1998, 1997 and 1996,
respectively. There were 150,000 and 7,000 shares forfeited for the fiscal years ended January 1998 and
January 1996, respectively (no shares were forfeited for the fiscal year ended January 1997). The
weighted average market value per share of these stock awards at grant date was $21.79, $12.00 and
$6.44 for fiscal 1998, 1997 and 1996, respectively.
   During fiscal 1998, the Company formed a deferred stock compensation plan for its outside directors
which replaced the Company’s retirement plan for directors. Deferred shares were issued equal to the cur-
rent obligation under the retirement plan as of December 31, 1997. Additional share awards valued at
$10,000 will be issued annually to each eligible director. Currently there are 8,771 deferred shares out-
standing, actual shares will be issued at retirement. The Company has 50,000 shares held in treasury from
which the Company will issue such shares.

                          F. C a p i t a l S t o c k a n d E a r n i n g s P e r S h a r e
C a p i t a l S t o c k : The Company distributed a two-for-one stock split, effected in the form of a 100% stock
dividend, on June 26, 1997 to shareholders of record on June 11, 1997, which resulted in the issuance
of 79.8 million shares of common stock and a corresponding decrease of $79.8 million in additional
paid-in capital. All historical earnings per share amounts have been restated to reflect the two-for-one
stock split. Reference to common stock activity before the distribution of the split has not been restat-
ed unless otherwise noted. All activity after the distribution date reflects the two-for-one stock split.
   In April 1992, the Company issued 250,000 shares of Series A cumulative convertible preferred stock
in a private offering. As of June 1996, pursuant to a call for redemption, the Series A preferred stock was
converted into 1,190,475 shares of common stock.
   In August 1992, the Company issued 1,650,000 shares of Series C cumulative convertible preferred
stock in a public offering. As of September 1996, pursuant to a call for redemption, the Series C preferred
stock was converted into 3,177,844 shares of common stock.
   On November 17, 1995, the Company issued its Series D and Series E convertible preferred stock as part
of the purchase price for Marshalls. The 250,000 shares of Series D preferred stock, with a face value of
$25 million, carried an annual dividend rate of $1.81 per share and was automatically converted into
1,349,527 shares of common stock on November 17, 1996.
   The shares of Series E preferred stock, with 1,500,000 shares initially issued at a face value of $150
million, carry an annual dividend rate of $7.00 per share and is mandatorily converted into common
shares on November 17, 1998 unless converted earlier. Through January 31, 1998, shareholders con-
verted 770,200 shares of Series E preferred stock into 8.3 million shares of common stock and 2,500
shares were repurchased by the Company. The Company paid $3.8 million to induce conversion of the
preferred shares. The common shares issuable on conversion of the outstanding Series E preferred stock
will vary depending on the market price of common stock at the time of conversion and ranges from a
minimum of 7.9 million shares to a maximum of 9.4 million shares of common stock. Based on the mar-
ket price of the common stock as of January 31, 1998, the minimum number of shares would be issued.
The 727,300 shares of the Company’s outstanding Series E preferred stock at January 31, 1998 has an
aggregate liquidation preference of $72.7 million. There is an aggregate of 9,422,513 common shares
reserved for the conversion of Series E preferred stock, the maximum number of shares that may be
issued. The Series E preferred stock is senior to the common stock of the Company with respect to pay-
ment of dividends and upon liquidation. There are no voting rights for preferred stock unless dividends
are in arrears for a specified number of periods.
   Dividends on the outstanding Series E preferred stock are paid quarterly on the first business day of
each calendar quarter, the Company accrues dividends evenly throughout the year. In addition, the induce-
ment fees paid on the conversion of the Series E preferred stock during fiscal 1998 have been classified as
preferred dividends. The Company recorded aggregate dividends on its preferred stock of $11.7 million in
fiscal 1998, $13.7 million in fiscal 1997 and $9.4 million in fiscal 1996. The preferred dividends reduce
net income in computing net income available to common shareholders.
   During fiscal 1997, the Company replaced the June 1995 shelf registration statement with another
shelf registration statement which currently provides for the issuance of up to $600 million of debt, com-
mon stock or preferred stock.


28
On June 25, 1997, the Company authorized the repurchase of up to $250 million of the Company’s
common shares and common equivalent shares. During fiscal 1998, the Company repurchased 8.5 million
shares of its stock, totaling $245.2 million, representing approximately 5% of the Company’s outstanding
common shares. In February 1998, the Company completed this buy back program with a total of 8.7 mil-
lion shares having been repurchased. At the same time, the Company announced its intent to repurchase
an additional $250 million of the Company’s common stock.

E a r n i n g s P e r S h a r e : The Company calculates earnings per share in accordance with SFAS No. 128
which requires the presentation of basic and diluted earnings per share. The following schedule presents
the calculation of basic and diluted earnings per share for income from continuing operations:

                                                                                       Fiscal Year Ended
                                                                   J a n u a ry 31,       J a n u a ry 25,      J a n u a ry 27,
                                                                              1998                   1997                  1996
                                                                     (53 weeks)

Basic ea rni ngs per shar e:
   Income from continuing operations
     before extraordinary item                                     $306,592              $213,826                $51,589
   Less: preferred stock dividends                                   11,668                13,741                  9,407
   Income from continuing operations available
     to common shareholders                                        $294,924              $200,085                $42,182
   Weighted average common stock outstanding
     for basic earnings per share                             160,737,023             150,463,452            144,830,352
   Basic earnings per share                                         $1.83                   $1.33                   $.29

Dil uted earni ngs per shar e:
   Income from continuing operations
      available to common shareholders                             $294,924              $200,085                $42,182
   Add back: preferred stock dividends                               11,668                13,741                     93
   Income from continuing operations for
      diluted earnings per share calculation                       $306,592              $213,826                $42,275
   Weighted average common stock outstanding
      for basic earnings per share                            160,737,023             150,463,452            144,830,352
   Assumed conversion of:
      Convertible preferred stock                              12,016,086              23,165,792                532,314
      Stock options                                             2,052,983               1,695,806                 28,284
   Weighted average common shares for
      diluted earnings per share calculation                  174,806,092             175,325,050            145,390,950
   Diluted earnings per share                                       $1.75                   $1.22                   $.29

                                          G . I nc o me Ta x e s
The provision for income taxes includes the following:
                                                                                       Fiscal Year Ended
                                                                   J a n u a ry 31,       J a n u a ry 25,      J a n u a ry 27,
In Thousands                                                                  1998                   1997                  1996
                                                                     (53 weeks)

Current:
  Federal                                                          $172,026              $116,848               $ 52,306
  State                                                              39,200                27,160                 12,604
  Foreign                                                             8,117                 8,079                  2,843
Deferred:
  Federal                                                            (3,432)                   33                (25,593)
  State                                                                (326)                  462                  (5,361)
  Foreign                                                                94                  (268)                    408
Provision for income taxes                                         $215,679              $152,314               $ 37,207


                                                                                                                            29
The Company had a net deferred tax liability as follows:
                                                                                        J a n u a ry 31,   J a n u a ry 25,
In Thousands                                                                                       1998               1997

Deferred tax assets:
  Capital loss carryforward                                                            $      –            $   4,500
  Foreign net operating loss carryforward                                                34,554               34,500
  Reserve for discontinued operations                                                     6,723                9,397
  Reserve for closed stores and restructuring costs                                      23,571               38,421
  Insurance costs not currently deductible for tax purposes                              15,049               24,342
  Pension, postretirement and employee benefits                                          34,173               23,267
  Leases                                                                                  9,350                6,478
  Other                                                                                  18,789               17,981
  Valuation allowance                                                                   (34,603)             (39,084)
     Total deferred tax assets                                                         $107,606            $119,802
Deferred tax liabilities:
  Property, plant and equipment                                                        $ 14,736            $ 20,096
  Safe harbor leases                                                                     37,945              44,603
  Tradename                                                                              48,659              52,302
  Other                                                                                  13,125              10,121
     Total deferred tax liabilities                                                    $114,465            $127,122
Net deferred tax liability                                                             $ 6,859             $ 7,320

The Company had a capital loss carry f o rward of $139 million as of January 27, 1996 which was fully
utilized to offset the capital gain recognized on the sale of Chadwick’s.
   The Company does not provide for U.S. deferred income taxes on the undistributed earnings of its for-
eign subsidiaries as the earnings are considered to be permanently reinvested. The undistributed earnings
of its foreign subsidiaries as of January 31, 1998 were immaterial.
   The Company has a United Kingdom net operating loss carryforward of approximately $50 million for tax
and financial reporting purposes. The United Kingdom net operating loss does not expire under current
United Kingdom tax law. The Company also has a Puerto Rico net operating loss carryforward of approxi-
mately $49 million at January 31, 1998, for tax and financial reporting purposes, which was acquired in the
Marshalls acquisition and expires in fiscal 1999 through fiscal 2003. Future utilization of these operating
loss carryforwards is dependent upon future earnings of the Company’s foreign subsidiaries.
   The Company’s worldwide effective tax rate was 41% for the fiscal year ended January 31, 1998, and 42%
for fiscal years ended January 25, 1997 and January 27, 1996. The difference between the U.S. federal
statutory income tax rate and the Company’s worldwide effective income tax rate is summarized as follows:

                                                                                     Fiscal Year Ended
                                                                  J a n u a ry 31,      J a n u a ry 25,   J a n u a ry 27,
                                                                             1998                  1997               1996

U.S. federal statutory income tax rate                                       35%                   35%                35%
Effective state income tax rate                                               5                     5                  5
Impact of foreign operations                                                  –                     1                  3
All other                                                                     1                     1                 (1)
Worldwide effective income tax rate                                          41%                   42%                42%

                    H. Pension Plans and Other Retirement Benefits
The Company has a non-contributory defined benefit retirement plan covering the majority of full-time
U.S. employees. Effective in fiscal 1998, Marshalls associates are included in the plan with credit for ser-
vice prior to the acquisition. Employees who have attained twenty-one years of age and have completed
one year of service are covered under the plan. Benefits are based on compensation earned in each year of
service. The Company also has an unfunded supplemental retirement plan which covers certain key
employees of the Company and provides additional retirement benefits based on average compensation.


30
Net periodic pension cost (including discontinued operations) of the Company’s defined benefit and sup-
plemental retirement plans includes the following components:
                                                                                        Fiscal Year Ended
                                                                     J a n u a ry 31,      J a n u a ry 25,    J a n u a ry 27,
                                                                                1998                  1997                1996
                                                                       (53 weeks)

Service cost                                                      $     8,372              $  4,699            $  3,920
Interest cost on projected benefit obligation                           8,398                 7,266               6,915
Actual return on assets                                               (22,278)              (16,981)            (15,215)
Net amortization and deferrals                                         15,459                10,879               9,384
Net periodic pension cost                                            $ 9,951               $ 5,863             $ 5,004

Net pension cost includes $0.4 million and $0.5 million allocated to discontinued operations in fiscal years
1997 and 1996, respectively. The increase in pension cost for fiscal 1998 is primarily due to the inclusion
of Marshalls associates.
   The following table sets forth the funded status of the Company’s pension, defined benefit and supple-
mental retirement plans (including discontinued operations) and the amounts recognized in the
Company’s statements of financial position:
                                                                                           J a n u a ry 3 1,   J a n u a ry 2 5,
In Thousands                                                                                          1998                1997

Accumulated benefit obligation, including vested benefits
   of $111,116 and $89,533 in fiscal 1998 and 1997, respectively                          $115,250             $ 93,383
Projected benefit obligation                                                              $127,148             $100,465
Plan assets at fair market value                                                           110,234               89,704
Projected benefit obligation in excess of plan assets                                       16,914               10,761
Unrecognized net gain from past experience, different
   from that assumed and effects of changes in assumptions                                   5,243                5,929
Prior service cost not yet recognized in net periodic pension cost                            (861)                (950)
Unrecognized prior service cost                                                               (596)                (670)
Accrued pension cost included in accrued expenses                                         $ 20,700             $ 15,070

The projected benefit obligation in excess of plan assets as of January 31, 1998, is due to the Company’s
unfunded supplemental retirement plan.
   The weighted average discount rate used in determining the actuarial present value of the projected
benefit obligation was 7.0% and 7.5% for fiscal years 1998 and 1997, respectively. The rate of increase on
future compensation levels was 4.0% in each of the fiscal years 1998 and 1997, and the expected long-term
rate of return on assets was 9.0% in each of the fiscal years 1998 and 1997. The Company’s funding pol-
icy is to contribute annually an amount allowable for federal income tax purposes. Pension plan assets
consist primarily of fixed income and equity securities.
   The Company’s postretirement benefit plan is unfunded and provides limited postretirement medical
and life insurance benefits to associates who participate in the Company’s retirement plan and who retire
at age fifty-five or older with ten or more years of service.
   Net periodic postretirement benefit cost of the Company’s plan includes the following components:

                                                                                        Fiscal Year Ended
                                                                     J a n u a ry 31,      J a n u a ry 25,    J a n u a ry 27,
                                                                                1998                  1997                1996
                                                                       (53 weeks)

Service cost                                                            $1,366                 $  671              $  757
Interest cost on accumulated benefit obligation                          1,649                  1,081               1,046
Net amortization                                                           749                     55                   –
Net periodic postretirement benefit cost                                $3,764                 $1,807              $1,803

Net periodic postretirement benefit costs include $0.1 million in fiscal year 1997 and $0.3 million in
fiscal year 1996 allocated to discontinued operations. The increase in cost for fiscal 1998 is primarily due
to the inclusion of Marshalls associates.
   The components of the accumulated postretirement benefit obligation (including discontinued
operations) and the amount recognized in the Company’s statements of financial position are as follows:


                                                                                                                            31
J a n u a ry 3 1,   J a n u a ry 2 5,
In Thousands                                                                                   1998                1997

Accumulated postretirement obligation:
  Retired associates                                                                 $ 8,882             $ 7,147
  Fully eligible active associates                                                     4,459                4,653
  Other active associates                                                              7,832                3,501
Accumulated postretirement obligation                                                 21,173              15,301
Unrecognized net (loss) due to change in assumptions                                  (4,341)              (1,375)
Accrued postretirement benefits included in accrued expenses                         $16,832             $13,926

Assumptions used in determining the actuarial present value of the accumulated postretirement obliga-
tion include a discount rate of 7.0% and 7.5% in fiscal years 1998 and 1997, respectively. Due to the nature
of the plan, which limits the annual benefit to $3,000, the medical inflation assumption, initially set at
4.5% in fiscal 1998 and 5% in fiscal 1997, is gradually reduced to zero. An increase of 1% in the medical
inflation assumption would increase the postretirement benefit obligation as of January 31, 1998 by
approximately $1.7 million. Effective January 1, 1997, Marshalls associates were eligible for the
Company’s postretirement medical plan.
   The Company also sponsors an employee savings plan under Section 401(k) of the Internal Revenue
Code for all eligible U.S. employees, including Marshalls associates effective January 1, 1997. Employees
may contribute up to 15% of eligible pay. The Company matches employee contributions up to 5% of eligi-
ble pay at rates ranging from 25% to 50% based upon Company performance. The Company contributed
for all 401(k) plans $5.7 million in fiscal 1998, $6.4 million in fiscal 1997 and $2.2 million in fiscal 1996.
Prior to January 1, 1997, Marshalls associates participated in a separate Section 401(k) savings plan con-
sistent with the plan Marshalls associates participated in prior to acquisition.

                  I. Accru ed Expenses and Other Current Liabil it ies
The major components of accrued expenses and other current liabilities are as follows:

                                                                                    J a n u a ry 31,    J a n u a ry 25,
In Thousands                                                                                   1998                1997

Employee compensation and benefits                                                 $142,945             $113,855
Reserve for discontinued operations                                                  17,843               23,650
Store closing and restructuring reserve, continuing operations                       57,966               95,867
Insurance                                                                            58,070               67,403
Rent, utilities, advertising and other                                              334,682              320,436
Accrued expenses and other current liabilities                                     $611,506             $621,211

The Company’s reserve for discontinued operations relates to obligations the Company retained or incurred
in connection with the sale of its former Zayre, Hit or Miss and Chadwick’s operations. During fiscal 1997,
the reserve decreased by $1.6 million. The Company added $10.7 million to the reserve, relating to antic-
ipated costs associated with the sale of Chadwick’s, which was offset by reductions to the reserve of $12.3
million, primarily relating to lease obligations. During fiscal 1998, the reduction to the reserve of $5.8
million is primarily for settlement costs associated with Chadwick’s and for lease related costs associated
with the former Zayre and Hit or Miss properties. The combined remaining reserve balance of $17.8 million as
of January 31, 1998 is expected to be used for lease related obligations, primarily for former Zayre stores,
which is expected to be paid out over the next ten to fifteen years, as leases are settled or terminated.
   The reserve for store closings and restructurings is primarily for costs associated with the disposition
and settlement of leases for the T.J. Maxx and Marshalls closings anticipated as a result of the Marshalls
acquisition.The initial reserves established in fiscal 1996 were estimated at $244.1 million for a Marshalls
store closing and restructuring plan and $35 million for the closing of certain T.J. Maxx stores.
    The Marshalls reserve included $44.1 million for inventory markdowns. The primary reduction to the
reserve in fiscal 1996 was for inventory markdowns. During fiscal 1997 and 1998, the Marshalls reserve
was reduced by $85.9 million and $15.8 million, respectively, to reflect a reduction in the number of store
closings and a lower cost to settle and dispose of lease obligations. These reserve reductions resulted in
adjustments to the allocation of the Marshalls purchase price as discussed in Note A to the consolidated
financial statements. The adjusted reserve balance included $70.8 million for lease related obligations for
planned store and other facility closings, $9.6 million for property write-offs, $44.1 million for inventory


32
markdowns and $17.9 million for severance, professional fees and all other costs associated with the
restructuring plan. The only non-cash charge portion of the reserve was for property write-offs.
   The Company also established a reserve for the closing of certain T.J. Maxx stores. The Company
recorded an initial charge to income from continuing operations of $35 million in fiscal 1996 and a credit
to income from continuing operations of $8 million in fiscal 1997 to reflect a lower than anticipated cost
of the T.J. Maxx closings. The adjusted reserve balance includes $15.6 million for lease related obligations
of the closed stores, non-cash charges of $9.8 million for property write-offs and $2.3 million for
severance, professional fees and all other costs associated with the closings.
   The following is a summary of the activity in the store closing and restructuring reserve for the last
two fiscal years:
                                                                                                     Fiscal Year Ended
                                                                                         J a n u a ry 31,          J a n u a ry 25,
In Thousands                                                                                        1998                      1997

Balance, beginning of the year                                                           $ 95,867                  $251,566
Reserve adjustments:
  Adjust Marshalls restructuring reserve                                                   (15,843)                    (85,900)
  Adjust T.J. Maxx store closing reserve                                                       700                      (8,000)
Charges against the reserve:
  Lease related obligations                                                               (13,593)                   (21,277)
  Inventory markdowns                                                                           –                    (15,886)
  Severance and all other cash charges                                                     (1,876)                   (13,901)
  Net activity relating to HomeGoods closings                                              (1,887)                       329
  Non-cash property write-offs                                                             (5,402)                   (11,064)
Balance, end of year                                                                     $ 57,966                  $ 95,867

All the Marshalls and T.J. Maxx properties for which reserves were provided have been closed. The remain-
ing reserve balance as of January 31, 1998 of $58 million is almost entirely for the estimated cost of future
obligations of the closed store and other facility leases. It includes estimates and assumptions as to how
the leases will be disposed of and could change; however, the Company believes it has adequate reserves to
deal with these obligations. The use of the reserve will reduce operating cash flows in varying amounts
over the next ten to fifteen years as the related leases expire or are settled.

                         J. Supplemental Cash Flows Information
The Company classifies the cash flows associated with the operating results of its discontinued operations
through the date of sale, as “net cash provided by (used in) discontinued operations.” The following is a
reconciliation of the “income from discontinued operations, net of income taxes” to the “net cash provided
by (used in) discontinued operations.”
                                                                                      Fiscal Year Ended
                                                                   J a n u a ry 31,      J a n u a ry 25,           J a n u a ry 27,
                                                                              1998                  1997                       1996
                                                                     (53 weeks)

Income from discontinued operations, net of income taxes            $            –      $ 29,361                   $     9,710
(Increase) decrease in net assets of discontinued
   operations during the period:
     Net assets of discontinued operations –
         beginning of period                                          54,451              128,586                      93,397
   Less:
     Net assets of discontinued operations – sold during period           –               54,083                      44,789
     Net assets of discontinued operations – end of period                –               54,451                    128,586
(Increase) decrease in net assets of discontinued operations         54,451               20,052                     (79,978)
   Net cash provided by (used in) discontinued operations           $54,451             $ 49,413                   $ (70,268)

The Company is also responsible for certain leases related to, and other obligations arising from, the sale
of these operations, for which reserves have been provided in its reserve for discontinued operations, and
is included in accrued expenses. The cash flow impact of these obligations is reflected as a component
of cash provided by operating activities in the statements of cash flows.


                                                                                                                                 33
The Company’s cash payments for interest expense and income taxes, including discontinued opera-
tions, and its non-cash investing and financing activities are as follows:

                                                                                     Fiscal Year Ended
                                                                  J a n u a ry 31,      J a n u a ry 25,   J a n u a ry 27,
In Thousands                                                                 1998                  1997               1996
                                                                    (53 weeks)

Cash paid for:
  Interest                                                       $ 26,359              $ 44,288            $ 41,924
  Income taxes                                                    199,025               159,245              17,275
Non-cash investing and financing activities:
  Conversion of cumulative convertible preferred
     stock into common stock
        Series A                                                 $        –            $ 25,000            $      –
        Series C                                                          –              82,500                   –
        Series D                                                          –              25,000                   –
        Series E                                                     77,020                   –                   –
  Distribution of two-for-one stock split                            79,823                   –                   –
  Note receivable from sale of Chadwick’s of Boston                       –              20,000                   –
  Issuance of preferred stock for acquisition of Marshalls                –                   –             175,000
  Note receivable from sale of Hit or Miss                                –                   –              10,000

           K. Discontinued Operations and Related Contingent Liabilities
In October 1988, the Company completed the sale of its former Zayre Stores division to Ames Department
Stores, Inc. (“Ames”). In April 1990, Ames filed for protection under Chapter 11 of the Federal Bankruptcy
Code and in December 1992, Ames emerged from bankruptcy under a plan of reorganization.
   The Company remains contingently liable for the leases of most of the former Zayre stores still oper-
ated by Ames. In addition, the Company is contingently liable on a number of leases of the Hit or Miss
division, the Company’s former off-price women’s specialty stores, sold on September 30, 1995. The
Company believes that the Company’s contingent liability on these leases will not have a material effect
on the Company’s financial condition.
   The Company is also contingently liable on certain leases of its former warehouse club operations
(BJ’s Wholesale Club and HomeBase), which was spun off by the Company in fiscal 1990 as Waban Inc.
During fiscal 1998, Waban Inc. was renamed HomeBase, Inc. and spun-off from its BJ’s Wholesale Club
division (BJ’s Wholesale Club, Inc.). HomeBase, Inc., and BJ’s Wholesale Club, Inc. are primarily liable on
their respective leases and have indemnified the Company for any amounts the Company may have to pay
with respect to such leases. In addition HomeBase, Inc., BJ’s Wholesale Club, Inc. and the Company have
entered into agreements under which BJ’s Wholesale Club, Inc. has substantial indemnification responsi-
bility with respect to such HomeBase, Inc. leases. The Company is also contingently liable on certain
leases of BJ’s Wholesale Club, Inc. for which both BJ’s Wholesale Club, Inc. and HomeBase, Inc. remain
liable. The Company believes that its contingent liability on the HomeBase, Inc. and BJ’s Wholesale Club,
Inc. leases will not have a material effect on the Company’s financial condition.

                                     L. Segment Information
For data on business segments for fiscal 1998, 1997 and 1996, see page 20.


34
tjx Annual Reports1997

More Related Content

What's hot

helath net 99 AR
helath net 99 ARhelath net 99 AR
helath net 99 ARfinance18
 
RyderPresReleasTablesQ32005
RyderPresReleasTablesQ32005RyderPresReleasTablesQ32005
RyderPresReleasTablesQ32005finance44
 
state street corp stt_finrev02
state street corp stt_finrev02state street corp stt_finrev02
state street corp stt_finrev02finance23
 
danaher 04-4Q-REL
danaher 04-4Q-RELdanaher 04-4Q-REL
danaher 04-4Q-RELfinance24
 
Q1 2007 Earnings Release Financial Tables
 	Q1 2007 Earnings Release Financial Tables 	Q1 2007 Earnings Release Financial Tables
Q1 2007 Earnings Release Financial Tablesfinance7
 
Q4 2006 Earnings Release Financial Tables
Q4 2006 Earnings Release Financial TablesQ4 2006 Earnings Release Financial Tables
Q4 2006 Earnings Release Financial Tablesfinance7
 
CLX0503SegInfo-159159
CLX0503SegInfo-159159CLX0503SegInfo-159159
CLX0503SegInfo-159159finance48
 
Q4 2005 Earnings Release Financial Tables
Q4 2005 Earnings Release Financial TablesQ4 2005 Earnings Release Financial Tables
Q4 2005 Earnings Release Financial Tablesfinance7
 
Q3 2004 Earnings Release Financial Tables
Q3 2004 Earnings Release Financial TablesQ3 2004 Earnings Release Financial Tables
Q3 2004 Earnings Release Financial Tablesfinance7
 
Big_Lots_AR2003FSO
Big_Lots_AR2003FSOBig_Lots_AR2003FSO
Big_Lots_AR2003FSOfinance50
 
ual Annual Report2001
ual Annual Report2001ual Annual Report2001
ual Annual Report2001finance13
 
ual 1998 Annual Report - Low-Res (1.9Mb)
ual 1998 Annual Report - Low-Res (1.9Mb)ual 1998 Annual Report - Low-Res (1.9Mb)
ual 1998 Annual Report - Low-Res (1.9Mb)finance13
 
wal mart store 2003Financials
wal mart store 2003Financialswal mart store 2003Financials
wal mart store 2003Financialsfinance1
 
4Q07EarningsReleaseTABLESPDF
4Q07EarningsReleaseTABLESPDF4Q07EarningsReleaseTABLESPDF
4Q07EarningsReleaseTABLESPDFfinance22
 
dover Q208_Supplement_r232g32g32g
dover Q208_Supplement_r232g32g32gdover Q208_Supplement_r232g32g32g
dover Q208_Supplement_r232g32g32gfinance30
 
reliance steel & aluminum 2005_Annual_Report
reliance steel & aluminum  2005_Annual_Reportreliance steel & aluminum  2005_Annual_Report
reliance steel & aluminum 2005_Annual_Reportfinance32
 
advanced micro devices Q106Results
advanced micro devices Q106Resultsadvanced micro devices Q106Results
advanced micro devices Q106Resultsfinance34
 

What's hot (18)

helath net 99 AR
helath net 99 ARhelath net 99 AR
helath net 99 AR
 
RyderPresReleasTablesQ32005
RyderPresReleasTablesQ32005RyderPresReleasTablesQ32005
RyderPresReleasTablesQ32005
 
state street corp stt_finrev02
state street corp stt_finrev02state street corp stt_finrev02
state street corp stt_finrev02
 
danaher 04-4Q-REL
danaher 04-4Q-RELdanaher 04-4Q-REL
danaher 04-4Q-REL
 
Q1 2007 Earnings Release Financial Tables
 	Q1 2007 Earnings Release Financial Tables 	Q1 2007 Earnings Release Financial Tables
Q1 2007 Earnings Release Financial Tables
 
Q4 2006 Earnings Release Financial Tables
Q4 2006 Earnings Release Financial TablesQ4 2006 Earnings Release Financial Tables
Q4 2006 Earnings Release Financial Tables
 
CLX0503SegInfo-159159
CLX0503SegInfo-159159CLX0503SegInfo-159159
CLX0503SegInfo-159159
 
Q4 2005 Earnings Release Financial Tables
Q4 2005 Earnings Release Financial TablesQ4 2005 Earnings Release Financial Tables
Q4 2005 Earnings Release Financial Tables
 
Q3 2004 Earnings Release Financial Tables
Q3 2004 Earnings Release Financial TablesQ3 2004 Earnings Release Financial Tables
Q3 2004 Earnings Release Financial Tables
 
Wabab 1
Wabab 1Wabab 1
Wabab 1
 
Big_Lots_AR2003FSO
Big_Lots_AR2003FSOBig_Lots_AR2003FSO
Big_Lots_AR2003FSO
 
ual Annual Report2001
ual Annual Report2001ual Annual Report2001
ual Annual Report2001
 
ual 1998 Annual Report - Low-Res (1.9Mb)
ual 1998 Annual Report - Low-Res (1.9Mb)ual 1998 Annual Report - Low-Res (1.9Mb)
ual 1998 Annual Report - Low-Res (1.9Mb)
 
wal mart store 2003Financials
wal mart store 2003Financialswal mart store 2003Financials
wal mart store 2003Financials
 
4Q07EarningsReleaseTABLESPDF
4Q07EarningsReleaseTABLESPDF4Q07EarningsReleaseTABLESPDF
4Q07EarningsReleaseTABLESPDF
 
dover Q208_Supplement_r232g32g32g
dover Q208_Supplement_r232g32g32gdover Q208_Supplement_r232g32g32g
dover Q208_Supplement_r232g32g32g
 
reliance steel & aluminum 2005_Annual_Report
reliance steel & aluminum  2005_Annual_Reportreliance steel & aluminum  2005_Annual_Report
reliance steel & aluminum 2005_Annual_Report
 
advanced micro devices Q106Results
advanced micro devices Q106Resultsadvanced micro devices Q106Results
advanced micro devices Q106Results
 

Viewers also liked

Caldoria Executive Summary v3
Caldoria Executive Summary v3Caldoria Executive Summary v3
Caldoria Executive Summary v3Victor Chiu
 
Smartphones i PDA
Smartphones i PDASmartphones i PDA
Smartphones i PDAbuti1974
 
Lumix 3 Focuses
Lumix 3 FocusesLumix 3 Focuses
Lumix 3 Focusesteh K K
 
Modernform annual report 2013
Modernform annual report 2013Modernform annual report 2013
Modernform annual report 2013pongsak_k
 
ELR Rad Waste Article Werner
ELR Rad Waste Article WernerELR Rad Waste Article Werner
ELR Rad Waste Article WernerJim Werner
 
tenet healthcare Q206Earnings_5_
tenet healthcare  Q206Earnings_5_tenet healthcare  Q206Earnings_5_
tenet healthcare Q206Earnings_5_finance42
 
Facebook und social media für Politiker und Gemeinderäte
Facebook und social media für Politiker und GemeinderäteFacebook und social media für Politiker und Gemeinderäte
Facebook und social media für Politiker und GemeinderäteRalph J. Schiel
 
Robin White Resume 10-19-16
Robin White  Resume 10-19-16Robin White  Resume 10-19-16
Robin White Resume 10-19-16Robin White, PMP
 
Stock Market Game ZZ125
Stock Market Game ZZ125Stock Market Game ZZ125
Stock Market Game ZZ125ZZ125
 
Cps for powerpoint:mac user guide
Cps for powerpoint:mac user guideCps for powerpoint:mac user guide
Cps for powerpoint:mac user guideWilliam McIntosh
 
Interpretação do Direito
Interpretação do DireitoInterpretação do Direito
Interpretação do DireitoContatonalua
 
Talbots Construction Documents
Talbots Construction DocumentsTalbots Construction Documents
Talbots Construction Documentsdantedesigns
 

Viewers also liked (20)

Caldoria Executive Summary v3
Caldoria Executive Summary v3Caldoria Executive Summary v3
Caldoria Executive Summary v3
 
Juventud (i)
Juventud (i)Juventud (i)
Juventud (i)
 
Lavadora Electrolux EWF1284EOW
Lavadora Electrolux EWF1284EOWLavadora Electrolux EWF1284EOW
Lavadora Electrolux EWF1284EOW
 
Smartphones i PDA
Smartphones i PDASmartphones i PDA
Smartphones i PDA
 
Lumix 3 Focuses
Lumix 3 FocusesLumix 3 Focuses
Lumix 3 Focuses
 
Modernform annual report 2013
Modernform annual report 2013Modernform annual report 2013
Modernform annual report 2013
 
ELR Rad Waste Article Werner
ELR Rad Waste Article WernerELR Rad Waste Article Werner
ELR Rad Waste Article Werner
 
東京電力値上げ対策セミナー「必ず得する電力料金マネージメント戦略」
東京電力値上げ対策セミナー「必ず得する電力料金マネージメント戦略」東京電力値上げ対策セミナー「必ず得する電力料金マネージメント戦略」
東京電力値上げ対策セミナー「必ず得する電力料金マネージメント戦略」
 
tenet healthcare Q206Earnings_5_
tenet healthcare  Q206Earnings_5_tenet healthcare  Q206Earnings_5_
tenet healthcare Q206Earnings_5_
 
Facebook und social media für Politiker und Gemeinderäte
Facebook und social media für Politiker und GemeinderäteFacebook und social media für Politiker und Gemeinderäte
Facebook und social media für Politiker und Gemeinderäte
 
Robin White Resume 10-19-16
Robin White  Resume 10-19-16Robin White  Resume 10-19-16
Robin White Resume 10-19-16
 
Stock Market Game ZZ125
Stock Market Game ZZ125Stock Market Game ZZ125
Stock Market Game ZZ125
 
Neos enterprise
Neos enterpriseNeos enterprise
Neos enterprise
 
Cps for powerpoint:mac user guide
Cps for powerpoint:mac user guideCps for powerpoint:mac user guide
Cps for powerpoint:mac user guide
 
BNY mellon
BNY mellonBNY mellon
BNY mellon
 
E globuz z-vol1_issue2
E globuz z-vol1_issue2E globuz z-vol1_issue2
E globuz z-vol1_issue2
 
Interpretação do Direito
Interpretação do DireitoInterpretação do Direito
Interpretação do Direito
 
Mariana motta
Mariana mottaMariana motta
Mariana motta
 
El libro del tesoro [1]..Fm
El libro del tesoro [1]..FmEl libro del tesoro [1]..Fm
El libro del tesoro [1]..Fm
 
Talbots Construction Documents
Talbots Construction DocumentsTalbots Construction Documents
Talbots Construction Documents
 

Similar to tjx Annual Reports1997

tjx Annual Reports1999
tjx Annual Reports1999tjx Annual Reports1999
tjx Annual Reports1999finance14
 
state street corp stt_finrev02
state street corp stt_finrev02state street corp stt_finrev02
state street corp stt_finrev02finance23
 
ppg industries 2Q06EarningsReleaseTablesPDF
ppg industries 2Q06EarningsReleaseTablesPDFppg industries 2Q06EarningsReleaseTablesPDF
ppg industries 2Q06EarningsReleaseTablesPDFfinance22
 
danaher 06_4Q_Release
danaher 06_4Q_Releasedanaher 06_4Q_Release
danaher 06_4Q_Releasefinance24
 
danaher 05-4Q-REL
danaher 05-4Q-RELdanaher 05-4Q-REL
danaher 05-4Q-RELfinance24
 
danaher 05-4Q-REL
danaher 05-4Q-RELdanaher 05-4Q-REL
danaher 05-4Q-RELfinance24
 
conoco phillips 2007Fourth Quarter
conoco phillips 2007Fourth Quarterconoco phillips 2007Fourth Quarter
conoco phillips 2007Fourth Quarterfinance1
 
ppg industries 3Q 06 Earning sTables
ppg industries 3Q 06 Earning sTables ppg industries 3Q 06 Earning sTables
ppg industries 3Q 06 Earning sTables finance22
 
allstate Financial Section 2000
allstate Financial Section 2000allstate Financial Section 2000
allstate Financial Section 2000finance7
 
emerson electricl Proxy Statement for 2009 Annual Shareholders Meeting
emerson electricl Proxy Statement for 2009 Annual Shareholders Meeting  emerson electricl Proxy Statement for 2009 Annual Shareholders Meeting
emerson electricl Proxy Statement for 2009 Annual Shareholders Meeting finance12
 
advanced micro devices Q207Financials
advanced micro devices Q207Financialsadvanced micro devices Q207Financials
advanced micro devices Q207Financialsfinance34
 
advanced micro devices Q308Financials
advanced micro devices Q308Financialsadvanced micro devices Q308Financials
advanced micro devices Q308Financialsfinance34
 
ppg industries 4Q06/Earnings PressReleaseTablesPDF
ppg industries 4Q06/Earnings PressReleaseTablesPDFppg industries 4Q06/Earnings PressReleaseTablesPDF
ppg industries 4Q06/Earnings PressReleaseTablesPDFfinance22
 
CLOrox earnings_q1fy06
CLOrox   earnings_q1fy06CLOrox   earnings_q1fy06
CLOrox earnings_q1fy06finance48
 
danaher 08_4Q_Release
danaher 08_4Q_Releasedanaher 08_4Q_Release
danaher 08_4Q_Releasefinance24
 

Similar to tjx Annual Reports1997 (20)

tjx Annual Reports1999
tjx Annual Reports1999tjx Annual Reports1999
tjx Annual Reports1999
 
itw_10q2q02
itw_10q2q02itw_10q2q02
itw_10q2q02
 
itw_10q2q02
itw_10q2q02itw_10q2q02
itw_10q2q02
 
state street corp stt_finrev02
state street corp stt_finrev02state street corp stt_finrev02
state street corp stt_finrev02
 
ppg industries 2Q06EarningsReleaseTablesPDF
ppg industries 2Q06EarningsReleaseTablesPDFppg industries 2Q06EarningsReleaseTablesPDF
ppg industries 2Q06EarningsReleaseTablesPDF
 
danaher 06_4Q_Release
danaher 06_4Q_Releasedanaher 06_4Q_Release
danaher 06_4Q_Release
 
itw_10qq102
itw_10qq102itw_10qq102
itw_10qq102
 
itw_10qq102
itw_10qq102itw_10qq102
itw_10qq102
 
danaher 05-4Q-REL
danaher 05-4Q-RELdanaher 05-4Q-REL
danaher 05-4Q-REL
 
danaher 05-4Q-REL
danaher 05-4Q-RELdanaher 05-4Q-REL
danaher 05-4Q-REL
 
conoco phillips 2007Fourth Quarter
conoco phillips 2007Fourth Quarterconoco phillips 2007Fourth Quarter
conoco phillips 2007Fourth Quarter
 
ppg industries 3Q 06 Earning sTables
ppg industries 3Q 06 Earning sTables ppg industries 3Q 06 Earning sTables
ppg industries 3Q 06 Earning sTables
 
allstate Financial Section 2000
allstate Financial Section 2000allstate Financial Section 2000
allstate Financial Section 2000
 
emerson electricl Proxy Statement for 2009 Annual Shareholders Meeting
emerson electricl Proxy Statement for 2009 Annual Shareholders Meeting  emerson electricl Proxy Statement for 2009 Annual Shareholders Meeting
emerson electricl Proxy Statement for 2009 Annual Shareholders Meeting
 
advanced micro devices Q207Financials
advanced micro devices Q207Financialsadvanced micro devices Q207Financials
advanced micro devices Q207Financials
 
advanced micro devices Q308Financials
advanced micro devices Q308Financialsadvanced micro devices Q308Financials
advanced micro devices Q308Financials
 
ppg industries 4Q06/Earnings PressReleaseTablesPDF
ppg industries 4Q06/Earnings PressReleaseTablesPDFppg industries 4Q06/Earnings PressReleaseTablesPDF
ppg industries 4Q06/Earnings PressReleaseTablesPDF
 
CLOrox earnings_q1fy06
CLOrox   earnings_q1fy06CLOrox   earnings_q1fy06
CLOrox earnings_q1fy06
 
danaher 08_4Q_Release
danaher 08_4Q_Releasedanaher 08_4Q_Release
danaher 08_4Q_Release
 
Q1 2009 Earning Report of Microsoft
Q1 2009 Earning Report of MicrosoftQ1 2009 Earning Report of Microsoft
Q1 2009 Earning Report of Microsoft
 

More from finance14

freeport-mcmoran copper& gold Certificate of Designations for Freeport-McMoR...
freeport-mcmoran copper& gold  Certificate of Designations for Freeport-McMoR...freeport-mcmoran copper& gold  Certificate of Designations for Freeport-McMoR...
freeport-mcmoran copper& gold Certificate of Designations for Freeport-McMoR...finance14
 
freeport-mcmoran copper& gold Amended & Restated Certificate of Incorporatio...
freeport-mcmoran copper& gold  Amended & Restated Certificate of Incorporatio...freeport-mcmoran copper& gold  Amended & Restated Certificate of Incorporatio...
freeport-mcmoran copper& gold Amended & Restated Certificate of Incorporatio...finance14
 
freeport-mcmoran copper& gold Public Policy Committee
freeport-mcmoran copper& gold  Public Policy Committeefreeport-mcmoran copper& gold  Public Policy Committee
freeport-mcmoran copper& gold Public Policy Committeefinance14
 
freeport-mcmoran copper& gold Nominating & Corporate Governance Committee
freeport-mcmoran copper& gold  Nominating & Corporate Governance Committeefreeport-mcmoran copper& gold  Nominating & Corporate Governance Committee
freeport-mcmoran copper& gold Nominating & Corporate Governance Committeefinance14
 
freeport-mcmoran copper& gold Corporate Personnel Committee
freeport-mcmoran copper& gold  Corporate Personnel Committeefreeport-mcmoran copper& gold  Corporate Personnel Committee
freeport-mcmoran copper& gold Corporate Personnel Committeefinance14
 
freeport-mcmoran copper& gold Audit Committee
freeport-mcmoran copper& gold  Audit Committeefreeport-mcmoran copper& gold  Audit Committee
freeport-mcmoran copper& gold Audit Committeefinance14
 
freeport-mcmoran copper& gold 2008ar
freeport-mcmoran copper& gold  2008arfreeport-mcmoran copper& gold  2008ar
freeport-mcmoran copper& gold 2008arfinance14
 
freeport-mcmoran copper& gold Proxy Statement 2004
freeport-mcmoran copper& gold Proxy Statement 2004freeport-mcmoran copper& gold Proxy Statement 2004
freeport-mcmoran copper& gold Proxy Statement 2004finance14
 
freeport-mcmoran copper& gold 2003ar
freeport-mcmoran copper& gold  2003arfreeport-mcmoran copper& gold  2003ar
freeport-mcmoran copper& gold 2003arfinance14
 
freeport-mcmoran copper& gold Proxy Statement 2005
freeport-mcmoran copper& gold Proxy Statement 2005freeport-mcmoran copper& gold Proxy Statement 2005
freeport-mcmoran copper& gold Proxy Statement 2005finance14
 
freeport-mcmoran copper& gold 2004 ar
freeport-mcmoran copper& gold 2004 arfreeport-mcmoran copper& gold 2004 ar
freeport-mcmoran copper& gold 2004 arfinance14
 
freeport-mcmoran copper& gold Proxy Statement 2006
freeport-mcmoran copper& gold Proxy Statement 2006freeport-mcmoran copper& gold Proxy Statement 2006
freeport-mcmoran copper& gold Proxy Statement 2006finance14
 
freeport-mcmoran copper& gold 2005 ar
freeport-mcmoran copper& gold 2005 arfreeport-mcmoran copper& gold 2005 ar
freeport-mcmoran copper& gold 2005 arfinance14
 
freeport-mcmoran copper& gold Proxy Statement 2007
freeport-mcmoran copper& gold Proxy Statement 2007freeport-mcmoran copper& gold Proxy Statement 2007
freeport-mcmoran copper& gold Proxy Statement 2007finance14
 
freeport-mcmoran copper& gold 2006 ar
freeport-mcmoran copper& gold 2006 arfreeport-mcmoran copper& gold 2006 ar
freeport-mcmoran copper& gold 2006 arfinance14
 
freeport-mcmoran copper& gold Proxy Statement 2008
freeport-mcmoran copper& gold Proxy Statement 2008freeport-mcmoran copper& gold Proxy Statement 2008
freeport-mcmoran copper& gold Proxy Statement 2008finance14
 
freeport-mcmoran copper& gold 2007 ar
freeport-mcmoran copper& gold 2007 arfreeport-mcmoran copper& gold 2007 ar
freeport-mcmoran copper& gold 2007 arfinance14
 
loews Highmount Parker
loews Highmount Parker loews Highmount Parker
loews Highmount Parker finance14
 
loews 2 CNA Lilienthal Mense
loews 2 CNA Lilienthal Mense loews 2 CNA Lilienthal Mense
loews 2 CNA Lilienthal Mense finance14
 
loews Q307_10Q
loews Q307_10Qloews Q307_10Q
loews Q307_10Qfinance14
 

More from finance14 (20)

freeport-mcmoran copper& gold Certificate of Designations for Freeport-McMoR...
freeport-mcmoran copper& gold  Certificate of Designations for Freeport-McMoR...freeport-mcmoran copper& gold  Certificate of Designations for Freeport-McMoR...
freeport-mcmoran copper& gold Certificate of Designations for Freeport-McMoR...
 
freeport-mcmoran copper& gold Amended & Restated Certificate of Incorporatio...
freeport-mcmoran copper& gold  Amended & Restated Certificate of Incorporatio...freeport-mcmoran copper& gold  Amended & Restated Certificate of Incorporatio...
freeport-mcmoran copper& gold Amended & Restated Certificate of Incorporatio...
 
freeport-mcmoran copper& gold Public Policy Committee
freeport-mcmoran copper& gold  Public Policy Committeefreeport-mcmoran copper& gold  Public Policy Committee
freeport-mcmoran copper& gold Public Policy Committee
 
freeport-mcmoran copper& gold Nominating & Corporate Governance Committee
freeport-mcmoran copper& gold  Nominating & Corporate Governance Committeefreeport-mcmoran copper& gold  Nominating & Corporate Governance Committee
freeport-mcmoran copper& gold Nominating & Corporate Governance Committee
 
freeport-mcmoran copper& gold Corporate Personnel Committee
freeport-mcmoran copper& gold  Corporate Personnel Committeefreeport-mcmoran copper& gold  Corporate Personnel Committee
freeport-mcmoran copper& gold Corporate Personnel Committee
 
freeport-mcmoran copper& gold Audit Committee
freeport-mcmoran copper& gold  Audit Committeefreeport-mcmoran copper& gold  Audit Committee
freeport-mcmoran copper& gold Audit Committee
 
freeport-mcmoran copper& gold 2008ar
freeport-mcmoran copper& gold  2008arfreeport-mcmoran copper& gold  2008ar
freeport-mcmoran copper& gold 2008ar
 
freeport-mcmoran copper& gold Proxy Statement 2004
freeport-mcmoran copper& gold Proxy Statement 2004freeport-mcmoran copper& gold Proxy Statement 2004
freeport-mcmoran copper& gold Proxy Statement 2004
 
freeport-mcmoran copper& gold 2003ar
freeport-mcmoran copper& gold  2003arfreeport-mcmoran copper& gold  2003ar
freeport-mcmoran copper& gold 2003ar
 
freeport-mcmoran copper& gold Proxy Statement 2005
freeport-mcmoran copper& gold Proxy Statement 2005freeport-mcmoran copper& gold Proxy Statement 2005
freeport-mcmoran copper& gold Proxy Statement 2005
 
freeport-mcmoran copper& gold 2004 ar
freeport-mcmoran copper& gold 2004 arfreeport-mcmoran copper& gold 2004 ar
freeport-mcmoran copper& gold 2004 ar
 
freeport-mcmoran copper& gold Proxy Statement 2006
freeport-mcmoran copper& gold Proxy Statement 2006freeport-mcmoran copper& gold Proxy Statement 2006
freeport-mcmoran copper& gold Proxy Statement 2006
 
freeport-mcmoran copper& gold 2005 ar
freeport-mcmoran copper& gold 2005 arfreeport-mcmoran copper& gold 2005 ar
freeport-mcmoran copper& gold 2005 ar
 
freeport-mcmoran copper& gold Proxy Statement 2007
freeport-mcmoran copper& gold Proxy Statement 2007freeport-mcmoran copper& gold Proxy Statement 2007
freeport-mcmoran copper& gold Proxy Statement 2007
 
freeport-mcmoran copper& gold 2006 ar
freeport-mcmoran copper& gold 2006 arfreeport-mcmoran copper& gold 2006 ar
freeport-mcmoran copper& gold 2006 ar
 
freeport-mcmoran copper& gold Proxy Statement 2008
freeport-mcmoran copper& gold Proxy Statement 2008freeport-mcmoran copper& gold Proxy Statement 2008
freeport-mcmoran copper& gold Proxy Statement 2008
 
freeport-mcmoran copper& gold 2007 ar
freeport-mcmoran copper& gold 2007 arfreeport-mcmoran copper& gold 2007 ar
freeport-mcmoran copper& gold 2007 ar
 
loews Highmount Parker
loews Highmount Parker loews Highmount Parker
loews Highmount Parker
 
loews 2 CNA Lilienthal Mense
loews 2 CNA Lilienthal Mense loews 2 CNA Lilienthal Mense
loews 2 CNA Lilienthal Mense
 
loews Q307_10Q
loews Q307_10Qloews Q307_10Q
loews Q307_10Q
 

Recently uploaded

Vp Girls near me Delhi Call Now or WhatsApp
Vp Girls near me Delhi Call Now or WhatsAppVp Girls near me Delhi Call Now or WhatsApp
Vp Girls near me Delhi Call Now or WhatsAppmiss dipika
 
Monthly Market Risk Update: April 2024 [SlideShare]
Monthly Market Risk Update: April 2024 [SlideShare]Monthly Market Risk Update: April 2024 [SlideShare]
Monthly Market Risk Update: April 2024 [SlideShare]Commonwealth
 
BPPG response - Options for Defined Benefit schemes - 19Apr24.pdf
BPPG response - Options for Defined Benefit schemes - 19Apr24.pdfBPPG response - Options for Defined Benefit schemes - 19Apr24.pdf
BPPG response - Options for Defined Benefit schemes - 19Apr24.pdfHenry Tapper
 
Call Girls Near Delhi Pride Hotel, New Delhi|9873777170
Call Girls Near Delhi Pride Hotel, New Delhi|9873777170Call Girls Near Delhi Pride Hotel, New Delhi|9873777170
Call Girls Near Delhi Pride Hotel, New Delhi|9873777170Sonam Pathan
 
Call Girls In Yusuf Sarai Women Seeking Men 9654467111
Call Girls In Yusuf Sarai Women Seeking Men 9654467111Call Girls In Yusuf Sarai Women Seeking Men 9654467111
Call Girls In Yusuf Sarai Women Seeking Men 9654467111Sapana Sha
 
Stock Market Brief Deck for "this does not happen often".pdf
Stock Market Brief Deck for "this does not happen often".pdfStock Market Brief Deck for "this does not happen often".pdf
Stock Market Brief Deck for "this does not happen often".pdfMichael Silva
 
How Automation is Driving Efficiency Through the Last Mile of Reporting
How Automation is Driving Efficiency Through the Last Mile of ReportingHow Automation is Driving Efficiency Through the Last Mile of Reporting
How Automation is Driving Efficiency Through the Last Mile of ReportingAggregage
 
NO1 WorldWide online istikhara for love marriage vashikaran specialist love p...
NO1 WorldWide online istikhara for love marriage vashikaran specialist love p...NO1 WorldWide online istikhara for love marriage vashikaran specialist love p...
NO1 WorldWide online istikhara for love marriage vashikaran specialist love p...Amil Baba Dawood bangali
 
Financial Leverage Definition, Advantages, and Disadvantages
Financial Leverage Definition, Advantages, and DisadvantagesFinancial Leverage Definition, Advantages, and Disadvantages
Financial Leverage Definition, Advantages, and Disadvantagesjayjaymabutot13
 
Economics, Commerce and Trade Management: An International Journal (ECTIJ)
Economics, Commerce and Trade Management: An International Journal (ECTIJ)Economics, Commerce and Trade Management: An International Journal (ECTIJ)
Economics, Commerce and Trade Management: An International Journal (ECTIJ)ECTIJ
 
Governor Olli Rehn: Dialling back monetary restraint
Governor Olli Rehn: Dialling back monetary restraintGovernor Olli Rehn: Dialling back monetary restraint
Governor Olli Rehn: Dialling back monetary restraintSuomen Pankki
 
(中央兰开夏大学毕业证学位证成绩单-案例)
(中央兰开夏大学毕业证学位证成绩单-案例)(中央兰开夏大学毕业证学位证成绩单-案例)
(中央兰开夏大学毕业证学位证成绩单-案例)twfkn8xj
 
原版1:1复刻堪萨斯大学毕业证KU毕业证留信学历认证
原版1:1复刻堪萨斯大学毕业证KU毕业证留信学历认证原版1:1复刻堪萨斯大学毕业证KU毕业证留信学历认证
原版1:1复刻堪萨斯大学毕业证KU毕业证留信学历认证jdkhjh
 
AfRESFullPaper22018EmpiricalPerformanceofRealEstateInvestmentTrustsandShareho...
AfRESFullPaper22018EmpiricalPerformanceofRealEstateInvestmentTrustsandShareho...AfRESFullPaper22018EmpiricalPerformanceofRealEstateInvestmentTrustsandShareho...
AfRESFullPaper22018EmpiricalPerformanceofRealEstateInvestmentTrustsandShareho...yordanosyohannes2
 
Interimreport1 January–31 March2024 Elo Mutual Pension Insurance Company
Interimreport1 January–31 March2024 Elo Mutual Pension Insurance CompanyInterimreport1 January–31 March2024 Elo Mutual Pension Insurance Company
Interimreport1 January–31 March2024 Elo Mutual Pension Insurance CompanyTyöeläkeyhtiö Elo
 
212MTAMount Durham University Bachelor's Diploma in Technology
212MTAMount Durham University Bachelor's Diploma in Technology212MTAMount Durham University Bachelor's Diploma in Technology
212MTAMount Durham University Bachelor's Diploma in Technologyz xss
 
NO1 WorldWide Genuine vashikaran specialist Vashikaran baba near Lahore Vashi...
NO1 WorldWide Genuine vashikaran specialist Vashikaran baba near Lahore Vashi...NO1 WorldWide Genuine vashikaran specialist Vashikaran baba near Lahore Vashi...
NO1 WorldWide Genuine vashikaran specialist Vashikaran baba near Lahore Vashi...Amil baba
 
letter-from-the-chair-to-the-fca-relating-to-british-steel-pensions-scheme-15...
letter-from-the-chair-to-the-fca-relating-to-british-steel-pensions-scheme-15...letter-from-the-chair-to-the-fca-relating-to-british-steel-pensions-scheme-15...
letter-from-the-chair-to-the-fca-relating-to-british-steel-pensions-scheme-15...Henry Tapper
 
call girls in Nand Nagri (DELHI) 🔝 >༒9953330565🔝 genuine Escort Service 🔝✔️✔️
call girls in  Nand Nagri (DELHI) 🔝 >༒9953330565🔝 genuine Escort Service 🔝✔️✔️call girls in  Nand Nagri (DELHI) 🔝 >༒9953330565🔝 genuine Escort Service 🔝✔️✔️
call girls in Nand Nagri (DELHI) 🔝 >༒9953330565🔝 genuine Escort Service 🔝✔️✔️9953056974 Low Rate Call Girls In Saket, Delhi NCR
 

Recently uploaded (20)

Vp Girls near me Delhi Call Now or WhatsApp
Vp Girls near me Delhi Call Now or WhatsAppVp Girls near me Delhi Call Now or WhatsApp
Vp Girls near me Delhi Call Now or WhatsApp
 
Monthly Market Risk Update: April 2024 [SlideShare]
Monthly Market Risk Update: April 2024 [SlideShare]Monthly Market Risk Update: April 2024 [SlideShare]
Monthly Market Risk Update: April 2024 [SlideShare]
 
🔝+919953056974 🔝young Delhi Escort service Pusa Road
🔝+919953056974 🔝young Delhi Escort service Pusa Road🔝+919953056974 🔝young Delhi Escort service Pusa Road
🔝+919953056974 🔝young Delhi Escort service Pusa Road
 
BPPG response - Options for Defined Benefit schemes - 19Apr24.pdf
BPPG response - Options for Defined Benefit schemes - 19Apr24.pdfBPPG response - Options for Defined Benefit schemes - 19Apr24.pdf
BPPG response - Options for Defined Benefit schemes - 19Apr24.pdf
 
Call Girls Near Delhi Pride Hotel, New Delhi|9873777170
Call Girls Near Delhi Pride Hotel, New Delhi|9873777170Call Girls Near Delhi Pride Hotel, New Delhi|9873777170
Call Girls Near Delhi Pride Hotel, New Delhi|9873777170
 
Call Girls In Yusuf Sarai Women Seeking Men 9654467111
Call Girls In Yusuf Sarai Women Seeking Men 9654467111Call Girls In Yusuf Sarai Women Seeking Men 9654467111
Call Girls In Yusuf Sarai Women Seeking Men 9654467111
 
Stock Market Brief Deck for "this does not happen often".pdf
Stock Market Brief Deck for "this does not happen often".pdfStock Market Brief Deck for "this does not happen often".pdf
Stock Market Brief Deck for "this does not happen often".pdf
 
How Automation is Driving Efficiency Through the Last Mile of Reporting
How Automation is Driving Efficiency Through the Last Mile of ReportingHow Automation is Driving Efficiency Through the Last Mile of Reporting
How Automation is Driving Efficiency Through the Last Mile of Reporting
 
NO1 WorldWide online istikhara for love marriage vashikaran specialist love p...
NO1 WorldWide online istikhara for love marriage vashikaran specialist love p...NO1 WorldWide online istikhara for love marriage vashikaran specialist love p...
NO1 WorldWide online istikhara for love marriage vashikaran specialist love p...
 
Financial Leverage Definition, Advantages, and Disadvantages
Financial Leverage Definition, Advantages, and DisadvantagesFinancial Leverage Definition, Advantages, and Disadvantages
Financial Leverage Definition, Advantages, and Disadvantages
 
Economics, Commerce and Trade Management: An International Journal (ECTIJ)
Economics, Commerce and Trade Management: An International Journal (ECTIJ)Economics, Commerce and Trade Management: An International Journal (ECTIJ)
Economics, Commerce and Trade Management: An International Journal (ECTIJ)
 
Governor Olli Rehn: Dialling back monetary restraint
Governor Olli Rehn: Dialling back monetary restraintGovernor Olli Rehn: Dialling back monetary restraint
Governor Olli Rehn: Dialling back monetary restraint
 
(中央兰开夏大学毕业证学位证成绩单-案例)
(中央兰开夏大学毕业证学位证成绩单-案例)(中央兰开夏大学毕业证学位证成绩单-案例)
(中央兰开夏大学毕业证学位证成绩单-案例)
 
原版1:1复刻堪萨斯大学毕业证KU毕业证留信学历认证
原版1:1复刻堪萨斯大学毕业证KU毕业证留信学历认证原版1:1复刻堪萨斯大学毕业证KU毕业证留信学历认证
原版1:1复刻堪萨斯大学毕业证KU毕业证留信学历认证
 
AfRESFullPaper22018EmpiricalPerformanceofRealEstateInvestmentTrustsandShareho...
AfRESFullPaper22018EmpiricalPerformanceofRealEstateInvestmentTrustsandShareho...AfRESFullPaper22018EmpiricalPerformanceofRealEstateInvestmentTrustsandShareho...
AfRESFullPaper22018EmpiricalPerformanceofRealEstateInvestmentTrustsandShareho...
 
Interimreport1 January–31 March2024 Elo Mutual Pension Insurance Company
Interimreport1 January–31 March2024 Elo Mutual Pension Insurance CompanyInterimreport1 January–31 March2024 Elo Mutual Pension Insurance Company
Interimreport1 January–31 March2024 Elo Mutual Pension Insurance Company
 
212MTAMount Durham University Bachelor's Diploma in Technology
212MTAMount Durham University Bachelor's Diploma in Technology212MTAMount Durham University Bachelor's Diploma in Technology
212MTAMount Durham University Bachelor's Diploma in Technology
 
NO1 WorldWide Genuine vashikaran specialist Vashikaran baba near Lahore Vashi...
NO1 WorldWide Genuine vashikaran specialist Vashikaran baba near Lahore Vashi...NO1 WorldWide Genuine vashikaran specialist Vashikaran baba near Lahore Vashi...
NO1 WorldWide Genuine vashikaran specialist Vashikaran baba near Lahore Vashi...
 
letter-from-the-chair-to-the-fca-relating-to-british-steel-pensions-scheme-15...
letter-from-the-chair-to-the-fca-relating-to-british-steel-pensions-scheme-15...letter-from-the-chair-to-the-fca-relating-to-british-steel-pensions-scheme-15...
letter-from-the-chair-to-the-fca-relating-to-british-steel-pensions-scheme-15...
 
call girls in Nand Nagri (DELHI) 🔝 >༒9953330565🔝 genuine Escort Service 🔝✔️✔️
call girls in  Nand Nagri (DELHI) 🔝 >༒9953330565🔝 genuine Escort Service 🔝✔️✔️call girls in  Nand Nagri (DELHI) 🔝 >༒9953330565🔝 genuine Escort Service 🔝✔️✔️
call girls in Nand Nagri (DELHI) 🔝 >༒9953330565🔝 genuine Escort Service 🔝✔️✔️
 

tjx Annual Reports1997

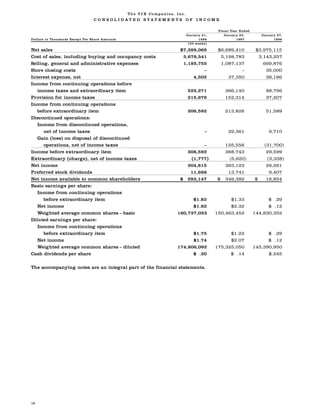
  • 1. The TJX Companies, Inc. C O N S O L I D AT E D S TAT E M E N T S O F I N C O M E Fiscal Year Ended J a n u a ry 31, J a n u a ry 25, J a n u a ry 27, Dollars in Thousands Except Per Share Amounts 1998 1997 1996 (53 weeks) Net sales $7,389,069 $6,689,410 $3,975,115 Cost of sales, including buying and occupancy costs 5,676,541 5,198,783 3,143,257 Selling, general and administrative expenses 1,185,755 1,087,137 669,876 Store closing costs – – 35,000 Interest expense, net 4,502 37,350 38,186 Income from continuing operations before income taxes and extraordinary item 522,271 366,140 88,796 Provision for income taxes 215,679 152,314 37,207 Income from continuing operations before extraordinary item 306,592 213,826 51,589 Discontinued operations: Income from discontinued operations, net of income taxes – 29,361 9,710 Gain (loss) on disposal of discontinued operations, net of income taxes – 125,556 (31,700) Income before extraordinary item 306,592 368,743 29,599 Extraordinary (charge), net of income taxes (1,777) (5,620) (3,338) Net income 304,815 363,123 26,261 Preferred stock dividends 11,668 13,741 9,407 Net income available to common shareholders $ 293,147 $ 349,382 $ 16,854 Basic earnings per share: Income from continuing operations before extraordinary item $1.83 $1.33 $ .29 Net income $1.82 $2.32 $ .12 Weighted average common shares – basic 160,737,023 150,463,452 144,830,352 Diluted earnings per share: Income from continuing operations before extraordinary item $1.75 $1.22 $ .29 Net income $1.74 $2.07 $ .12 Weighted average common shares – diluted 174,806,092 175,325,050 145,390,950 Cash dividends per share $ .20 $ .14 $.245 The accompanying notes are an integral part of the financial statements. 16
  • 2. The TJX Companies, Inc. CONSOLIDATED B ALANC E SHEE TS J a n u a ry 31, J a n u a ry 25, In Thousands 1998 1997 Assets Current assets: Cash and cash equivalents $ 404,369 $ 474,732 Accounts receivable 60,735 57,275 Merchandise inventories 1,190,170 1,059,505 Prepaid expenses 27,357 16,379 Net current assets of discontinued operations – 54,451 Total current assets 1,682,631 1,662,342 Property at cost: Land and buildings 108,729 103,067 Leasehold costs and improvements 480,964 428,836 Furniture, fixtures and equipment 611,470 527,710 1,201,163 1,059,613 Less: accumulated depreciation and amortization 515,027 419,129 686,136 640,484 Other assets 36,645 42,259 Goodwill and tradename, net of amortization 204,220 216,127 Total Assets $2,609,632 $2,561,212 Liabilities Current liabilities: Current installments of long-term debt $ 23,360 $ 27,140 Accounts payable 582,791 533,945 Accrued expenses and other current liabilities 611,506 621,211 Total current liabilities 1,217,657 1,182,296 Long-term debt, exclusive of current installments 221,024 244,410 Deferred income taxes 6,859 7,320 Shareholders’ Equity Preferred stock at face value, authorized 5,000,000 shares, par value $1, issued and outstanding cumulative convertible stock of: 727,300 and 1,500,000 shares of 7% Series E 72,730 150,000 Common stock, authorized 300,000,000 shares, par value $1, issued and outstanding 159,901,247 and 79,576,438 shares 159,901 79,576 Additional paid-in capital 202,053 429,017 Retained earnings 729,408 468,593 Total shareholders’ equity 1,164,092 1,127,186 Total Liabilities and Shareholders’ Equity $2,609,632 $2,561,212 The accompanying notes are an integral part of the financial statements. 17
  • 3. The TJX Companies, Inc. C O N S O L I D ATED STATEMENT S OF CA SH FLO WS Fiscal Year Ended J a n u a ry 31, J a n u a ry 25, J a n u a ry 27, In Thousands 1998 1997 1996 (53 weeks) Cash flows from operating activities: Net income $ 304,815 $ 363,123 $ 26,261 Adjustments to reconcile net income to net cash provided by operating activities: (Income) from discontinued operations, net of income taxes – (29,361) (9,710) (Gain) loss on disposal of discontinued operations – (125,556) 31,700 Extraordinary charge 1,777 5,620 3,338 Depreciation and amortization 124,891 126,830 79,232 (Gain) on sale of other assets (5,992) – – Property disposals and asset write-downs 18,778 25,399 3,489 Other, net 2,064 (732) (382) Changes in assets and liabilities, net of effect of acquisitions and dispositions: (Increase) in accounts receivable (3,460) (2,131) (233) (Increase) decrease in merchandise inventories (130,665) 198,983 211,168 (Increase) decrease in prepaid expenses (10,978) 27 6,872 Increase (decrease) in accounts payable 48,846 95,677 (147,013) Increase in accrued expenses and other current liabilities 39,184 11,928 63,975 (Decrease) in deferred income taxes (3,793) (5,344) (14,143) Net cash provided by operating activities 385,467 664,463 254,554 Cash flows from investing activities: Property additions (192,382) (119,153) (105,864) Proceeds from sale of other assets 15,697 – – Acquisition of Marshalls, net of cash acquired – (49,327) (378,733) Proceeds from (adjustments to) sale of discontinued operations (33,190) 222,800 3,000 Net cash provided by (used in) investing activities (209,875) 54,320 (481,597) Cash flows from financing activities: Payments on short-term debt – – (20,000) Proceeds from borrowings of long-term debt – – 574,861 Principal payments on long-term debt (27,179) (46,506) (31,271) Prepayment of long-term debt – (455,560) – Payment of debt issue expenses – – (14,776) Proceeds from sale and issuance of common stock, net 15,471 34,395 1,040 Stock repurchased (245,198) – – Cash dividends paid (43,500) (35,019) (44,886) Net cash provided by (used in) financing activities (300,406) (502,690) 464,968 Net cash provided by (used in) continuing operations (124,814) 216,093 237,925 Net cash provided by (used in) discontinued operations 54,451 49,413 (70,268) Net increase (decrease) in cash and cash equivalents (70,363) 265,506 167,657 Cash and cash equivalents at beginning of year 474,732 209,226 41,569 Cash and cash equivalents at end of year $ 404,369 $ 474,732 $ 209,226 The accompanying notes are an integral part of the financial statements. 18
  • 4. The TJX Companies, Inc. C O N S O L I D AT E D S TAT E M E N T S O F S H A R E H O L D E R S ’ E Q U I T Y P re f e rre d Common Additional Stock, Stock, Par Paid–in Retained In Thousands Face Va l u e Value $1 Capital E a rn i n g s To t a l Balance, January 28, 1995 $107,500 $ 72,401 $267,937 $159,114 $ 606,952 Net income – – – 26,261 26,261 Cash dividends: Preferred stock – – – (9,407) (9,407) Common stock – – – (35,479) (35,479) Issuance of cumulative convertible preferred stock: Series D 25,000 – – – 25,000 Series E 150,000 – – – 150,000 Issuance of common stock under stock incentive plans and related tax benefits – 85 754 – 839 Other – – 468 – 468 Balance, January 27, 1996 282,500 72,486 269,159 140,489 764,634 Net income – – – 363,123 363,123 Cash dividends: Preferred stock – – – (13,741) (13,741) Common stock – – – (21,278) (21,278) Conversion of cumulative preferred stock into common stock: Series A (25,000) 1,190 23,810 – – Series C (82,500) 3,178 79,322 – – Series D (25,000) 1,350 23,650 – – Issuance of common stock under stock incentive plans and related tax benefits – 1,372 32,786 – 34,158 Other – – 290 – 290 Balance, January 25, 1997 150,000 79,576 429,017 468,593 1,127,186 Net income – – – 304,815 304,815 Cash dividends: Preferred stock – – – (11,668) (11,668) Common stock – – – (31,832) (31,832) Conversion of cumulative Series E preferred stock into common stock (77,020) 8,315 68,705 – – Stock repurchase: Preferred (250) – – (500) (750) Common – (8,528) (235,920) – (244,448) Stock split, two-for-one – 79,823 (79,823) – – Issuance of common stock under stock incentive plans and related tax benefits – 715 15,719 – 16,434 Other – – 4,355 – 4,355 Balance, January 31, 1998 $ 72,730 $159,901 $202,053 $729,408 $1,164,092 The accompanying notes are an integral part of the financial statements. 19
  • 5. The TJX Companies, Inc. SE LECT ED INFO RM ATION BY MA JOR B US INE SS SEG ME NT The following selected information by major business segment reflects the results of Marshalls in the off-price family apparel segment for the periods following its acquisition on November 17, 1995. Fiscal Year Ended J a n u a ry 31, J a n u a ry 25, J a n u a ry 27, In Thousands 1998 1997 1996 (53 weeks) Net sales: Off-price family apparel stores $7,290,959 $6,602,391 $3,896,710 Off-price home fashion stores 98,110 87,019 78,405 $7,389,069 $6,689,410 $3,975,115 Operating income (loss): Off-price family apparel stores (1) $ 596,908 $ 463,419 $ 187,974 Off-price home fashion stores (2) (8,615) (14,018) (13,375) 588,293 449,401 174,599 General corporate expense (3) 58,906 43,297 45,003 Goodwill amortization 2,614 2,614 2,614 Interest expense, net 4,502 37,350 38,186 Income from continuing operations before income taxes and extraordinary item $ 522,271 $ 366,140 $ 88,796 Identifiable assets: Off-price family apparel stores $2,033,945 $1,801,779 $2,116,127 Off-price home fashion stores 39,074 36,493 46,861 Corporate, primarily cash and goodwill (4) 536,613 668,489 382,137 $2,609,632 $2,506,761 $2,545,125 Capital expenditures: Off-price family apparel stores $ 190,720 $ 104,955 $ 87,037 Off-price home fashion stores 1,662 731 7,932 Corporate (4) – 13,467 10,895 $ 192,382 $ 119,153 $ 105,864 Depreciation and amortization: Off-price family apparel stores $ 115,967 $ 113,479 $ 69,596 Off-price home fashion stores 3,186 2,104 1,777 Corporate, including goodwill (4) 5,738 11,247 7,859 $ 124,891 $ 126,830 $ 79,232 ( 1 ) The period ended January 27, 1996 includes a charge of $35 million relating to the closing of certain T.J. Maxx store s . ( 2 ) The perio ds ended January 31, 1 998, Jan uary 25 , 199 7 and Janua ry 27, 1996 i ncl ud e a ch arge of $1.5 million, $3.1 million an d $3.8 million, re s p e c t i v e l y, for certain store closings and other re s t ru cturing costs relating to Hom eGoods. ( 3 ) General corpo rate expense for the fiscal year ended January 31, 1998, in clu des a pre-tax cha rge of $15.2 millio n for costs associated with a deferred compen sation arrangement with the Company’s Chief Executive Officer and a pre-ta x gain of $6 million fo r the sale of Bryla ne, Inc. common stock. Gen eral corporate expen se fo r the fiscal years ended January 25, 1997 and Janu ary 27, 1996 include the net operating resu lts of T.K. M axx. Fiscal yea r 1998 in cludes T. K. Maxx re s u l t s in off-price family apparel stores. ( 4 ) Periods prior to Jan uary 31, 1998 in clude assets and a ctivity of T.K. Ma xx. Fiscal year 1998 includes T.K. Maxx in o ff- price family appa rel stores. 20
  • 6. The TJX Companies, Inc. N O T E S T O C O N S O L I D AT E D F I N A N C I A L S TAT E M E N T S Summary of Accounting Policies F i s c a l Ye a r : The Company’s fiscal year ends on the last Saturday in January. The fiscal year ended J a n u a ry 31, 1998 (fiscal 1998) included 53 weeks. The fiscal years ended January 25, 1997 and J a n u a ry 27, 1996 each included 52 weeks. B a s i s o f P r e s e n t a t i o n : The consolidated financial statements of The TJX Companies, Inc. include the financial statements of all the Company’s wholly-owned subsidiaries, including its foreign subsidiaries. The financial statements for the applicable periods present the Company’s former Chadwick’s and Hit or Miss divi- sions as discontinued operations. The notes pertain to continuing operations except where otherwise noted. The preparation of the financial statements, in conformity with generally accepted accounting princi- ples, requires management to make estimates and assumptions that affect the reported amounts of assets and liabilities, and disclosure of contingent liabilities, at the date of the financial statements as well as the reported amounts of revenues and expenses during the reporting period. Actual results could differ from those estimates. C a s h E q u i v a l e n t s : The Company generally considers highly liquid investments with an initial maturity of three months or less to be cash equivalents. The Company’s investments are primarily high grade com- mercial paper, institutional money market funds and time deposits with major banks. The fair value of cash equivalents approximates carrying value. M e r c h a n d i s e I n v e n t o r i e s : Inventories are stated at the lower of cost or market. The Company uses the retail method for valuing inventories on the first-in first-out basis. D e p r e c i a t i o n a n d A m o r t i z a t i o n : For financial reporting purposes, the Company provides for deprecia- tion and amortization of property principally by the use of the straight-line method over the estimated use- ful lives of the assets. Buildings are depreciated over 33 years, leasehold costs and improvements are generally amortized over the lease term or their estimated useful life, whichever is shorter, and furniture, fixtures and equipment are depreciated over 3 to 10 years. Maintenance and repairs are charged to expense as incurred. Upon retirement or sale, the cost of disposed assets and the related depreciation are eliminated and any gain or loss is included in net income. Debt discount and related issue expenses are amortized over the lives of the related debt issues. Pre-opening costs are charged to operations within the fiscal year that a new store or facility opens. G o o d w i l l a n d Tr a d e n a m e : Goodwill is primarily the excess of the purchase price incurred over the car- rying value of the minority interest in the Company’s former 83%-owned subsidiary. The minority inter- est was acquired pursuant to the Company’s fiscal 1990 restructuring. In addition, goodwill includes the excess of cost over the estimated fair market value of the net assets of Winners Apparel Ltd., acquired by the Company effective May 31, 1990. Goodwill totaled $82.0 million, net of amortization, as of January 31, 1998 and is being amortized over 40 years. Annual amortization of goodwill was $2.6 million in fiscal years 1998, 1997 and 1996. Cumulative amortization as of January 31, 1998 and January 25, 1997 was $22.5 million and $19.9 million, respectively. Tradename is the value assigned to the name “Marshalls” as a result of the Company’s acquisition of the Marshalls chain on November 17, 1995. The final allocation of the purchase price of Marshalls, pursuant to the purchase accounting method, resulted in $130.0 million being allocated to the tradename. The value of the tradename was determined by the discounted present value of assumed after-tax royalty payments, off- set by a reduction for its pro-rata share of the total negative goodwill acquired (see Note A). The tradename is deemed to have an indefinite life and accordingly is being amortized over 40 years. Amortization expense was $3.4 million and $3.7 million for fiscal years 1998 and 1997, respectively. Cumulative amortization as of January 31, 1998 and January 25, 1997 was $7.8 million and $4.4 million, respectively. I m p a i r m e n t o f L o n g - L i v e d A s s e t s : During fiscal 1997, the Company adopted the Statement of Financial Accounting Standards (SFAS) No. 121 “Accounting for the Impairment of Long-Lived Assets and for Long- Lived Assets to Be Disposed Of.” The Company periodically reviews the value of its property and intangible assets in relation to the current and expected operating results of the related business segments in order to assess whether there has been a permanent impairment of their carrying values. 21
  • 7. As a result of the acquisition of Marshalls, and the development of a plan for the realignment of the distri- bution center facilities at T.J. Maxx and Marshalls, certain distribution center assets have been written down to their net estimated realizable value in anticipation of their sale or disposal. The plan is expected to be imple- mented over the next several years. The amounts impacting Marshalls have been reflected in the final alloca- tion of purchase price (see Note A) and those related to T.J. Maxx have been reflected as a $12.2 million impairment charge which has been recorded in selling, general and administrative expenses for fiscal 1997. A d v e r t i s i n g C o s t s : The Company expenses advertising costs during the fiscal year incurred. E a r n i n g s P e r S h a r e : Beginning with the fourth quarter of fiscal 1998, the Company began to report earnings per share in accordance with Statement of Financial Accounting Standards (SFAS) No. 128 “Earnings per Share.” SFAS No. 128 requires the presentation of “basic” and “diluted” earnings per share. Basic earnings per share is based on a simple weighted average of common stock outstanding. Diluted earnings per share includes the dilutive effect of convertible securities and other common stock equiva- lents. See Note F for a computation of basic and diluted earnings per share. All earnings per share amounts discussed refer to diluted earnings per share unless otherwise indicated. F o r e i g n C u r r e n c y Tr a n s l a t i o n : The Company’s foreign assets and liabilities are translated at the year- end exchange rate and income statement items are translated at the average exchange rates prevailing dur- ing the year. A large portion of the Company’s net investment in foreign operations is hedged with foreign currency swap agreements and forward contracts. The translation adjustment associated with the foreign operations and the related hedging instruments are included in shareholders’ equity as a component of additional paid-in capital. Cumulative foreign currency translation adjustments included in shareholders’ equity amounted to losses of $1.7 million as of January 31, 1998 and $1.0 million as of January 25, 1997. N e w A c c o u n t i n g S t a n d a r d s : During 1997, the Financial Accounting Standards Board (FASB) issued Statement of Financial Accounting Standards (SFAS) No. 130, “Reporting Comprehensive Income.” This statement specifies the computation, presentation and disclosures for components of comprehensive income. The Company will implement the standard in its fiscal year ending January 30, 1999. The adoption of this standard will not have a material impact on the consolidated financial statements. During 1997, the Financial Accounting Standards Board (FASB) also issued Statement of Financial Accounting Standards (SFAS) No. 131, “Disclosure about Segments of an Enterprise and Related Informa- tion.” This statement changes the manner in which public companies report information about their operat- ing segments. SFAS No. 131, which is based on the management approach to segment reporting, establishes requirements to report selected segment information quarterly and to report entity-wide disclosures about products and services, major customers, and the geographic locations in which the entity holds assets and reports revenue. The Company is currently evaluating the effects of this change on its reporting of segment information. The Company will adopt SFAS No. 131 in its fiscal year ending January 30, 1999. O t h e r : Certain amounts in prior years’ financial statements have been reclassified for comparative purposes. The Company is in the process of converting all necessary systems to be year 2000 compliant. The Company expects to spend an aggregate of approximately $10 million on conversion costs, primarily in fiscal 1998 and 1999. A. D ispo siti ons and A cq uisit ions S a l e o f C h a d w i c k ’s o f B o s t o n : During the fourth quarter of fiscal 1997, the Company sold its Chadwick’s of Boston catalog division to Brylane, L.P. Proceeds of approximately $300 million included cash, a 10 year $20 million Convertible Subordinated Note at 6% interest (the “Brylane note”) and Chadwick’s consumer credit card receivables. During the second quarter of fiscal 1998, the Company paid Brylane $28.8 million as an estimated adjustment to the cash proceeds based on the closing balance sheet of Chadwick’s as of December 7, 1996 as prepared by the Company. During the quarter ended October 1997, the Company paid Brylane $4.4 million upon agreement of the final closing balance sheet of Chadwick’s as of December 7, 1996. The results of Chadwick’s for all periods prior to December 7, 1996 have been reclassified to discon- tinued operations. The cash provided by discontinued operations for fiscal 1998 represents the collection of the remaining balance of the Chadwick’s consumer credit card receivables outstanding as of January 25, 1997. During the quarter ended October 1997, the Company converted a portion of the Brylane note into 352,908 shares of Brylane, Inc. common stock which it sold for $15.7 million. This sale resulted in an 22
  • 8. after-tax gain of $3.6 million, or $.02 per share. Subsequent to the end of the year, the Company converted an additional portion of the Brylane note into 258,836 shares of Brylane, Inc. common stock. The Company donated 181,818 of these shares to the Company’s charitable foundation and sold the remaining 77,018 shares during the first quarter of fiscal 1999. The net after-tax impact of these transactions on the Company’s first quarter results is immaterial. Pursuant to the acquisition, the Company agreed to purchase certain amounts of excess inventory from Chadwick’s through fiscal 2000. The Chadwick’s of Boston catalog division had net sales of $464.8 million and recorded income from operations of $29.4 million, net of income taxes of $20.9 million, for the fiscal year ended January 25, 1997, which represents the results through December 7, 1996, the effective date of the transaction. The results of Chadwick’s for all periods prior to December 7, 1996 have been reclassified to discontinued oper- ations. The sale of the division resulted in a gain on disposal of $125.6 million, net of income taxes of $15.2 million, or $.72 per share. This gain allowed the Company to utilize its $139 million capital loss carryforward (see Note G). Interest expense was allocated to discontinued operations based on their respective proportion of assets to total assets. Net sales for Chadwick’s were $472.4 million and income from operations was $12.0 million, net of income taxes of $8.1 million, for fiscal 1996. S a l e o f H i t o r M i s s : Effective September 30, 1995, the Company sold its Hit or Miss division to members of Hit or Miss management and outside investors. The Company received $3 million in cash and a 7 year $10 million note with interest at 10%. During fiscal year ended 1998, the Company forgave a portion of this note and was released from certain obligations and guarantees which reduced the note to $5.5 million. The Hit or Miss division had net sales of $165.4 million and recorded an operating loss of $2.3 million, net of income tax benefits of $1.4 million, for the fiscal year ended January 27, 1996, which represents results through July 29, 1995, the measurement date of the transaction. Hit or Miss’ operating results for all prior periods have been reclassified to discontinued operations. The sale of the division resulted in a loss on disposal of $31.7 million (net of income tax benefits of $19.8 million) and includes the operating results from July 30, 1995 through the closing date, as well as the cost to the Company of closing 69 Hit or Miss stores. Interest expense was allocated to discontinued operations based on their respective pro- portion of assets to total assets. A c q u i s i t i o n o f M a r s h a l l s : On November 17, 1995, the Company acquired the Marshalls family apparel chain from Melville Corporation. The Company paid $424.3 million in cash and $175 million in junior con- vertible preferred stock. The total purchase price of Marshalls, including acquisition costs, was $606 million. The acquisition has been accounted for using the purchase method of accounting and accordingly, the purchase price has been allocated to the assets purchased and the liabilities assumed based upon their fair values at the date of acquisition. The purchase accounting method allows a one year period to finalize the fair values of the net assets acquired. No further adjustments to fair market values are made after that point. The final allocation of purchase price resulted in the fair value of the net assets acquired exceeding the purchase price, creating negative goodwill of $86.4 million. The negative goodwill was allocated to the long-term assets acquired. During fiscal 1998, the store closing and restructuring reserve established in the final allocation of the purchase price was reduced by an additional $15.8 million as the Company closed fewer stores than initially planned. The $15.8 million reserve reduction was offset by a reduction of $10.0 million to property, plant and equipment and a reduction of $5.8 million to tradename. The final allocation of purchase price as adjusted for the reserve adjustment in fiscal 1998 is summarized below: In Thousands Current assets $ 718,627 Property, plant and equipment 227,071 Tradename 130,046 Current liabilities (469,744) Total purchase price $ 606,000 The operating results of Marshalls have been included in the consolidated results of the Company from the date of acquisition on November 17, 1995. The following unaudited pro forma consolidated financial results for the fiscal year ended January 1996, are presented as if the acquisition had taken place at the beginning of the period: 23
  • 9. Dollars in Thousands Except Per Share Amounts Fiscal Year Ended January 2 7, 1996 Net sales $ 6,085,509 Income from continuing operations $ 20,838 Average shares outstanding for diluted earnings per share calculations 147,557,961 Income from continuing operations per share, diluted $ .02 The foregoing unaudited pro forma consolidated financial results give effect to, among other pro forma adjustments, the following: (i) Interest expense and amortization of the related debt expenses on debt incurred to finance the acquisition. (ii) Depreciation and amortization adjustments related to fair market value of assets acquired. ( i i i )A m o rtization of tradename over 40 years. (iv) Adjustments to income tax expense related to the above. (v) Impact of preferred stock issued on earnings per share calculations. The foregoing unaudited pro forma consolidated financial information is provided for illustrative pur- poses only and does not purport to be indicative of results that actually would have been achieved had the acquisition taken place on the first day of the period presented or of future results. B. L on g- Te r m De b t a nd C r e di t L i n es At January 31, 1998 and January 25, 1997, long-term debt, exclusive of current installments, consisted of the following: J a n u a ry 3 1, J a n u a ry 2 5, In Thousands 1998 1997 Real estate mortgages, interest at 10.48% maturing November 1, 1998 $ – $ 22,391 Equipment notes, interest at 11% to 11.25% maturing December 12, 2000 to December 30, 2001 1,127 2,135 General corporate debt: Medium term notes, interest at 5.87% to 7.97%, $15 million maturing on October 21, 2003 and $5 million on September 20, 2004 20,000 20,000 65⁄8% unsecured notes, maturing June 15, 2000 100,000 100,000 7% unsecured notes, maturing June 15, 2005 (effective interest rate of 7.02% after reduction of the unamortized debt discount of $103,000 and $116,000 in fiscal 1998 and 1997, respectively) 99,897 99,884 Total general corporate debt 219,897 219,884 Long-term debt, exclusive of current installments $221,024 $244,410 The aggregate maturities of long-term debt, exclusive of current installments, at January 31, 1998 are as follows: General Corporate In Thousands Equipment Notes Debt To t a l Fiscal Year 2000 $ 697 $ – $ 697 2001 430 100,000 100,430 2002 – – – 2003 – – – Later years – 119,897 119,897 Aggregate maturities of long-term debt, exclusive of current installments $1,127 $219,897 $221,024 Real estate mortgages are collateralized by land and buildings. While the parent company is not directly obligated with respect to the real estate mortgages, it or a wholly-owned subsidiary has either guaranteed the debt or has guaranteed a lease, if applicable, which has been assigned as collateral for such debt. On September 16, 1996, pursuant to a call for redemption, the Company prepaid $88.8 million of its 1 9 ⁄2% sinking fund debentures. The Company recorded an after-tax extraordinary charge of $2.9 million, or $.02 per common share, related to the early retirement of this debt. The Company paid the outstanding balance of $8.5 million during fiscal 1998 utilizing an optional sinking fund payment under the indenture. In June 1995, the Company filed a shelf registration statement with the Securities and Exchange Commission which provided for the issuance of up to $250 million of long-term debt. This shelf registration 24
  • 10. statement was replaced by a new shelf registration statement filed in fiscal 1997 which currently provides for the issuance of up to $600 million of debt, common stock or preferred stock. In June 1995, the Company issued $200 million of long-term notes under the original registration statement; $100 million of 65⁄8% notes due June 15, 2000 and $100 million of 7% notes due June 15, 2005. The proceeds were used in part to repay short-term borrowings and for general corporate purposes, including the repayment of scheduled maturities of other outstanding long-term debt and for new store and other capital expenditures. On November 17, 1995, the Company entered into an unsecured $875 million bank credit agreement under which the Company borrowed $375 million on a term loan basis to fund the cash portion of the Marshalls purchase price. During the fourth quarter of the fiscal year ended January 25, 1997, the Company prepaid the outstanding balance of the $375 million term loan and recorded an after-tax extra- ordinary charge of $2.7 million, or $.02 per share, for the early retirement of this debt. The agreement also allowed the Company to borrow up to an additional $500 million on a revolving loan basis to fund the working capital needs of the Company. In September 1997, the Company replaced this $500 million revolv- ing credit agreement with a new five year $500 million revolving credit facility. The Company recorded an extraordinary charge of $1.8 million associated with the write-off of deferred financing costs of the for- mer agreement. The new agreement provides for reduced commitment fees on the unused portion of the line, as well as lower borrowing costs and has certain financial covenants which include a minimum net worth requirement, and certain leverage and fixed charge covenants. As of January 31, 1998, all $500 million of the revolving credit facility was available for use. Interest is payable on borrowings at rates equal to or less than prime. The revolving credit facility capability is used as backup to the Company’s commercial paper program. The Company had no short-term borrowings under this facility or its commercial paper program during fiscal 1998. Excluding the Company’s foreign subsidiaries, the weighted average interest rate on the Company’s short-term borrowings under the for- mer agreement was 5.81% and 6.25% in fiscal 1997 and 1996, respectively. The Company does not have any compensating balance requirements under these arrangements. The Company also has C$30 million of committed lines for its Canadian operation, all of which were available as of January 31, 1998. In connection with the $875 million bank credit agreement, during fiscal 1996 the Company prepaid its $45 million real estate mortgage on the Chadwick’s fulfillment center and incurred an extraordinary after- tax charge of $3.3 million in fiscal 1996 on the early retirement of this debt. C. Financial Instruments The Company periodically enters into forward foreign exchange contracts to hedge firm U.S. dollar mer- chandise purchase commitments made by its Canadian subsidiary. As of January 31, 1998, the Company had $20.2 million of such contracts outstanding. The contracts cover commitments for the first quarter of fiscal 1999 and any gain or loss on the contract will ultimately be reflected in the cost of the merchandise. Deferred gains and losses on the contracts as of January 31, 1998 were immaterial. The Company also has entered into several foreign currency swap and forward contracts in both Canadian dollars and British pounds sterling. Both the swap and forward agreements are accounted for as a hedge against the Company’s investment in foreign subsidiaries; thus, foreign exchange gains and losses on the agreements are recognized in shareholders’ equity thereby offsetting translation adjust- ments associated with the Company’s investment in foreign operations. The gains or losses on this hedging activity as of January 31, 1998 are immaterial. The Canadian swap and forward agreements will require the Company to pay C$41.7 million in exchange for $31.2 million in U.S. currency between October 2003 and September 2004. The British pounds sterling swap and forward agreements will require the Company to pay £59.9 million between October 1999 and September 2002 in exchange for $94.1 million in U.S. currency. The agreements contain rights of offset which minimize the Company’s exposure to credit loss in the event of nonperformance by one of the counterparties. The interest rates payable on the foreign currency swap agreements are slightly higher than the interest rates receivable on the currency exchanged, result- ing in deferred interest costs which are being amortized to interest expense over the term of the related agreements. The premium cost or discount associated with the forward contracts is being amortized over the term of the related agreements and is included with the gain or loss of the hedging instrument. The unamortized balance of the net deferred costs was $4.3 million and $4.1 million as of January 31, 1998 and January 25, 1997, respectively. The counterparties to the exchange contracts and swap agreements are major international financial institutions. The Company periodically monitors its position and the credit ratings of the counterparties and does not anticipate losses resulting from the nonperformance of these institutions. 25
  • 11. The fair value of the Company’s long-term debt, including current installments, is estimated using dis- counted cash flow analysis based upon the Company’s current incremental borrowing rates for similar types of borrowing arrangements. The fair value of long-term debt, including current installments, at January 31, 1998 is estimated to be $253 million compared to a carrying value of $244.4 million. These esti- mates do not necessarily reflect certain provisions or restrictions in the various debt agreements which might affect the Company’s ability to settle these obligations. D. Commitments The Company is committed under long-term leases related to its continuing operations for the rental of real estate, and fixtures and equipment. T.J. Maxx leases are generally for a ten year initial term with options to extend for one or more five year periods. Marshalls leases, acquired in fiscal 1996, have remaining terms ranging up to twenty-five years. In addition, the Company is generally required to pay insurance, real estate taxes and other operating expenses including, in some cases, rentals based on a percentage of sales. Following is a schedule of future minimum lease payments for continuing operations as of January 31, 1998: Operating In Thousands Leases Fiscal Year 1999 $ 302,177 2000 288,603 2001 260,753 2002 233,513 2003 210,983 Later years 1,006,059 Total future minimum lease payments $2,302,088 The rental expense under operating leases for continuing operations amounted to $301.9 million, $293.5 million and $162.5 million for fiscal years 1998, 1997 and 1996, respectively. The present value of the Company’s operating lease obligations approximates $1,547.2 million as of January 31, 1998, including $180.0 million payable in fiscal 1999. The Company had outstanding letters of credit in the amount of $55.9 million as of January 31, 1998. Letters of credit are issued by the Company primarily for the purchase of inventory. E. Stock Compensation Plans In the following note, all references to historical awards, outstanding awards and availability of shares for future grants under the Company’s Stock Incentive Plan and related prices per share have been restated, for comparability purposes, for the two-for-one stock split distributed in June 1997. The Company has a Stock Incentive Plan under which options and other stock awards may be granted to certain officers and key employees. The Stock Incentive Plan, as amended, provides for the issuance of up to 21 million shares with 8.7 million shares available for future grants as of January 31, 1998. The Company also has a Directors Stock Option Plan under which stock options are granted to directors who are not otherwise employed by the Company. This plan provides for the issuance of up to 100,000 shares. There are 61,000 shares available for future grants under this plan as of January 31, 1998. Under its stock option plans, the Company has granted options for the purchase of common stock, gen- erally within ten years from the grant date at option prices of 100% of market price on the grant date. Most options outstanding are exercisable at various percentages starting one year after the grant, while certain options are exercisable in their entirety three years after the grant date. Options granted to directors become fully exercisable one year after the date of grant. A summary of the status of the Company’s stock options and related Weighted Average Exercise Prices (“WAEP”), adjusted for the two-for-one stock split, for fiscal years ended January 1998, 1997 and 1996 is presented below (shares in thousands): Fiscal Year Ended January 1998 1997 1996 S h a re s WA E P S h a re s WA E P S h a re s WA E P Outstanding, beginning of year 4,096 $12.20 5,624 $ 9.18 5,389 $ 9.97 Granted 2,169 25.93 1,426 17.44 1,193 6.44 Exercised (878) 10.61 (2,724) 8.89 (164) 7.04 Canceled (134) 14.61 (230) 9.90 (794) 10.63 Outstanding, end of year 5,253 $18.07 4,096 $12.20 5,624 $ 9.18 Options exercisable, end of year 1,966 1,706 3,496 26
  • 12. The Company realizes an income tax benefit from the exercise or early disposition of certain stock options. This benefit results in a decrease in current income taxes payable and an increase in additional paid-in capital. Such benefits amounted to $6.1 million and $10.2 million for the fiscal years ended January 31, 1998 and January 25, 1997, respectively. Amounts for fiscal 1996 were immaterial. The Company has adopted the disclosure-only provisions of Statement of Financial Accounting Standards (SFAS) No. 123 “Accounting for Stock-Based Compensation,” and continues to apply the provi- sions of APB Opinion No. 25 “Accounting for Stock Issued to Employees” in accounting for compensation expense under its stock option plans. The Company grants options at fair market value on the date of the grant; accordingly, no compensation expense has been recognized for the stock options issued during fiscal years 1998, 1997 or 1996. Had compensation expense been determined in accordance with SFAS No. 123, the Company’s income from continuing operations, net income and related earnings per share amounts for the fiscal years ended January 31, 1998 and January 25, 1997 would have been reduced to the unaudited pro forma amounts indicated below: Fiscal Year Ended As Report e d Unaudited Pro Form a J a n u a ry 31, J a n u a ry 25, J a n u a ry 3 1, J a n u a ry 2 5, Dollars in Thousands Except Per Share Amounts 1998 1997 1998 1997 (53 weeks) (53 weeks) Income from continuing operations $306,592 $301,129 $213,826 $211,893 Diluted earnings per share $ 1.75 $ 1.72 $ 1.22 $ 1.21 Net income $304,815 $299,352 $363,123 $361,190 Diluted earnings per share $ 1.74 $ 1.71 $ 2.07 $ 2.06 For purposes of applying the provisions of SFAS No. 123 for the pro forma calculations, the fair value of each option grant issued during fiscal 1998 and 1997 is estimated on the date of grant using the Black- Scholes option pricing model with the following assumptions: dividend yield 1% and expected volatility of 38% in both fiscal 1998 and 1997, a risk-free interest rate of 5.8% in fiscal 1998 and 6.67% in fiscal 1997 and expected holding periods of 6 years in both fiscal periods. The weighted average fair value of options granted during fiscal 1998 and 1997 was $11.05 and $7.75 per share, respectively. The effects of applying SFAS No. 123 in this pro forma disclosure are not indicative of future amounts. SFAS No. 123 does not apply to awards prior to 1995, and additional awards in future years are anticipated. The following table summarizes information about stock options outstanding as of January 31, 1998 (shares in thousands): Options Outstanding Options Exerc i s a b l e We i g h t e d We i g h t e d We i g h t e d Range of Av e r a g e Av e r a g e Av e r a g e E x e rc i s e Remaining E x e rc i s e E x e rc i s e Prices S h a re s Contract Life Price S h a re s Price $ 5.1250 – $ 7.6875 727 7.2 Years $ 6.36 398 $ 6.31 $ 7.6876 – $12.1875 772 5.8 Years 10.87 772 10.87 $12.1876 – $17.4375 1,591 7.7 Years 16.25 729 14.85 $17.4376 – $21.5000 700 9.2 Years 21.38 67 21.38 $21.5001 – $28.9375 1,463 9.5 Years 28.09 – – Total 5,253 8.0 Years $18.07 1,966 $11.78 During fiscal 1998, a special deferred compensation award was granted to the Company’s Chief Executive Officer initially denominated in 450,000 shares of the Company’s stock with a fair value of $21.375 per share at the date of grant. The shares vested at the time of the grant and the Company recorded a deferred compensation charge of $9.6 million at the time of the grant. The executive may elect to have such grant converted into other investments. The Company does not anticipate that the shares will be issued and therefore does not consider them for diluted earnings per share calculations and adjusts the compensation charge for changes in the market value of the stock. The Company recorded an additional expense of $5.6 million in fiscal 1998 due to the increase in market value of the shares from date of grant. The Company has also issued restricted stock and performance based stock awards under the Stock Incentive Plan. Restricted stock awards are issued at par value, or at no cost, and have restrictions which gen- erally lapse over three to five years from date of grant. As of January 31, 1998, the performance based stock awards have either vested or been forfeited. The market value in excess of cost is charged to income ratably over the period during which these awards vest, such pre-tax charges amounted to $2.7 million in fiscal 1998, $2.5 million in fiscal 1997 and $0.4 million in fiscal 1996. The market value of the awards is determined at date of grant for restricted stock awards, and at the date shares are earned for performance based awards. 27
  • 13. There has been a combined total of 511,917 shares, 35,000 shares and 20,000 shares for deferred, restricted and performance based awards issued for the fiscal years ended January 1998, 1997 and 1996, respectively. There were 150,000 and 7,000 shares forfeited for the fiscal years ended January 1998 and January 1996, respectively (no shares were forfeited for the fiscal year ended January 1997). The weighted average market value per share of these stock awards at grant date was $21.79, $12.00 and $6.44 for fiscal 1998, 1997 and 1996, respectively. During fiscal 1998, the Company formed a deferred stock compensation plan for its outside directors which replaced the Company’s retirement plan for directors. Deferred shares were issued equal to the cur- rent obligation under the retirement plan as of December 31, 1997. Additional share awards valued at $10,000 will be issued annually to each eligible director. Currently there are 8,771 deferred shares out- standing, actual shares will be issued at retirement. The Company has 50,000 shares held in treasury from which the Company will issue such shares. F. C a p i t a l S t o c k a n d E a r n i n g s P e r S h a r e C a p i t a l S t o c k : The Company distributed a two-for-one stock split, effected in the form of a 100% stock dividend, on June 26, 1997 to shareholders of record on June 11, 1997, which resulted in the issuance of 79.8 million shares of common stock and a corresponding decrease of $79.8 million in additional paid-in capital. All historical earnings per share amounts have been restated to reflect the two-for-one stock split. Reference to common stock activity before the distribution of the split has not been restat- ed unless otherwise noted. All activity after the distribution date reflects the two-for-one stock split. In April 1992, the Company issued 250,000 shares of Series A cumulative convertible preferred stock in a private offering. As of June 1996, pursuant to a call for redemption, the Series A preferred stock was converted into 1,190,475 shares of common stock. In August 1992, the Company issued 1,650,000 shares of Series C cumulative convertible preferred stock in a public offering. As of September 1996, pursuant to a call for redemption, the Series C preferred stock was converted into 3,177,844 shares of common stock. On November 17, 1995, the Company issued its Series D and Series E convertible preferred stock as part of the purchase price for Marshalls. The 250,000 shares of Series D preferred stock, with a face value of $25 million, carried an annual dividend rate of $1.81 per share and was automatically converted into 1,349,527 shares of common stock on November 17, 1996. The shares of Series E preferred stock, with 1,500,000 shares initially issued at a face value of $150 million, carry an annual dividend rate of $7.00 per share and is mandatorily converted into common shares on November 17, 1998 unless converted earlier. Through January 31, 1998, shareholders con- verted 770,200 shares of Series E preferred stock into 8.3 million shares of common stock and 2,500 shares were repurchased by the Company. The Company paid $3.8 million to induce conversion of the preferred shares. The common shares issuable on conversion of the outstanding Series E preferred stock will vary depending on the market price of common stock at the time of conversion and ranges from a minimum of 7.9 million shares to a maximum of 9.4 million shares of common stock. Based on the mar- ket price of the common stock as of January 31, 1998, the minimum number of shares would be issued. The 727,300 shares of the Company’s outstanding Series E preferred stock at January 31, 1998 has an aggregate liquidation preference of $72.7 million. There is an aggregate of 9,422,513 common shares reserved for the conversion of Series E preferred stock, the maximum number of shares that may be issued. The Series E preferred stock is senior to the common stock of the Company with respect to pay- ment of dividends and upon liquidation. There are no voting rights for preferred stock unless dividends are in arrears for a specified number of periods. Dividends on the outstanding Series E preferred stock are paid quarterly on the first business day of each calendar quarter, the Company accrues dividends evenly throughout the year. In addition, the induce- ment fees paid on the conversion of the Series E preferred stock during fiscal 1998 have been classified as preferred dividends. The Company recorded aggregate dividends on its preferred stock of $11.7 million in fiscal 1998, $13.7 million in fiscal 1997 and $9.4 million in fiscal 1996. The preferred dividends reduce net income in computing net income available to common shareholders. During fiscal 1997, the Company replaced the June 1995 shelf registration statement with another shelf registration statement which currently provides for the issuance of up to $600 million of debt, com- mon stock or preferred stock. 28
  • 14. On June 25, 1997, the Company authorized the repurchase of up to $250 million of the Company’s common shares and common equivalent shares. During fiscal 1998, the Company repurchased 8.5 million shares of its stock, totaling $245.2 million, representing approximately 5% of the Company’s outstanding common shares. In February 1998, the Company completed this buy back program with a total of 8.7 mil- lion shares having been repurchased. At the same time, the Company announced its intent to repurchase an additional $250 million of the Company’s common stock. E a r n i n g s P e r S h a r e : The Company calculates earnings per share in accordance with SFAS No. 128 which requires the presentation of basic and diluted earnings per share. The following schedule presents the calculation of basic and diluted earnings per share for income from continuing operations: Fiscal Year Ended J a n u a ry 31, J a n u a ry 25, J a n u a ry 27, 1998 1997 1996 (53 weeks) Basic ea rni ngs per shar e: Income from continuing operations before extraordinary item $306,592 $213,826 $51,589 Less: preferred stock dividends 11,668 13,741 9,407 Income from continuing operations available to common shareholders $294,924 $200,085 $42,182 Weighted average common stock outstanding for basic earnings per share 160,737,023 150,463,452 144,830,352 Basic earnings per share $1.83 $1.33 $.29 Dil uted earni ngs per shar e: Income from continuing operations available to common shareholders $294,924 $200,085 $42,182 Add back: preferred stock dividends 11,668 13,741 93 Income from continuing operations for diluted earnings per share calculation $306,592 $213,826 $42,275 Weighted average common stock outstanding for basic earnings per share 160,737,023 150,463,452 144,830,352 Assumed conversion of: Convertible preferred stock 12,016,086 23,165,792 532,314 Stock options 2,052,983 1,695,806 28,284 Weighted average common shares for diluted earnings per share calculation 174,806,092 175,325,050 145,390,950 Diluted earnings per share $1.75 $1.22 $.29 G . I nc o me Ta x e s The provision for income taxes includes the following: Fiscal Year Ended J a n u a ry 31, J a n u a ry 25, J a n u a ry 27, In Thousands 1998 1997 1996 (53 weeks) Current: Federal $172,026 $116,848 $ 52,306 State 39,200 27,160 12,604 Foreign 8,117 8,079 2,843 Deferred: Federal (3,432) 33 (25,593) State (326) 462 (5,361) Foreign 94 (268) 408 Provision for income taxes $215,679 $152,314 $ 37,207 29
  • 15. The Company had a net deferred tax liability as follows: J a n u a ry 31, J a n u a ry 25, In Thousands 1998 1997 Deferred tax assets: Capital loss carryforward $ – $ 4,500 Foreign net operating loss carryforward 34,554 34,500 Reserve for discontinued operations 6,723 9,397 Reserve for closed stores and restructuring costs 23,571 38,421 Insurance costs not currently deductible for tax purposes 15,049 24,342 Pension, postretirement and employee benefits 34,173 23,267 Leases 9,350 6,478 Other 18,789 17,981 Valuation allowance (34,603) (39,084) Total deferred tax assets $107,606 $119,802 Deferred tax liabilities: Property, plant and equipment $ 14,736 $ 20,096 Safe harbor leases 37,945 44,603 Tradename 48,659 52,302 Other 13,125 10,121 Total deferred tax liabilities $114,465 $127,122 Net deferred tax liability $ 6,859 $ 7,320 The Company had a capital loss carry f o rward of $139 million as of January 27, 1996 which was fully utilized to offset the capital gain recognized on the sale of Chadwick’s. The Company does not provide for U.S. deferred income taxes on the undistributed earnings of its for- eign subsidiaries as the earnings are considered to be permanently reinvested. The undistributed earnings of its foreign subsidiaries as of January 31, 1998 were immaterial. The Company has a United Kingdom net operating loss carryforward of approximately $50 million for tax and financial reporting purposes. The United Kingdom net operating loss does not expire under current United Kingdom tax law. The Company also has a Puerto Rico net operating loss carryforward of approxi- mately $49 million at January 31, 1998, for tax and financial reporting purposes, which was acquired in the Marshalls acquisition and expires in fiscal 1999 through fiscal 2003. Future utilization of these operating loss carryforwards is dependent upon future earnings of the Company’s foreign subsidiaries. The Company’s worldwide effective tax rate was 41% for the fiscal year ended January 31, 1998, and 42% for fiscal years ended January 25, 1997 and January 27, 1996. The difference between the U.S. federal statutory income tax rate and the Company’s worldwide effective income tax rate is summarized as follows: Fiscal Year Ended J a n u a ry 31, J a n u a ry 25, J a n u a ry 27, 1998 1997 1996 U.S. federal statutory income tax rate 35% 35% 35% Effective state income tax rate 5 5 5 Impact of foreign operations – 1 3 All other 1 1 (1) Worldwide effective income tax rate 41% 42% 42% H. Pension Plans and Other Retirement Benefits The Company has a non-contributory defined benefit retirement plan covering the majority of full-time U.S. employees. Effective in fiscal 1998, Marshalls associates are included in the plan with credit for ser- vice prior to the acquisition. Employees who have attained twenty-one years of age and have completed one year of service are covered under the plan. Benefits are based on compensation earned in each year of service. The Company also has an unfunded supplemental retirement plan which covers certain key employees of the Company and provides additional retirement benefits based on average compensation. 30
  • 16. Net periodic pension cost (including discontinued operations) of the Company’s defined benefit and sup- plemental retirement plans includes the following components: Fiscal Year Ended J a n u a ry 31, J a n u a ry 25, J a n u a ry 27, 1998 1997 1996 (53 weeks) Service cost $ 8,372 $ 4,699 $ 3,920 Interest cost on projected benefit obligation 8,398 7,266 6,915 Actual return on assets (22,278) (16,981) (15,215) Net amortization and deferrals 15,459 10,879 9,384 Net periodic pension cost $ 9,951 $ 5,863 $ 5,004 Net pension cost includes $0.4 million and $0.5 million allocated to discontinued operations in fiscal years 1997 and 1996, respectively. The increase in pension cost for fiscal 1998 is primarily due to the inclusion of Marshalls associates. The following table sets forth the funded status of the Company’s pension, defined benefit and supple- mental retirement plans (including discontinued operations) and the amounts recognized in the Company’s statements of financial position: J a n u a ry 3 1, J a n u a ry 2 5, In Thousands 1998 1997 Accumulated benefit obligation, including vested benefits of $111,116 and $89,533 in fiscal 1998 and 1997, respectively $115,250 $ 93,383 Projected benefit obligation $127,148 $100,465 Plan assets at fair market value 110,234 89,704 Projected benefit obligation in excess of plan assets 16,914 10,761 Unrecognized net gain from past experience, different from that assumed and effects of changes in assumptions 5,243 5,929 Prior service cost not yet recognized in net periodic pension cost (861) (950) Unrecognized prior service cost (596) (670) Accrued pension cost included in accrued expenses $ 20,700 $ 15,070 The projected benefit obligation in excess of plan assets as of January 31, 1998, is due to the Company’s unfunded supplemental retirement plan. The weighted average discount rate used in determining the actuarial present value of the projected benefit obligation was 7.0% and 7.5% for fiscal years 1998 and 1997, respectively. The rate of increase on future compensation levels was 4.0% in each of the fiscal years 1998 and 1997, and the expected long-term rate of return on assets was 9.0% in each of the fiscal years 1998 and 1997. The Company’s funding pol- icy is to contribute annually an amount allowable for federal income tax purposes. Pension plan assets consist primarily of fixed income and equity securities. The Company’s postretirement benefit plan is unfunded and provides limited postretirement medical and life insurance benefits to associates who participate in the Company’s retirement plan and who retire at age fifty-five or older with ten or more years of service. Net periodic postretirement benefit cost of the Company’s plan includes the following components: Fiscal Year Ended J a n u a ry 31, J a n u a ry 25, J a n u a ry 27, 1998 1997 1996 (53 weeks) Service cost $1,366 $ 671 $ 757 Interest cost on accumulated benefit obligation 1,649 1,081 1,046 Net amortization 749 55 – Net periodic postretirement benefit cost $3,764 $1,807 $1,803 Net periodic postretirement benefit costs include $0.1 million in fiscal year 1997 and $0.3 million in fiscal year 1996 allocated to discontinued operations. The increase in cost for fiscal 1998 is primarily due to the inclusion of Marshalls associates. The components of the accumulated postretirement benefit obligation (including discontinued operations) and the amount recognized in the Company’s statements of financial position are as follows: 31
  • 17. J a n u a ry 3 1, J a n u a ry 2 5, In Thousands 1998 1997 Accumulated postretirement obligation: Retired associates $ 8,882 $ 7,147 Fully eligible active associates 4,459 4,653 Other active associates 7,832 3,501 Accumulated postretirement obligation 21,173 15,301 Unrecognized net (loss) due to change in assumptions (4,341) (1,375) Accrued postretirement benefits included in accrued expenses $16,832 $13,926 Assumptions used in determining the actuarial present value of the accumulated postretirement obliga- tion include a discount rate of 7.0% and 7.5% in fiscal years 1998 and 1997, respectively. Due to the nature of the plan, which limits the annual benefit to $3,000, the medical inflation assumption, initially set at 4.5% in fiscal 1998 and 5% in fiscal 1997, is gradually reduced to zero. An increase of 1% in the medical inflation assumption would increase the postretirement benefit obligation as of January 31, 1998 by approximately $1.7 million. Effective January 1, 1997, Marshalls associates were eligible for the Company’s postretirement medical plan. The Company also sponsors an employee savings plan under Section 401(k) of the Internal Revenue Code for all eligible U.S. employees, including Marshalls associates effective January 1, 1997. Employees may contribute up to 15% of eligible pay. The Company matches employee contributions up to 5% of eligi- ble pay at rates ranging from 25% to 50% based upon Company performance. The Company contributed for all 401(k) plans $5.7 million in fiscal 1998, $6.4 million in fiscal 1997 and $2.2 million in fiscal 1996. Prior to January 1, 1997, Marshalls associates participated in a separate Section 401(k) savings plan con- sistent with the plan Marshalls associates participated in prior to acquisition. I. Accru ed Expenses and Other Current Liabil it ies The major components of accrued expenses and other current liabilities are as follows: J a n u a ry 31, J a n u a ry 25, In Thousands 1998 1997 Employee compensation and benefits $142,945 $113,855 Reserve for discontinued operations 17,843 23,650 Store closing and restructuring reserve, continuing operations 57,966 95,867 Insurance 58,070 67,403 Rent, utilities, advertising and other 334,682 320,436 Accrued expenses and other current liabilities $611,506 $621,211 The Company’s reserve for discontinued operations relates to obligations the Company retained or incurred in connection with the sale of its former Zayre, Hit or Miss and Chadwick’s operations. During fiscal 1997, the reserve decreased by $1.6 million. The Company added $10.7 million to the reserve, relating to antic- ipated costs associated with the sale of Chadwick’s, which was offset by reductions to the reserve of $12.3 million, primarily relating to lease obligations. During fiscal 1998, the reduction to the reserve of $5.8 million is primarily for settlement costs associated with Chadwick’s and for lease related costs associated with the former Zayre and Hit or Miss properties. The combined remaining reserve balance of $17.8 million as of January 31, 1998 is expected to be used for lease related obligations, primarily for former Zayre stores, which is expected to be paid out over the next ten to fifteen years, as leases are settled or terminated. The reserve for store closings and restructurings is primarily for costs associated with the disposition and settlement of leases for the T.J. Maxx and Marshalls closings anticipated as a result of the Marshalls acquisition.The initial reserves established in fiscal 1996 were estimated at $244.1 million for a Marshalls store closing and restructuring plan and $35 million for the closing of certain T.J. Maxx stores. The Marshalls reserve included $44.1 million for inventory markdowns. The primary reduction to the reserve in fiscal 1996 was for inventory markdowns. During fiscal 1997 and 1998, the Marshalls reserve was reduced by $85.9 million and $15.8 million, respectively, to reflect a reduction in the number of store closings and a lower cost to settle and dispose of lease obligations. These reserve reductions resulted in adjustments to the allocation of the Marshalls purchase price as discussed in Note A to the consolidated financial statements. The adjusted reserve balance included $70.8 million for lease related obligations for planned store and other facility closings, $9.6 million for property write-offs, $44.1 million for inventory 32
  • 18. markdowns and $17.9 million for severance, professional fees and all other costs associated with the restructuring plan. The only non-cash charge portion of the reserve was for property write-offs. The Company also established a reserve for the closing of certain T.J. Maxx stores. The Company recorded an initial charge to income from continuing operations of $35 million in fiscal 1996 and a credit to income from continuing operations of $8 million in fiscal 1997 to reflect a lower than anticipated cost of the T.J. Maxx closings. The adjusted reserve balance includes $15.6 million for lease related obligations of the closed stores, non-cash charges of $9.8 million for property write-offs and $2.3 million for severance, professional fees and all other costs associated with the closings. The following is a summary of the activity in the store closing and restructuring reserve for the last two fiscal years: Fiscal Year Ended J a n u a ry 31, J a n u a ry 25, In Thousands 1998 1997 Balance, beginning of the year $ 95,867 $251,566 Reserve adjustments: Adjust Marshalls restructuring reserve (15,843) (85,900) Adjust T.J. Maxx store closing reserve 700 (8,000) Charges against the reserve: Lease related obligations (13,593) (21,277) Inventory markdowns – (15,886) Severance and all other cash charges (1,876) (13,901) Net activity relating to HomeGoods closings (1,887) 329 Non-cash property write-offs (5,402) (11,064) Balance, end of year $ 57,966 $ 95,867 All the Marshalls and T.J. Maxx properties for which reserves were provided have been closed. The remain- ing reserve balance as of January 31, 1998 of $58 million is almost entirely for the estimated cost of future obligations of the closed store and other facility leases. It includes estimates and assumptions as to how the leases will be disposed of and could change; however, the Company believes it has adequate reserves to deal with these obligations. The use of the reserve will reduce operating cash flows in varying amounts over the next ten to fifteen years as the related leases expire or are settled. J. Supplemental Cash Flows Information The Company classifies the cash flows associated with the operating results of its discontinued operations through the date of sale, as “net cash provided by (used in) discontinued operations.” The following is a reconciliation of the “income from discontinued operations, net of income taxes” to the “net cash provided by (used in) discontinued operations.” Fiscal Year Ended J a n u a ry 31, J a n u a ry 25, J a n u a ry 27, 1998 1997 1996 (53 weeks) Income from discontinued operations, net of income taxes $ – $ 29,361 $ 9,710 (Increase) decrease in net assets of discontinued operations during the period: Net assets of discontinued operations – beginning of period 54,451 128,586 93,397 Less: Net assets of discontinued operations – sold during period – 54,083 44,789 Net assets of discontinued operations – end of period – 54,451 128,586 (Increase) decrease in net assets of discontinued operations 54,451 20,052 (79,978) Net cash provided by (used in) discontinued operations $54,451 $ 49,413 $ (70,268) The Company is also responsible for certain leases related to, and other obligations arising from, the sale of these operations, for which reserves have been provided in its reserve for discontinued operations, and is included in accrued expenses. The cash flow impact of these obligations is reflected as a component of cash provided by operating activities in the statements of cash flows. 33
  • 19. The Company’s cash payments for interest expense and income taxes, including discontinued opera- tions, and its non-cash investing and financing activities are as follows: Fiscal Year Ended J a n u a ry 31, J a n u a ry 25, J a n u a ry 27, In Thousands 1998 1997 1996 (53 weeks) Cash paid for: Interest $ 26,359 $ 44,288 $ 41,924 Income taxes 199,025 159,245 17,275 Non-cash investing and financing activities: Conversion of cumulative convertible preferred stock into common stock Series A $ – $ 25,000 $ – Series C – 82,500 – Series D – 25,000 – Series E 77,020 – – Distribution of two-for-one stock split 79,823 – – Note receivable from sale of Chadwick’s of Boston – 20,000 – Issuance of preferred stock for acquisition of Marshalls – – 175,000 Note receivable from sale of Hit or Miss – – 10,000 K. Discontinued Operations and Related Contingent Liabilities In October 1988, the Company completed the sale of its former Zayre Stores division to Ames Department Stores, Inc. (“Ames”). In April 1990, Ames filed for protection under Chapter 11 of the Federal Bankruptcy Code and in December 1992, Ames emerged from bankruptcy under a plan of reorganization. The Company remains contingently liable for the leases of most of the former Zayre stores still oper- ated by Ames. In addition, the Company is contingently liable on a number of leases of the Hit or Miss division, the Company’s former off-price women’s specialty stores, sold on September 30, 1995. The Company believes that the Company’s contingent liability on these leases will not have a material effect on the Company’s financial condition. The Company is also contingently liable on certain leases of its former warehouse club operations (BJ’s Wholesale Club and HomeBase), which was spun off by the Company in fiscal 1990 as Waban Inc. During fiscal 1998, Waban Inc. was renamed HomeBase, Inc. and spun-off from its BJ’s Wholesale Club division (BJ’s Wholesale Club, Inc.). HomeBase, Inc., and BJ’s Wholesale Club, Inc. are primarily liable on their respective leases and have indemnified the Company for any amounts the Company may have to pay with respect to such leases. In addition HomeBase, Inc., BJ’s Wholesale Club, Inc. and the Company have entered into agreements under which BJ’s Wholesale Club, Inc. has substantial indemnification responsi- bility with respect to such HomeBase, Inc. leases. The Company is also contingently liable on certain leases of BJ’s Wholesale Club, Inc. for which both BJ’s Wholesale Club, Inc. and HomeBase, Inc. remain liable. The Company believes that its contingent liability on the HomeBase, Inc. and BJ’s Wholesale Club, Inc. leases will not have a material effect on the Company’s financial condition. L. Segment Information For data on business segments for fiscal 1998, 1997 and 1996, see page 20. 34