1. 2005 Financial Highlights
Years Ended December 31
(Unaudited) (Based on U.S. generally accepted accounting principles)
(in millions of U.S. dollars,
2005
Results of Operations 2004 % Change
except key performance indicators)
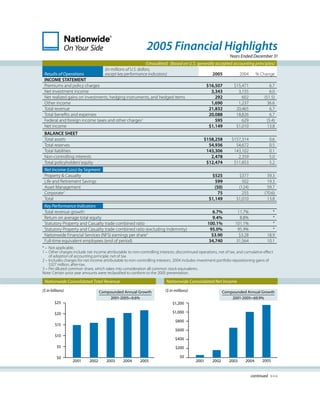
INCOME STATEMENT
$16,507
Premiums and policy charges $15,471 6.7
3,343
Net investment income 3,155 6.0
292
Net realized gains on investments, hedging instruments, and hedged items 602 (51.5)
1,690
Other income 1,237 36.6
21,832
Total revenue 20,465 6.7
20,088
Total bene ts and expenses 18,826 6.7
595
Federal and foreign income taxes and other charges1 629 (5.4)
$1,149
Net income $1,010 13.8
BALANCE SHEET
$158,258
Total assets $157,314 0.6
54,936
Total reserves 54,672 0.5
143,306
Total liabilities 143,102 0.1
2,478
Non-controlling interests 2,359 5.0
$12,474
Total policyholders’ equity $11,853 5.2
Net Income (Loss) by Segment
$525
Property & Casualty $377 39.3
599
Life and Retirement Savings 502 19.3
(50)
Asset Management (124) 59.7
75
Corporate2 255 (70.6)
$1,149
Total $1,010 13.8
Key Performance Indicators
6.7%
Total revenue growth 11.7% *
9.4%
Return on average total equity 8.8% *
100.1%
Statutory Property and Casualty trade combined ratio 101.1% *
95.0%
Statutory Property and Casualty trade combined ratio (excluding Indemnity) 95.9% *
$3.90
Nationwide Financial Services (NFS) earnings per share3 $3.28 18.9
34,740
Full-time equivalent employees (end of period) 31,564 10.1
* – Not applicable.
1 – Other charges include net income attributable to non-controlling interests, discontinued operations, net of tax, and cumulative e ect
of adoption of accounting principle, net of tax.
2 – Includes charges for net income attributable to non-controlling interests. 2004 includes investment portfolio repositioning gains of
$327 million, after-tax.
3 – Per diluted common share, which takes into consideration all common stock equivalents.
Note: Certain prior year amounts were reclassi ed to conform to the 2005 presentation.
Nationwide Consolidated Total Revenue Nationwide Consolidated Net Income
($ in billions) ($ in millions)
Compounded Annual Growth Compounded Annual Growth
2001-2005=9.6% 2001-2005=69.9%
$25 $1,200
$1,000
$20
$800
$15
$600
$10
$400
$5 $200
$0
$0
2005
2005
2001 2002 2003 2004 2001 2002 2003 2004
continued >>>
2. Comments on 2005 Results of Operations
Total Revenue Net Income
Total consolidated revenue for 2005 increased $1.4 billion, Total consolidated net income for 2005 rose to $1.149 billion,
or 6.7%, from 2004. Property and Casualty premium revenues which was $139 million, or nearly 14%, over 2004. The
increased 7.2% while life, accident and health insurance Property and Casualty segment pro tability increased 39%,
premiums increased 9.4% and policy charges remained which re ected strong revenue growth and better non-
relatively at year over year. Net investment income increased hurricane weather and baseline loss experience. Partially
6.0% exhibiting higher interest spread income from bond o setting these positive impacts were the net pre-tax
call premiums and increased revenue from mortgage loans hurricane-related losses of $907 million in 2005 ($590 million
re ecting portfolio growth and higher prepayment income. after tax) compared with $945 million ($614 million after tax)
Net realized gains on investments, hedging instruments, in 2004 in addition to the net pre-tax reserve strengthening of
and hedged items for 2005 declined $310 million over 2004 $725 million ($471 million after tax) in 2005 compared to $650
primarily due to lower gains on sales of available-for-sale million ($422 million after tax) in 2004 related to asbestos and
securities. Gains were higher in the prior year due to a environmental exposures. Another key driver included a 19%
signi cant portfolio repositioning. Other income rose increase in net income in Life & Retirement Savings segment,
36.6% primarily due to higher levels of fees earned for the which re ected higher revenues and tax bene ts but was
management of pension fund assets, unit trusts, investment partially o set by costs associated with the redemption of
trusts, and corporate portfolios. certain debt. Asset Management revenue growth of nearly
38% helped drive this segment’s net loss lower in 2005. The
prior year contained a number of one-time expenses totaling
$65 million ($42 million after tax).
Credit Ratings: Nationwide conducts business in all 50 states, Basis of Accounting: Nationwide prepares its combined
the District of Columbia and the Virgin Islands, Asia, Europe nancial statements in accordance with U.S. generally
and Latin America. Nationwide Mutual Insurance Company accepted accounting principles (GAAP). For analytical
and Nationwide Mutual Fire Insurance Company are rated purposes, including understanding performance trends,
“A+” (Strong) with a negative outlook by Standard & Poor’s decision-making, and peer comparison, management of
Rating Service, a division of The McGraw-Hill Companies, Inc. Nationwide makes certain adjustments to some data, resulting
(“S&P”), “Aa3” (Excellent) with a negative outlook by Moody’s in non-GAAP nancial measures. The following term de nes
Investor Service, Inc. (“Moody’s”), and “A+” (Superior) with one of those nancial measures:
a stable outlook by A.M. Best. Nationwide Life Insurance
Statutory Property and Casualty Trade Combined Ratio: A formula
Company (NLIC) (and its insurance subsidiary) and Nationwide
used by property and casualty insurance companies to relate
Life Insurance Company of America (NLICA) (and its insurance
premium income to claims, administration and dividend
subsidiary) are both rated “A+” (Superior) with a stable
expenses. It is calculated by dividing the sum of incurred
outlook by A.M. Best, and both NLIC and NLICA’s claims
losses by earned premium and underwriting expenses by
paying ability/ nancial strength are rated “Aa3” (Excellent) by
written premium. It indicates the pro tability of the insurer’s
Moody’s and “AA-” (Very Strong) with stable outlook by S&P.
operations by combining the loss ratio with expense ratio
The commercial paper issued by NLIC is rated “AMB-1” by A.M.
(including dividends if any). This is termed the statutory
Best, “P-1” by Moody’s and “A-1+” by S&P.
combined ratio and measures the amount that an insurer
The Company: Nationwide is one of the largest insurance must pay to cover claims and expenses per dollar of earned
and nancial services companies in the U.S., with more than premium. The combined ratio does not take into account
$21.8 billion in revenue and $158 billion in assets (Fortune 100- investment income.
2005). Nationwide consists of three core businesses: domestic
property and casualty insurance, life insurance and retirement
savings, and asset management. We are also engaged in
various strategic investments (mortgage loan origination and
servicing, third party claims administration, and real estate
development). Nationwide provides a full range of products
and nancial services that include auto, re, life, health and
commercial insurance; administrative services, annuities,
mutual funds and retirement plans. These products are
o ered through multiple distribution channels. The company
maintains strong relationships with premier mutual fund
managers.
Nationwide Mutual is the sole stockholder of Nationwide
Indemnity, a reinsurance company. Nationwide Indemnity
holds run-o environmental and asbestos business, which was
assumed from both a liated and una liated companies.
April 2006