Vip Call US 📞 7738631006 ✅Call Girls In Sakinaka ( Mumbai )
onoco phillips 2004First Quarter
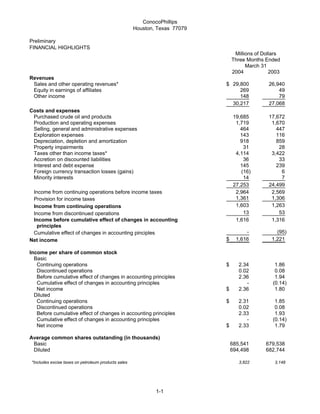
1. ConocoPhillips
Houston, Texas 77079
Preliminary
FINANCIAL HIGHLIGHTS
Millions of Dollars
Three Months Ended
March 31
2004 2003
Revenues
Sales and other operating revenues* $ 29,800 26,940
Equity in earnings of affiliates 269 49
Other income 148 79
30,217 27,068
Costs and expenses
Purchased crude oil and products 19,685 17,672
Production and operating expenses 1,719 1,670
Selling, general and administrative expenses 464 447
Exploration expenses 143 116
Depreciation, depletion and amortization 918 859
Property impairments 31 28
Taxes other than income taxes* 4,114 3,422
Accretion on discounted liabilities 36 33
Interest and debt expense 145 239
Foreign currency transaction losses (gains) (16) 6
Minority interests 14 7
27,253 24,499
Income from continuing operations before income taxes 2,964 2,569
1,361 1,306
Provision for income taxes
1,603 1,263
Income from continuing operations
13 53
Income from discontinued operations
Income before cumulative effect of changes in accounting 1,616 1,316
principles
- (95)
Cumulative effect of changes in accounting pinciples
$ 1,616 1,221
Net income
Income per share of common stock
Basic
Continuing operations $ 2.34 1.86
Discontinued operations 0.02 0.08
Before cumulative effect of changes in accounting principles 2.36 1.94
Cumulative effect of changes in accounting principles - (0.14)
Net income $ 2.36 1.80
Diluted
Continuing operations $ 2.31 1.85
Discontinued operations 0.02 0.08
Before cumulative effect of changes in accounting principles 2.33 1.93
Cumulative effect of changes in accounting principles - (0.14)
Net income $ 2.33 1.79
Average common shares outstanding (in thousands)
Basic 685,541 679,538
Diluted 694,498 682,744
*Includes excise taxes on petroleum products sales 3,822 3,148
1-1
2. ConocoPhillips
Houston, Texas 77079
Preliminary
SELECTED FINANCIAL DATA
Millions of Dollars
Three Months Ended
March 31
2004 2003
INCOME/(LOSS) FROM CONTINUING OPERATIONS
E&P
United States $ 635 678
International 622 447
Total E&P 1,257 1,125
Midstream 55 31
R&M
United States 403 275
International 61 114
Total R&M 464 389
Chemicals 39 (23)
Emerging Businesses (22) (34)
Corporate and other (190) (225)
Consolidated $ 1,603 1,263
CUMULATIVE EFFECT OF CHANGES IN ACCOUNTING PRINCIPLES
E&P
United States $ - 142
International - -
Total E&P - 142
Midstream - -
R&M
United States - (125)
International - -
Total R&M - (125)
Chemicals - -
Emerging Businesses - -
Corporate and other - (112)
Consolidated $ - (95)
INCOME FROM DISCONTINUED OPERATIONS
Corporate and other 13 53
SUMMARY OF NET INCOME/(LOSS)
E&P
United States $ 635 820
International 622 447
Total E&P 1,257 1,267
Midstream 55 31
R&M
United States 403 150
International 61 114
Total R&M 464 264
Chemicals 39 (23)
Emerging Businesses (22) (34)
Corporate and other (177) (284)
Net Income/(loss) $ 1,616 1,221
1-2
3. ConocoPhillips
Houston, Texas 77079
Preliminary
SELECTED FINANCIAL DATA
Three Months Ended
March 31
2004 2003
INCOME FROM CONTINUING OPERATIONS
Effective tax rate % 45.9 % 50.8
Millions of Dollars
FOREIGN CURRENY GAINS (LOSSES) AFTER-TAX
E&P $ 5 10
Midstream - -
R&M 1 1
Chemicals - -
Emerging Businesses - (1)
Corporate and other 6 1
$ 12 11
CASH FLOWS FROM OPERATING ACTIVITIES
Income from continuing operations $ 1,603 1,263
Depreciation, depletion and amortization 918 859
Property impairments 31 28
Dry hole costs and leasehold impairment 87 40
Accretion on discounted liabilities 36 33
Deferred taxes 360 243
Undistributed equity earnings (181) 18
Net gain on asset dispositions (82) (56)
Other 70 56
Working capital changes (777) 636
Net cash provided by continuing operations 2,065 3,120
Net cash provided by discontinued operations 8 -
Net cash provided by operating activities $ 2,073 3,120
CAPITAL EXPENDITURES AND INVESTMENTS
E&P
United States $ 306 326
Foreign 904 686
1,210 1,012
Midstream 3 2
R&M 215 203
Chemicals - -
Emerging Businesses 28 66
Corporate and other* 25 25
$ 1,481 1,308
*Excludes discontinued operations
OTHER
At March 31, 2004 At December 31, 2003
Total debt $17,109 17,780
Common stockholders' equity $35,820 34,366
1-3
4. ConocoPhillips
Houston, Texas 77079
Preliminary
OPERATING HIGHLIGHTS
BY SEGMENT
Three Months Ended
March 31
2004 2003
Thousands of Barrels Daily
E&P
Crude oil produced
United States
Alaska 320 337
Lower 48 53 60
373 397
Norway 215 226
United Kingdom 67 87
Canada 27 33
China 32 23
Indonesia 15 21
Vietnam 31 16
Timor Sea 5 3
Other 63 74
Total consolidated 828 880
Equity affiliates 113 55
Total Worldwide 941 935
Syncrude 23 17
Natural gas liquids produced
United States
Alaska* 26 26
Lower 48 24 22
50 48
Norway 9 8
Canada 10 11
Other 7 4
Total Worldwide 76 71
16 15
*Includes reinjected volumes sold lease-to-lease.
Millions of Cubic Feet Daily
Natural gas produced*
United States
Alaska 185 189
Lower 48 1,233 1,338
1,418 1,527
Norway 319 305
United Kingdom 879 1,002
Canada 428 436
Timor Sea 40 61
Indonesia 248 224
Vietnam 17 -
Other 66 50
Total consolidated 3,415 3,605
Equity affiliates 9 12
Total Worldwide 3,424 3,617
*Represents quantities available for sale. Excludes gas equivalent of NGL shown above.
Liquefied natural gas sales 118 130
1-4
5. ConocoPhillips
Houston, Texas 77079
Preliminary
OPERATING HIGHLIGHTS
Three Months Ended
March 31
2004 2003
E&P (continued)
Per Unit
Average sales prices
Crude oil (per barrel)
United States
Alaska $ 32.93 31.47
Lower 48 31.86 31.48
Total U.S. 32.78 31.47
International 31.48 31.10
Total consolidated 32.08 31.27
Equity affiliates 18.68 20.97
Worldwide 30.35 30.73
Natural gas-lease (per MCF)
United States
Alaska 2.54 1.97
Lower 48 4.91 5.47
Total U.S. 4.79 5.34
International 4.28 3.92
Total consolidated 4.48 4.49
Equity affiliates 3.91 4.82
Total Worldwide 4.48 4.49
Midstream
Thousands of Barrels Daily
Natural gas liquids extracted
Consolidated
United States 54 51
International 46 47
Equity affiliates
United States* 109 114
International 12 10
221 222
*Represents 30.3 percent interest in Duke Energy Field Services LLC (DEFS).
Per Barrel
U.S. product prices
Weighted average NGL**
Consolidated $ 25.68 25.59
DEFS 24.81 24.53
**Prices are based on index prices from the Mont Belvieu and Conway market hubs that are weighted by DEFS' naural-gas-liquids
component and location mix.
1-5
6. ConocoPhillips
Houston, Texas 77079
Preliminary
OPERATING HIGHLIGHTS
Three Months Ended
March 31
2004 2003
Thousands of Barrels Daily
R&M
United States
Crude oil capacity 2,168 2,167
Crude oil runs 2,105 2,008
Refinery production 2,255 2,254
International*
Crude oil capacity 447 442
Crude oil runs 374 396
Refinery production 410 436
U.S. Petroleum products outside sales
Automotive gasoline 1,315 1,331
Distillates 570 600
Aviation fuels 178 164
Other products 517 509
2,580 2,604
International 501 428
3,081 3,032
Per Gallon
U.S. Average sales prices**
Automotive gasoline-wholesale $ 1.16 1.10
Automotive gasoline-retail 1.32 1.37
Distillates-wholesale 1.02 1.05
*Includes ConocoPhillps' share of equity affiliates.
**Excludes excise taxes.
1-6