1. Technical Note
ABI 7500 & ABI 7500 FAST (Software Version
2.0.4)
Instrument Setup Instructions
for qBiomarker Copy Number PCR Arrays
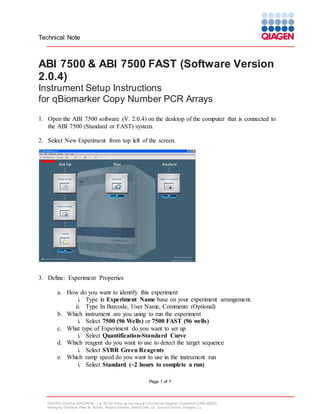
1. Open the ABI 7500 software (V. 2.0.4) on the desktop of the computer that is connected to
the ABI 7500 (Standard or FAST) system.
2. Select New Experiment from top left of the screen.
3. Define: Experiment Properties
a. How do you want to identify this experiment
i. Type in Experiment Name base on your experiment arrangement.
ii. Type In Barcode, User Name, Comments (Optional)
b. Which instrument are you using to run the experiment
i. Select 7500 (96 Wells) or 7500 FAST (96 wells)
c. What type of Experiment do you want to set up
i. Select Quantification-Standard Curve
d. Which reagent do you want to use to detect the target sequence
i. Select SYBR Green Reagents
e. Which ramp speed do you want to use in the instrument run
i. Select Standard (~2 hours to complete a run)
Page 1 of 7
QIAGEN GmbH QIAGEN Str. 1 40724 Hilden Germany Commercial Register Düsseldorf (HRB 45822)
Managing Directors: Peer M. Schatz, Roland Sackers, Bernd Uder, Dr. Joachim Schorr, Douglas Liu
2. Technical Note
4. Click Plate Setup (from tab list on left)
a. Click on Define Targets and Samples
i. Target Name: Use default Target 1, Reporter-select SYBR, Quencher-select
None, Color-Select Green or any color you want.
ii. Define Samples: select sample such as Sample 1 or your defined sample
name.
iii. Define Biological Replicate Group-None
iv. Click Assign Targets and Samples
Page 2 of 7
QIAGEN GmbH QIAGEN Str. 1 40724 Hilden Germany Commercial Register Düsseldorf (HRB 45822)
Managing Directors: Peer M. Schatz, Roland Sackers, Bernd Uder, Dr. Joachim Schorr, Douglas Liu
3. Technical Note
b. Click Assign Targets and Samples Tab
i. Highlight the entire plate by clicking the square between A and 1 in View
Plate Layout.
ii. Check the box next to Target 1 under Assign targets to the selected wells (if
you set different well for different target base on PCR Array format, you can
check them individually)
iii. Assign sample(s) to the selected wells-Select the Sample 1 or the name as
you defined before.
iv. Verify all wells in Plate Layout view have the “U” symbol (“U” = unknown)
and Sample 1
v. Select the dye as the passive reference-Select ROX.
Page 3 of 7
QIAGEN GmbH QIAGEN Str. 1 40724 Hilden Germany Commercial Register Düsseldorf (HRB 45822)
Managing Directors: Peer M. Schatz, Roland Sackers, Bernd Uder, Dr. Joachim Schorr, Douglas Liu
4. Technical Note
5. Click Run Method (This setting should default to run protocol with melting curve.)
Change setting at Graphical view:
a. Set Reaction Volume Per Well to 25 uL
b. Holding Stage: 95.0C 10.00 minute.
c. Cycling Stage:
i. Number of Cycles: 40
ii. Temperature: 95.0C 00:15; 60.0C 01:00.
d. Melting Curve Stage: Using default setting from 60°C to 95°C
6. Click Start Run
7. Save Template
a. File>Save As Template: Save template file for further usage.
Performing Real-Time PCR Detection
1. If the thermocycler is off, press the power button to switch on the instrument. Wait for
the instrument to boot and display the Power status light. Switch on the computer
connected to the thermocycler.
Page 4 of 7
QIAGEN GmbH QIAGEN Str. 1 40724 Hilden Germany Commercial Register Düsseldorf (HRB 45822)
Managing Directors: Peer M. Schatz, Roland Sackers, Bernd Uder, Dr. Joachim Schorr, Douglas Liu
5. Technical Note
2. Make sure that there are no bubbles in any well, and that the reaction mix is positioned at
the bottom of each well. If not, centrifuge the plate at ~1000 g for 60 seconds.
3. Open the ABI 7500 Software v2.0.4 (or similar version)
4. Select File>New Experiment>From template. Then select the right template for your
experiment. Click Open. This will load the previously saved setup to the new plate
document.
5. Add an Experiment Name in Setup>Experiment Properties.
6. Save the new document under a new filename as Experiment Documents Single File
(*sds).
7. Load your plate in the plate tray with A1 in the top left corner.
8. Select the Run tab on left panel. Click Start Run to begin the PCR run. Wait 30 seconds
to 1 min for the initial priming, then the run should start. The estimated run time will
then appear on the screen.
After the PCR Run
1. Select Analysis on the left panel. On the lower panel-Options, select the radio button
next to Auto Baseline and deselect the radio button next to Threshold: Auto. Add a
desired threshold (most of time 0.05 is fine, please refer 5) for manual selecting
threshold). Click the Green Analyze button on the top right to do the data analysis.
2. You can select the radio button on lower panel next to Threshold to show the threshold
in figure. In a similar way for Baseline information.
3. Under Amplification Plot/Plot Setting, default setting for Plot Type is Rn vs. Cycle.
You can select other Plot Type also. For Graph Type, default in Log format, you also can
select liner one.
4. For Exporting your result, Select File>Export. Export Data window will come out.
Under Export Properties:
a. Select data to export. Use the radio button to select the data you want to export,
usually Results.
Page 5 of 7
QIAGEN GmbH QIAGEN Str. 1 40724 Hilden Germany Commercial Register Düsseldorf (HRB 45822)
Managing Directors: Peer M. Schatz, Roland Sackers, Bernd Uder, Dr. Joachim Schorr, Douglas Liu
6. Technical Note
b. Select one file or separate file by selecting the radio button.
c. Enter export file properties for its name and location. Also select the File Type
(choose *.xls for excel file and *.txt for regular text file).
d. Select the radio button beside Open file(s) when export is complete for view
file immediately after exporting.
5. Follow the procedures below to select the baseline and threshold manually if you need.
(Please use the same threshold for all your plates in one study).
To define the Baseline, use the Linear View of the Amplification plot/Plot
Settings. With the linear plots, determine the cycle number at which the earliest
amplification can be seen. Using the red sliding bars on X-axis to set the Manual
Baseline to start from cycle number 2 through two cycle values before the earliest
visible amplification.
Page 6 of 7
QIAGEN GmbH QIAGEN Str. 1 40724 Hilden Germany Commercial Register Düsseldorf (HRB 45822)
Managing Directors: Peer M. Schatz, Roland Sackers, Bernd Uder, Dr. Joachim Schorr, Douglas Liu
7. Technical Note
To define the Threshold Value, use the Log View of the amplification plot/Plot
Settings. With the log plots, place the threshold line above the background signal
but within the lower third of the linear phase of the amplification plot (please
remember the Threshold when you first time set it and use it for all your analysis
in same study).
Page 7 of 7
QIAGEN GmbH QIAGEN Str. 1 40724 Hilden Germany Commercial Register Düsseldorf (HRB 45822)
Managing Directors: Peer M. Schatz, Roland Sackers, Bernd Uder, Dr. Joachim Schorr, Douglas Liu