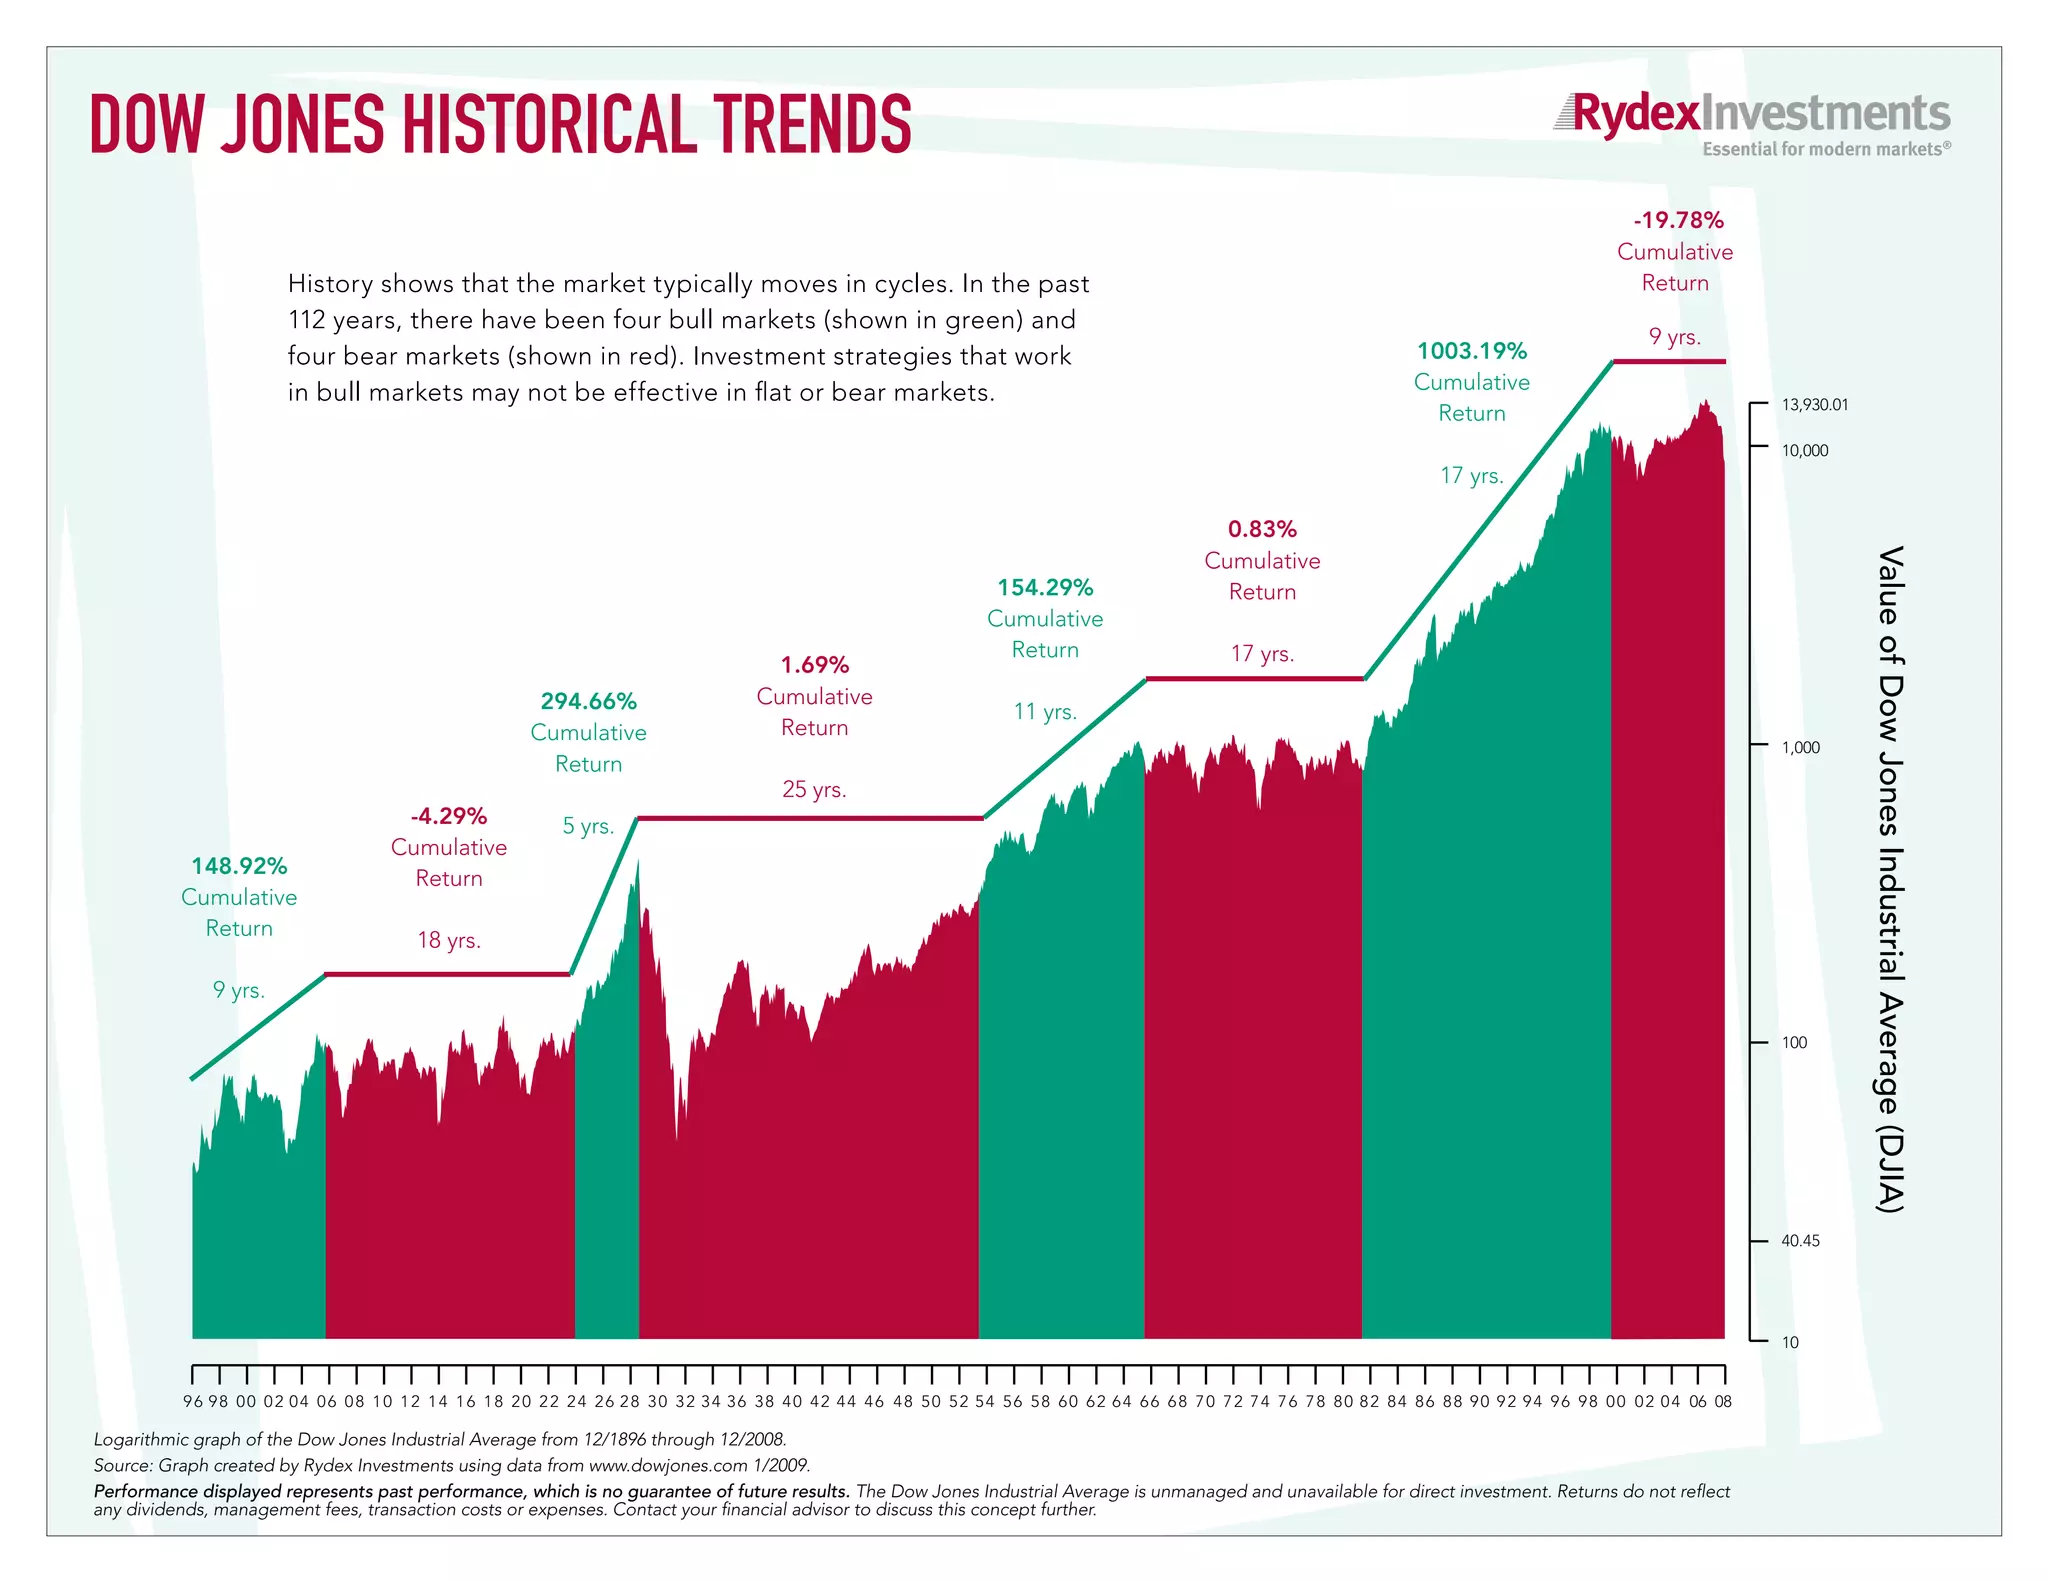
DOW JONES HISTORICAL TRENDS
                                                                                                                                                                                                                           -19.78%
                                                                                                                                                                                                                          Cumulative
                         History shows that the market typically moves in cycles. In the past                                                                                                                               Return
                         112 years, there have been four bull markets (shown in green) and
                                                                                                                                                                                                                              9 yrs.
                         four bear markets (shown in red). Investment strategies that work                                                                                                  1003.19%
                         in bull markets may not be effective in flat or bear markets.                                                                                                      Cumulative
                                                                                                                                                                                                                                              13,930.01
                                                                                                                                                                                              Return
                                                                                                                                                                                                                                              10,000
                                                                                                                                                                                                17 yrs.

                                                                                                                                                                0.83%


                                                                                                                                                                                                                                                          Value of Dow Jones Industrial Average (DJIA)
                                                                                                                                                              Cumulative
                                                                                                                               154.29%                          Return
                                                                                                                              Cumulative
                                                                                                                                Return                            17 yrs.
                                                                                               1.69%
                                                             294.66%                         Cumulative
                                                                                                                                  11 yrs.
                                                            Cumulative                         Return
                                                                                                                                                                                                                                              1,000
                                                              Return
                                                                                                 25 yrs.
                                         -4.29%                  5 yrs.
                                        Cumulative
           148.92%
                                          Return
          Cumulative
            Return
                                           18 yrs.

              9 yrs.

                                                                                                                                                                                                                                              100


                                                                                                                                                                                                                                              40.45


                                                                                                                                                                                                                                              10


          9 6 9 8 0 0 0 2 0 4 0 6 0 8 1 0 1 2 1 4 1 6 1 8 2 0 2 2 2 4 2 6 2 8 3 0 3 2 3 4 3 6 3 8 4 0 4 2 4 4 4 6 4 8 5 0 5 2 5 4 5 6 5 8 6 0 6 2 6 4 6 6 6 8 7 0 7 2 7 4 7 6 7 8 8 0 8 2 8 4 8 6 8 8 9 0 9 2 9 4 9 6 9 8 0 0 0 2 0 4 06 08

Logarithmic graph of the Dow Jones Industrial Average from 12/1896 through 12/2008.
Source: Graph created by Rydex Investments using data from www.dowjones.com 1/2009.
Performance displayed represents past performance, which is no guarantee of future results. The Dow Jones Industrial Average is unmanaged and unavailable for direct investment. Returns do not reflect
any dividends, management fees, transaction costs or expenses. Contact your financial advisor to discuss this concept further.
DOW JONES HISTORICAL TRENDS                                                                                                                         Some strategies to consider during
                                                                                                                                                    various secular cycles include:

Over the last 112 years, the stock market has rewarded investors with long-term growth. But for most investors, a realistic                         Secular Bull Market
time horizon is 10 to 20 years—not more than a century.                                                                                                 •	 Relative Returns1
                                                                                                                                                        •	 Wealth Accumulation
History shows that the equity market enters long periods of high returns, followed by lengthy periods of lower ones.
These periods are called secular trends. There are two kinds of secular trends:                                                                         •	 Correlating Assets2
                                                                                                                                                        •	 Buy and Hold
A secular bull market, or upward-trending market, occurs when each successive high point is higher than the previous one.
                                                                                                                                                    Secular Bear Market
    Start         End        Months         Years       Annualized Return           Cumulative Return              Annualized Std. Dev.                 •	 Real Returns1
  12/1896        1/1906         110           9                10.56%                      148.92%                          20.45%                      •	 Wealth Preservation
   7/1924        8/1929          63           5                30.44%                      294.66%                          17.30%                      •	 Non-correlating Assets2
  12/1954        1/1966         135           11                8.72%                      154.29%                          11.68%                      •	 Dynamic/Alternative Approach3
  11/1982        1/2000         206           17               15.09%                     1003.19%                          15.12%
                                                                                                                                                    The Rydex Value Proposition:
                                                                                                                                                    Providing institutional-style investment
A secular bear market, or downward-trending market, occurs when a trend does not rise above the previous high.                                      strategies—both traditional and alterna-
                                                                                                                                                    tive—for individual investors by marrying
    Start         End        Months         Years       Annualized Return           Cumulative Return              Annualized Std. Dev.
                                                                                                                                                    the investment characteristics of institu-
   2/1906        6/1924         218           18               -0.24%                       -4.29%                          18.71%                  tional portfolios with the structural benefits
   9/1929       11/1954         304           25                0.07%                       1.69%                           24.96%                  of registered products while utilizing a
   2/1966       10/1982         202           17                0.05%                       0.83%                           15.25%                  proprietary quantitative methodology.
   2/2000       12/2008         108           9                -2.44%                      -19.78%                          14.73%
                                                                                                                                                    1
                                                                                                                                                      Real returns are what you actually make. Hypothetically, if
                                                                                                                                                    your portfolio returned 12% last year, this should be your
Having a thorough understanding of these trends and the current market environment may help you better prepare for upcoming                         real return. Relative returns are returns compared to a
financial goals. Contact your financial advisor to discuss this concept further.                                                                    benchmark. For example, if an index made 28% last year,
                                                                                                                                                    compared to your portfolio which made 12%, your portfo-
                                                                                                                                                    lio underperformed relative to the benchmark S&P 500.

                                                                                                                                                    2
                                                                                                                                                      Correlation is a statistical measure of how two variables
                                                                                                                                                    move in relation to each other. This measure ranges from
                                                                                                                                                    -1 to +1 where -1 indicates perfect negative correlation
                                                                                                                                                    and +1 indicates perfect positive correlation.

                                                                                                                                                    3
                                                                                                                                                     A dynamic/alternative approach is one that incorpo-
                                                                                                                                                    rates specialized investments in conjunction with a core
                                                                                                                                                    strategy to potentially take advantage of changing mar-
                                                                                                                                                    ket conditions. Specialized investment strategies may
                                                                                                                                                    help you achieve greater diversification, lower volatility
Source: Calculated by Rydex Investments using data from Dowjones.com, 2009.                                                                         and potentially better returns. There are various risks as-
                                                                                                                                                    sociated with these types of investments, so you should
Performance displayed represents past performance, which is no guarantee of future results. This information is for illustrative purpose only,      educate yourself thoroughly with the help of your advisor
and should not be construed as a recommendation of any particular security or strategy. Due to market fluctuations, current returns may be higher   to gain a better understanding.
or lower than listed returns. The Dow Jones Industrial Average is unmanaged and unavailable for direct investments. The Dow Jones Industrial
Average is a price-weighted average of 30 significant stocks traded on the New York Stock Exchange and the Nasdaq. Returns do not reflect
dividends, management fees, transaction costs or expenses. There is no guarantee that prior markets will be duplicated. Materials prepared by
Rydex Distributors, Inc., an affiliate of Rydex Investments.
Securities are not deposits or obligations of any bank, are not guaranteed by any bank, are not insured by the FDIC or any other agency, and
involve investment risks, including the possible loss of the principal amount invested. DJCSI-15-0109 x1209

100 Year Dow Chart

  • 1.
    DOW JONES HISTORICALTRENDS -19.78% Cumulative History shows that the market typically moves in cycles. In the past Return 112 years, there have been four bull markets (shown in green) and 9 yrs. four bear markets (shown in red). Investment strategies that work 1003.19% in bull markets may not be effective in flat or bear markets. Cumulative 13,930.01 Return 10,000 17 yrs. 0.83% Value of Dow Jones Industrial Average (DJIA) Cumulative 154.29% Return Cumulative Return 17 yrs. 1.69% 294.66% Cumulative 11 yrs. Cumulative Return 1,000 Return 25 yrs. -4.29% 5 yrs. Cumulative 148.92% Return Cumulative Return 18 yrs. 9 yrs. 100 40.45 10 9 6 9 8 0 0 0 2 0 4 0 6 0 8 1 0 1 2 1 4 1 6 1 8 2 0 2 2 2 4 2 6 2 8 3 0 3 2 3 4 3 6 3 8 4 0 4 2 4 4 4 6 4 8 5 0 5 2 5 4 5 6 5 8 6 0 6 2 6 4 6 6 6 8 7 0 7 2 7 4 7 6 7 8 8 0 8 2 8 4 8 6 8 8 9 0 9 2 9 4 9 6 9 8 0 0 0 2 0 4 06 08 Logarithmic graph of the Dow Jones Industrial Average from 12/1896 through 12/2008. Source: Graph created by Rydex Investments using data from www.dowjones.com 1/2009. Performance displayed represents past performance, which is no guarantee of future results. The Dow Jones Industrial Average is unmanaged and unavailable for direct investment. Returns do not reflect any dividends, management fees, transaction costs or expenses. Contact your financial advisor to discuss this concept further.
  • 2.
    DOW JONES HISTORICALTRENDS Some strategies to consider during various secular cycles include: Over the last 112 years, the stock market has rewarded investors with long-term growth. But for most investors, a realistic Secular Bull Market time horizon is 10 to 20 years—not more than a century. • Relative Returns1 • Wealth Accumulation History shows that the equity market enters long periods of high returns, followed by lengthy periods of lower ones. These periods are called secular trends. There are two kinds of secular trends: • Correlating Assets2 • Buy and Hold A secular bull market, or upward-trending market, occurs when each successive high point is higher than the previous one. Secular Bear Market Start End Months Years Annualized Return Cumulative Return Annualized Std. Dev. • Real Returns1 12/1896 1/1906 110 9 10.56% 148.92% 20.45% • Wealth Preservation 7/1924 8/1929 63 5 30.44% 294.66% 17.30% • Non-correlating Assets2 12/1954 1/1966 135 11 8.72% 154.29% 11.68% • Dynamic/Alternative Approach3 11/1982 1/2000 206 17 15.09% 1003.19% 15.12% The Rydex Value Proposition: Providing institutional-style investment A secular bear market, or downward-trending market, occurs when a trend does not rise above the previous high. strategies—both traditional and alterna- tive—for individual investors by marrying Start End Months Years Annualized Return Cumulative Return Annualized Std. Dev. the investment characteristics of institu- 2/1906 6/1924 218 18 -0.24% -4.29% 18.71% tional portfolios with the structural benefits 9/1929 11/1954 304 25 0.07% 1.69% 24.96% of registered products while utilizing a 2/1966 10/1982 202 17 0.05% 0.83% 15.25% proprietary quantitative methodology. 2/2000 12/2008 108 9 -2.44% -19.78% 14.73% 1 Real returns are what you actually make. Hypothetically, if your portfolio returned 12% last year, this should be your Having a thorough understanding of these trends and the current market environment may help you better prepare for upcoming real return. Relative returns are returns compared to a financial goals. Contact your financial advisor to discuss this concept further. benchmark. For example, if an index made 28% last year, compared to your portfolio which made 12%, your portfo- lio underperformed relative to the benchmark S&P 500. 2 Correlation is a statistical measure of how two variables move in relation to each other. This measure ranges from -1 to +1 where -1 indicates perfect negative correlation and +1 indicates perfect positive correlation. 3 A dynamic/alternative approach is one that incorpo- rates specialized investments in conjunction with a core strategy to potentially take advantage of changing mar- ket conditions. Specialized investment strategies may help you achieve greater diversification, lower volatility Source: Calculated by Rydex Investments using data from Dowjones.com, 2009. and potentially better returns. There are various risks as- sociated with these types of investments, so you should Performance displayed represents past performance, which is no guarantee of future results. This information is for illustrative purpose only, educate yourself thoroughly with the help of your advisor and should not be construed as a recommendation of any particular security or strategy. Due to market fluctuations, current returns may be higher to gain a better understanding. or lower than listed returns. The Dow Jones Industrial Average is unmanaged and unavailable for direct investments. The Dow Jones Industrial Average is a price-weighted average of 30 significant stocks traded on the New York Stock Exchange and the Nasdaq. Returns do not reflect dividends, management fees, transaction costs or expenses. There is no guarantee that prior markets will be duplicated. Materials prepared by Rydex Distributors, Inc., an affiliate of Rydex Investments. Securities are not deposits or obligations of any bank, are not guaranteed by any bank, are not insured by the FDIC or any other agency, and involve investment risks, including the possible loss of the principal amount invested. DJCSI-15-0109 x1209