2014 Seattle Multifamily Urban Market Study -- Dylan Simon
•
1 like•1,993 views

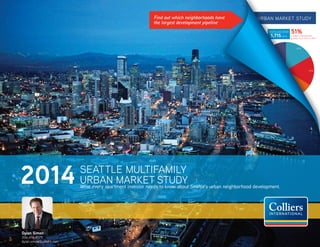
This document analyzes the 2014 Seattle multifamily urban real estate market. It provides an overview of key metrics in 2013 including strong job and population growth, high rental rate increases, decreasing vacancy rates, and increasing sales volumes and prices focused on urban areas. It then reviews the development pipeline by neighborhood, finding over 31,000 units planned in urban areas through future years. South Lake Union saw the largest increase in its development pipeline from 2013 to 2014 at 51%.

Recommended
Recommended
More Related Content
What's hot
What's hot (20)
Similar to 2014 Seattle Multifamily Urban Market Study -- Dylan Simon
Similar to 2014 Seattle Multifamily Urban Market Study -- Dylan Simon (20)
More from Dylan Simon
More from Dylan Simon (8)
Recently uploaded
Recently uploaded (20)
2014 Seattle Multifamily Urban Market Study -- Dylan Simon
- 1. 2014 Seattle Multifamily urban market study Capitol Hill/Eastlake 34% 35% 7% 25% 2014 2015 2016 2017 Future Downtown CBD 39% 21% 23% 17% 2014 2015 2016 2017 Future Belltown 9% 12% 16% 3% 60% 2014 2015 2016 2017 Future South Lake Union 17% 17% 16% 29% 21% 2014 2015 2016 2017 Future Green Lake/Wallingford 27% 59% 7% 7% 2014 2015 2016 2017 Future University District 21% 36% 26% 17% 2014 2015 2016 2017 Future Queen Anne 44% 31% 12% 13% 2014 2015 2016 2017 Future West Seattle 26% 37% 17% 20% 2014 2015 2016 2017 Future West Bellevue 7% 39% 3% 8% 43% 2014 2015 2016 2017 Future SODO 40% 19% 41% 2014 2015 2016 2017 Future First Hill 6% 55% 39% 34% 34% 7% 25% Capitol Hill/Eastlake 2014 2015 2016 Future 17% 17% 16% 29% 21% South Lake Union 2014 2015 2016 2017 Future 21% 36% 26% 17% University District 2014 2015 2016 2017 Future 44% 31% 12% 13% 26% 37% 17% 20% West Seattle 2014 2015 2016 2017 Future 40% 19% 41% 6% 55% 39% First Hill 2014 2015 2016 2017 Future SOUTH LAKE UNION 5,715uNITS 51%change in development pipeline from 2013 to 2014 1,986 UNITS 1,986 UNITS Find out which neighborhoods have the largest development pipeline seattle Multifamily Urban market study2014 What every apartment investor needs to know about Seattle’s urban neighborhood development. Dylan Simon 206-414-8575 dylan.simon@colliers.com
- 2. Colliers International Seattle 2 Dylan Simon | 206 414 8575 | www.dylansimon.com 2014 Seattle Multifamily urban market study This past year has again proved the economic vitality of the Puget Sound region. Our diverse employment sector, strong entrepreneurial engine, robust post-secondary education system and high quality of life have placed us on the global map and provided us with an envious Post-Recession economic outlook. Having added nearly 50,000 jobs to the Seattle-Bellevue-Everett MSA in each of the last three years, and another 52,000 jobs forecasted for 2014, it is no surprise that we are one of the few economies to have regained all jobs lost since 2008. Apartment developers have responded to demand drivers over the last several years, adding 7,320 apartment units to the region in 2013, with plans to add another 40,000 units by 2018. In our Post-Recession economy, it is noteworthy that the focal point of investment capital is urban centers and neighborhoods. This phenomenon is demonstrated by both the development community and investment community. With an apartment development and investment community demonstrably focused on urban centers and neighborhoods it is increasingly important to analyze these markets. Job Growth Fuels Continued Development: Urban Locations Remain the Focus of Development & Investment Neighborhood Analysis development Pipeline & SWOT Analysis Ballard belltown South Downtown/ Pioneer Square capitol Hill first hill queen anne Downtown Green Lake/ wallingford/ Fremont south lake union West bellevue university district west seattle 90 90 520 BALLARD QUEEN ANNE UNIVERSITY DISTRICT CAPITOL HILL FIRST HILL WEST BELLEVUE BELLTOWN DOWNTOWN SODO/PIONEER SQUARE WEST SEATTLE SOUTH LAKE UNION GREEN LAKE/WALLINGFORD/FREMONT In the following study we start by analyzing key performance indicators from 2013. We then take a qualitative look at the attributes of our urban neighborhoods. Finally, we take a quantitative study of each neighborhood’s development pipeline and performance indicators. Contact us to see how our analysis and insights can best serve your plans in 2014.
- 3. Colliers International Seattle 3 Dylan Simon | 206 414 8575 | www.dylansimon.com 2014 Seattle Multifamily urban market study A look back at 2013 indicates a stellar year of economic vibrancy in Seattle and the Puget Sound region. The apartment investment market gained national attention by posting nation-leading rent growth at over 6.5% for the year and continued record occupancy levels. In the investment sales market, marquee transactions pushed prices on a unit and square foot basis to all-time highs for the region. A closer analysis of the urban apartment market indicates that this market segment continues a trend of leading sales metrics from both volume and value perspectives. 2013 Year In Review 1 2 3 Seattleby the numbers... Number one city for tech jobs (Forbes, May 2013) Second best city for women entrepreneurs (Entrepreneur Magazine, May 2013) Third best U.S. city for dogs (Estately, May 2013) 4 5Number four U.S. city for real estate investment (Urban Land Institute, November 2013) Fifth best city for good jobs (Forbes, February 2013) Development 7,320 83% 56% Units added to tri-county in 2013, greatest number since 1991 percentage of tri-county development that landed in King county percentage of tri-county development that landed in URBAN king county neighborhoods SNOHOMISH County and PIERCE county DEvelopment KING county DEVELOPMENT OVER HALF OF TRI-COUNTY DEVELOPMENT OCCURED IN URBAN KING COUNTY NEIGHBORHOODS Rental Rates SAN FRANCISCO SEATTLE 5.3%5.6% UNEMPLOYMENT DECIBELS 127 137 EARTHQUAKES 11% 9.8% VACANCY 11 10 9 8 7 6 5 -3.5 POINT SPREAD +3.5 # OF FAN-CAUSEDB 11 10 9 8 7 6 5 SAN FRANCISCO SEATTLE 5.3%5.6% UNEMPLOYMENT DECIBELS 127 137 EARTHQUAKES 11% 9.8% VACANCY 11 10 9 8 7 6 5 -3.5 POINT SPREAD +3.5 # OF FAN-CAUSEDB 11 10 9 8 7 6 5 aVERAGE KING COUNTY RENTAL RATE, ½ OF COMPARABLE SF RENT $1,246 $3,000 Vacancy Rates Sub-4% 4.0% vs. 4.8% 7.0%vs. 4.5% FALL 2013 VACANCY VS. FALL 2012 VACANCY Increase in urban rental rates in 2013 vs. 13-year average <5% 6.5% KING COUNTY VACANCY FOR SEVEN CONSECUTIVE QUARTERS Increase in rental rates in the region in 2013 2013 was the first entire year of sub-4% vacancy in metro king county since 2007 aVERAGE Seattle RENTAL RATE IS LESS THAN 1/2 OF COMPARABLE San Francisco RENT Based on data provided by Dupre + Scott
- 4. Colliers International Seattle 4 Dylan Simon | 206 414 8575 | www.dylansimon.com 2014 Seattle Multifamily urban market study 6 7America’s sixth favorite city (Harris Interactive Poll, September 2013) World’s number seven tech town (National Venture Capital Association, February 2013) 8 9 10Number eight moving destination in the U.S. (U.S. Census Bureau, January 2013) Ninth best U.S. city for green homes (Redfin, April 2013) Tenth best-paying city for women (Forbes, February 2013) Seattleby the numbers... Sales—Tri-County Tri-county King county Urban King county 2000 2005 2012 2013 8.1 5.8 5.6 5.8 7.9 5.6 5.2 5.5 7.3 5.2 4.8 4.6 Caprate 2000 2005 2012 2013 $500M $393M $95.4M $1.81B $1.35B $550M $2.15B $1.65B $749M $1.61B $1.16B $783M salesvolume 2000 2005 2012 2013 53 117 79 52 33 75 53 34 6 16 19 17 NumberofSales 33% vs. 14% vs. 11%2013 2005 2000 Since 2000, urban apartment sales in King County have tripled versus Tri-County sales experiencing no growth. Urban transactions as a % of tri-county transactions 2/3 Since 2000, urban apartment sales volume in King County has grown by a factor of 8 versus Tri-County sales growth barely tripling. Urban transactions as a % of king county Sales volume <6 Cap Cap rates across all counties have compressed below 6% for nearly a decade. cap rates across the region An analysis of sales trends across the Tri-county region since the turn of the century shows a demonstrable shift towards urban markets. A look at both the number of transactions and total value of transactions illustrates both greater focus on and investment in urban markets. A review of historic capitalization rates over this same period illustrates a vast compression of capitalization rates, yet relatively consistent spreads between geographic markets. Based on data provided by Dupre + Scott
- 5. Colliers International Seattle 5 Dylan Simon | 206 414 8575 | www.dylansimon.com 2014 Seattle Multifamily urban market study Sales—Urban Centers & Neighborhoods 2013 Urban apartment sales metrics 2000-2013 URBan Apartment Sales Trends 7.6% 7.3% 7.1% 6.5% 5.7% 5.3% 5.0% 4.7% 4.5% 5.8% 5.4% 5.3% 4.7% 4.6% 0.0% 1.0% 2.0% 3.0% 4.0% 5.0% 6.0% 7.0% 8.0% 2000 2001 2002 2003 2004 2005 2006 2007 2008 2009 2010 2011 2012 2013 Cap Rate $144.56 $140.62 $155.34 $148.06 $168.16 $195.81 $253.66 $322.01 $338.64 $212.31 $280.80 $306.32 $395.05 $436.78 $‐ $50.00 $100.00 $150.00 $200.00 $250.00 $300.00 $350.00 $400.00 $450.00 $500.00 2000 2001 2002 2003 2004 2005 2006 2007 2008 2009 2010 2011 2012 2013 Sale Price PSF 1960 1970 1980 1990 2000 2010 2020 0.0% 1.0% 2.0% 3.0% 4.0% 5.0% 6.0% 7.0% Year Built Cap Rate 1960 1970 1980 1990 2000 2010 2020 $‐ $100.00 $200.00 $300.00 $400.00 $500.00 $600.00 Building Age Sales Price Per Square Foot Based on data provided by Dupre + Scott & Real Capital Analytics for buildings +50 units, built after 1960 1960 1970 1980 1990 2000 2010 2020 0.0% 1.0% 2.0% 3.0% 4.0% 5.0% 6.0% 7.0% Year Built Cap Rate Year Sale Price/PSF YearBuilt YearBuilt Cap Rate Year CapRate SalesPrice/PSF
- 6. Colliers International Seattle 6 Dylan Simon | 206 414 8575 | www.dylansimon.com 2014 Seattle Multifamily urban market study Regional Overview Snohomish County # of residents in 2000: 606,024 # of residents in 2013: 730,500 Apartment inventory in 2000: 33,551 Apartment inventory in 2013: 33,843 King County # of residents in 2000: 1,737,046 # of residents in 2013: 1,981,900 Apartment inventory in 2000: 132,577 Apartment inventory in 2013: 154,175 Pierce County # of residents in 2000: 700,818 # of residents in 2013: 814,500 Apartment inventory in 2000: 39,617 Apartment inventory in 2013: 45,040 Snohomish county king county pierce county 2000 2013 2000 2013 2000 2000 2013 2013 2000 2013 = 100,000 residents 21%population growth from 2000 to 2013 1%apartment inventory growth from 2000 to 2013 14%population growth from 2000 to 2013 16%population growth from 2000 to 2013 14%apartment inventory growth from 2000 to 2013 Population GROWTH BY COUNTY = 10,000 units 2000 2013 16%apartment inventory growth from 2000 to 2013 Based on data provided by Dupre + Scott and Washington State Office of Financial Management Apartment INVENTORY growth by county
- 7. Colliers International Seattle 7 Dylan Simon | 206 414 8575 | www.dylansimon.com 2014 Seattle Multifamily urban market study Urban Pipeline 31,686 units 98% of King County Total 32,189 units Total Number in King county pipeline 2014-Future Deliveries in Urban Centers and Neighborhoods Based on data provided by Dupre + Scott as of February 2014 downTOWN 4,363 uNITS -20%change in development pipeline from 2013 to 2014 WEST BELLEVUE 3,791uNITS 1%change in development pipeline from 2013 to 2014 BALLARD 1,350 uNITS -29%change in development pipeline from 2013 to 2014 CAPITOL hILL 2,469 uNITS -35%change in development pipeline from 2013 to 2014 first hILL 2,255 uNITS 2%change in development pipeline from 2013 to 2014 GREEN LAKE/ WALLINGFORD/FREMONT 1,754uNITS -24%change in development pipeline from 2013 to 2014 S. DOWNTOWN/ PIONEER SQUARE 838 uNITS 21%change in development pipeline from 2013 to 2014 QUEEN ANNE 861uNITS -37%change in development pipeline from 2013 to 2014 SOUTH LAKE UNION 5,715 uNITS 51%change in development pipeline from 2013 to 2014 WEST SEATTLE 2,502 uNITS -2%change in development pipeline from 2013 to 2014 u DISTRICT 2,815 uNITS 14%change in development pipeline from 2013 to 2014 2014 2015 2016 2017 FUTURE BELLTOWN 2,973 uNITS 50%change in development pipeline from 2013 to 2014 13% 7% 7% 27% 55% 6% 36% 21% 26% 17% 16% 29% 17% 8% 16% 12% 10% 39% 7% 3%8% 10% 16% 25% 5% 35% 34% 7% 33% 46%6% 19% 40% 59% 37% 17% 26% 31% 44%12% 16% 41% 25% 20% 39% 17% 43% 21% 54% 43%
- 8. Colliers International Seattle 8 Dylan Simon | 206 414 8575 | www.dylansimon.com 2014 Seattle Multifamily urban market study Downtown (CBD) Strengths: » Core location, proximity to jobs, concentration of retail, adja- cency to waterfront and neighborhoods Weaknesses: » Perception of danger/crime, concentration of social services, lack of parks Opportunities: » Development of boutique and mid-priced apartment projects, retail redevelopment along pedestrian corridors Threats: » Rising cost of all units, potential commoditization of product, crime, concentration of social services Capitol Hill/First Hill Strengths: » Unrivaled character, diverse retail, great nighttime activation, proximity to CBD/First Hill job centers, walkability, ease of access from Eastside, views Weaknesses: » Proscriptive zoning for office development, lack of daytime activation, challenging to find sites for new development and/or owner’s reluctance to sell, lack of parking Opportunities: » Development of office and apartments along East Slope South of Madison, retail development to meet rising needs, any use that promotes daytime activation, development capitalizing on emerging uses in Denny Triangle Threats: » Loss of character, rising prices, commoditization of apartment product, lack of daytime activation South Downtown/Pioneer Square Strengths: » Proximity to CBD waterfront, ease of access to multi-modal transit, flat topography, redevelopment adaptive reuse of Pioneer Square buildings, development in the International District Weaknesses: » Perception of crime, concentration of social services home- less population, owner’s reluctance to redevelop and/or sell Opportunities: » Capitalization on new zoning, market rate housing, retail office development, seizing opportunities related to Stadium District overlay waterfront revitalization Threats: » Crime, continued concentration of social services, lack of nighttime activation, dilapidation of unreinforced masonry buildings Belltown Strengths: » Proximity to CBD/SLU Westlake job centers, proximity to soon-to-be revitalized waterfront, walkability, views, history of desirability Weaknesses: » Current lack of character, poor/undesirable nighttime activation, lack of distinction block-by-block Opportunities: » Retail redevelopment along pedestrian corridors, boutique development of retail, office apartments, capitalization on waterfront revitalization, seizing opportunities as connection point between Amazon.com headquarters and waterfront Threats: » Perception of and actual crime, concentration of nighttime activity, overdevelopment of high-cost apartments, lack of retailers coming to neighborhood Urban Neighborhood S.W.O.T. Analysis
- 9. Colliers International Seattle 9 Dylan Simon | 206 414 8575 | www.dylansimon.com 2014 Seattle Multifamily urban market study Urban Neighborhood S.W.O.T. Analysis Green Lake/Wallingford/Fremont Strengths: » Great neighborhood atmosphere scale, waterfront neighborhood amenities, great retail character, walkability Weaknesses: » Restrictive parcel sizes zoning, land owners resistant to sell- ing land, need to travel to get to job centers Opportunities: » Boutique apartment development, retail responsive to new apart- ment development, office development Threats: » Potential of oversupply of apartments in micro-markets, lack of growth of retail amenities University District Strengths: » Dense student population, increasing private sector involvement with UW, proximity to CBD, light-rail in 2016, proximity to great neighborhoods, walkability Weaknesses: » Crime/loitering, retail owners resistance to highest and best use of land, patchy new development Opportunities: » Renewal of retail experience (especially along University Ave), student housing development, capitalization on proposed zoning changes Threats: » Lack of character of neighborhood experience, oversupply of high price-point apartments, lack of higher-end retail amenities Queen Anne Strengths: » Neighborhood character, good transition to single family neighborhood, proximity to CBD/SLU job centers, diversity of apartment stock and price-points, vibrant nightlife, views Weaknesses: » Hard to overcome neighborhood NIMBYism, lack of character “there-there” in Lower Queen Anne, lack of continuity of retail experience Opportunities: » Renewal of retail, apartment development on Upper Queen Anne, capitalization on proximity to renewed SLU, boutique apartment development Threats: » Potential of apartment oversupply in Lower Queen Anne, con- tinued lack of character in Lower Queen Anne. South Lake Union (SLU) Strengths: » Proximity to CBD, adjacency to Lake Union amenities freeways, vibrant daytime activation, plethora of retail amenities, brand- name that attracts development capital, bursting employment opportunities, walkability Weaknesses: » Lack of character/historic preservation, lack of topographic features, congestion of traffic, lack of nighttime attractions. Opportunities: » Continued retail development, distinguishing any development by providing character, capitalization on new zoning, seizing opportunities based on location between CDB University District Threats: » Continued lack of character, traffic/congestion, overbuilding of apartments at same price-point, costliness of land bonus density
- 10. Colliers International Seattle 10 Dylan Simon | 206 414 8575 | www.dylansimon.com 2014 Seattle Multifamily urban market study West Seattle Strengths: » Fantastic neighborhood setting vibe, great retail core, proximity to waterfront amenities, protected views, proximity of necessary services, walkability, great single family housing stock, history of desirability, burgeoning retail amenities Weaknesses: » Perception of distance to urban core, limited and congested tran- sit routes to urban centers Opportunities: » Unexploited zoning height limits within core neighborhoods, retail development to capture growing population and shifting demographic, pricing discount to core apartment product, aging stock of apartments Threats: » Increased congestion on transit routes, potential oversupply of apartments at higher price-points West Bellevue Strengths: » Mature market with strong employer base and huge draw for new employers, delineated as an urban center for future growth, proximity to freeway access to all major freeways, fantastic retail core that continues to expand, great access to waterfront park amenities Weaknesses: » Large blocks that challenge walkability, rather sterile downtown experience, zoning parking requirements that make development challenging, lack of authentic retail/restaurants, prevailing social/ political pressures often at odds with urbanist psychology Opportunities: » Development of market rate apartments, renewal of retail along Main Street, any development that will create unique authentic place-making, nightlife amenities responsive to growing downtown population, retail amenities responsive to shifting demographics Threats: » Pressure against mass transit decision to locate transit above- ground, proscriptive zoning, traffic congestion to Seattle, lack of authenticity/character, concentration of high-priced apartments Ballard Strengths: » Unmatched ‘coolness’ and caché, concentration of authentic boutique retail, great neighborhood setting, good single family options close to retail core, walkability, availability of buildings for adaptive reuse development, relative proximity to Seattle’s urban core, the “Ballard” brand Weaknesses: » Limited transit routes to urban cores, lack of immediate freeway access, distance to Eastside employers Opportunities: » Fantastic momentum in development community capital mar- kets, development of boutique apartments/condos/townhomes, development of retail much needed office space, infill between Ballard and Fremont (aka Frelard or SoBa) Threats: » Result of explosive growth is unknown, potential oversupply of high-priced apartments, increased congestion/traffic on arterials to job centers Urban Neighborhood S.W.O.T. Analysis
- 11. Colliers International Seattle 11 Dylan Simon | 206 414 8575 | www.dylansimon.com 2014 Seattle Multifamily urban market study Based on data provided by Dupre + Scott Rent and Vacancy Data as of Fall 2013 *Average rent for buildings with 50+units, built after 1950 †Historical Cumulative rent growth for buildings with 5+ units, built after 1900 BallardbelltownSouthDowntown/ PioneerSquarecapitolHillfirsthillqueenanneDowntown GreenLake/ wallingford/ Fremont southlakeunionWestbellevueuniversity districtwestseattle 1 1021 Pine Street 1021 Pine Street Units: 20 Delivery: 1Q 2017 Developer: Legacy Commercial 2 Western University 1301 Western Avenue Units: 180 Delivery: 2Q 2016 Developer: Mack Urban 3 815 Pine 815 Pine Street Units: 386 Delivery: 4Q 2014 Developer: Holland Residential 4 Ava 802 Pine Street Units: 200 Delivery: 4Q 2016 Developer: Executive Group of Companies 5 9 + Pine 1601 9th Avenue Units: 74 Delivery: 4Q 2014 Developer: Teutsch Partners 6 Viktoria 1915 2nd Avenue Units: 249 Delivery: 2014 Developer: Goodman Real Estate 7 2nd and Pine 1608 2nd Avenue Units: 398 Delivery: 1Q 2017 Developer: Equity Residential 8 2030 8th Avenue 2030 8th Avenue Units: 355 Delivery: 2Q 2015 Developer: GID Urban Development Group 9 807 Stewart Street 807 Stewart Street Units: 150 Delivery: 2Q 2016 Developer: RC Hedreen 10 2nd Virginia - South tower 1933 2nd Avenue Units: 150 Delivery: Early planning or on Hold Developer: Credence Equity 11 West Edge Tower 1430 2nd Avenue Units: 157 Delivery: Early planning or on Hold Developer: Urban Visions 12 1200 Stewart 1200 Stewart Street Units: 550 Delivery: Early planning or on Hold Developer: Lexas Companies 13 1812 Boren Avenue 1812 Boren Avenue Units: 400 Delivery: Early planning or on Hold Developer: Touchstone Corporation 14 2101 9th Avenue 2101 9th Avenue Units: 300 Delivery: Early planning or on Hold Developer: GID Urban Development Group 15 2208 8th Avenue 2208 8th Avenue Units: 450 Delivery: Early planning or on Hold Developer: Beebe Realty 16 Kinects 1823 Minor Avenue Units: 344 Delivery: Early planning or on Hold Developer: Security Properties 7 9 1 11 12 1314 15 16 3 5 10 2 4 6 8 Under construction early planning Downtown $ 2.45average RENT peR square fooT* Vacancy 4.0 3.5 3.0 2.5 2.0 1.5 1.0 0.0 3.9% historical cumulative rent growth trend† 19.7% 3-year 35.8% 10-year Deliveries 2014 2015 2016 2017 Future 709 355 530 418 2,351
- 12. Colliers International Seattle 12 Dylan Simon | 206 414 8575 | www.dylansimon.com 2014 Seattle Multifamily urban market study Based on data provided by Dupre + Scott Rent and Vacancy Data as of Fall 2013 *Average rent for buildings with 50+units, built after 1950 †Historical Cumulative rent growth for buildings with 5+ units, built after 1900 BallardbelltownSouthDowntown/ PioneerSquarecapitolHillfirsthillqueenanneDowntown GreenLake/ wallingford/ Fremont southlakeunionWestbellevueuniversity districtwestseattle 1 Wave 201 S King Street Units: 333 Delivery: 3Q 2014 Developer: Daniels Real Estate 2 310 4th Avenue S 310 4th Avenue S Units: 158 Delivery: 4Q 2015 Developer: Goodman Real Estate 3 Civic Square 601 4th Avenue Units: 192 Delivery: Early planning or on Hold Developer: Triad Development 4 80 S Main Street 80 S Main Street Units: 50 Delivery: Early planning or on Hold Developer: Goodman Real Estate 5 Stadium Terrace 589 Occidental Avenue S Units: 105 Delivery: Early Planning Developer: Lakeside Capital Management 1 3 5 2 4 Under construction early planning $ 2.45average RENT per square fooT* Vacancy 4.0 3.5 3.0 2.5 2.0 1.5 1.0 0.0 3.9% historical cumulative rent growth trend† 19.7% 3-year 35.8% 10-year Deliveries 2014 2015 2016 2017 Future 333 158 0 0 347 south Downtown/ Pioneer square
- 13. Colliers International Seattle 13 Dylan Simon | 206 414 8575 | www.dylansimon.com 2014 Seattle Multifamily urban market study Based on data provided by Dupre + Scott Rent and Vacancy Data as of Fall 2013 *Average rent for buildings with 50+units, built after 1950 †Historical Cumulative rent growth for buildings with 5+ units, built after 1900 BallardbelltownSouthDowntown/ PioneerSquarecapitolHillfirsthillqueenanneDowntown GreenLake/ wallingford/ Fremont southlakeunionWestbellevueuniversity districtwestseattle 7 1 9 3 5 8 2 11 19 13 21 29 15 23 31 17 25 33 27 35 12 20 14 22 30 16 24 32 18 26 34 36 4 6 Under construction early planning 1 10th Union 954 E Union Street Units: 79 Delivery: 1Q 2014 Developer: Seawest Inv. Assoc. 2 1200 E Pike Street 1200 E Pike Street Units: 88 Delivery: 1Q 2015 Developer: Tarragon 3 1420 E Madison Street 1420 E Madison Street Units: 70 Delivery: 3Q 2015 Developer: Metropolitan Homes 4 1427 11th Avenue 1427 11th Avenue Units: 136 Delivery: 3Q 2016 Developer: Mill Creek Resid. 5 1650 E Olive Way 1650 E Olive Way Units: 78 Delivery: 3Q 2014 Developer: BO Development 6 505 11th Avenue E 505 11th Avenue E Units: 22 Delivery: 2Q 2015 Developer: Nik | Chick 7 611 E Howell Street 611 E Howell Street Units: 25 Delivery: 1Q 2016 8 Broadstone Capitol Hill 1020 E Union Street Units: 248 Delivery: 4Q 2015 Developer: Alliance Residential 9 East John 1117 E John Stree Units: 47 Delivery: 4Q 2015 Developer: Paar Development 10 Gatsby 1145 10th Avenue E Units: 70 Delivery: 2Q 2014 Developer: Continental 11 Harvard Estates 515 Harvard Avenue E Units: 73 Delivery: 2Q 2015 Developer: Barrientos LLC 12 Havard Flats 802 E Thomas Street Units: 70 Delivery: 2Q 2015 Developer: WRP Associates 13 Hollywood Lofts 127 Broadway Avenue E Units: 24 Delivery: 1Q 2015 Developer: Barrientos LLC 14 Lexicon 120 Harvard Avenue E Units: 38 Delivery: 3Q 2014 Developer: Barrientos LLC 15 Local 422 422 Summit Avenue E Units: 48 Delivery: 2Q 2015 Developer: InCity Properties 16 REO Flats 1515 14th Avenue Units: 108 Delivery: 2Q 2014 Developer: Madrona 17 Sola 24 109 12th Avenue E Units: 23 Delivery: 2Q 2014 Developer: Sola 16 LLC 18 Stream Belmont 500 Belmont Avenue E Units: 71 Delivery: 2Q 2014 Developer: Stream RE 19 Summit 1728 Summit Avenue Units: 41 Delivery: 1Q 2015 Developer: Triad Capital 20 Sunset Electric Bldg. 1530 11th Avenue Units: 92 Delivery: 2Q 2014 Developer: Wolff Company 21 Viva 1111 E Union Street Units: 105 Delivery: 2Q 2014 Developer: Alliance Residential 22 Westside 801 E Thomas Street Units: 48 Delivery: 2Q 2014 Developer: WRP Associates 23 Yardhouse Flats 1406 E Republican Street Units: 35 Delivery: 3Q 2014 Developer: Revolve Dev. 24 Stream Fifteen 605 15th Avenue Units: 34 Delivery: 2Q 2015 Developer: Stream RE 25 Weatherford 133 14th Avenue E Units: 42 Delivery: 3Q 2014 Developer: Murray Franklyn 26 1600 E John 1600 E John Street Units: 39 Delivery: 4Q 2014 Developer: Trinity Real Estate 27 133 18th Avenue E 133 18th Avenue E Units: 50 Delivery: 3Q 2015 Developer: Odegard Gockel 28 Larson Building 3206 Havard Avenue E Units: 47 Delivery: 3Q 2015 29 Charbern II 1713 Belmont Avenue Units: 36 Delivery: Early Planning Developer: Epic Asset Mgmt. 30 123 Bellevue Avenue E 123 Bellevue Avenue E Units: 100 Delivery: Early Planning 31 Sound Transit Site A 150 Broadway Avenue E Units: 132 Delivery: Early Planning 32 Sound Transit Site B North 175 10th Avenue E Units: 86 Delivery: Early Planning 33 Sound Transit Site B South 125 10th Avenue E Units: 85 Delivery: Early Planning 34 Sound Transit Site C 1830 Broadway Avenue Units: 94 Delivery: Early Planning 35 Sound Transit Site D 1821 Broadway Avenue Units: 44 Delivery: Early Planning 36 1312 E Olive Street 1312 E Olive Street Units: 41 Delivery: Early planning Developer: SECO Development 28 10 $ 2.31average RENT peR square fooT* Vacancy 4.0 3.5 3.0 2.5 2.0 1.5 1.0 0.0 2.7% historical cumulative rent growth trend 21.7% 3-year 56.4% 10-year Deliveries 2014 2015 2016 2017 Future 828 862 161 0 618 capitol hill
- 14. Colliers International Seattle 14 Dylan Simon | 206 414 8575 | www.dylansimon.com 2014 Seattle Multifamily urban market study Based on data provided by Dupre + Scott Rent and Vacancy Data as of Fall 2013 *Average rent for buildings with 50+units, built after 1950 †Historical Cumulative rent growth for buildings with 5+ units, built after 1900 BallardbelltownSouthDowntown/ PioneerSquarecapitolHillfirsthillqueenanneDowntown GreenLake/ wallingford/ Fremont southlakeunionWestbellevueuniversity districtwestseattle 1 AVA Capitol Hill 600 E Pike Street Units: 249 Delivery: 3Q 2015 Developer: Avalon Bay Communities 2 Cielo 802 Seneca Street Units: 335 Delivery: 2Q 2015 Developer: Laconia Development 3 Cue 721 E Pine Street Units: 95 Delivery: 2Q 2015 Developer: OS Partners 4 Dunn Automotive 501 E Pike Street Units: 104 Delivery: 4Q 2015 Developer: Hunters Capital 5 Excelsior 301 E Pine Street Units: 205 Delivery: 4Q 2015 Developer: Madison Development 6 Pike Motorworks 714 E Pike Street Units: 260 Delivery: 3Q 2015 Developer: Wolff Company 7 Three20 320 E Pine Street Units: 131 Delivery: 1Q 2014 Developer: Stratford Company 8 1013 8th Avenue 1013 8th Avenue Units: 200 Delivery: Early Planning 9 601 E Pike Street 601 E Pike Street Units: 60 Delivery: Early Planning Developer: Intracorp 10 800 Columbia Street 800 Columbia Street Units: 287 Delivery: Early Planning Developer: Credence Equity 11 Harbor Vista 500 Terry Avenue Units: 329 Delivery: Early Planning Developer: Credence Equity 7 1 9 11 35 8 10 2 4 6 Under construction early planning $ 2.32average RENT peR square fooT* Vacancy 4.0 3.5 3.0 2.5 2.0 1.5 1.0 0.0 2.9% historical cumulative rent growth trend† 31.5% 3-year 63.7% 10-year Deliveries 2014 2015 2016 2017 Future 131 1,248 0 0 876 first hill
- 15. Colliers International Seattle 15 Dylan Simon | 206 414 8575 | www.dylansimon.com 2014 Seattle Multifamily urban market study Based on data provided by Dupre + Scott Rent and Vacancy Data as of Fall 2013 *Average rent for buildings with 50+units, built after 1950 †Historical Cumulative rent growth for buildings with 5+ units, built after 1900 BallardbelltownSouthDowntown/ PioneerSquarecapitolHillfirsthillqueenanneDowntown GreenLake/ wallingford/ Fremont southlakeunionWestbellevueuniversity districtwestseattle 1 3031 Western Avenue 3031 Western Avenue Units: 100 Delivery: 4Q 2016 Developer: Martin Selig Real Estate 2 4th and Denny 2720 4th Avenue Units: 161 Delivery: 4Q 2015 Developer: HB Capital 3 Potala Tower Seattle 2116 4th Avenue Units: 342 Delivery: 4Q 2016 Developer: Dargey Enterprises 4 N-Habit Belltown 2217 3rd Avenue Units: 49 Delivery: 2014 Developer: Daly Partners 5 Walton Lofts 2521 Western Avenue Units: 137 Delivery: 3Q 2015 Developer: Schuster Group 6 ArtHouse 2334 Elliott Avenue Units: 139 Delivery: 2Q 2014 Developer: The Pauls Corporation 7 Car Toys Building 307 Broad Street Units: 150 Delivery: 4Q 2017 Developer: HB Capital 8 Dimension by Alta 2625 3rd Avenue Units: 298 Delivery: 3Q 2014 Developer: Wood Partners 9 600 Wall 600 Wall Street Units: 310 Delivery: 4Q 2016 Developer: Laconia Development 10 1601 2nd Avenue 1601 2nd Avenue Units: 367 Delivery: Early planning or on Hold Developer: Principal Financial Group 11 2603 3rd Avenue 2603 3rd Avene Units: 100 Delivery: Early planning or on Hold Developer: HB Capital 12 2nd Wall 210 Wall Street Units: 327 Delivery: Early planning or on Hold Developer: Bentall Kennedy 13 3rd Virginia 2000 3rd Avenue Units: 493 Delivery: Early planning or on Hold Developer: Bentall Kennedy 92 3 1 4 6 11 13 10 8 12 5 7 Under construction early planning $ 2.45average RENT peR square fooT* Vacancy 4.0 3.5 3.0 2.5 2.0 1.5 1.0 0.0 3.9% historical cumulative rent growth trend† 19.7% 3-year 35.8% 10-year Deliveries 2014 2015 2016 2017 Future 486 298 752 150 1,287 belltown
- 16. Colliers International Seattle 16 Dylan Simon | 206 414 8575 | www.dylansimon.com 2014 Seattle Multifamily urban market study Based on data provided by Dupre + Scott Rent and Vacancy Data as of Fall 2013 *Average rent for buildings with 50+units, built after 1950 †Historical Cumulative rent growth for buildings with 5+ units, built after 1900 BallardbelltownSouthDowntown/ PioneerSquarecapitolHillfirsthillqueenanneDowntown GreenLake/ wallingford/ Fremont southlakeunionWestbellevueuniversity districtwestseattle 1 101 John 101 John Street Units: 20 Delivery: 1Q 2015 Development: Indonesian Developments 2 306 QA 306 Queen Anne Avenue N Units: 53 Delivery: 2Q 2014 Development: Gramor Development 3 3rd Republican 500 3rd Avenue W Units: 76 Delivery: 3Q 2014 Development: Continental Properties 4 Astro 315 1st Avenue N Units: 212 Delivery: 2Q 2015 Development: SRM Development 5 Canvas 600 Elliott Avenue W Units: 124 Delivery: 4Q 2014 Development: Goodman Real Estate 6 N-Habit Etruria 22 Etruria Street Units: 103 Delivery: 1Q 2016 Development: Daly Partners 7 Queen Anne Flats 521 2nd Avenue W Units: 33 Delivery: 1Q 2015 Development: Isola Homes 8 Queen Anne Towne 1900 Queen Anne Avenue N Units: 126 Delivery: 2Q 2014 Development: Emerald Bay Equity 9 14 W Roy Street 14 W Roy Street Units: 77 Delivery: Early Planning Development: Metropolitan Homes 10 221 W Republican 221 W Republican Street Units: 37 Delivery: Early Planning Development: CJD Investments 1 10 3 4 2 5 7 9 6 8 Under construction early planning $ 2.26average RENT peR square fooT* Vacancy 4.0 3.5 3.0 2.5 2.0 1.5 1.0 0.0 2.7% historical cumulative rent growth trend† 22.8% 3-year 52.6% 10-year Deliveries 2014 2015 2016 2017 Future 379 265 103 0 114 Queen Anne
- 17. Colliers International Seattle 17 Dylan Simon | 206 414 8575 | www.dylansimon.com 2014 Seattle Multifamily urban market study Based on data provided by Dupre + Scott Rent and Vacancy Data as of Fall 2013 *Average rent for buildings with 50+units, built after 1950 †Historical Cumulative rent growth for buildings with 5+ units, built after 1900 BallardbelltownSouthDowntown/ PioneerSquarecapitolHillfirsthillqueenanneDowntown GreenLake/ wallingford/ Fremont southlakeunionWestbellevueuniversity districtwestseattle 1 Century 101 Taylor Avenue N Units: 258 Delivery: 3Q 2014 Developer: SRM Development 2 1120 John Street 1120 John Street Units: 800 Delivery: 3Q 2017 Developer: Onni Group 3 201 Westlake 201 Westlake Avenue N Units: 78 Delivery: 4Q 2015 Developer: MacFarlane Partners 4 810 Dexter 810 Dexter Avenue N Units: 370 Delivery: 2Q 2016 Developer: Holland Residential 5 8th Republican 430 8th Avenue N Units: 211 Delivery: 4Q 2015 Developer: Wolff Company 6 8th Thomas 777 Thomas Street Units: 174 Delivery: 3Q 2015 Developer: MacFarlane Partners 7 AMLI SLU I 1260 Republican Street Units: 175 Delivery: 2Q 2014 Developer: AMLI Residential 8 AMLI SLU II 528 Pontius Avenue N Units: 118 Delivery: 2Q 2015 Developer: AMLI Residential 9 Aperture on Fifth 500 John Street Units: 106 Delivery: 3Q 2014 Developer: L P Partners 10 Cascade 221 Minor Avenue N Units: 264 Delivery: 2Q 2016 Developer: Equity Residential 11 Cascade II 222 Fairview Avenue N Units: 225 Delivery: 2Q 2016 Developer: Equity Residential 12 Elan South Lake Union 400 Boren Avenue N Units: 282 Delivery: 3Q 2015 Developer: Greystar Development 13 Florist Block 1255 Harrison Street Units: 375 Delivery: 2Q 2017 Developer: Vulcan Northwest 14 Hyatt House 416 John Street Units: 56 Delivery: 1Q 2015 Developer: Kauri Investments 15 Rivet 1201 Mercer Street Units: 134 Delivery: 1Q 2014 Developer: Holland Residential 16 True North 801 Dexter Avenue N Units: 286 Delivery: 1Q 2014 Developer: Holland Residential 17 435 Dexter Avenue 435 Dexter Avenue Units: 275 Delivery: 1Q 2017 Developer: Mill Creek Residential 18 901 Harrison Street 901 Harrison Street Units: 200 Delivery: 2Q 2017 Developer: MacFarlane Partners 19 N-Habit Dexter 1701 Dexter Avenue N Units: 66 Delivery: 3Q 2015 Developer: Daly Partners 20 1415 Dexter Avenue N 1415 Dexter Avenue N Units: 62 Delivery: 1Q 2016 21 1101 Westlake Avenue N 1101 Westlake Avenue N Units: 500 Delivery: Early Planning Developer: Holland Residential 22 624 Yale Avenue N 624 Yale Avenue N Units: 200 Delivery: Early planning or on Hold Developer: Blume Company 23 Mercer Blocks 550 Dexter Avenue N Units: 200 Delivery: Early planning or on Hold Developer: Vulcan Northwest 24 Denny/Fairview 105 Fairview Avenue N Units: 300 Delivery: Early planning or on Hold Developer: Onni Group 1 17 18 19 20 21 22 314 5 16 4 2 15 6 12 8 13 23 24 7 119 10 Under construction early planning $ 2.45average RENT peR square fooT* Vacancy 4.0 3.5 3.0 2.5 2.0 1.5 1.0 0.0 3.9% historical cumulative rent growth trend† 19.7% 3-year 35.8% 10-year Deliveries 2014 2015 2016 2017 Future 959 985 921 1,650 1,200 south lake union
- 18. Colliers International Seattle 18 Dylan Simon | 206 414 8575 | www.dylansimon.com 2014 Seattle Multifamily urban market study Based on data provided by Dupre + Scott Rent and Vacancy Data as of Fall 2013 *Average rent for buildings with 50+units, built after 1950 †Historical Cumulative rent growth for buildings with 5+ units, built after 1900 BallardbelltownSouthDowntown/ PioneerSquarecapitolHillfirsthillqueenanneDowntown GreenLake/ wallingford/ Fremont southlakeunionWestbellevueuniversity districtwestseattle 1 5 3 2 6 11 8 10 14 7 12 9 13 4 Under construction early planning 1 1321 N 45th Street 1321 N 45th Street Units: 158 Delivery: 2Q 2015 Developer: Mack Urban 2 3801 Stone Way N 3801 Stone Way N Units: 277 Delivery: 4Q 2015 Developer: Legacy Partners 3 Phinney 6800 Greenwood Avenue N Units: 46 Delivery: 4Q 2015 Developer: Isola Capital Mgmt. 4 77 Aurora Avenue N 7612 Aurora Avenue N Units: 34 Delivery: 4Q 2015 5 85th 1st 101 NW 85th Street Units: 104 Delivery: 3Q 2015 Developer: Security Properties 6 AMLI Wallingford 3400 Wallingford Avenue N Units: 240 Delivery: 3Q 2015 Developer: AMLI Residential 7 Fremont Green 3601 Greenwood Avenue N Units: 64 Delivery: 2Q 2015 Developer: Gramor Development 8 Greenlake Village 7104 Woodlawn Avenue NE Units: 297 Delivery: 2014 Developer: Lorig Associates 9 Pillar Properties Stone Way 4106 Stone Way N Units: 125 Delivery: 3Q 2016 Developer: Pillar Properties 10 Ray 3636 Stone Way N Units: 119 Delivery: 2Q 2015 Developer: Mack Urban 11 Velo 3635 Woodland Park Avenue N Units: 171 Delivery: 3Q 2014 Developer: Mack Urban 12 6010 Phinney Avenue N 6010 Phinney Avenue N Units: 23 Delivery: Early Planning Developer: Horizon Realty Advisors 13 7216 Aurora Avenue N 7216 Aurora Avenue N Units: 34 Delivery: Early Planning Developer: Lee Associates 14 414 NE Ravenna Blvd 414 NE Ravenna Blvd, Seattle Units: 62 Delivery: Early Planning Developer: Royal Arms C.P. $ 2.37average RENT peR square fooT* Vacancy 4.0 3.5 3.0 2.5 2.0 1.5 1.0 0.0 1.7% historical cumulative rent growth trend† 16.9% 3-year 46.7% 10-year Deliveries 2014 2015 2016 2017 Future 468 1,042 125 0 119 green lake/ wallingford/ fremont
- 19. Colliers International Seattle 19 Dylan Simon | 206 414 8575 | www.dylansimon.com 2014 Seattle Multifamily urban market study Based on data provided by Dupre + Scott Rent and Vacancy Data as of Fall 2013 *Average rent for buildings with 50+units, built after 1950 †Historical Cumulative rent growth for buildings with 5+ units, built after 1900 BallardbelltownSouthDowntown/ PioneerSquarecapitolHillfirsthillqueenanneDowntown GreenLake/ wallingford/ Fremont southlakeunionWestbellevueuniversity districtwestseattle 1 12th Avenue Studios 4123 12th Avenue NE Units: 102 Delivery: 3Q 2014 Developer: Triad Capital 2 Bayview 2249 NE 49th Street Units: 20 Delivery: 3Q 2015 Developer: Newmark Realty 3 4717 Brooklyn Avenue NE 4717 Brooklyn Avenue NE Units: 56 Delivery: 3Q 2015 Developer: Fields Holdings 4 4750 Roosevelt Way NE 4750 Roosevelt Way NE Units: 60 Delivery: 2Q 2015 Developer: AT Investments 5 5000 University Way NE 5000 University Way NE Units: 115 Delivery: 4Q 2015 Developer: Cohanim LLC 6 Square One 1020 NE 63rd Street Units: 112 Delivery: 2Q 2014 Developer: Intracorp 7 Bridges @ 11th 4557 11th Avenue NE Units: 184 Delivery: 3Q 2015 Developer: Security Properties 8 Brooklyn Court 6515 Brooklyn Avenue NE Units: 110 Delivery: 4Q 2017 Developer: HB Capital 9 Roosevelt I 6503 15th Avenue NE Units: 200 Delivery: 3Q 2017 Developer: HB Capital 10 Roosevelt II 6505 15th Avenue NE Units: 220 Delivery: 3Q 2017 Developer: HB Capital 11 41st Street Studios 4106 12th Avenue NE Units: 106 Delivery: 3Q 2014 Developer: Triad Development 12 Lavita 4055 8th Avenue NE Units: 60 Delivery: 1Q 2015 Developer: Money Grass 13 N-Habit Roosevelt 4737 Roosevelt Way NE Units: 65 Delivery: 4Q 2015 Developer: Daly Partners 14 Lightbox 4545 8th Avenue NE Units: 162 Delivery: 2Q 2014 Developer: Intracorp 15 Rooster 835 NE 66th Street Units: 194 Delivery: 3Q 2015 Developer: Lake Union Partners 16 7th Avenue NE Studios 4029 7th Avenue NE Units: 75 Delivery: 4Q 2014 Developer: Triad Capital 17 800 NE 67th Street 800 NE 67th Street Units: 270 Delivery: 4Q 2015 Developer: Mack Urban 18 Genesis 4041 Roosevelt Way NE Units: 214 Delivery: 4Q 2017 Developer: Vulcan Northwest 19 47+7 4558 7th Avenue NE Units: 24 Delivery: 3Q 2014 Developer: Wallace Properties 20 Brooklyn Place 4128 Brooklyn Avenue NE Units: 84 Delivery: Early planning Developer: Horizon Realty 21 4710 11th Avenue NE 4710 11th Avenue NE Units: 40 Delivery: Early planning Developer: Money Grass 22 5260 University Way NE 5260 University Way NE Units: 68 Delivery: Early planning Developer: Ying Development 23 4302 7th Avenue NE 4302 7th Avenue NE Units: 47 Delivery: Early Planning Developer: 12 Bellevue Int’l. 24 4555 Roosevelt Way NE 4555 Roosevelt Way NE Units: 168 Delivery: Early Planning Developer: Amer. Campus 25 Academia Court 4039 8th Avenue NE Units: 59 Delivery: Early Planning Developer: Lukito Development 1 10 21 22 4 3 2 5 7 9 20 23 24 25 11 12 14 16 18 13 15 17 19 6 8 Under construction early planning $ 1.84average RENT peR square fooT* Vacancy 4.0 3.5 3.0 2.5 2.0 1.5 1.0 0.0 2.9% historical cumulative rent growth trend† 14.0% 3-year 40.8% 10-year Deliveries 2014 2015 2016 2017 Future 581 1,024 0 744 466 university district
- 20. Colliers International Seattle 20 Dylan Simon | 206 414 8575 | www.dylansimon.com 2014 Seattle Multifamily urban market study Based on data provided by Dupre + Scott Rent and Vacancy Data as of Fall 2013 *Average rent for buildings with 50+units, built after 1950 †Historical Cumulative rent growth for buildings with 5+ units, built after 1900 BallardbelltownSouthDowntown/ PioneerSquarecapitolHillfirsthillqueenanneDowntown GreenLake/ wallingford/ Fremont southlakeunionWestbellevueuniversity districtwestseattle 7 9 3 5 8 2 11 19 13 21 15 23 24 17 12 20 14 22 16 18 4 6 Under construction early planning 1 3210 California Avenue SW 3210 California Avenue SW Units: 149 Delivery: 4Q 2015 Developer: Intracorp 2 3829 California Avenue SW 3829 California Avenue SW Units: 29 Delivery: 3Q 2015 Developer: Arrow Construction 3 4400 Alaska 4400 SW Alaska Street Units: 40 Delivery: 4Q 2015 Developer: Isola Capital Mgmt. 4 4435 35th Avenue SW 4435 35th Avenue SW Units: 159 Delivery: 4Q 2015 Developer: Trinsic Residential 5 4505 42nd Avenue SW 4505 42nd Avenue SW Units: 50 Delivery: 2Q 2016 Developer: CAPCO Investments 6 4730 4730 California Avenue SW Units: 88 Delivery: 4Q 2014 Developer: Wolff Company 7 Whittaker 4755 Fauntleroy Way SW Units: 372 Delivery: 4Q 2016 Developer: Lennar Multifamily 8 6917 California Avenue SW 6919 California Avenue SW Units: 30 Delivery: 4Q 2015 Developer: Soleil Development 9 9030 35th Avenue SW 9030 35th Avenue SW Units: 40 Delivery: 1Q 2015 Developer: Linardic Design Group 10 Blake 5020 California Avenue SW Units: 103 Delivery: 3Q 2014 Developer: FM Development 11 Broadstone Sky 4745 40th Avenue SW Units: 151 Delivery: 2Q 2015 Developer: Alliance Residential 12 Junction Flats 4433 42nd Avenue SW Units: 80 Delivery: 4Q 2015 Developer: BCK Investments 13 Lofts at the Junction 4535 44th Avenue SW Units: 38 Delivery: 3Q 2015 Developer: Vending Solutions 14 Oregon 42 4502 42nd Avenue SW Units: 133 Delivery: 1Q 2014 Developer: ConAm 15 Spruce West Seattle 3922 SW Alaska Street Units: 216 Delivery: 4Q 2014 Developer: Madison Development 16 Vue 3261 SW Avalon Way Units: 111 Delivery: 1Q 2014 Developer: CFD LLC 17 West Seattle Junction 4730 California Avenue SW Units: 206 Delivery: 2Q 2015 Developer: Equity Residential 18 3064 SW Avalon Way 3064 SW Avalon Way Units: 108 Delivery: Early planning Developer: Nor Pac Equities 19 Aqua Bella 3303 Harbor Avenue SW Units: 97 Delivery: Early planning Developer: Cadence Real Estate 20 Elliot Tire Site 4441 Fauntleroy Way SW Units: 60 Delivery: Early planning 21 4515 41st Avenue SW 4515 41st Avenue SW Units: 75 Delivery: Early planning Developer: BCK Investments 22 4532 42nd Avenue SW 4532 42nd Avenue SW Units: 35 Delivery: Early planning Developer: Golden Stream 4106 23 3078 SW Avalon Way 3078 SW Avalon Way Units: 102 Delivery: Early planning Developer: Arrow Construction 24 4106 Delridge Way SW 4106 Delridge Way SW Units: 30 Delivery: Early planning Developer: Simpson Simpson 10 1 $ 1.76 average RENT peR square fooT* Vacancy 4.0 3.5 3.0 2.5 2.0 1.5 1.0 0.0 3.2% historical cumulative rent growth trend† 18.7% 3-year 58.9% 10-year Deliveries 2014 2015 2016 2017 Future 651 922 422 0 507 west Seattle
- 21. Colliers International Seattle 21 Dylan Simon | 206 414 8575 | www.dylansimon.com 2014 Seattle Multifamily urban market study Based on data provided by Dupre + Scott Rent and Vacancy Data as of Fall 2013 *Average rent for buildings with 50+units, built after 1950 †Historical Cumulative rent growth for buildings with 5+ units, built after 1900 BallardbelltownSouthDowntown/ PioneerSquarecapitolHillfirsthillqueenanneDowntown GreenLake/ wallingford/ Fremont southlakeunionWestbellevueuniversity districtwestseattle 1 1436 NW 62nd Street 1436 NW 62nd Street Units: 27 Delivery: 3Q 2015 Developer: Greenbuild Development 2 5601 22nd Avenue NW 5601 22nd Avenue NW Units: 82 Delivery: 2Q 2016 3 AMLI Ballard 2428 NW Market Street Units: 304 Delivery: 3Q 2014 Developer: AMLI Residential 4 Ballard Tallman 5343 Tallman Avenue NW Units: 303 Delivery: 3Q 2015 Developer: Equity Residential 5 Ballard West 5711 24th Avenue NW Units: 111 Delivery: 1Q 2015 Developer: Pryde + Johnson 6 Crown Hill 8026 15th Avenue NW Units: 25 Delivery: 4Q 2014 Developer: Goodman Real Estate 7 Urbana 1501 NW Market Street Units: 287 Delivery: 1Q 2014 Developer: Equity Residential 8 7016 15th Avenue NW 7016 15th Avenue NW Units: 90 Delivery: Early Planning 9 Ballard Lofts 6404 24th Avenue NW Units: 72 Delivery: Early Planning Developer: William Parks Inc 10 1762 NW 59th Street 1762 NW 59th Street Units: 25 Delivery: Early Planning 11 2248 NW 64th Street 2248 NW 64th Street Units: 24 Delivery: Early Planning Developer: William Parks Inc 7 1 9 3 5 8 2 10 11 4 6 Under construction early planning $ 2.28average RENT peR square fooT* Vacancy 4.0 3.5 3.0 2.5 2.0 1.5 1.0 0.0 3.1% historical cumulative rent growth trend† 29.6% 3-year 101.7% 10-year Deliveries 2014 2015 2016 2017 Future 616 441 82 0 211 ballard
- 22. Colliers International Seattle 22 Dylan Simon | 206 414 8575 | www.dylansimon.com 2014 Seattle Multifamily urban market study Based on data provided by Dupre + Scott Rent and Vacancy Data as of Fall 2013 *Average rent for buildings with 50+units, built after 1950 †Historical Cumulative rent growth for buildings with 5+ units, built after 1900 BallardbelltownSouthDowntown/ PioneerSquarecapitolHillfirsthillqueenanneDowntown GreenLake/ wallingford/ Fremont southlakeunionWestbellevueuniversity districtwestseattle 1 1019 103rd Avenue NE 1019 103rd Avenue NE Units: 175 Delivery: 4Q 2015 Developer: Province Group 2 Alley 111 11011 NE 9th Street Units: 260 Delivery: 3Q 2015 Developer: Skanska 3 Bellevue Park II 88 102nd Avenue NE Units: 160 Delivery: 4Q 2015 Developer: Cantera Development Group 4 Bellevue Square Expansion 401 Bellevue Way NE Units: 249 Delivery: 2Q 2018 Developer: Kemper Development 5 Bellevue at Main 15 Bellevue Way SE Units: 262 Delivery: 2Q 2015 Developer: SRM Development 6 Lincoln Square II 410 Bellevue Way NE Units: 285 Delivery: 2Q 2017 Developer: Kemper Development 7 Main Street 10505 Main Street Units: 260 Delivery: 2Q 2015 Developer: Alamo Manhattan 8 Main Street Gateway 10360 Main Street Units: 370 Delivery: 4Q 2015 Developer: Vander Hoek Corp 9 Park Metro 11017 NE 12th Street Units: 78 Delivery: 2014 Developer: Evergreen Point Development 10 Soma Towers I 288 106th Avenue NE Units: 148 Delivery: 2Q 2014 Developer: SU Development 11 Soma Towers II 220 106th Avenue NE Units: 124 Delivery: 2Q 2016 Developer: SU Development 12 Tulum Downs 515 102nd Avenue SE Units: 40 Delivery: 3Q 2014 Developer: Diller Associates 13 Bellevue Plaza 10510 Main Street Units: 550 Delivery: Early planning Developer: United Dominion Realty 14 201 106th Avenue NE 201 106th Avenue NE Units: 100 Delivery: Early planning Developer: 12 Bellevue International Investment 15 437 108th Avenue NE 437 108th Avenue NE Units: 100 Delivery: Early planning Developer: NIU Enterprises 16 Cadillac Site I 1001 106th Avenue NE Units: 317 Delivery: Early planning Developer: United Dominion Realty 17 Cadillac Site II 1001 106th Avenue NE Units: 183 Delivery: Early planning Developer: United Dominion Realty 18 NOMA 10246 Main Street Units: 130 Delivery: Early planning Developer: Vander Hoek Corp 1 14 11 3 5 4 2 6 15 8 17 12 13 10 18 7 16 9 Under construction early planning $ 2.00average RENT peR square fooT* Vacancy 4.0 3.5 3.0 2.5 2.0 1.5 1.0 0.0 4.3% historical cumulative rent growth trend† 24.4% 3-year 64.6% 10-year Deliveries 2014 2015 2016 2017 Future 266 1,487 124 285 1,629 west bellevue
- 23. Colliers International Seattle 23 Dylan Simon | 206 414 8575 | www.dylansimon.com 2014 Seattle Multifamily urban market study This document has been prepared by Colliers International for advertising and general information only. Colliers International makes no guarantees, representations or warranties of any kind, expressed or implied, regarding the information including, but not limited to, warranties of content, accuracy and reliability. Any interested party should undertake their own inquiries as to the accuracy of the information. Colliers International excludes unequivocally all inferred or implied terms, conditions and warranties arising out of this document and excludes all liability for loss and damages arising there from. This publication is the copyrighted property of Colliers International and /or its licensor(s). © 2014. All rights reserved. Dylan P. Simon direct 206 624 7413 mobile 206 414 8575 dylan.simon@colliers.com Colliers International 601 Union Street, Suite 5300 Seattle, Washington 98101 206 223 0866 www.colliers.com From the Author With nearly all of King County’s new apartment development slated for urban centers and neighborhoods, never has it been more important to study emerging trends on a micro-market level, as well as take into consideration interplay between all asset classes – including retail and office. The intention of this study is to provide clearer optics into trends in Seattle’s urban centers and neighborhoods and thereby assist clients with investment theses for the development, acquisition and disposition of multifamily assets. Sales Specialties » Urban infill apartment complexes » $15M — $100M apartment complexes » Value-add of urban and suburban apartment complexes » Development land for apartments and mixed uses » Adaptive re-use and repositioning of obsolescent buildings Dylan Simon Investment Sales Follow my blog at: www.dylansimon.com