
Recommended
More Related Content
What's hot
What's hot (13)
Viewers also liked
Viewers also liked (20)
Similar to Mobile Spa Offerings and Demand Forecast Analysis
Similar to Mobile Spa Offerings and Demand Forecast Analysis (20)
More from doshihardik
More from doshihardik (17)
Mobile Spa Offerings and Demand Forecast Analysis
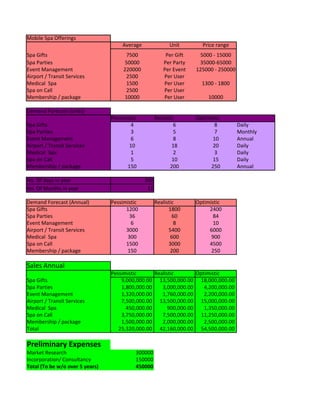
- 1. Mobile Spa Offerings Average Unit Price range Spa Gifts 7500 Per Gift 5000 - 15000 Spa Parties 50000 Per Party 35000-65000 Event Management 220000 Per Event 125000 - 250000 Airport / Transit Services 2500 Per User Medical Spa 1500 Per User 1300 - 1800 Spa on Call 2500 Per User Membership / package 10000 Per User 10000 Demand Forecast (units) Pessimistic Realistic Optimistic Spa Gifts 4 6 8 Daily Spa Parties 3 5 7 Monthly Event Management 6 8 10 Annual Airport / Transit Services 10 18 20 Daily Medical Spa 1 2 3 Daily Spa on Call 5 10 15 Daily Membership / package 150 200 250 Annual No. Of days in year 300 No. Of Months in year 12 Demand Forecast (Annual) Pessimistic Realistic Optimistic Spa Gifts 1200 1800 2400 Spa Parties 36 60 84 Event Management 6 8 10 Airport / Transit Services 3000 5400 6000 Medical Spa 300 600 900 Spa on Call 1500 3000 4500 Membership / package 150 200 250 Sales Annual Pessimistic Realistic Optimistic Spa Gifts 9,000,000.00 13,500,000.00 18,000,000.00 Spa Parties 1,800,000.00 3,000,000.00 4,200,000.00 Event Management 1,320,000.00 1,760,000.00 2,200,000.00 Airport / Transit Services 7,500,000.00 13,500,000.00 15,000,000.00 Medical Spa 450,000.00 900,000.00 1,350,000.00 Spa on Call 3,750,000.00 7,500,000.00 11,250,000.00 Membership / package 1,500,000.00 2,000,000.00 2,500,000.00 Total 25,320,000.00 42,160,000.00 54,500,000.00 Preliminary Expenses Market Research 300000 Incorporation/ Consultancy 150000 Total (To be w/o over 5 years) 450000
- 2. Fixed Assets No. Cost Pu Total cost Luxurious Spa Vans 10 8000000 80,000,000.00 Furniture and Fixtures (CO) 4,000,000.00 IT Infrastructure 1,000,000.00 Working Capital Margin 5,000,000.00 Total 90,000,000.00 Depreciation 20% Operating expenses Staff and Salaries 20% Lease Rental (CO) 750000 Pa Spa Kits/ Material 10% Marketing 1000000 pa Vehicle maintenance 7.50% Commission (Doctors / Event managers) 7.50% Miscellaneous Expenses 2.50% Capital Structure Equity 40,000,000.00 Debt (12%) 50,000,000.00 12% Debt/ Equity Ratio 1.25 Tax Rate 35% Ke 13% WACC 10.11%
- 3. 27.78% Sensitivity Analysis No. Of Vans 27.78% 7 8 9 10 11 No. Of person using Airport Services 10 27.78% 27.78% 27.78% 27.78% 27.78% 12 27.78% 27.78% 27.78% 27.78% 27.78% 14 27.78% 27.78% 27.78% 27.78% 27.78% 16 27.78% 27.78% 27.78% 27.78% 27.78% 18 27.78% 27.78% 27.78% 27.78% 27.78% 20 27.78% 27.78% 27.78% 27.78% 27.78% 22 27.78% 27.78% 27.78% 27.78% 27.78% 24 27.78% 27.78% 27.78% 27.78% 27.78% 26 27.78% 27.78% 27.78% 27.78% 27.78% 28 27.78% 27.78% 27.78% 27.78% 27.78% 30 27.78% 27.78% 27.78% 27.78% 27.78% 32 27.78% 27.78% 27.78% 27.78% 27.78% 34 27.78% 27.78% 27.78% 27.78% 27.78%
- 5. f Vans 12 13 14 27.78% 27.78% 27.78% 27.78% 27.78% 27.78% 27.78% 27.78% 27.78% 27.78% 27.78% 27.78% 27.78% 27.78% 27.78% 27.78% 27.78% 27.78% 27.78% 27.78% 27.78% 27.78% 27.78% 27.78% 27.78% 27.78% 27.78% 27.78% 27.78% 27.78% 27.78% 27.78% 27.78% 27.78% 27.78% 27.78% 27.78% 27.78% 27.78%
- 7. Cash Flows based On Realistic Estimates Year 1 Year 2 A Sales 42,160,000.00 50,592,000.00 Operating expenses Staff and Salaries 8,432,000.00 10,118,400.00 Spa Kits/ Material 4,216,000.00 5,059,200.00 Vehicle maintenance 3,162,000.00 3,794,400.00 Commission (Doctors / Event managers) 3,162,000.00 3,794,400.00 B Total Operating cost 18,972,000.00 22,766,400.00 C Gross Profit 23,188,000.00 27,825,600.00 Lease Rental (CO) 750000 825000 Marketing 1000000 1100000 Miscellaneous Expenses 1,054,000.00 1,264,800.00 Depreciation 18,000,000.00 18,000,000.00 Preliminary Exp( W/o) 90000 90000 PBIT 2,294,000.00 6,545,800.00 Interest Payment 5400000 4200000 PBT (3,106,000.00) 2,345,800.00 Tax - (266,070.00) PAT (3,106,000.00) 2,611,870.00 Year 0 Cash Flows to Equity (40,000,000.00) 14,984,000.00 20,701,870.00 Loan Repayments (10,000,000.00) (10,000,000.00) Total Cash Flows (40,000,000.00) 4,984,000.00 10,701,870.00 NPV 32,980,292.83 IRR 27.78% Cash Flow for total Funds (90,000,000.00) 18494000 23431870 Total Cash Flows (90,000,000.00) 18,494,000.00 23,431,870.00 NPV 28,717,618.20 IRR 19.12% DSCR Cash Flows 14,984,000.00 20,701,870.00 Interest 5400000 4200000
- 8. Total Cash Flows Before Payment 20,384,000.00 24,901,870.00 Obligations Term Loan Repayment 10,000,000.00 10,000,000.00 Interest Payments 5400000 4200000 Total Obligations 15,400,000.00 14,200,000.00 DSCR (NET) 1.32 1.75
- 9. Sales Growth rate Year 3 Year 4 Year 5 Year 6 Lease Rental Growth / Marketing exp 60,710,400.00 72,852,480.00 87,422,976.00 104,907,571.20 12,142,080.00 14,570,496.00 17,484,595.20 20,981,514.24 6,071,040.00 7,285,248.00 8,742,297.60 10,490,757.12 4,553,280.00 5,463,936.00 6,556,723.20 7,868,067.84 4,553,280.00 5,463,936.00 6,556,723.20 7,868,067.84 27,319,680.00 32,783,616.00 39,340,339.20 47,208,407.04 33,390,720.00 40,068,864.00 48,082,636.80 57,699,164.16 907500 998250 1098075 1207882.5 1210000 1331000 1464100 1610510 1,517,760.00 1,821,312.00 2,185,574.40 2,622,689.28 18,000,000.00 18,000,000.00 18,000,000.00 - 90000 90000 90000 - 11,665,460.00 17,828,302.00 25,244,887.40 52,258,082.38 3000000 1800000 600000 - 8,665,460.00 16,028,302.00 24,644,887.40 52,258,082.38 3,032,911.00 5,609,905.70 8,625,710.59 18,290,328.83 5,632,549.00 10,418,396.30 16,019,176.81 33,967,753.55 23,722,549.00 28,508,396.30 34,109,176.81 33,967,753.55 (10,000,000.00) (10,000,000.00) (10,000,000.00) 0 5,000,000.00 Release of WC Margin 13,722,549.00 18,508,396.30 24,109,176.81 38,967,753.55 25672549 29678396.3 34499176.81 33967753.55 5,000,000.00 Release of WC Margin 25,672,549.00 29,678,396.30 34,499,176.81 38,967,753.55 23,722,549.00 28,508,396.30 34,109,176.81 33,967,753.55 3000000 1800000 600000 0
- 10. 26,722,549.00 30,308,396.30 34,709,176.81 33,967,753.55 10,000,000.00 10,000,000.00 10,000,000.00 - 3000000 1800000 600000 0 13,000,000.00 11,800,000.00 10,600,000.00 - 2.06 2.57 3.27
- 11. Loan Amount Sales Growth rate 20% Loan Repayment & Interest Schedule Rate Lease Rental Growth / Marketing10% exp Repayment over 5 year Opening bal Loan repaid closing balance Interest Paid 50,000,000.00 10,000,000.00 40,000,000.00 5400000 40,000,000.00 10,000,000.00 30,000,000.00 4200000 30,000,000.00 10,000,000.00 20,000,000.00 3000000 20,000,000.00 10,000,000.00 10,000,000.00 1800000 10,000,000.00 10,000,000.00 - 600000 WC Margin WC Margin
- 13. 50,000,000.00 12% 10,000,000.00 Interest Paid