1. California Department of Education Policy and Evaluation Division
Calculation Spreadsheets for the 2007 Base API and 2008 Growth API
The following spreadsheets may be used to estimate a school's 2007 Base Academic Performance Index (API) or its 2008
Growth API. Schools must have valid test scores from at least 100 students to obtain an API. Schools that have between 11
and 99 valid test scores will receive an API denoted with an asterisk to indicate greater statistical uncertainty associated with
fewer scores.
The grade spans of the calculation spreadsheets have changed from the previous API reporting cycle. For the 2007-08 cycle,
calculation spreadsheets are provided for the following grade spans:
● Grade 2
● Grades 3-5 Students with Disabilities (SWD) Only*
● Grades 3-5 Students with Disabilities Not Included* (Non-SWD)
● Grade 6
● Grades 7-8
● Grades 9-12
● Bridge Schools that Cross Grade Spans
*A "Student with Disability" is defined as a student record that shows a valid Primary Disability code (other than 000).
Instructions
1. Select the spreadsheet(s) for your grade levels from the tabs below.
2. Apply the inclusion/exclusion and adjustment rules and valid API criteria to student test results. Refer to the rules in the
2007-08 Academic Performance Index Reports Information Guide on the API Web page at http://www.cde.ca.gov/api/.
3. Enter the number of students for whom there is a valid test score into each Performance Level/Band and Subject Area for the:
● California Standards Tests (CSTs), Grades 2-11
● California Alternate Performance Assessment (CAPA), Grades 2-11
● California Achievement Test, Sixth Edition Survey (CAT/6 Survey), Grades 3 and 7
● California High School Exit Examination (CAHSEE), Grades 10-12
4. Verify that all cells for Performance Level/Band and Content Area contain either a numerical entry or 0.
5. Schools or local educational agencies (LEAs) that "bridge" two or more spreadsheets will follow steps 1 through 4 above for each
spreadsheet for which they have a grade span. The calculated API score will be shown on the final "Bridge" spreadsheet.
Questions: Dana Kertel | aau@cde.ca.gov | 916-319-0863
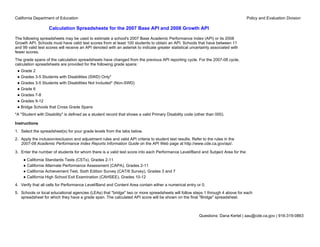
2. California Department of Education Policy and Evaluation Division
Calculation Spreadsheet for the 2007 Base API or 2008 Growth API
For Grade 2
Part I - School Test Data
California Standards Test (CST) and
California Alternate Performance Assessment
(CAPA)
Number of Valid Scores
by Content Area
Performance
Level
Performance
Weighting
Level English-
Factor
(fixed) Lanugage Arts Mathematics
(ELA)
1000 5 : Advanced 0 0
875 4 : Proficient 0 0
700 3 : Basic 0 0
500 2 : Below Basic 0 0
200 1 : Far Below Basic 0 0
Total Valid Scores 0 0
Verify that Part I data entry is complete (all cells = 0 or greater).
Part II - API Calculation
A B C D E F G H I J
Sum of
School
Performance Test
Total Content Scale
Test Valid Level Weight x
Content Area Weight Area Sum of F Calibration API
Weight Scores Weighting Scores
(from Part I) Weights ÷ Sum of D Factor Score
(fixed) (from Part I) Factors x
AxC (fixed)
Valid Scores AxE
D ÷ Sum of D
(from Part I)
0.48 CST/CAPA in ELA 0 0.00 0 0.00 0.000%
0.32 CST/CAPA in Math 0 0.00 0 0.00 0.000%
Total Values 0 0.00 0 0.00 0.000% 0.00 28.33 0
Questions: Dana Kertel | aau@cde.ca.gov | 916-319-0863
3. California Department of Education Policy and Evaluation Division
Calculation Spreadsheet for the 2007 Base API or 2008 Growth API
For Grades 3-5 Students with Disabilities Only
Part I - School Test Data
California Standards Test (CST) and California Achievement Test, Sixth Edition Survey (CAT/6)
California Alternate Performance Assessment (CAPA) (Grade 3 Only)
Number of Valid Scores Number of Valid Scores
by Content Area Performance by Content Area
Performance Performance
Band
Level Level
Performance
Weighting Weighting
Level English- National
Factor Science Factor
Lanugage Arts Mathematics Percentile Rank Reading Language Spelling Mathematics
(fixed) (Grade 5 Only) (fixed)
(ELA) (NPR)
1000 5 : Advanced 0 0 0 1000 5 : 80-99th NPR 0 0 0 0
875 4 : Proficient 0 0 0 875 4 : 60-79th NPR 0 0 0 0
700 3 : Basic 0 0 0 700 3 : 40-59th NPR 0 0 0 0
500 2 : Below Basic 0 0 0 500 2 : 20-39th NPR 0 0 0 0
200 1 : Far Below Basic 0 0 0 200 1 : 1-19th NPR 0 0 0 0
Total Valid Scores 0 0 0 Total Valid Scores 0 0 0 0
Verify that Part I data entry is complete (all cells = 0 or greater).
Part II - API Calculation
A B C D E F G H I J
Sum of
School
Performance Test
Total Content Scale
Test Valid Level Weight x
Content Area Weight Area Sum of F Calibration API
Weight Scores Weighting Scores
(from Part I) Weights ÷ Sum of D Factor Score
(fixed) (from Part I) Factors x
AxC (fixed)
Valid Scores AxE
D ÷ Sum of D
(from Part I)
0.48 CST/CAPA in ELA 0 0.00 0 0.00 0.000%
0.32 CST/CAPA in Math 0 0.00 0 0.00 0.000%
0.20 CST in Science 0 0.00 0 0.00 0.000%
0.06 CAT/6 in Reading 0 0.00 0 0.00 0.000%
0.03 CAT/6 in Language 0 0.00 0 0.00 0.000%
0.03 CAT/6 in Spelling 0 0.00 0 0.00 0.000%
0.08 CAT/6 in Mathematics 0 0.00 0 0.00 0.000%
Total Values 0 0.00 0 0.00 0.000% 0.00 -17.13 0
Questions: Dana Kertel | aau@cde.ca.gov | 916-319-0863
4. California Department of Education Policy and Evaluation Division
Calculation Spreadsheet for the 2007 Base API or 2008 Growth API
For Grades 3-5 Students with Disabilities Not Included
Part I - School Test Data
California Standards Test (CST) and California Achievement Test, Sixth Edition Survey (CAT/6)
California Alternate Performance Assessment (CAPA) (Grade 3 Only)
Number of Valid Scores Number of Valid Scores
by Content Area Performance by Content Area
Performance Performance
Band
Level Level
Performance
Weighting Weighting
Level English- National
Factor Science Factor
Lanugage Arts Mathematics Percentile Rank Reading Language Spelling Mathematics
(fixed) (Grade 5 Only) (fixed)
(ELA) (NPR)
1000 5 : Advanced 100 100 25 1000 5 : 80-99th NPR 0 0 0 0
875 4 : Proficient 100 100 25 875 4 : 60-79th NPR 0 0 0 0
700 3 : Basic 100 100 25 700 3 : 40-59th NPR 0 0 0 0
500 2 : Below Basic 100 100 25 500 2 : 20-39th NPR 0 0 0 0
200 1 : Far Below Basic 100 100 25 200 1 : 1-19th NPR 0 0 0 0
Total Valid Scores 500 500 125 Total Valid Scores 0 0 0 0
Verify that Part I data entry is complete (all cells = 0 or greater).
Part II - API Calculation
A B C D E F G H I J
Sum of
School
Performance Test
Total Content Scale
Test Valid Level Weight x
Content Area Weight Area Sum of F Calibration API
Weight Scores Weighting Scores
(from Part I) Weights ÷ Sum of D Factor Score
(fixed) (from Part I) Factors x
AxC (fixed)
Valid Scores AxE
D ÷ Sum of D
(from Part I)
0.48 CST/CAPA in ELA 500 240.00 227500 109200.00 60.000%
0.32 CST/CAPA in Math 500 160.00 227500 72800.00 40.000%
0.20 CST in Science 125 0.00 56875 0.00 0.000%
0.06 CAT/6 in Reading 0 0.00 0 0.00 0.000%
0.03 CAT/6 in Language 0 0.00 0 0.00 0.000%
0.03 CAT/6 in Spelling 0 0.00 0 0.00 0.000%
0.08 CAT/6 in Mathematics 0 0.00 0 0.00 0.000%
Total Values 1125 400.00 511875 182000.00 100.000% 455.00 28.31 483
Questions: Dana Kertel | aau@cde.ca.gov | 916-319-0863
5. California Department of Education Policy and Evaluation Division
Calculation Spreadsheet for the 2007 Base API or 2008 Growth API
For Grade 6
Part I - School Test Data
California Standards Test (CST) and
California Alternate Performance Assessment
(CAPA)
Number of Valid Scores
by Content Area
Performance
Level
Performance
Weighting
Level English-
Factor
(fixed) Lanugage Arts Mathematics
(ELA)
1000 5 : Advanced 0 0
875 4 : Proficient 0 0
700 3 : Basic 0 0
500 2 : Below Basic 0 0
200 1 : Far Below Basic 0 0
Total Valid Scores 0 0
Verify that Part I data entry is complete (all cells = 0 or greater).
Part II - API Calculation
A B C D E F G H I J
Sum of
School
Performance Test
Total Content Scale
Test Valid Level Weight x
Content Area Weight Area Sum of F Calibration API
Weight Scores Weighting Scores
(from Part I) Weights ÷ Sum of D Factor Score
(fixed) (from Part I) Factors x
AxC (fixed)
Valid Scores AxE
D ÷ Sum of D
(from Part I)
0.48 CST/CAPA in ELA 0 0.00 0 0.00 0.000%
0.32 CST/CAPA in Math 0 0.00 0 0.00 0.000%
Total Values 0 0.00 0 0.00 0.000% 0.00 28.32 0
Questions: Dana Kertel | aau@cde.ca.gov | 916-319-0863
6. California Department of Education Policy and Evaluation Division
Calculation Spreadsheet for the 2007 Base API or 2008 Growth API
For Grades 7-8
Part I - School Test Data
California Standards Test (CST) and California Achievement Test, Sixth Edition Survey (CAT/6)
California Alternate Performance Assessment (CAPA) (Grade 7 Only)
Number of Valid Scores Number of Valid Scores
by Content Area Performance by Content Area
Performance Performance
Band
Level Level
Performance
Weighting Mathematics History- Weighting
Level English- National
Factor *200 Pts. Social Science Factor
Language Arts Mathematics Percentile Rank Reading Language Spelling Mathematics
(fixed) Assignment Science (Grade 8 Only) (fixed)
(ELA) (NPR)
(Grade 8 Only) (Grade 8 Only)
1000 5 : Advanced 0 0 N/A 0 0 1000 5 : 80-99th NPR 0 0 0 0
875 4 : Proficient 0 0 N/A 0 0 875 4 : 60-79th NPR 0 0 0 0
700 3 : Basic 0 0 N/A 0 0 700 3 : 40-59th NPR 0 0 0 0
500 2 : Below Basic 0 0 N/A 0 0 500 2 : 20-39th NPR 0 0 0 0
200 1 : Far Below Basic 0 0 0 0 0 200 1 : 1-19th NPR 0 0 0 0
Total Valid Scores 0 0 0 0 0 Total Valid Scores 0 0 0 0
Verify that Part I data entry is complete (all cells = 0 or greater).
Part II - API Calculation
A B C D E F G H I J
Sum of
School
Performance Test
Total Content Scale
Test Valid Level Weight x
Content Area Weight Area Sum of F Calibration API
Weight Scores Weighting Scores
(from Part I) Weights ÷ Sum of D Factor Score
(fixed) (from Part I) Factors x
AxC (fixed)
Valid Scores AxE
D ÷ Sum of D
(from Part I)
0.48 CST/CAPA in ELA 0 0.00 0 0.00 0.000%
0.32 CST/CAPA in Math 0 0.00 0 0.00 0.000%
0.10 CST in Mathematics-
*200 Pts. Assignment 0 0.00 0 0.00 0.000%
0.20 CST in History-Social
Science 0 0.00 0 0.00 0.000%
0.20 CST in Science 0 0.00 0 0.00 0.000%
0.06 CAT/6 in Reading 0 0.00 0 0.00 0.000%
0.03 CAT/6 in Language 0 0.00 0 0.00 0.000%
0.03 CAT/6 in Spelling 0 0.00 0 0.00 0.000%
0.08 CAT/6 in Mathematics 0 0.00 0 0.00 0.000%
Total Values 0 0.00 0 0.00 0.000% 0.00 40.84 0
* If student did not take test, then student record is assigned 200 points in API calculation.
Questions: Dana Kertel | aau@cde.ca.gov | 916-319-0863
7. California Department of Education Policy and Evaluation Division
Calculation Spreadsheet for the 2007 Base API or 2008 Growth API
For Grades 9-12
Part I - School Test Data
California Standards Test (CST) and California High School
California Alternate Performance Assessment (CAPA) Exit Examination (CAHSEE)
Number of Valid Scores Number of Valid Scores
by Content Area by Content Area
Performance Performance
Level Level
Performance History- Performance
Weighting Weighting English-
Level English- Mathematics Science Science Social Life Level
Factor Factor Language
(fixed) Language Arts Mathematics *200 Pts. (End-of-Course *200 Pts. Science Science (fixed) Mathematics
Arts
(ELA) Assignment Tests) Assignment (Grades 10-11 (Grade 10 Only)
(ELA)
Only)
1000 5 : Advanced 0 0 N/A 0 N/A 0 0 1000 Pass 0 0
875 4 : Proficient 0 0 N/A 0 N/A 0 0 N/A N/A
700 3 : Basic 0 0 N/A 0 N/A 0 0 N/A N/A
500 2 : Below Basic 0 0 N/A 0 N/A 0 0 N/A N/A
200 1 : Far Below Basic 0 0 0 0 0 0 0 200 No Pass 0 0
Total Valid Scores 0 0 0 0 0 0 0 Total Valid Scores 0 0
Verify that Part I data entry is complete (all cells = 0 or greater).
Part II - API Calculation
A B C D E F G H I J
Sum of
School
Performance Test
Total Content Scale
Test Valid Level Weight x
Content Area Weight Area Sum of F Calibration API
Weight Scores Weighting Scores
(from Part I) Weights ÷ Sum of D Factor Score
(fixed) (from Part I) Factors x
AxC (fixed)
Valid Scores AxE
D ÷ Sum of D
(from Part I)
0.30 CST/CAPA in ELA 0 0.00 0 0.00 0.000%
0.20 CST/CAPA in Math 0 0.00 0 0.00 0.000%
0.10 CST in Mathematics-
*200 Pts. Assignment 0 0.00 0 0.00 0.000%
0.22 CST in Science 0 0.00 0 0.00 0.000%
0.05 CST in Science-
*200 Pts. Assignment 0 0.00 0 0.00 0.000%
0.23 CST in History-Social
Science 0 0.00 0 0.00 0.000%
0.10 CST in Life Science 0 0.00 0 0.00 0.000%
0.30 CAHSEE ELA 0 0.00 0 0.00 0.000%
0.30 CAHSEE Mathematics 0 0.00 0 0.00 0.000%
Total Values 0 0.00 0 0.00 0.000% 0.00 16.91 0
* If a student did not take the test, then the student record is assigned 200 points in API calculation.
Questions: Dana Kertel | aau@cde.ca.gov | 916-319-0863
8. California Department of Education Policy and Evaluation Division
Calculation Spreadsheet for the 2007 Base API or 2008 Growth API
For Bridge Schools that Cross Grade Spans
API Calculation
Grade API
Weights
Level Score
Grade 2 0.00 0
Grades 3-5 Students with Disabilities Only 0.00 0
Grades 3-5 Students with Disabilities Not Included 400.00 483
Grade 6 0.00 0
Grades 7-8 0.00 0
Grades 9-12 0.00 0
Total Values 400.00 483
Content Area Weights
Content Area
Content Areas Test Weights
Weights
CST in English-Language Arts (ELA) 240.00 60.0%
CST in Mathematics 160.00 40.0%
CST in Science - End of Course 0.00 0.0%
CST in Science - Grades 5, 8, and 10 0.00 0.0%
CST in History-Social Science (HSS) 0.00 0.0%
CAT/6 in Reading 0.00 0.0%
CAT/6 in Language 0.00 0.0%
CAT/6 in Spelling 0.00 0.0%
CAT/6 in Mathematics 0.00 0.0%
CAHSEE ELA 0.00 0.0%
CAHSEE Mathematics 0.00 0.0%
Assignment of 200 CST in Mathematics 0.00 0.0%
Assignment of 200 CST in Science 0.00 0.0%
Totals 400.00 100.0%
Questions: Dana Kertel | aau@cde.ca.gov | 916-319-0863