Downloaded 16 times

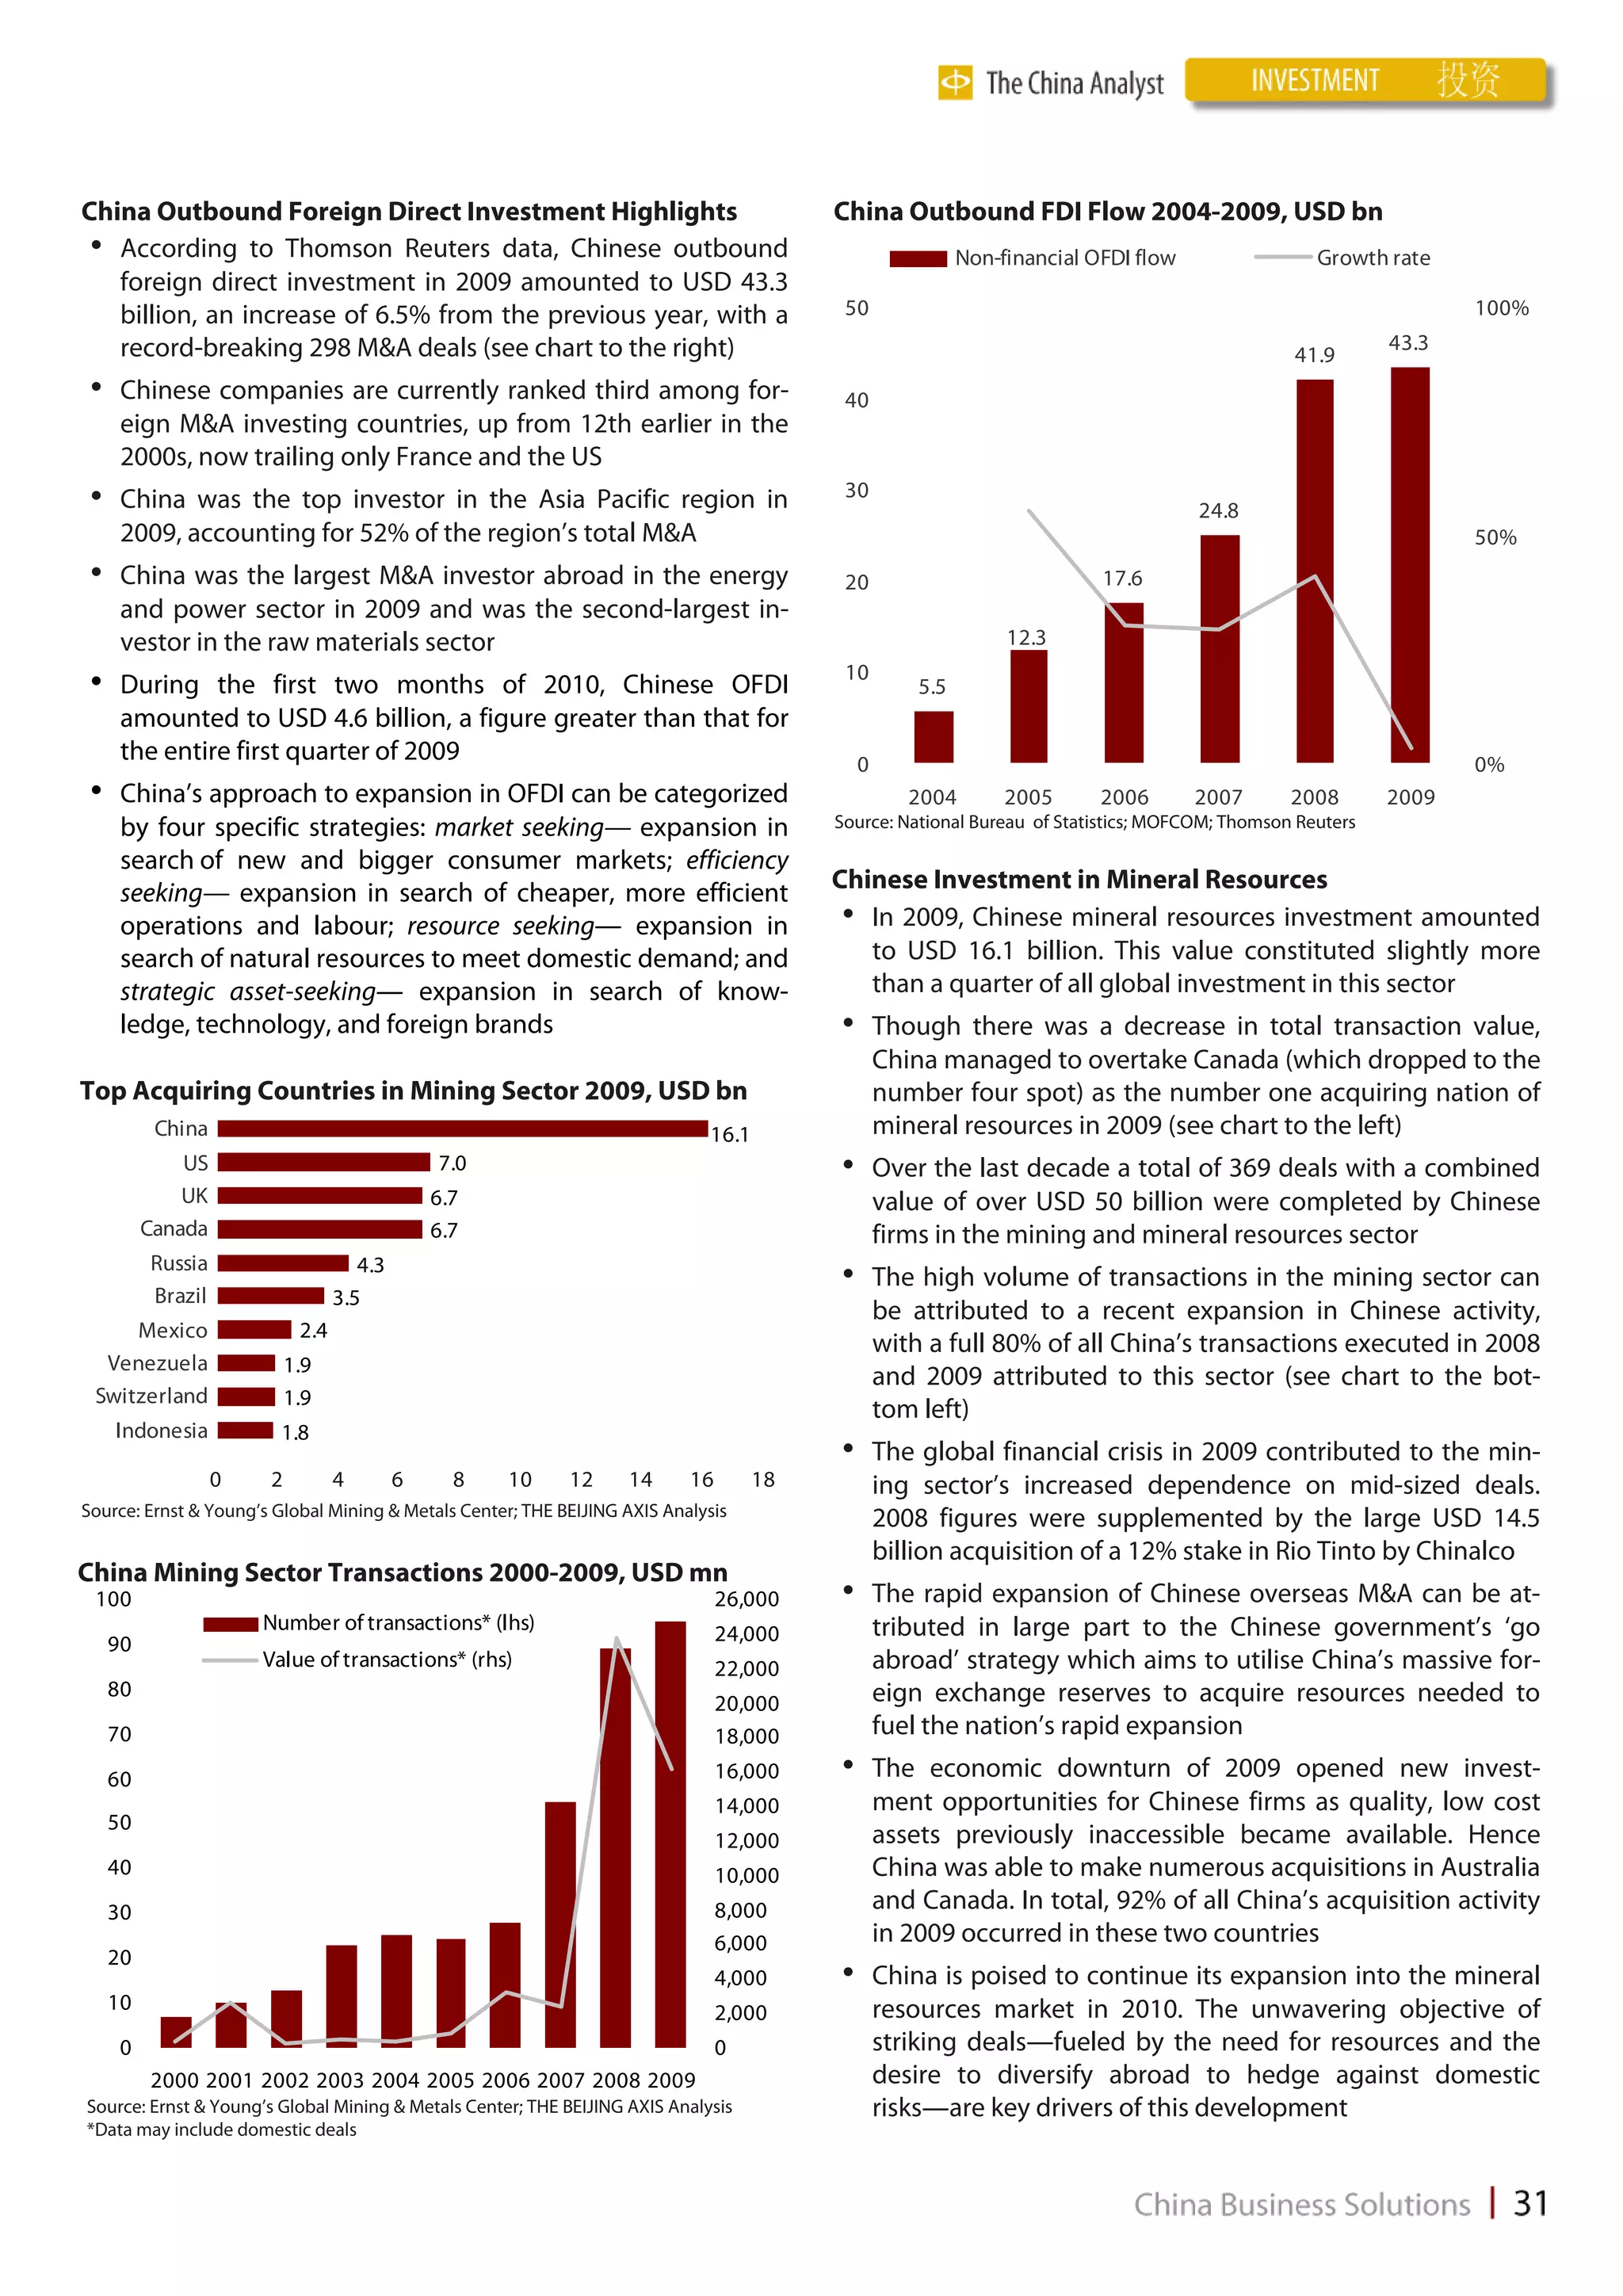
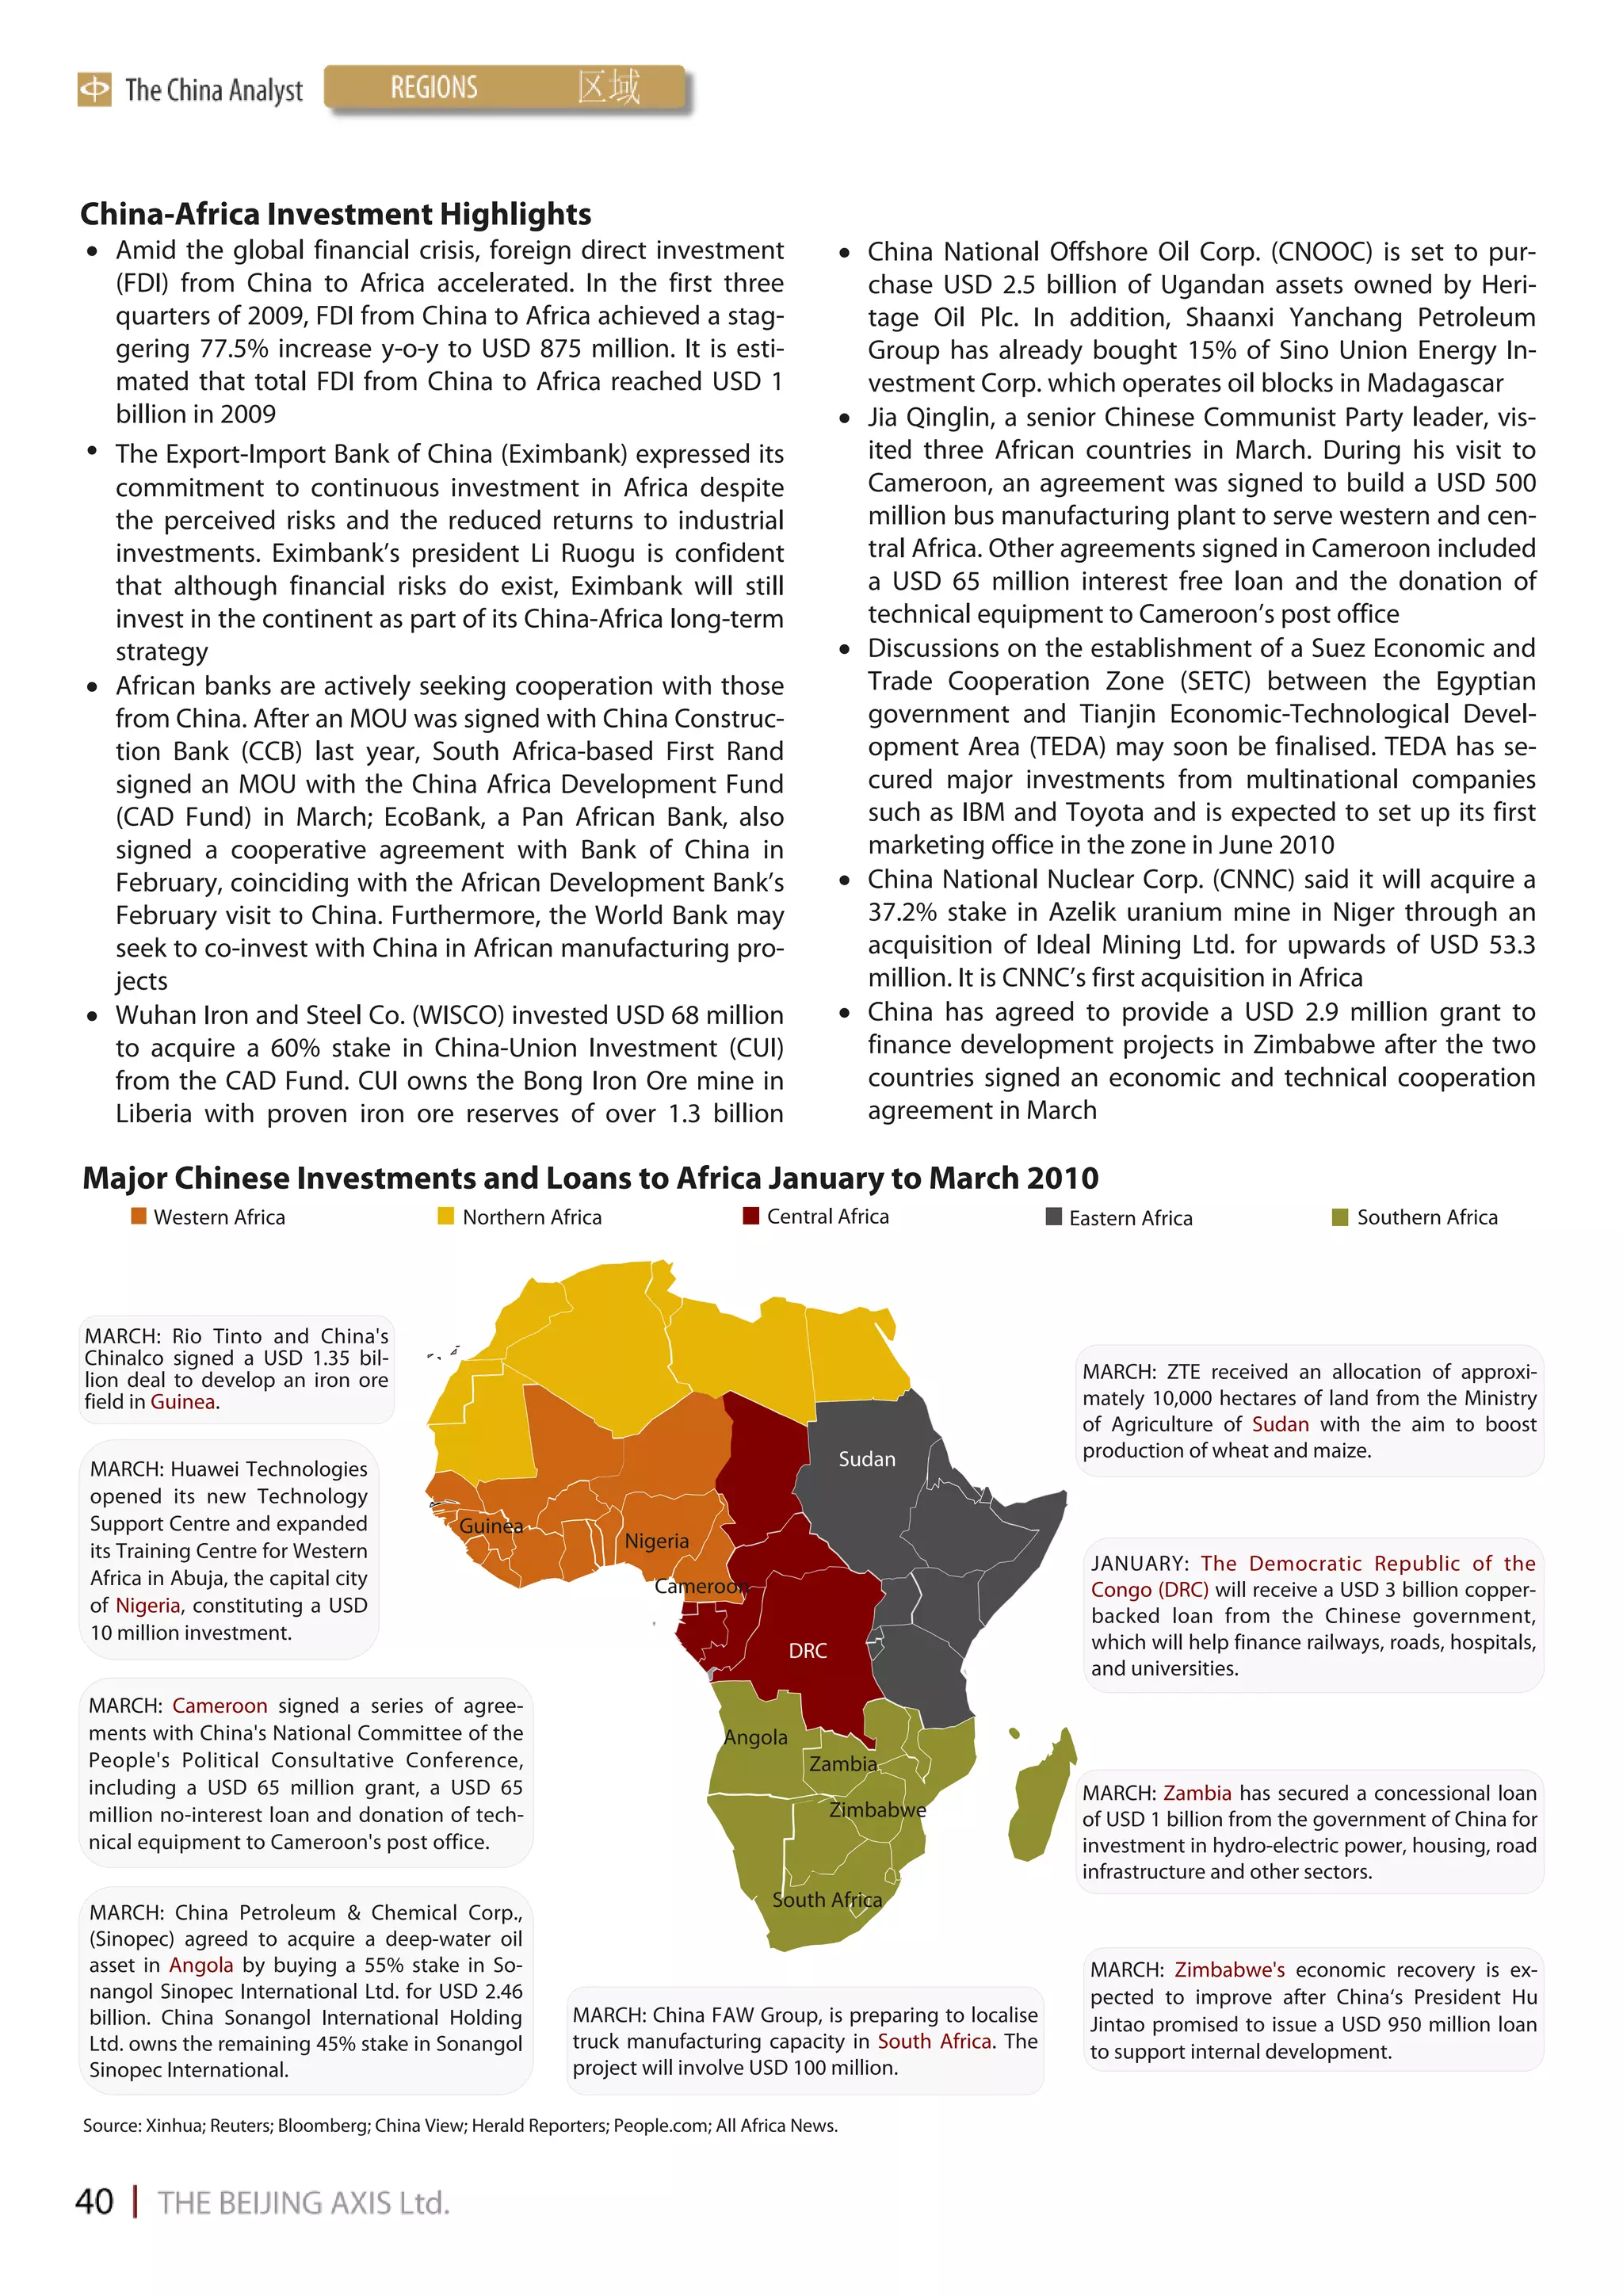
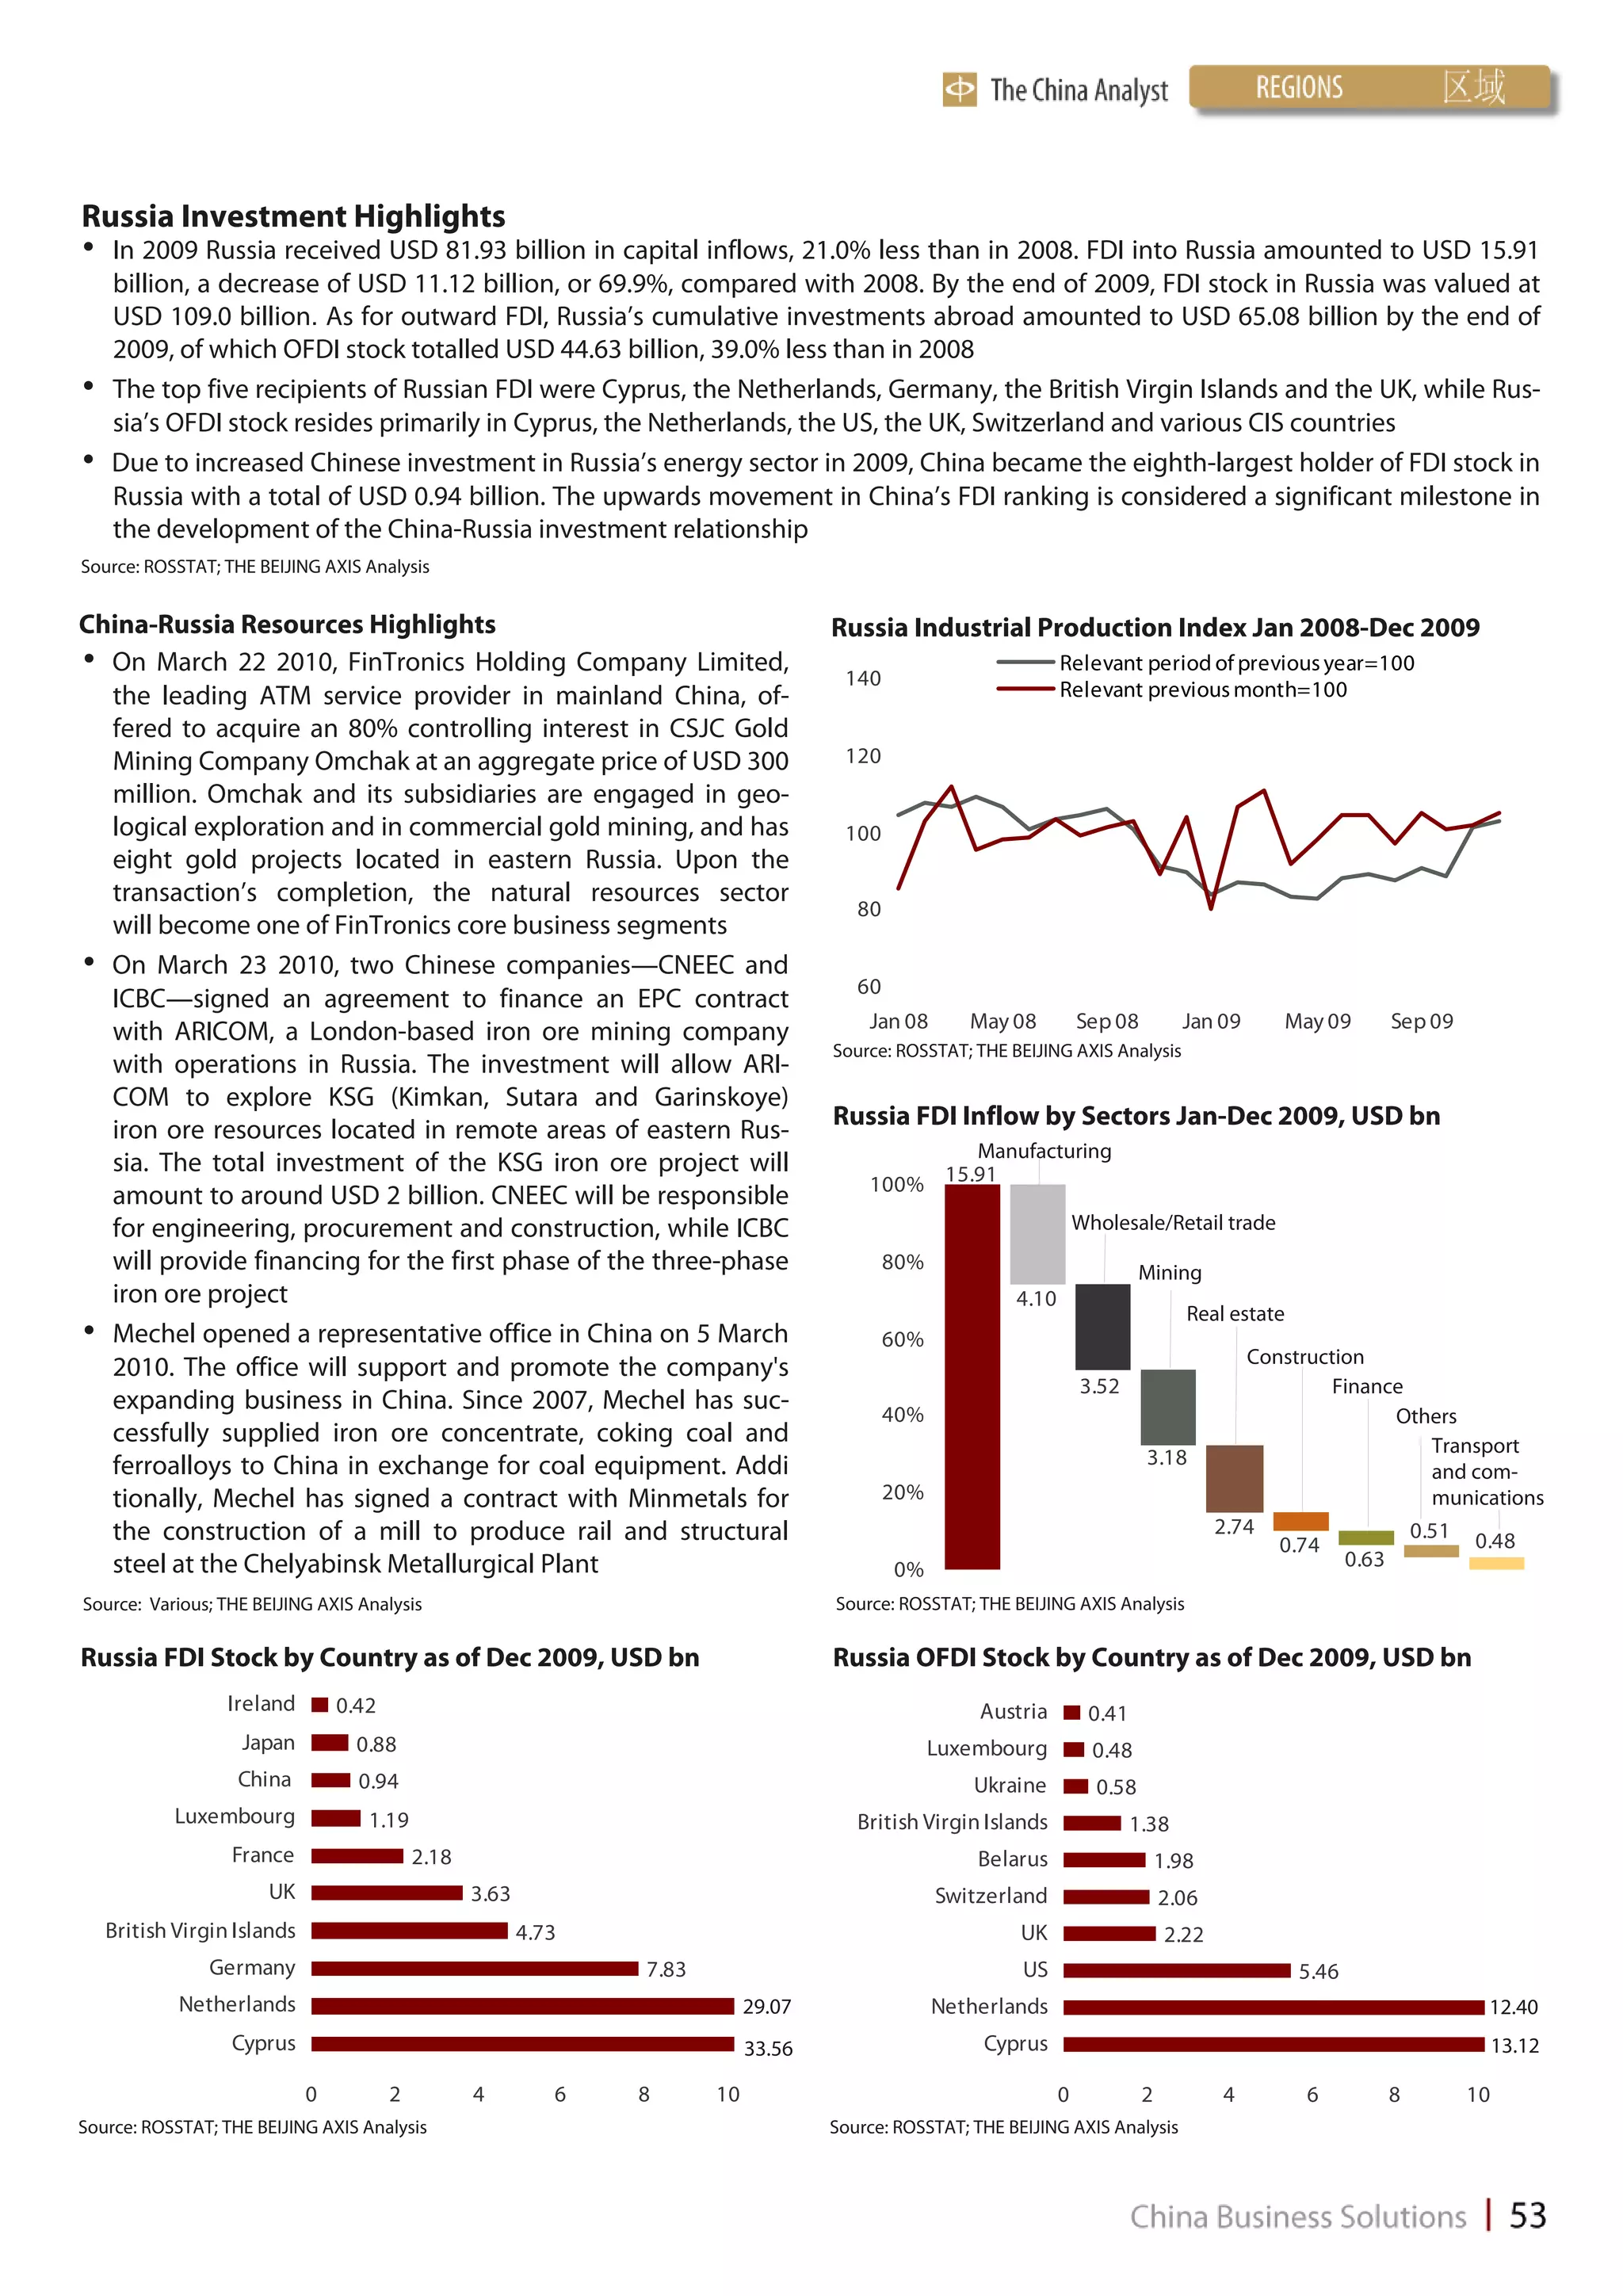
![rect Investment (FDI). This trend is in line total incoming trade. However, the gap flows of cheap Chinese goods that could
with China’s growing footprint in Africa. between the import of Chinese goods yet dominate local markets.
According to the Ministry of Commerce and Ghana’s exports is widening. In
of the People’s Republic of China, Chi- 2004, Ghana’s exports to China totalled China invests with energy
nese investment in Africa rose 77.5%, to only USD 80.38 million with imports of
USD 875 million from January to Octo- USD 510.40 million—a USD 430.02 mil- Rapidly rising FDI flows from China have
ber 2009. While Beijing and Accra have lion difference. More recent figures see a added a new dynamic to Ghana-China
enjoyed relatively strong and stable bi- continuation in imbalanced trade, with relations. This is for the most part due to
lateral relations since the 1960s, the Ghana exporting USD 93.40 million to the Chinese Government’s ‘go abroad’
backdrop of a recent surge in Chinese China in exchange for USD 1,747.9 mil- policy as well as to the favourable do-
activities in Ghana warrants a closer ex- lion as of 2008; this despite numerous mestic environment in Ghana. In 2006,
amination of China’s presence in the Chinese foreign direct investments into the National Development and Reform
African nation, and on its implications its African counterpart. Some Ghanaians Commission (NDRC)—the macroeco-
for China’s overall West Africa and pan- argue that while China benefits from nomic planning agency under the Chi-
African strategies. free trade on the African continent, it nese State Council—published a report
imposes tariffs and stringent import with the heading ‘Africa is the ideal mar-
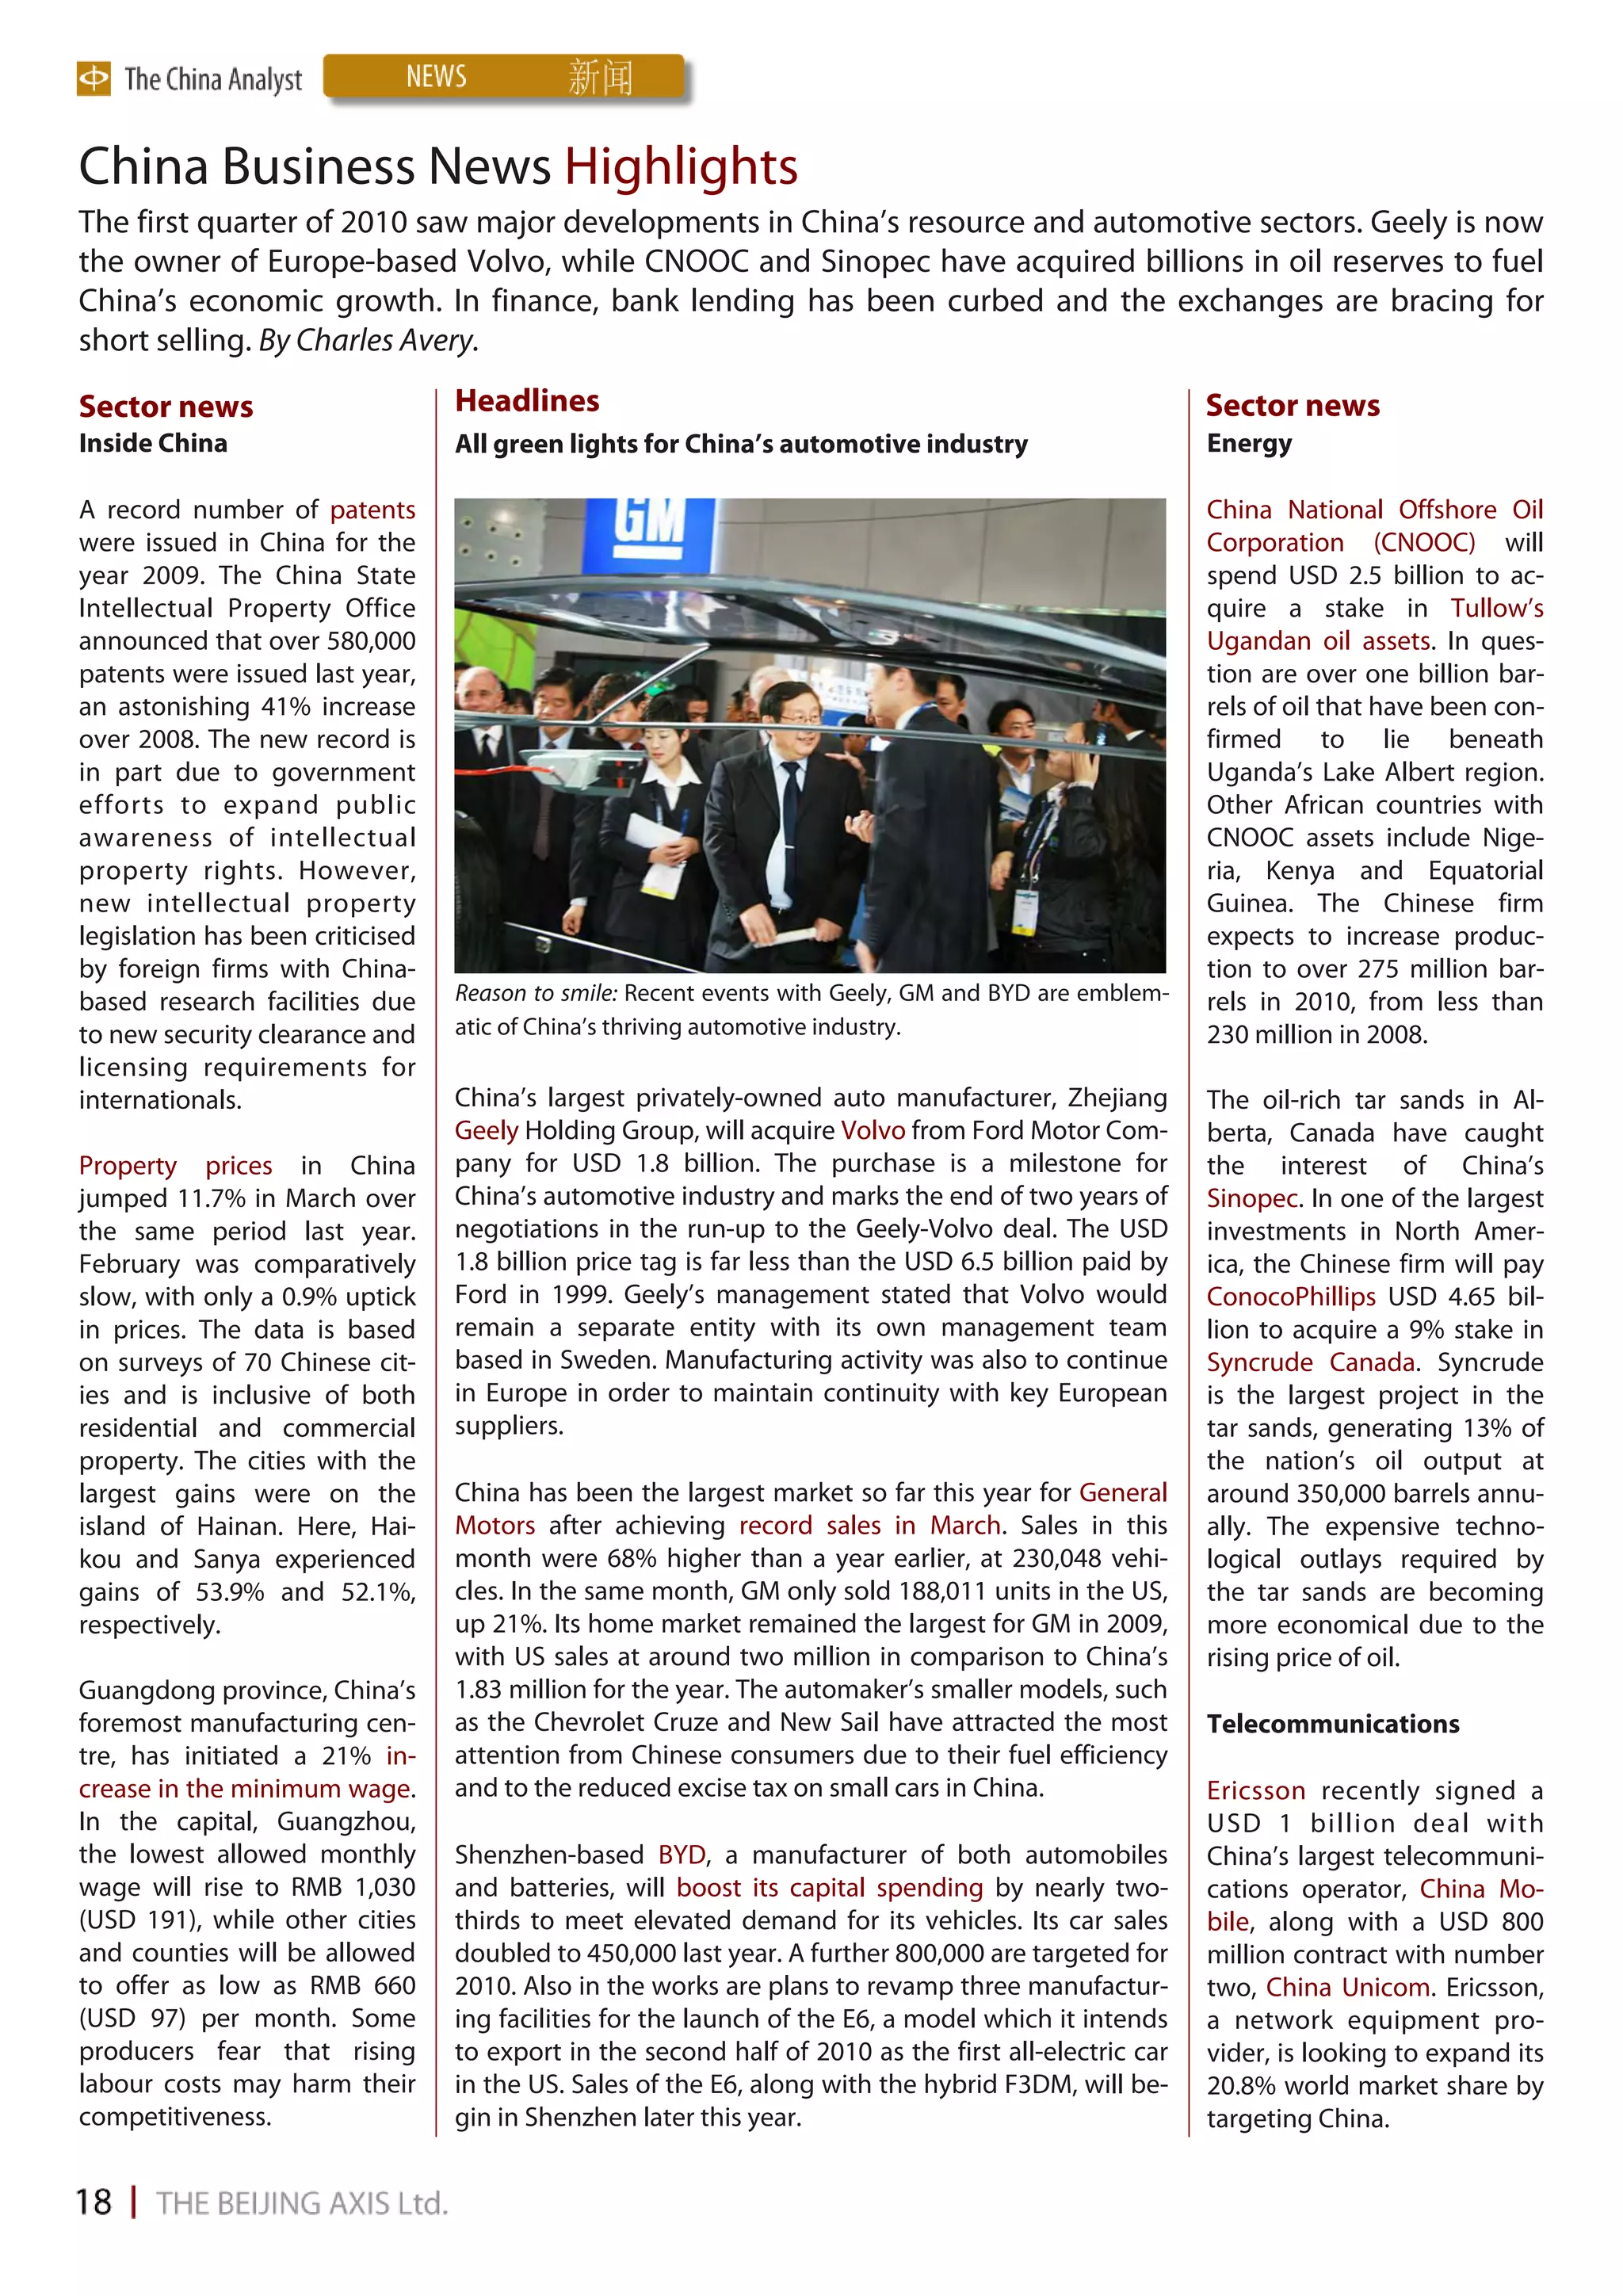
In October 2009, the state-owned China standards on African goods. ket for Zhongguo Zhizao [goods made in
National Offshore Oil Company (CNOOC) China]’. In 2008, the NDRC released the
made a bid for a share of U.S.-based Kos- A closer examination of the imbalanced official ‘Catalogue of Industrial Guidance
mos Energy’s assets in Ghana’s Jubilee volume in Ghana-China bilateral trade for Foreign Investment’ and ‘China’s
oil field. Ghana is clearly rising in terms reveals that it is largely because of the Energy Conditions and Policies’ in order
of its strategic and economic impor- uneven position of the two sides on the to emphasise the significance of the
tance to China, as these recent moves demand and supply chain. According to African continent and to encourage Chi-
further consolidate China’s stake in an official report from the Economic and nese companies to explore market op-
Ghana’s future development. Oil, cocoa Commercial Counsellor's Office of the portunities in Africa.
and manganese, to name but a few, Chinese Embassy in Ghana, the principle
form part of China’s shopping list that items that China exports to Ghana are In 2007, according to the Chinese De-
runs the gamut of commodities that electronics, telecommunications equip- partment of Commerce, China topped
Ghana and the rest of Africa can supply. ment, power-supply equipment and Ghana’s FDI list with a cumulative total
textiles. On the other hand, major ex- of 316 registered projects. It also ranked
On 30 December 2009, the Agreement ports from Ghana to China include crude fourth with an investment value of USD
on Economic and Technical Cooperation oil products, cocoa, cotton, gold, timber, 219 million. In H1 2009, the Ghana In-
between China and Ghana was signed at and industrial diamonds. China manu- vestment Promotion Centre (GIPC) had
the Ghanaian Ministry of Finance and factures and processes goods with a China topping the list of countries for
Economic Planning in Accra. According high-end value, whereas Ghana contin- registered projects, at 21, and second for
to the agreement, China will provide ues to trade low-end value goods such project value at USD 8.2 million. Low-
two concessional financial facilities in- as agricultural products and raw materi- interest loans which accompany Chinese
cluding a grant and an interest-free loan als. If these inequalities persist in the infrastructure projects contribute to
to the government of Ghana in 2010. future, local manufacturing industries in Ghana’s employment level and stabilise
Ghana may suffer from continuous in- the nation’s economy.
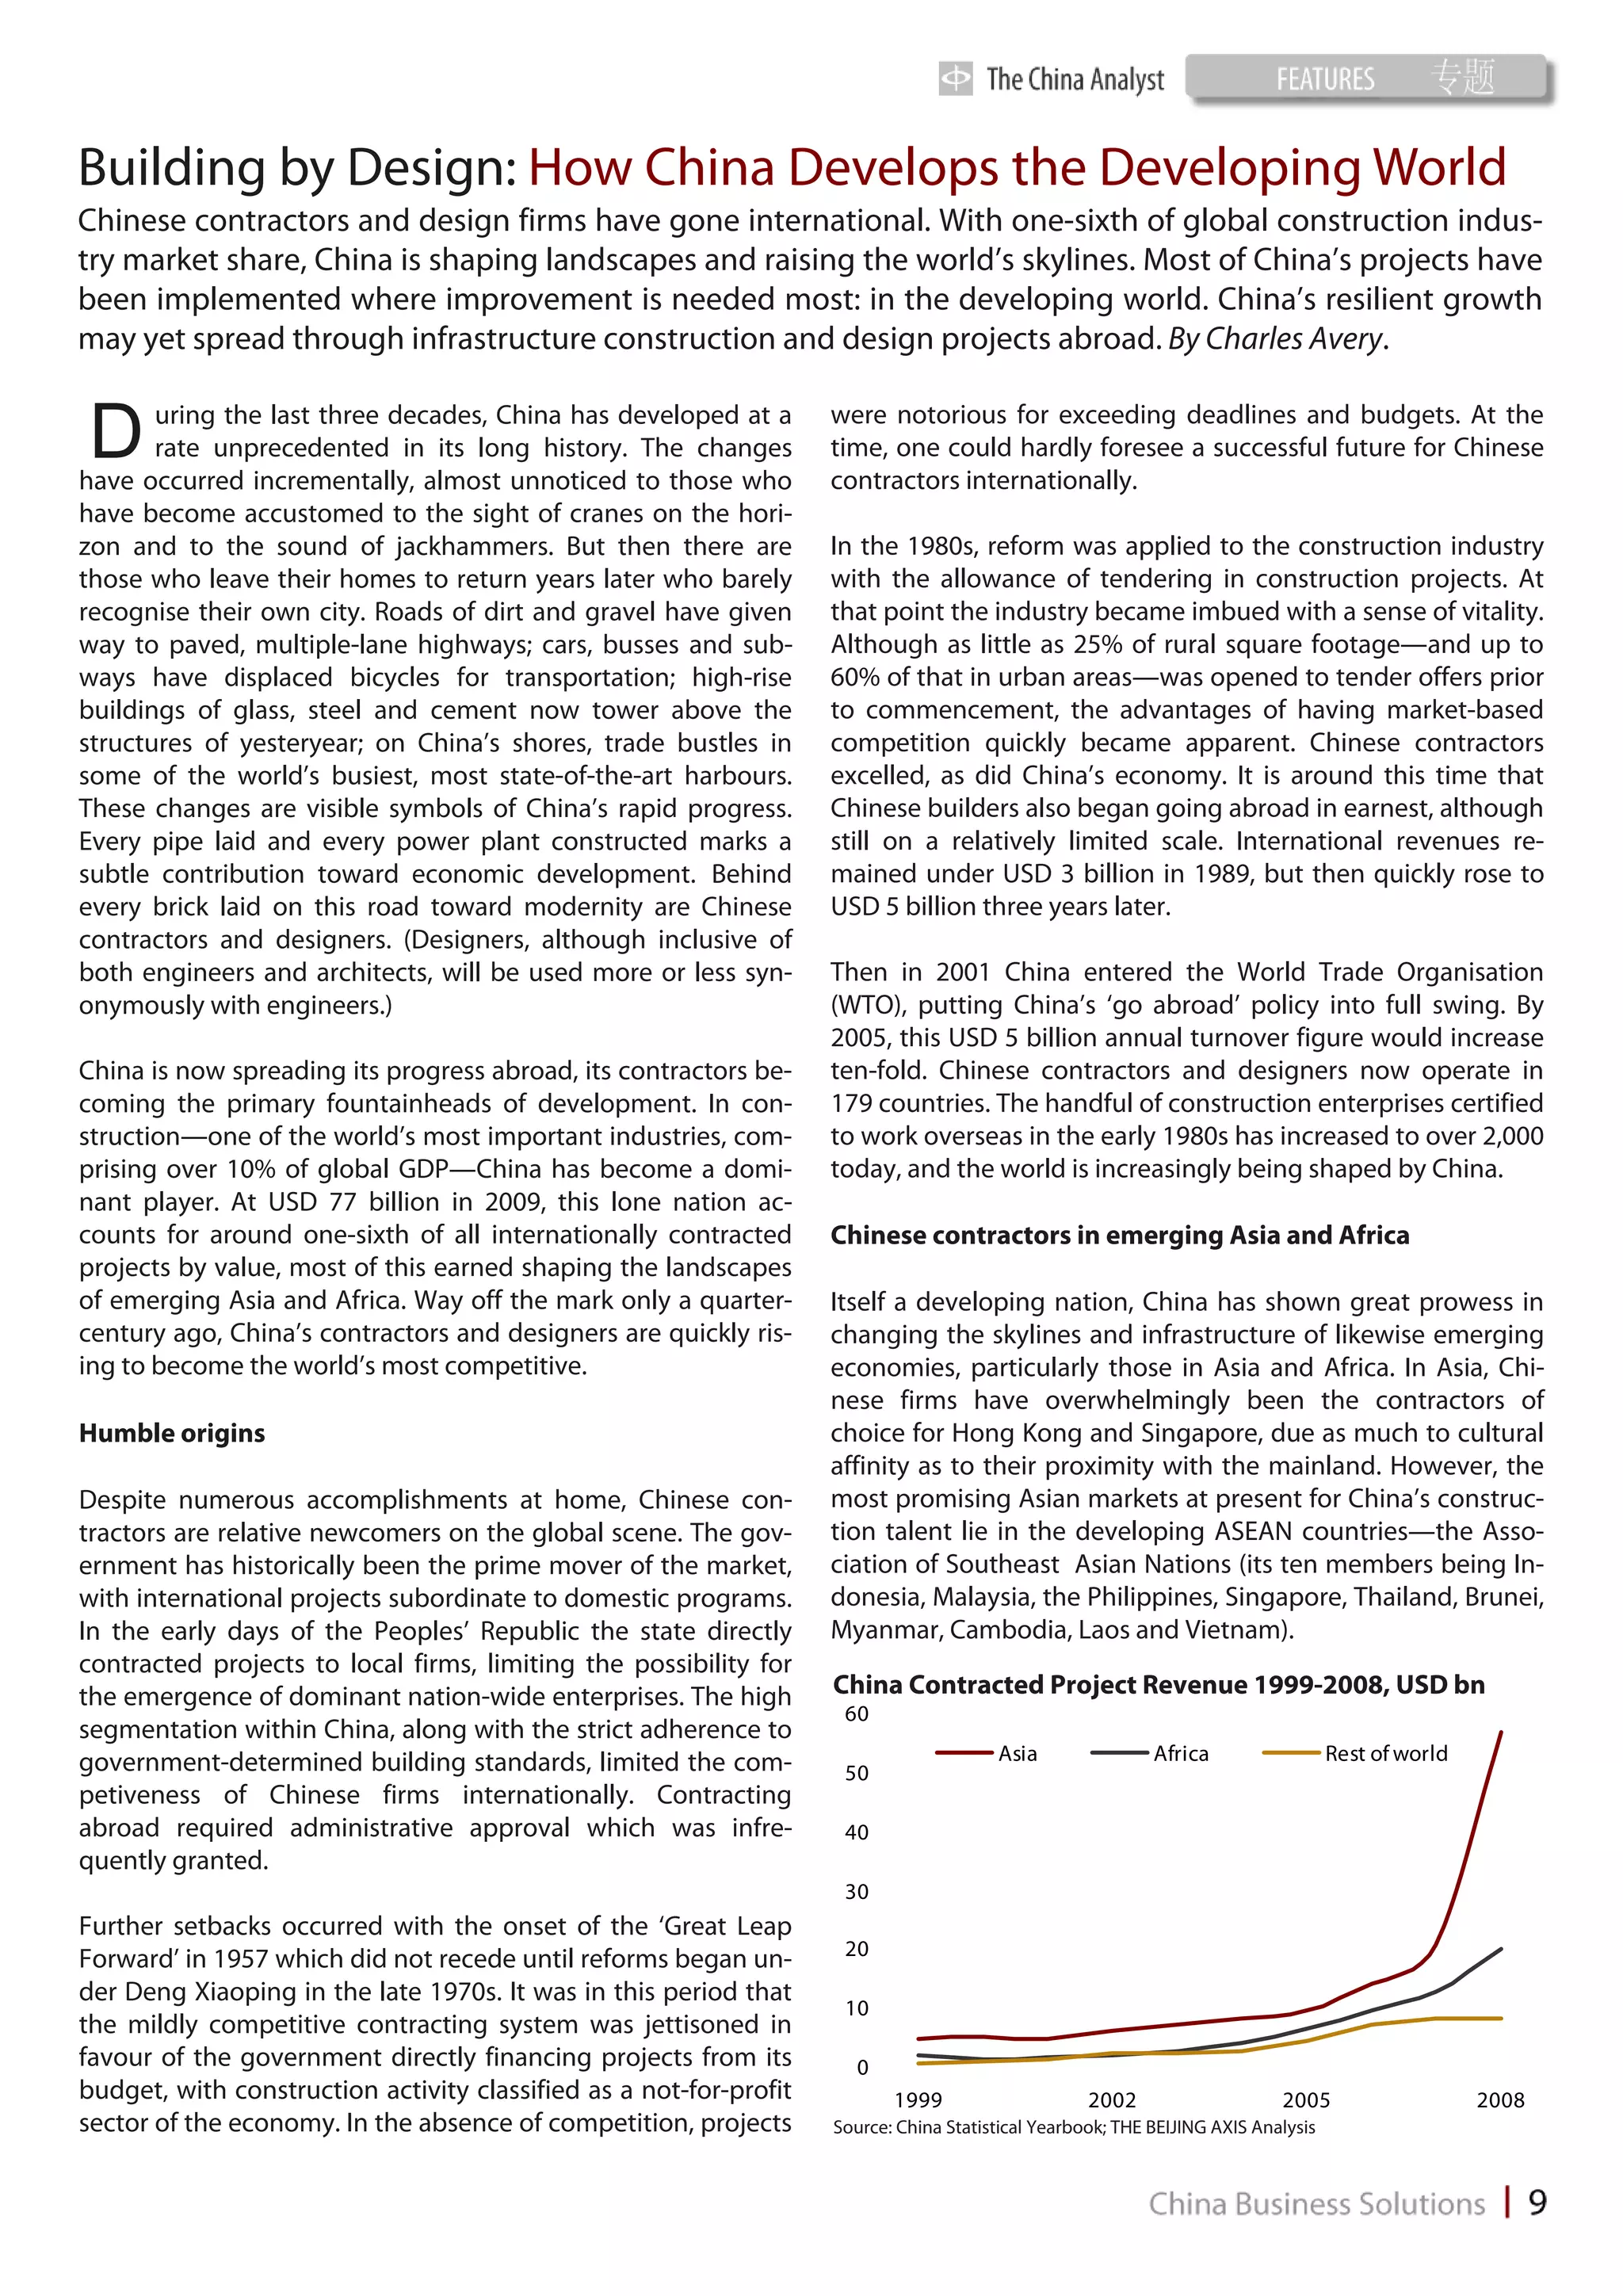
Growing trade and investment
Ghana Imports 2004-2008
Trade and investment flows between
Africa and China have increased dra- Unit: USD (mn) 2004 2005 2006 2007 2008
matically in the past decade. Coinciding
Total 4,074 5,754 6,498 7,978 10,351
with its growing manufacturing prow-
ess, Chinese equipment and products From China 510 672 803 1,228 1,747
have become Ghana’s major imports.
China’s share of total 12.5% 11.7% 12.4% 15.4% 16.8%
China’s official statistics reveal that, as of
the end of October 2009, trade between Ghana Exports 2004-2008
Ghana and China totalled USD 189.4 Unit: USD (mn) 2004 2005 2006 2007 2008
million. UN Comtrade figures indicate
that the value of Ghanaian imports from Total 2,622 2,802 3,735 4,322 5,625
China increased just over three-fold in
four years—from USD 510.4 million in To China 80 96 80 53 93
2004 to USD 1,747.9 million in 2008. China’s share of total 3.1% 3.4% 2.1% 1.2% 1.7%
China now ranks first among Ghanaian
import countries with a 16.8% share of Source: UN Comtrade; Ghanaian Ministry of Trade and Industry](https://image.slidesharecdn.com/thechinaanalystmay2010-12778016912004-phpapp02/75/The-China-Analyst-May-2010-40-2048.jpg)

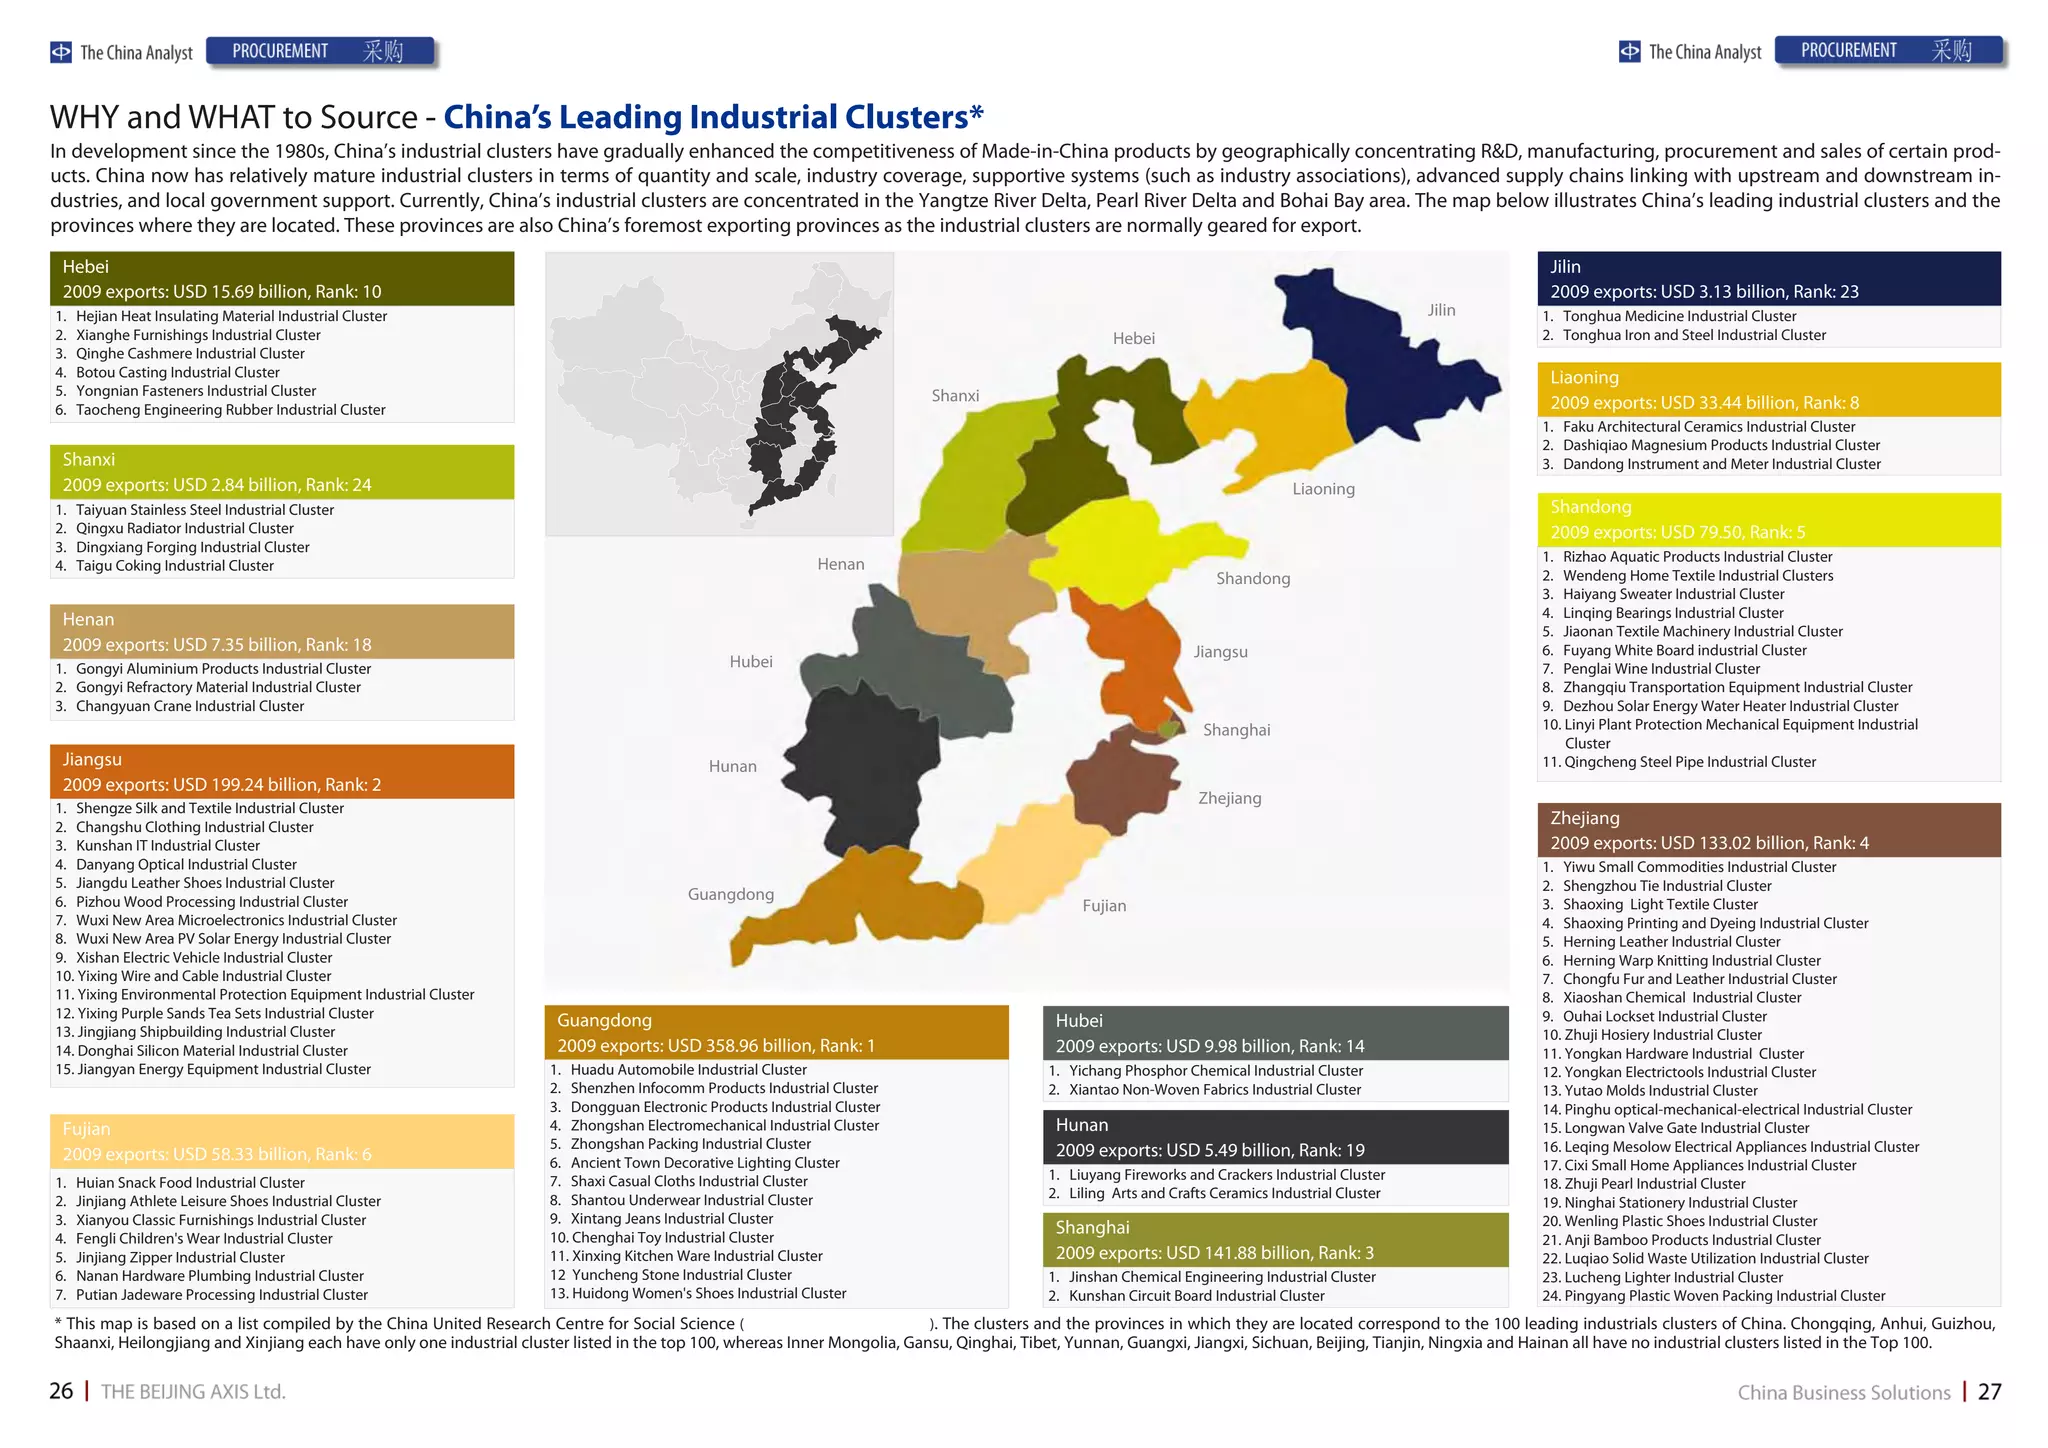
The document, 'The China Analyst - May 2010', explores China's emergence as a global leader in technology and innovation following the financial crisis of 2008. It highlights the significant advancements in Chinese manufacturing capabilities and the ability of firms like Huawei and Lenovo to compete internationally, showcasing a shift from low-tech to high-tech exports. The edition also provides insights into China's macroeconomic performance, foreign direct investment trends, and its growing role in global markets across various regions.


