Presentation at 'Smart Demand' Workshop, iHeat 2012, 13th November 2012, Murray Edwards College, Buckingham House Conference Centre, Cambridge. (http://www.cir-strategy.com/events/heat/)
Smart Demand:
Lessons fromWater
Dr Ben Anderson
b.anderson@soton.ac.uk
Sustainable Energy Research Group
Faculty of Engineering and the Environment
2.
The Menu
Theproblem(s) with water
Water ‘practices’
The problem with ‘demographics’
Lessons from water
Implications for smart energy
2
3.
The Menu
Theproblem(s) with water
Water ‘practices’
The problem with ‘demographics’
Lessons from water
Implications for smart energy
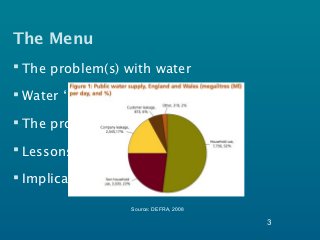
Source: DEFRA, 2008
3
4.
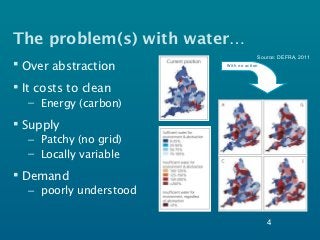
The problem(s) withwater…
Source: DEFRA, 2011
Over abstraction With no action
It costs to clean
– Energy (carbon)
Supply
– Patchy (no grid)
– Locally variable
Demand
– poorly understood
4
5.
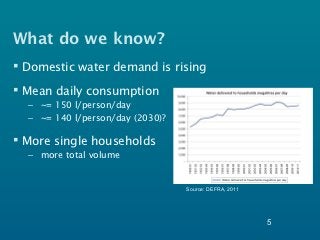
What do weknow?
Domestic water demand is rising
Mean daily consumption
– ~= 150 l/person/day
– ~= 140 l/person/day (2030)?
More single households
– more total volume
Source: DEFRA, 2011
5
6.
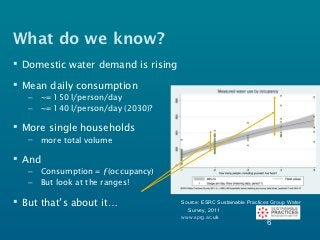
What do weknow?
Domestic water demand is rising
Mean daily consumption
– ~= 150 l/person/day
– ~= 140 l/person/day (2030)?
More single households
– more total volume
And
– Consumption = ƒ(occupancy)
– But look at the ranges!
Source: DEFRA, 2011
But that’s about it… Source: ESRC Sustainable Practices Group Water
Survey, 2011
www.sprg.ac.uk
6
7.
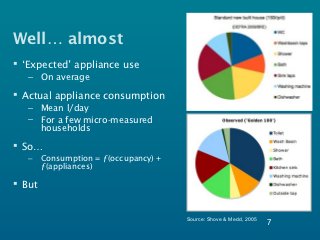
Well… almost
‘Expected’appliance use
– On average
Actual appliance consumption
– Mean l/day
– For a few micro-measured
households
So…
– Consumption = ƒ(occupancy) +
ƒ(appliances)
But
Source: Shove & Medd, 2005
7
8.
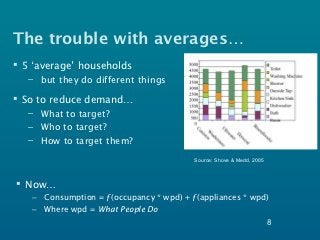
The trouble withaverages…
5 ‘average’ households
– but they do different things
So to reduce demand…
– What to target?
– Who to target?
– How to target them?
Source: Shove & Medd, 2005
Now…
– Consumption = ƒ(occupancy * wpd) + ƒ(appliances * wpd)
– Where wpd = What People Do
8
9.
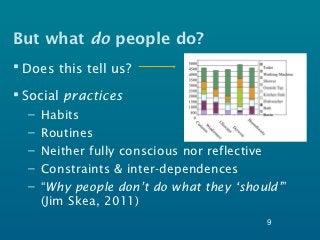
But what dopeople do?
Does this tell us?
Social practices
– Habits
– Routines
– Neither fully conscious nor reflective
– Constraints & inter-dependences
– “Why people don’t do what they ‘should’”
(Jim Skea, 2011)
9
10.
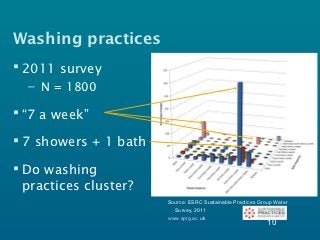
Washing practices
2011survey
– N = 1800
“7 a week”
7 showers + 1 bath
Do washing
practices cluster?
Source: ESRC Sustainable Practices Group Water
Survey, 2011
www.sprg.ac.uk
10
11.
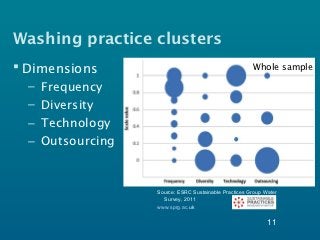
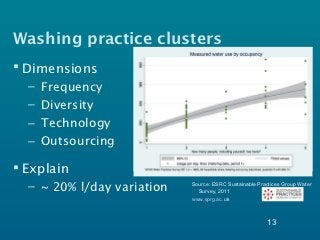
Washing practice clusters
Dimensions Whole sample
– Frequency
– Diversity
– Technology
– Outsourcing
Source: ESRC Sustainable Practices Group Water
Survey, 2011
www.sprg.ac.uk
11
12.
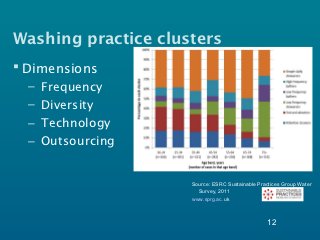
Washing practice clusters
Dimensions
– Frequency
– Diversity
– Technology
– Outsourcing
Source: ESRC Sustainable Practices Group Water
Survey, 2011
www.sprg.ac.uk
12
13.
Washing practice clusters
Dimensions
– Frequency
– Diversity
– Technology
– Outsourcing
Explain
– ~ 20% l/day variation Source: ESRC Sustainable Practices Group Water
Survey, 2011
www.sprg.ac.uk
13
14.
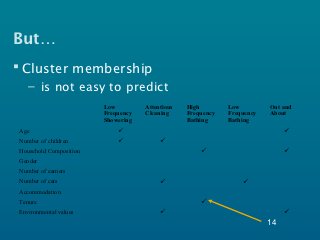
But…
Cluster membership
– is not easy to predict
Low Attentious High Low Out and
Frequency Cleaning Frequency Frequency About
Showering Bathing Bathing
Age
Number of children
Household Composition
Gender
Number of earners
Number of cars
Accommodation
Tenure
Environmental values
14
15.
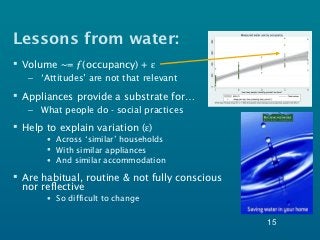
Lessons from water:
Volume ~= ƒ(occupancy) + ε
– ‘Attitudes’ are not that relevant
Appliances provide a substrate for…
– What people do - social practices
Help to explain variation (ε)
• Across ‘similar’ households
• With similar appliances
• And similar accommodation
Are habitual, routine & not fully conscious
nor reflective
• So difficult to change
15
16.
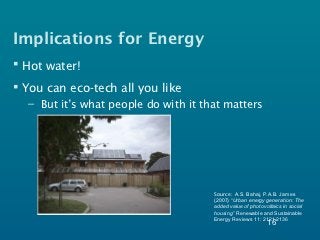
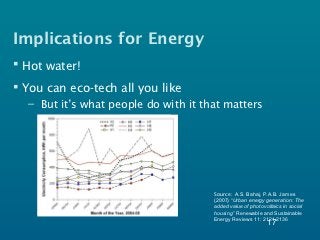
Implications for Energy
Hot water!
You can eco-tech all you like
– But it’s what people do with it that matters
Source: A.S. Bahaj, P.A.B. James
(2007) “Urban energy generation: The
added value of photovoltaics in social
housing” Renewable and Sustainable
Energy Reviews 11: 2121-2136
16
17.
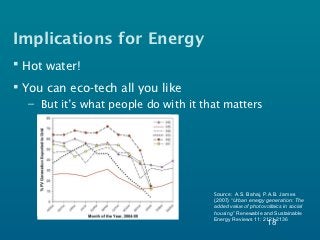
Implications for Energy
Hot water!
You can eco-tech all you like
– But it’s what people do with it that matters
Source: A.S. Bahaj, P.A.B. James
(2007) “Urban energy generation: The
added value of photovoltaics in social
housing” Renewable and Sustainable
Energy Reviews 11: 2121-2136
17
18.
Implications for Energy
Hot water!
You can eco-tech all you like
– But it’s what people do with it that matters
Source: A.S. Bahaj, P.A.B. James
(2007) “Urban energy generation: The
added value of photovoltaics in social
housing” Renewable and Sustainable
Energy Reviews 11: 2121-2136
18
19.
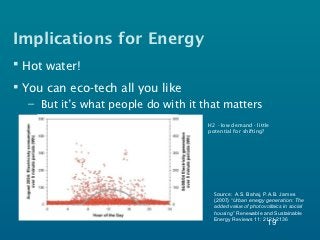
Implications for Energy
Hot water!
You can eco-tech all you like
– But it’s what people do with it that matters
H2 - low demand - little
potential for shifting?
Source: A.S. Bahaj, P.A.B. James
(2007) “Urban energy generation: The
added value of photovoltaics in social
housing” Renewable and Sustainable
Energy Reviews 11: 2121-2136
19
20.
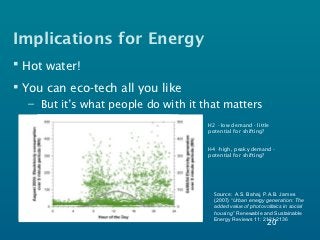
Implications for Energy
Hot water!
You can eco-tech all you like
– But it’s what people do with it that matters
H2 - low demand - little
potential for shifting?
H4 -high, peaky demand -
potential for shifting?
Source: A.S. Bahaj, P.A.B. James
(2007) “Urban energy generation: The
added value of photovoltaics in social
housing” Renewable and Sustainable
Energy Reviews 11: 2121-2136
20
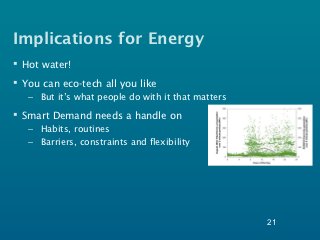
21.
Implications for Energy
Hot water!
You can eco-tech all you like
– But it’s what people do with it that matters
Smart Demand needs a handle on
– Habits, routines
– Barriers, constraints and flexibility
21
22.
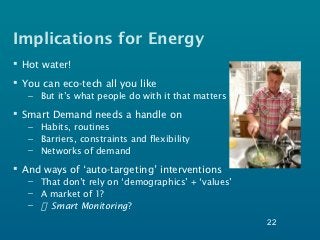
Implications for Energy
Hot water!
You can eco-tech all you like
– But it’s what people do with it that matters
Smart Demand needs a handle on
– Habits, routines
– Barriers, constraints and flexibility
– Networks of demand
And ways of ‘auto-targeting’ interventions
– That don’t rely on ‘demographics’ + ‘values’
– A market of 1?
– Smart Monitoring?
22
23.
Thank you
DrBen Anderson (b.anderson@soton.ac.uk)
www.energy.soton.ac.uk
– SPRG
• Sustainable Practices Research Group
• www.sprg.ac.uk
– DANCER
• Digital Agent Networking for Customer Energy
Reduction (EPSRC)
• dancerproject.wordpress.com
23
#9 No use trying to reduce water the same way for these households - can the heavy showerers be reduced? The heavy WC users? -> What are people actually doing with these appliances…?
#10 No… we need a way to get at what we term… (Warde, 2005) etc Constraints - the way we wash our bodies & our clothes may be closely linked via occupations, commuting modes, children’s activities etc Power showers enable new washing experiences but uses more water… They are why people appear irrational in terms of water use - don’t respond (for example) to price signals.
#12 Frequency - how often shower/bathe/flannel wash etc Diversity - range of different kinds of performances/reasons (always shower, mixture etc) Technology - power shower, bath, shower, flannel Outsourcing - washing outside the home Chart = distribution of whole sample on these dimensions
#13 Generates these 6 washing clusters - differentiated along the dimensions NB: project has done same exercise for laundry & gardening too
#14 Interestingly simple regression model suggests membership of these clusters explains about 20% of the variation on litres/day consumed by the 69 households for whom we have linked data. So by thinking about clusters of practices we’re starting to get a handle on some of that variation
#15 Simple daily showers = reference group for logitistic models Basically few demographics are good predictors of being in a given cluster Environmental values (attitudes to water/energy etc) are poor predictors overall NB: much historical social housing does not have a shower so expect more ‘baths’ for this tenure group (arrow)
#17 Some examples from ongoing work by Southampton group 9 eco-houses in Havant - same build standards, same equipment incl PV, varying people
#19 And also massively varying rates of PV export, not always (or even mostly) related to overall levels of consumption. Timing is key! -> habits and routines
#23 Jamie? Systematics - school/work routines constrain WHEN cooking can happen. C.f. comparisons with S. Europe siesta/mid-day cooking etc But also distributed networks of demand -> a greater part of the way we use energy in the kitchen is ‘constructed’ through wider network of influences incl. media chefs, what is considered ‘good cooking’ (and by whom?), taste & fashion etc
#24 SPRG = social practices work on water (& energy by others, esp cooling) DANCER = applying some of these ideas to energy interventions