Kathy
Production Editor: Mary
Manufacturing Planner: Kim
Cover Design: Wiley
Typesetter: Thomson Digital
Printer: RR Donnelley
Wiley Bicentennial Logo: Richard J. Pacifico
About This Book
Why is e-Learning and the Science of Instruction
important?
This is a book about what works in e-learning. Increasingly, organizations are turning to
e-learning to save travel costs and instructional time. In fact e-learning in both synchro-
nous and asynchronous formats is on the rise, accounting for nearly one-third of all training
delivery of workforce learning. However, dollars saved are only an illusion if the quality of the
training suffers.
There are many books on the market that offer useful advice for design and development
of e-learning. But unlike what's in these books, the answers we present are not based on
opinion; they are based on empirical research. Much of this new research is inaccessible to
those producing or evaluating online learning because it has been distributed primarily within
the academic research community. This book bridges the gap by summarizing research-based
answers to questions that practitioners involved with multimedia learning ask about effective
e-learning.
What’s new in the second edition?
The popularity of the first edition was testimony to consumer interest in our evidence-based
guidelines about how to best use visuals, text, audio, practice exercises, and examples in
e-learning. In our second edition, we have updated the previous chapters by adding new
research, guidelines, and examples. You will also find two new chapters on simulations/games
and on segmenting and sequencing of e-learning content. In all of our chapters, we have
expanded our coverage to show how our guidelines apply to virtual classroom forms of
e-learning. Finally, to illustrate our guidelines, we include a CD with a multimedia lesson
example and counterexample.
What can you achieve with this book?
If you are a designer, developer, or consumer of e-learning, you can use the guidelines in this
book to ensure that your courseware meets human psychological learning requirements. In
particular you can learn the best ways to:
• Communicate your content with words and visuals
• Use audio to describe visuals
3.
• Avoid overloadinglearners with extraneous media effects
• Design examples and practice exercises that build new skills
• Use networked collaborative facilities effectively for learning
• Evaluate simulations and games for relevance to your instructional goals
How is this book organized?
Chapters 1 and 2 lay the foundation for the book by defining e-learning and describing how
the methods used in e-learning can promote or defeat learning processes.
Chapters 3 through 9 summarize the multimedia principles developed by over twenty-five
years of research by Richard Mayer at the University of California. In these chapters, you will
read the guidelines, the evidence, and examples of how to best use visuals, text, and audio, as
well as content segmenting and sequencing in e-learning.
Chapters 10 through 14 focus on guidelines related to important instructional methods
and approaches in e-learning, including use of examples, practice and feedback, collaboration
facilities, navigation tools, and techniques to build critical thinking skills.
Chapter 15 is new to this edition and introduces the research and issues to consider in use
of games and simulations in e-learning.
Chapter 16 integrates all of the book's guidelines into a comprehensive checklist and
illustrates how they apply in concert to asynchronous and synchronous e-learning examples.
See the Introduction for a summary of what is covered in each chapter.
4.
About Pfeiffer
Pfeiffer servesthe professional development and hands-on resource needs of training and
human resource practitioners and gives them products to do their jobs better. We deliver
proven ideas and solutions from experts in HR development and HR management, and we
offer effective and customizable tools to improve workplace performance. From novice to
seasoned professional, Pfeiffer is the source you can trust to make yourself and your organi-
zation more successful.
Essential Knowledge Pfeiffer produces insightful, practical, and comprehen-
sive materials on topics that matter the most to training and HR professionals. Our
Essential Knowledge resources translate the expertise of seasoned professionals into practical,
how-to guidance on critical workplace issues and problems. These resources are supported by
case studies, worksheets, and job aids and are frequently supplemented with CD-ROMs, web-
sites, and other means of making the content easier to read, understand, and use.
Essential Tools Pfeiffer’s Essential Tools resources save time and expense by
offering proven, ready-to-use materials—including exercises, activities, games, instru-
ments, and assessments—for use during a training or team-learning event. These resources are
frequently offered in looseleaf or CD-ROM format to facilitate copying and customization of
the material.
Pfeiffer also recognizes the remarkable power of new technologies in expanding the reach
and effectiveness of training. While e-hype has often created whizbang solutions in search of
a problem, we are dedicated to bringing convenience and enhancements to proven training
solutions. All our e-tools comply with rigorous functionality standards. The most appropriate
technology wrapped around essential content yields the perfect solution for today’s on-the-
go trainers and human resource professionals.
Essential resources for training and HR professionals
w w w. p f e i f f e r. c o m
6.
e-Learning
and the Science of
Instruction
Proven Guidelines for Consumers and
Designers of Multimedia Learning
Second Edition
Ruth Colvin Clark • Richard E. Mayer
CONTENTS
Acknowledgments xv
Introduction 1
1. e-Learning: Promise and Pitfalls 7
The e-Learning Bandwagon 8
What Is e-Learning? 10
Self-Study Versus Virtual Classroom e-Learning 11
e-Learning Development Process 13
Two Types of e-Learning Goals: Inform and Perform 17
Is e-Learning Better? Media Comparison Research 19
What Makes e-Learning Unique? 22
e-Learning: The Pitfalls 24
What Is Good e-Courseware? 25
Learning in e-Learning 28
vii
9.
viii Contents
2. How Do People Learn from e-Courses 31
How Do People Learn? 33
How Do e-Lessons Affect Human Learning? 37
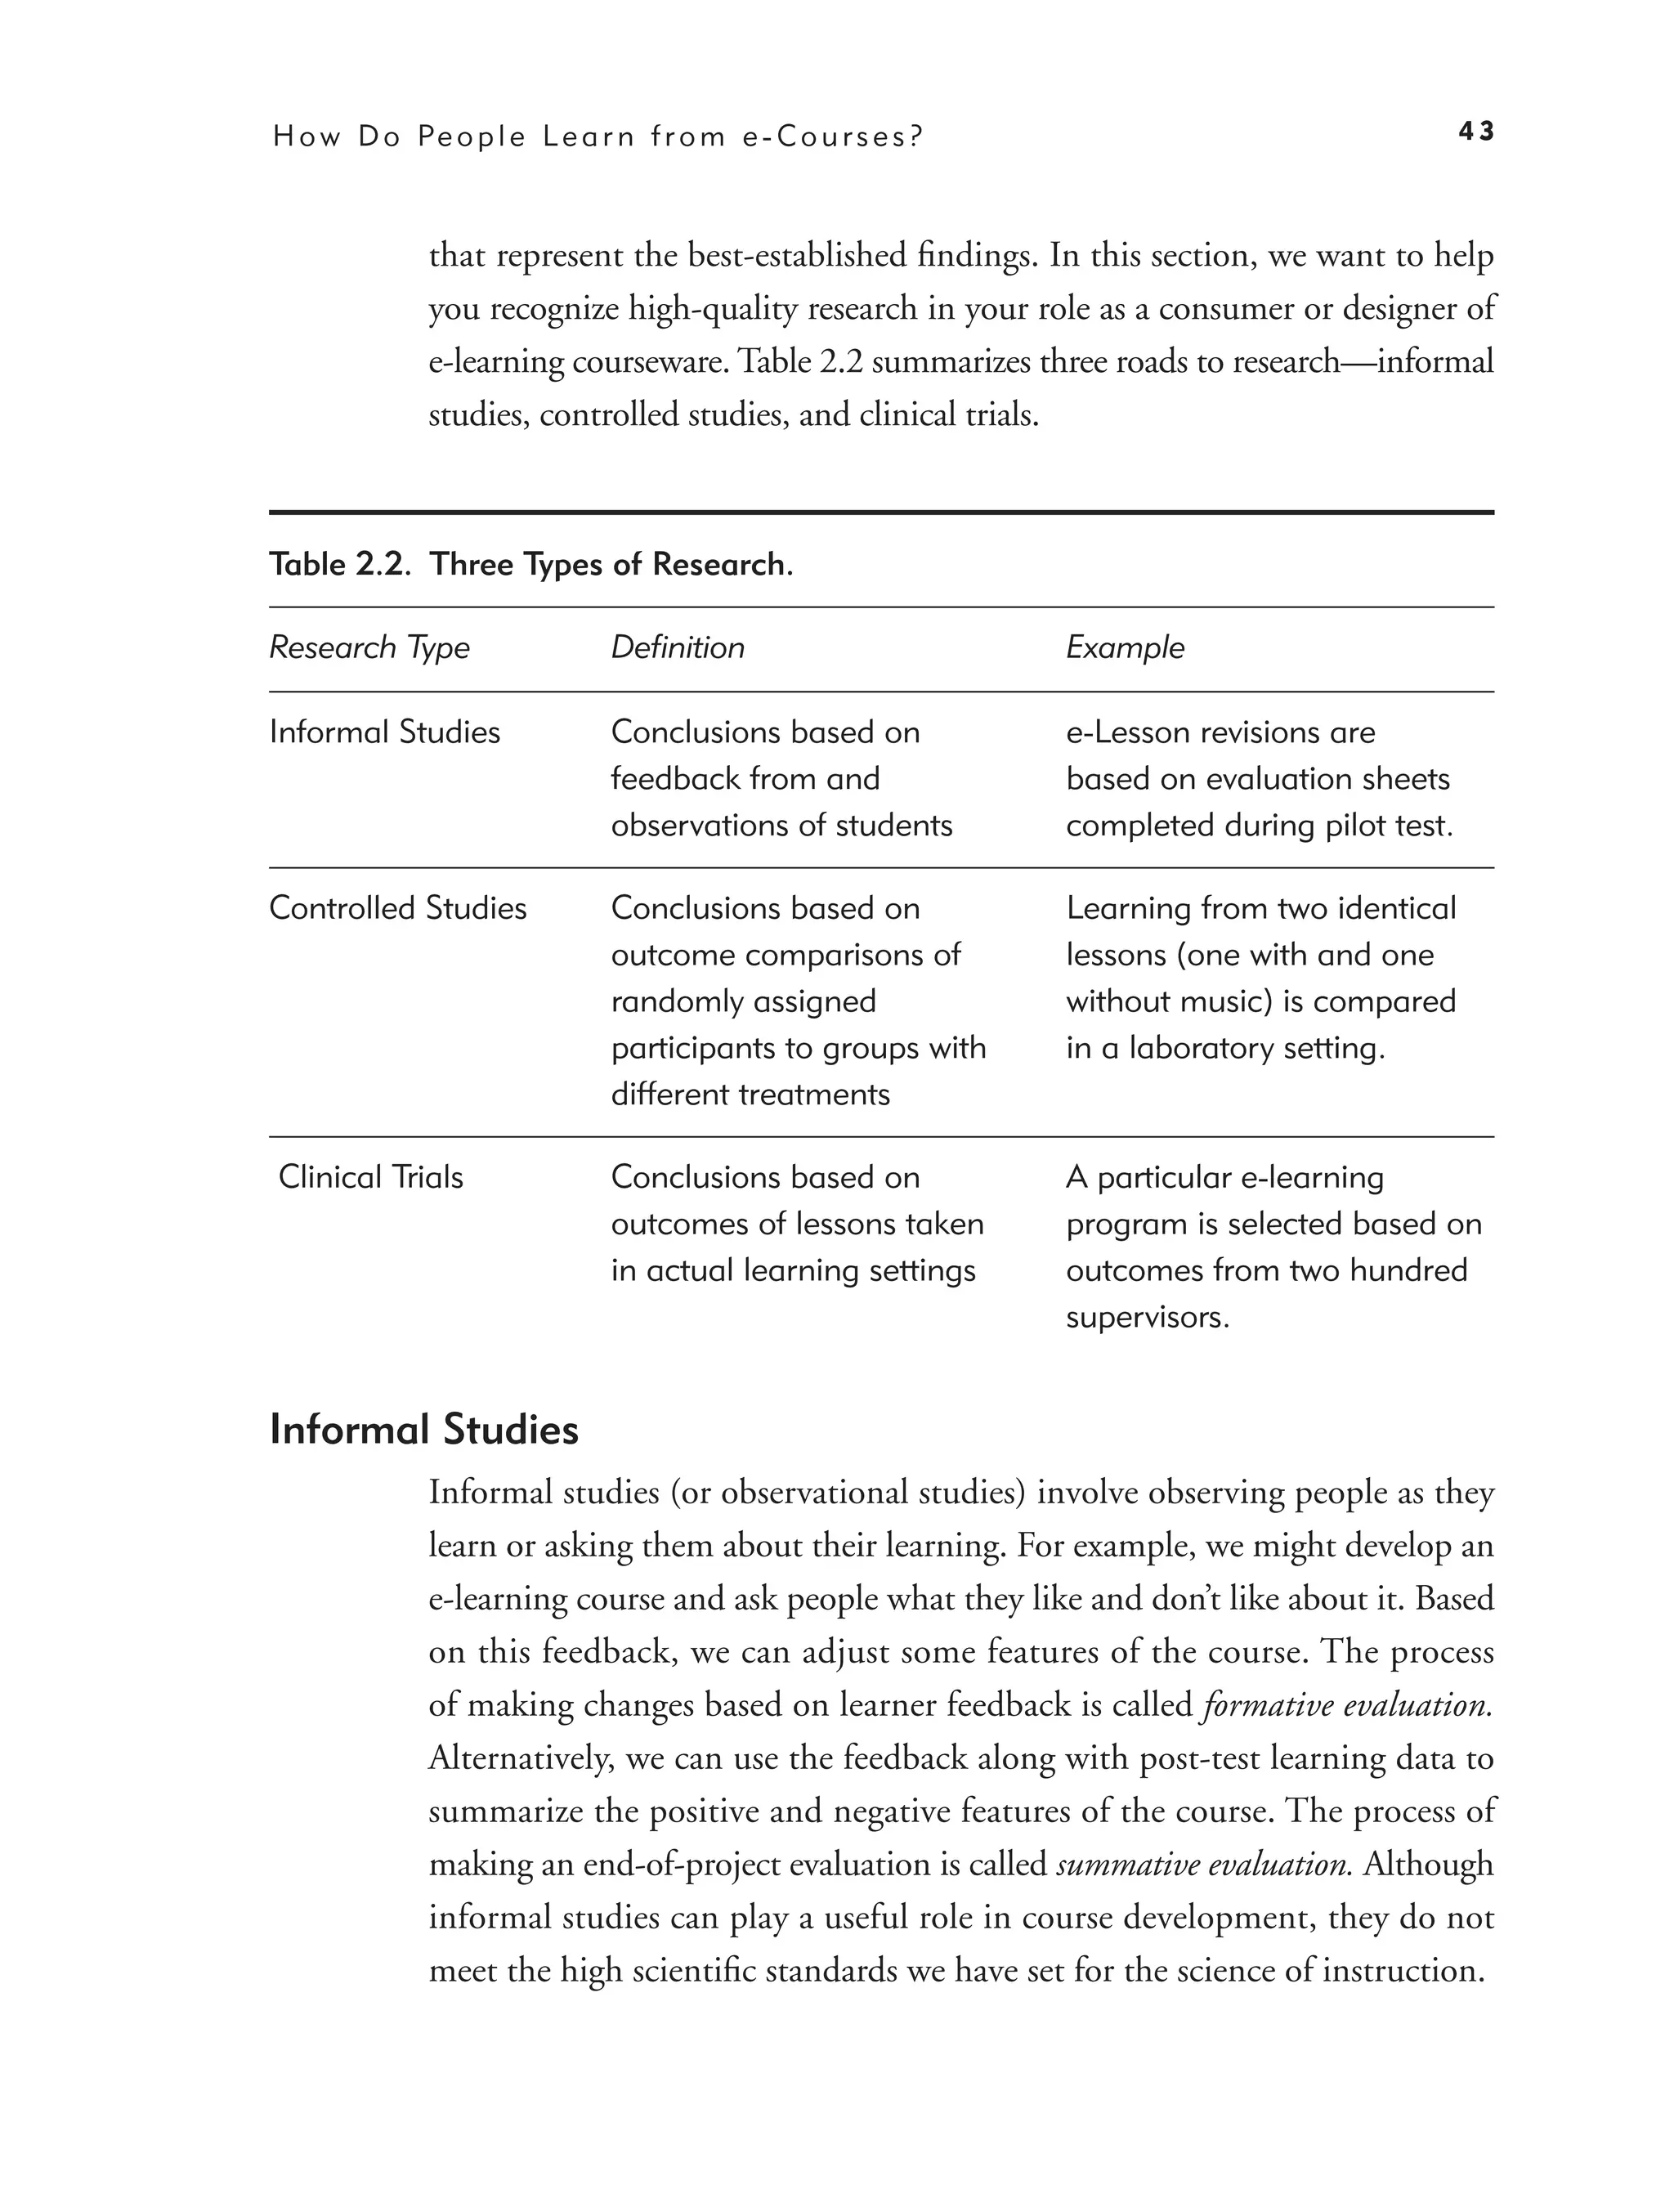
What Is Good Research? 42
How Can You Identify Relevant Research? 45
How Do You Interpret Research Statistics? 46
What We Don’t Know About Learning 48
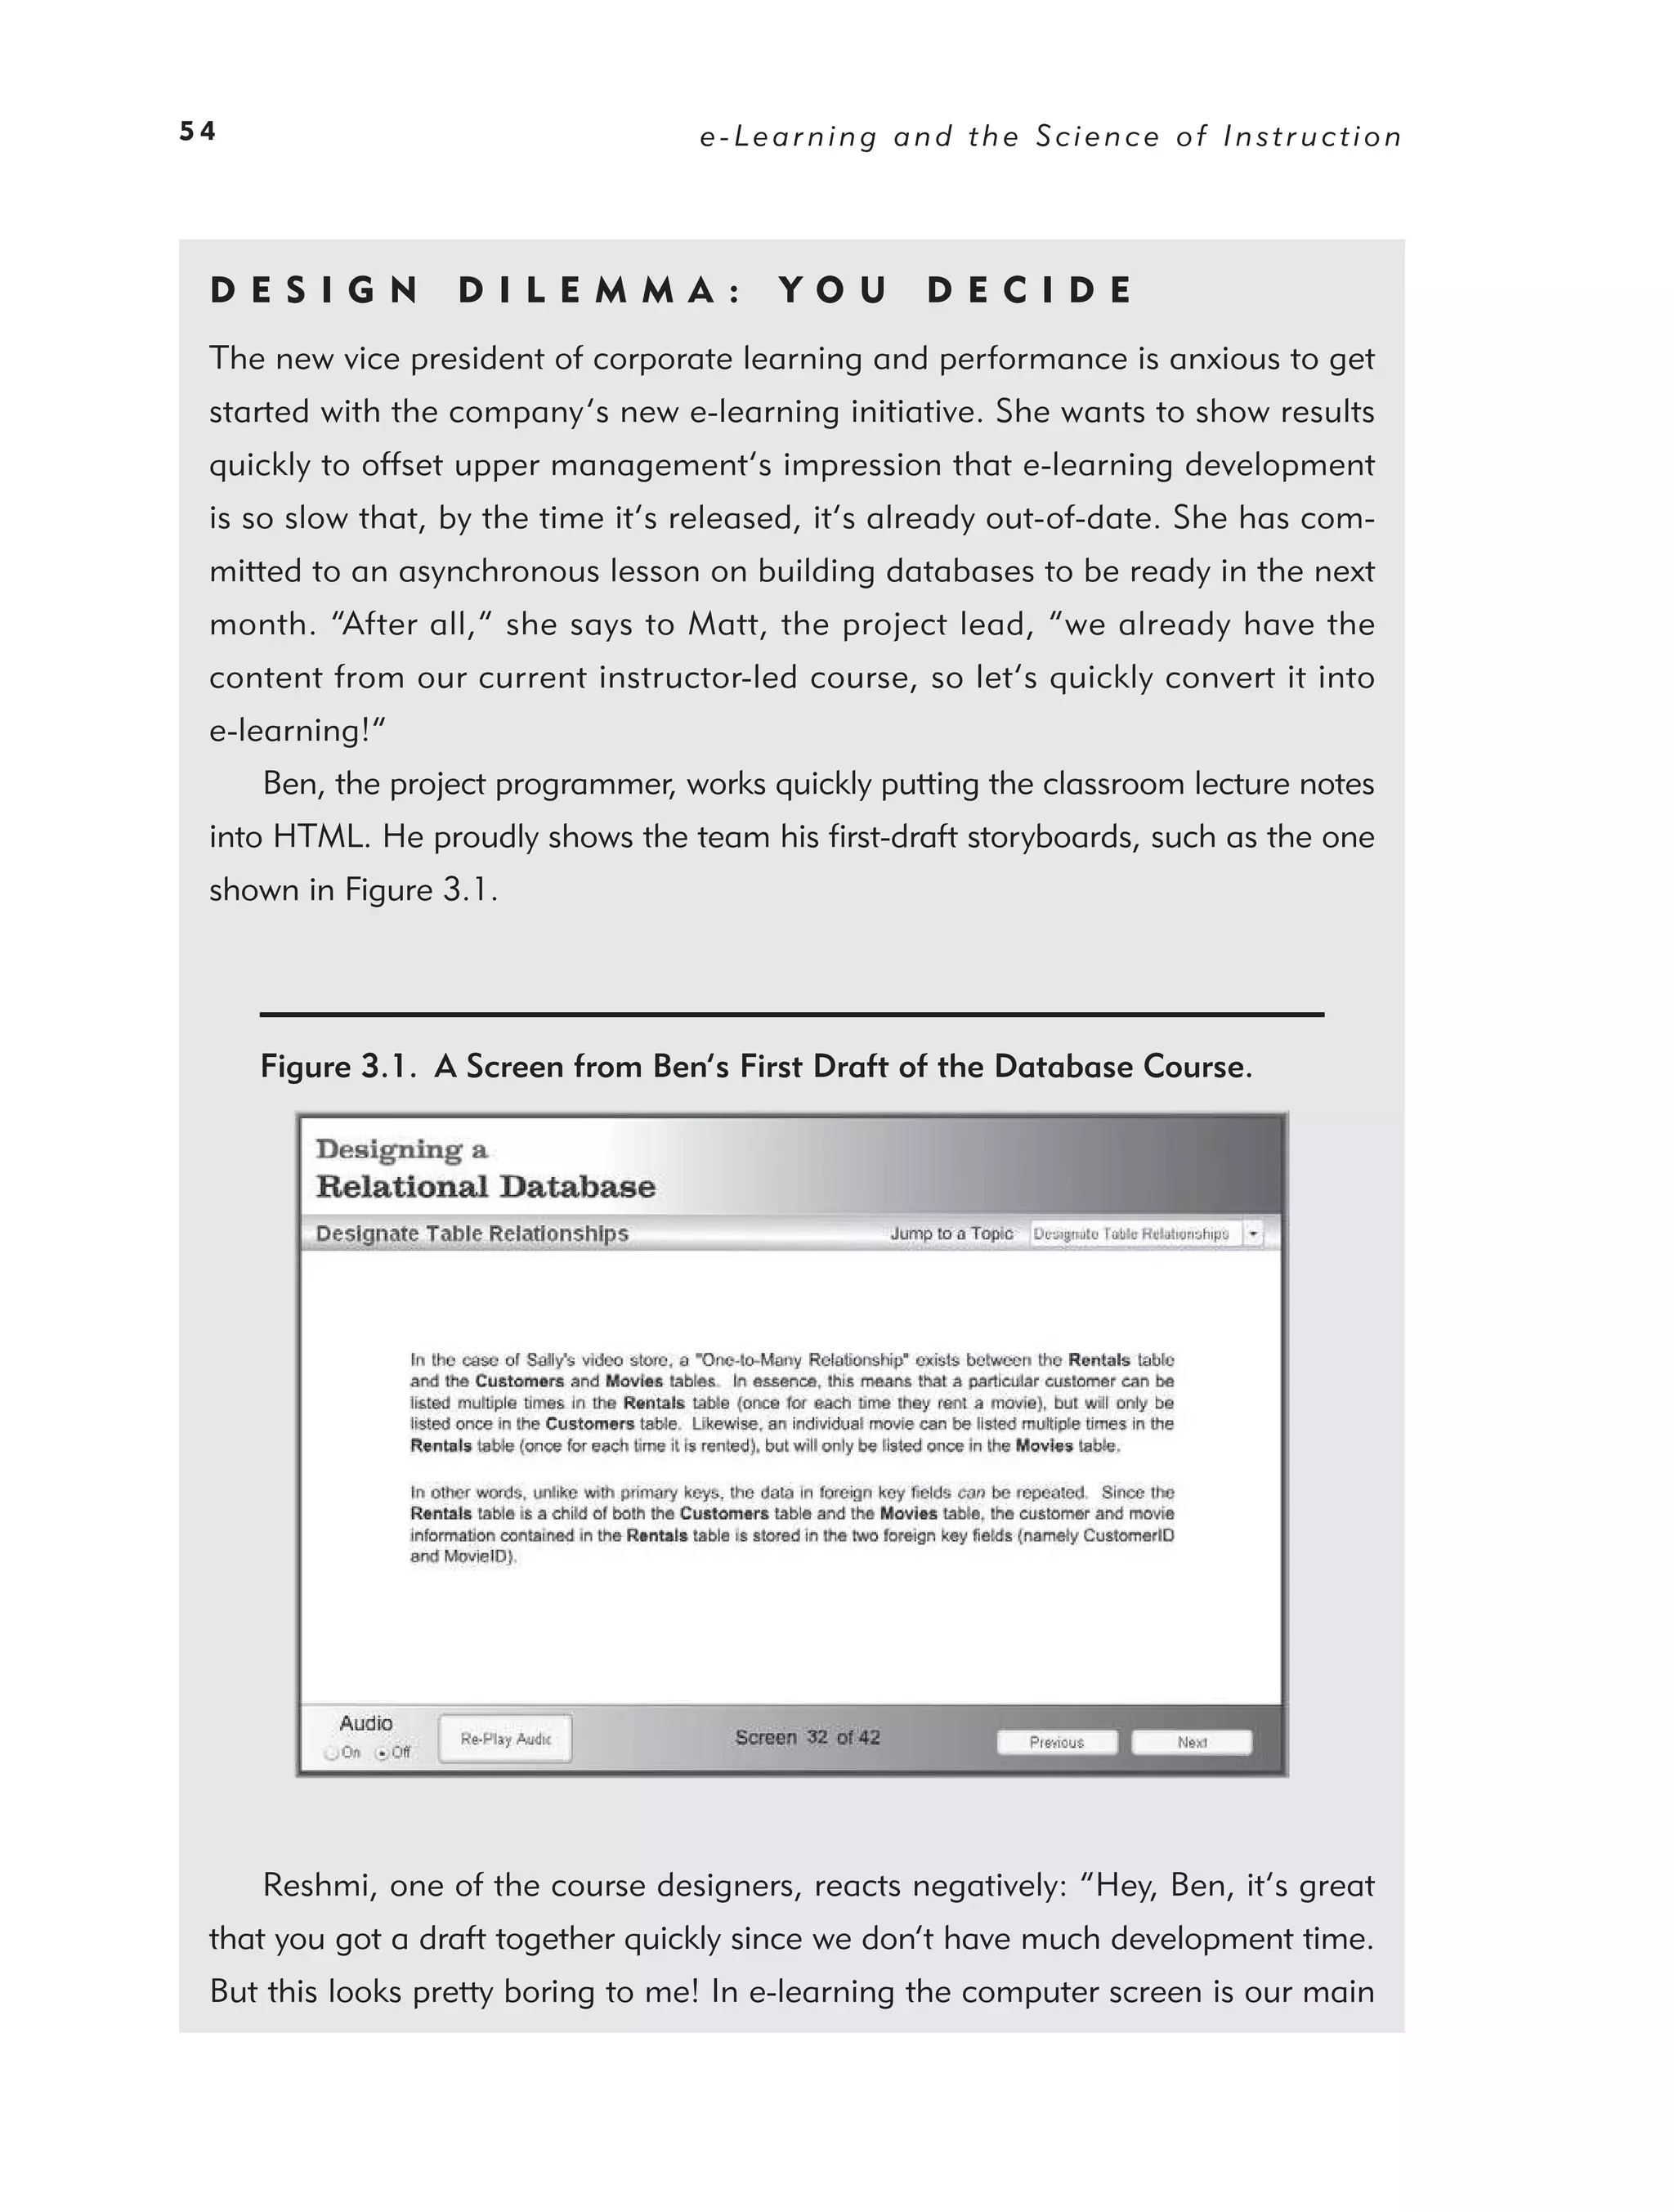
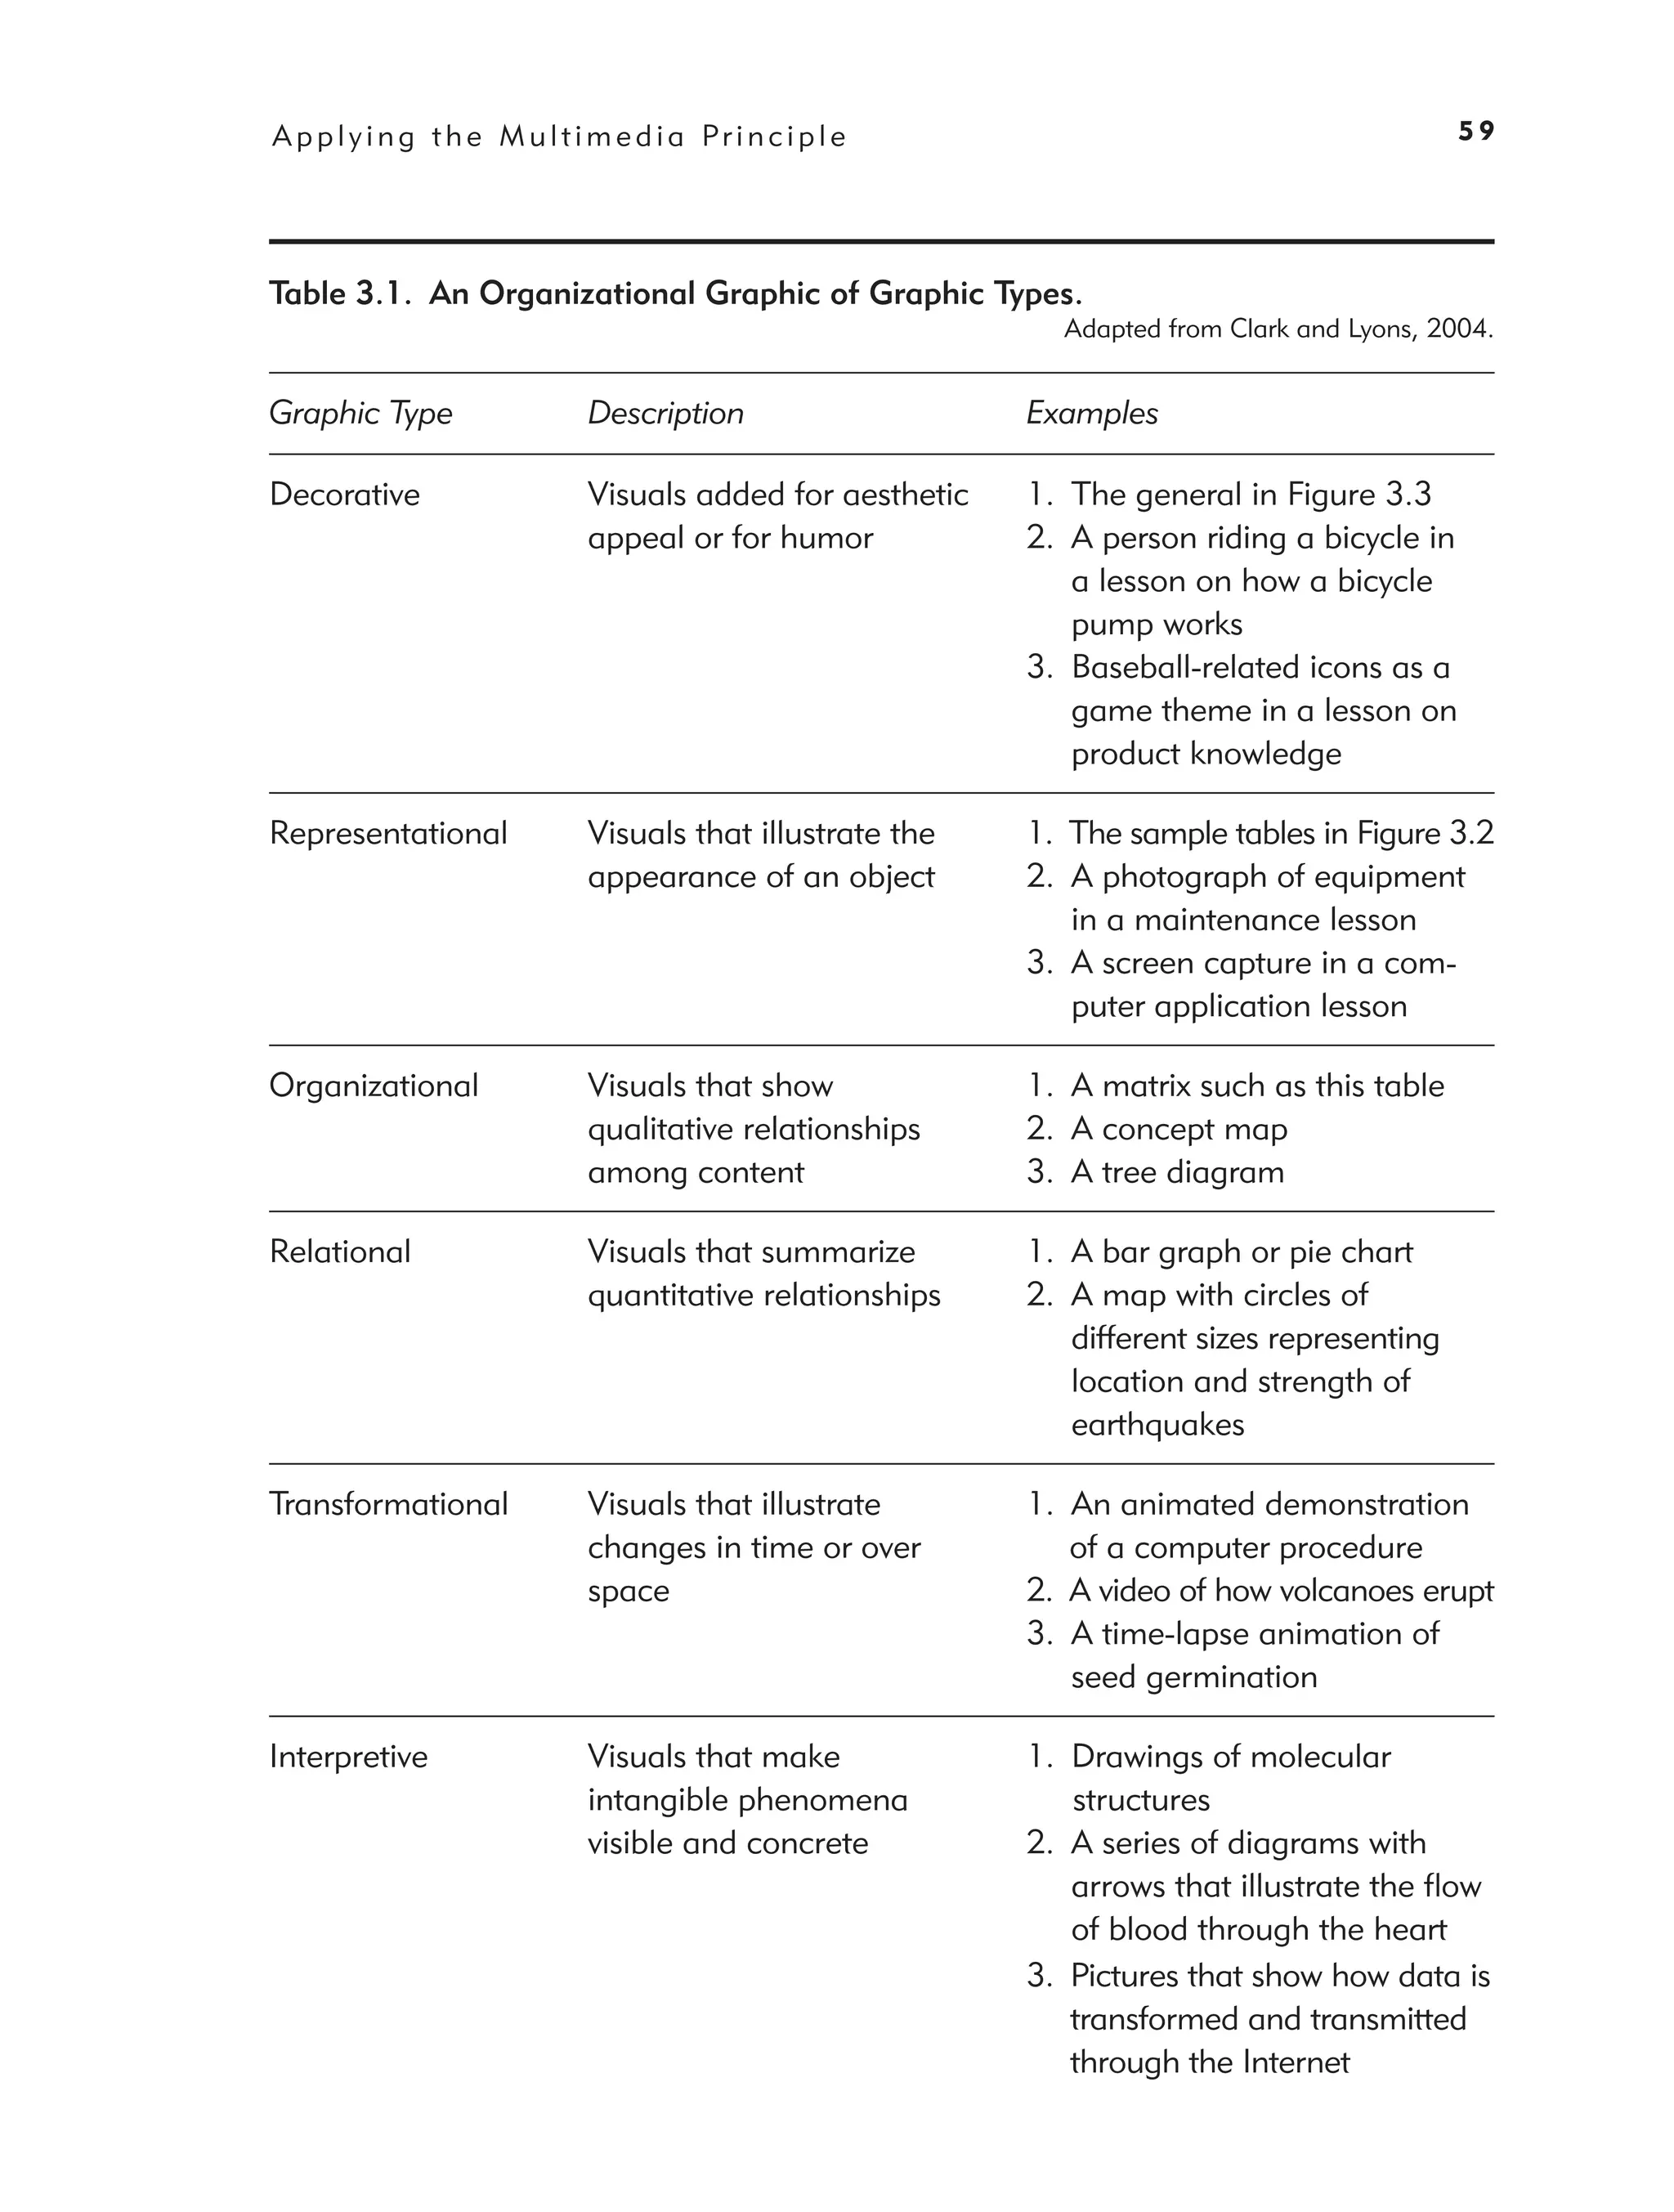
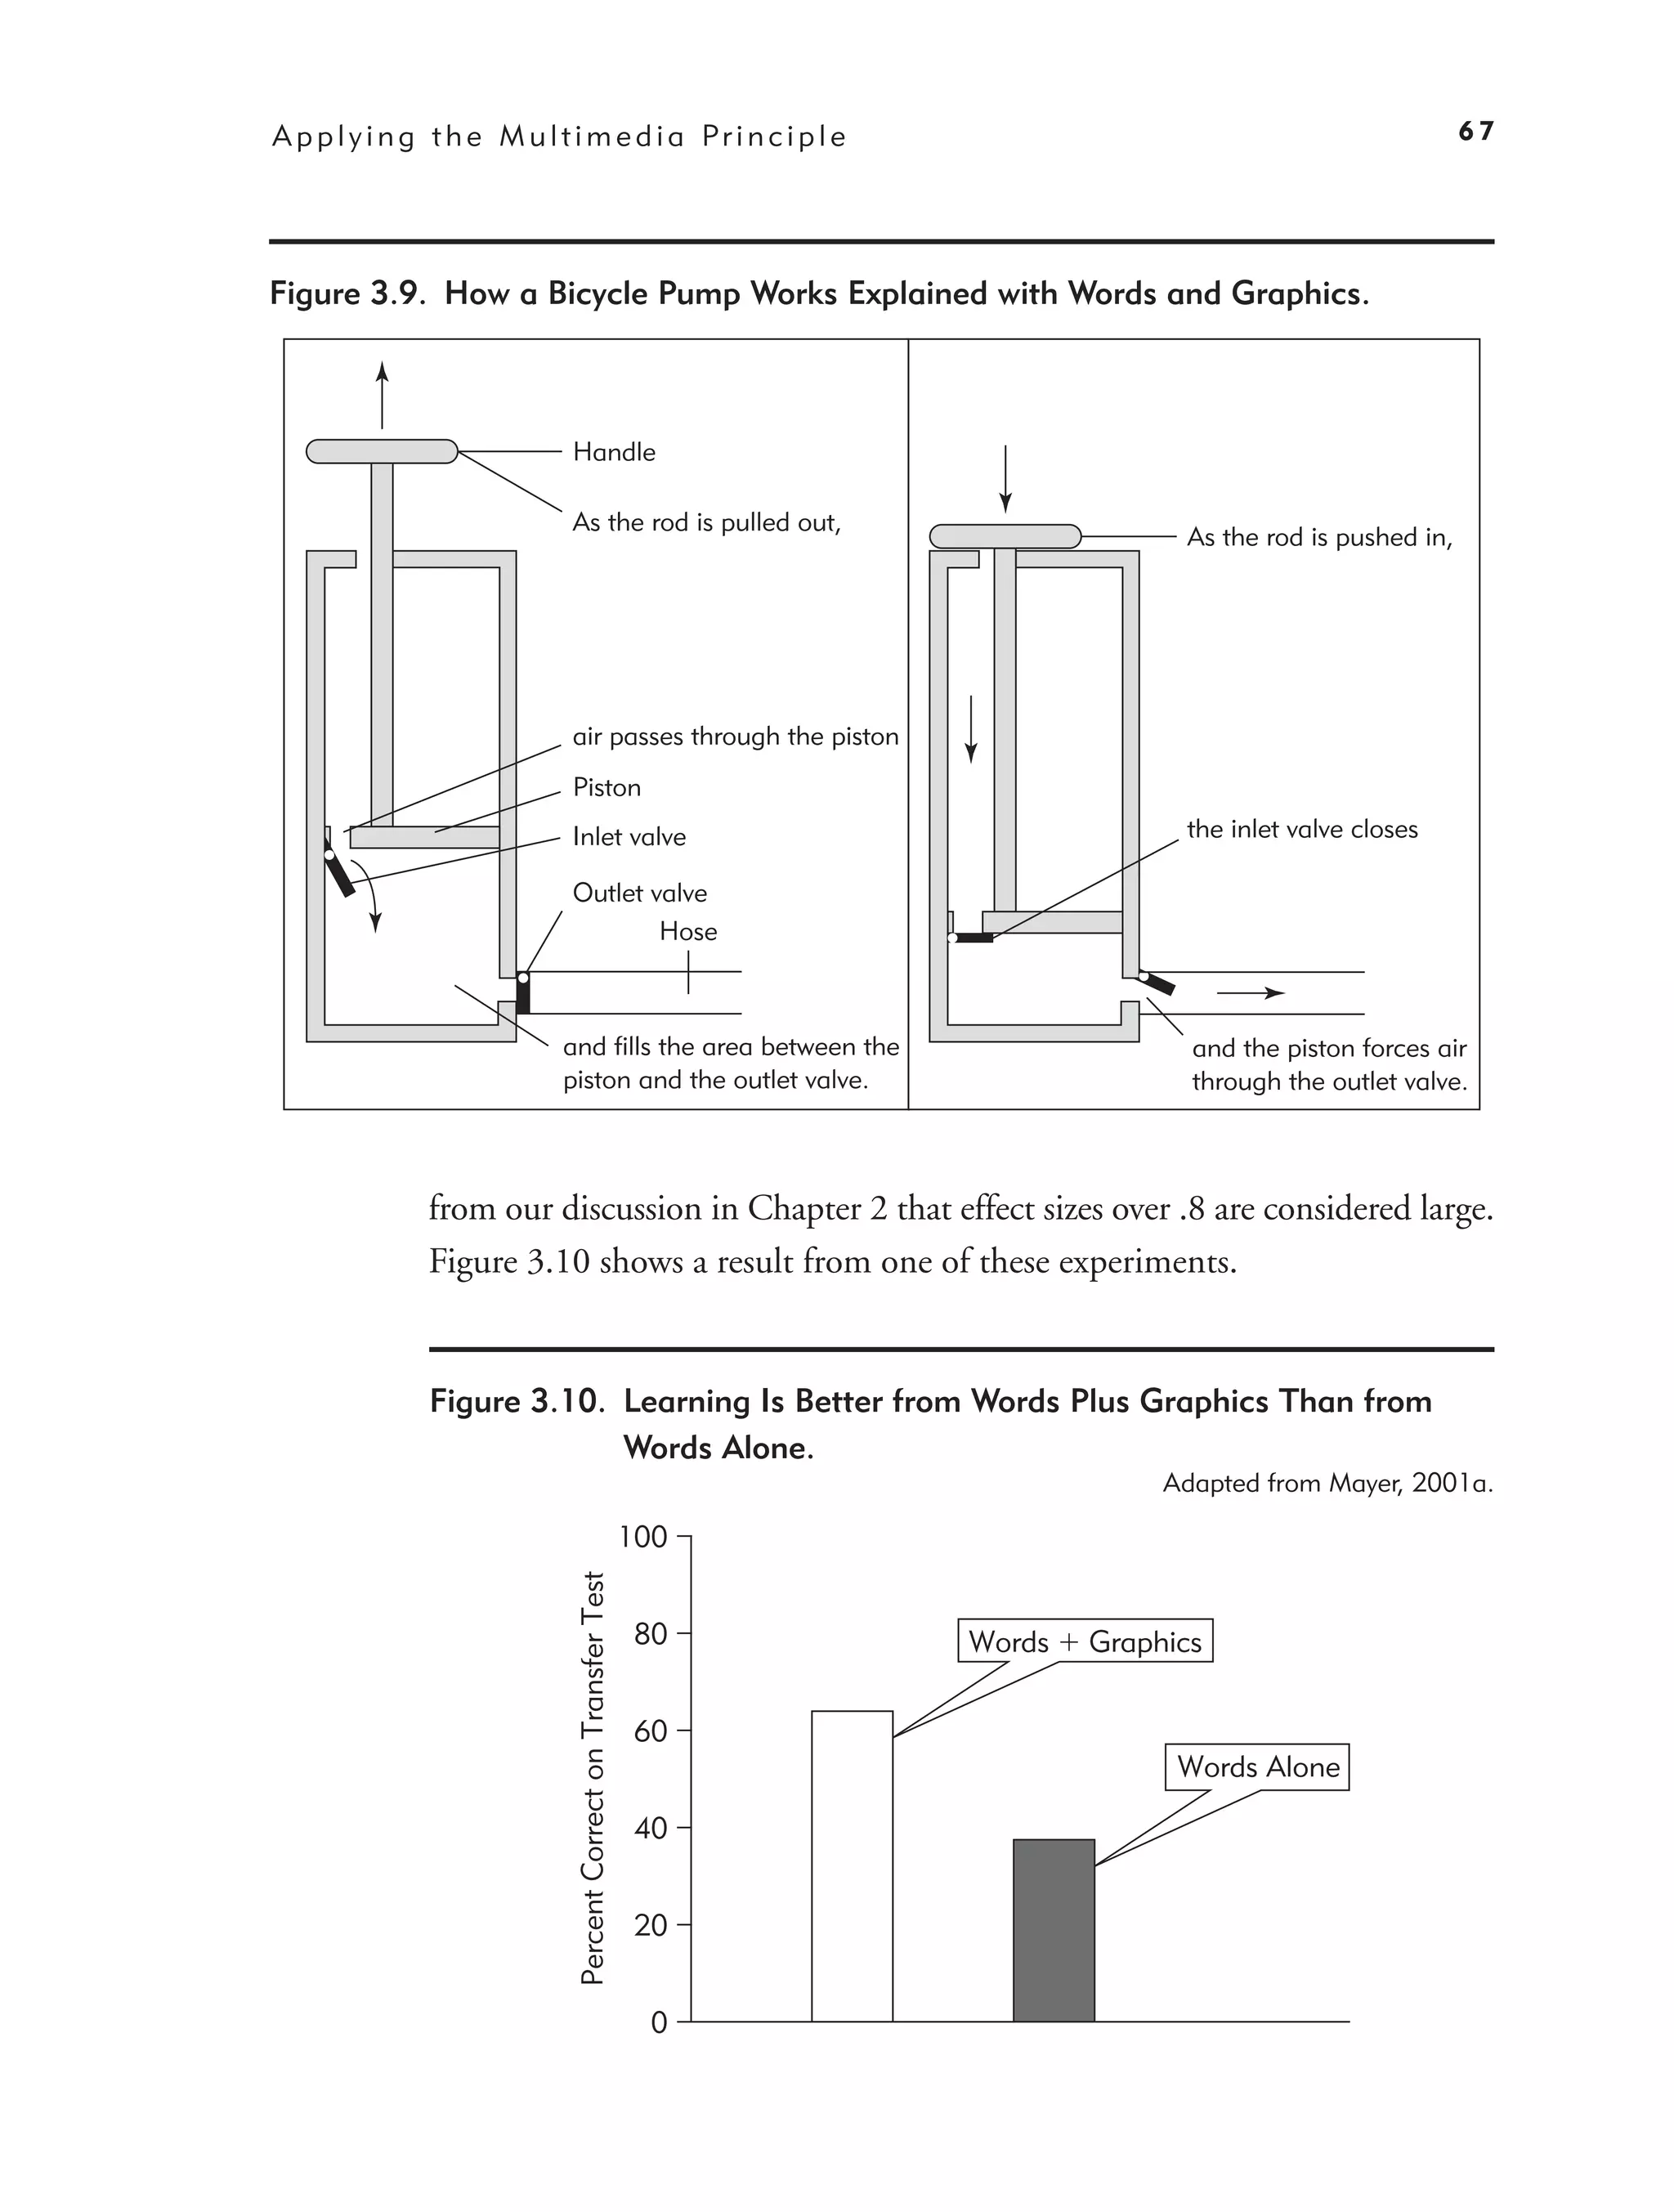
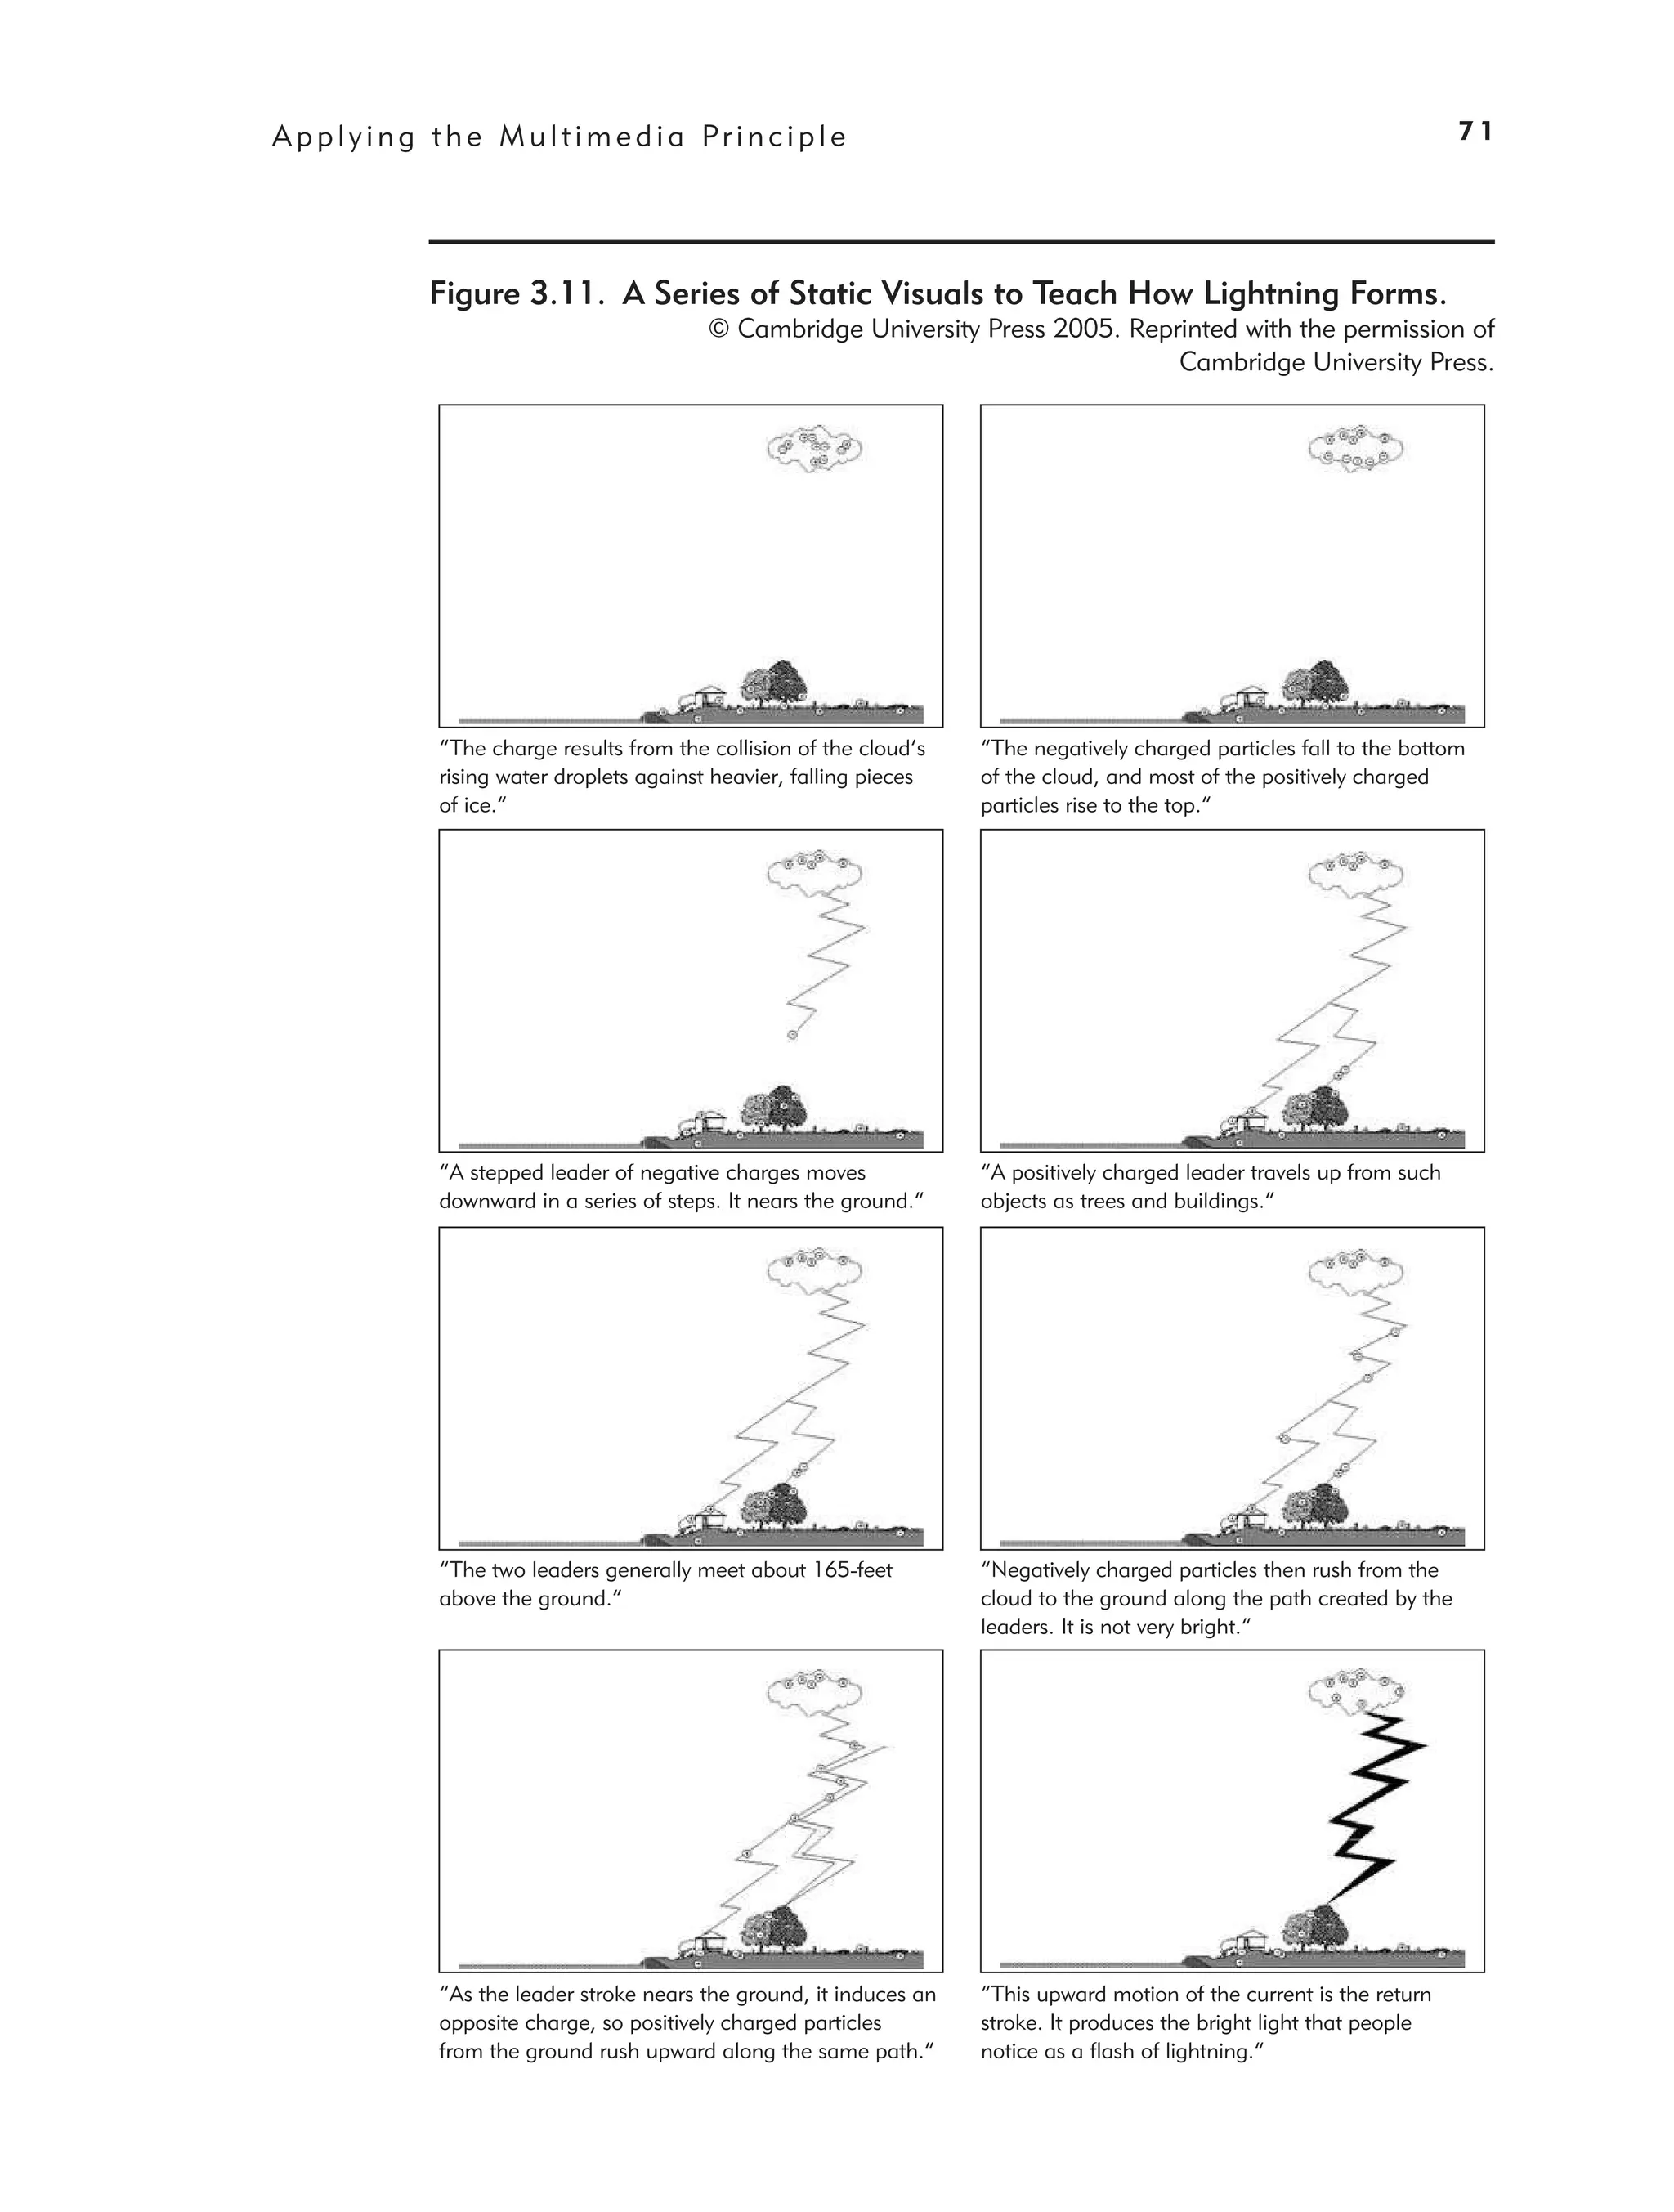
3. Applying the Multimedia Principle: Use Words and Graphics
Rather Than Words Alone 53
Do Visuals Make a Difference? 55
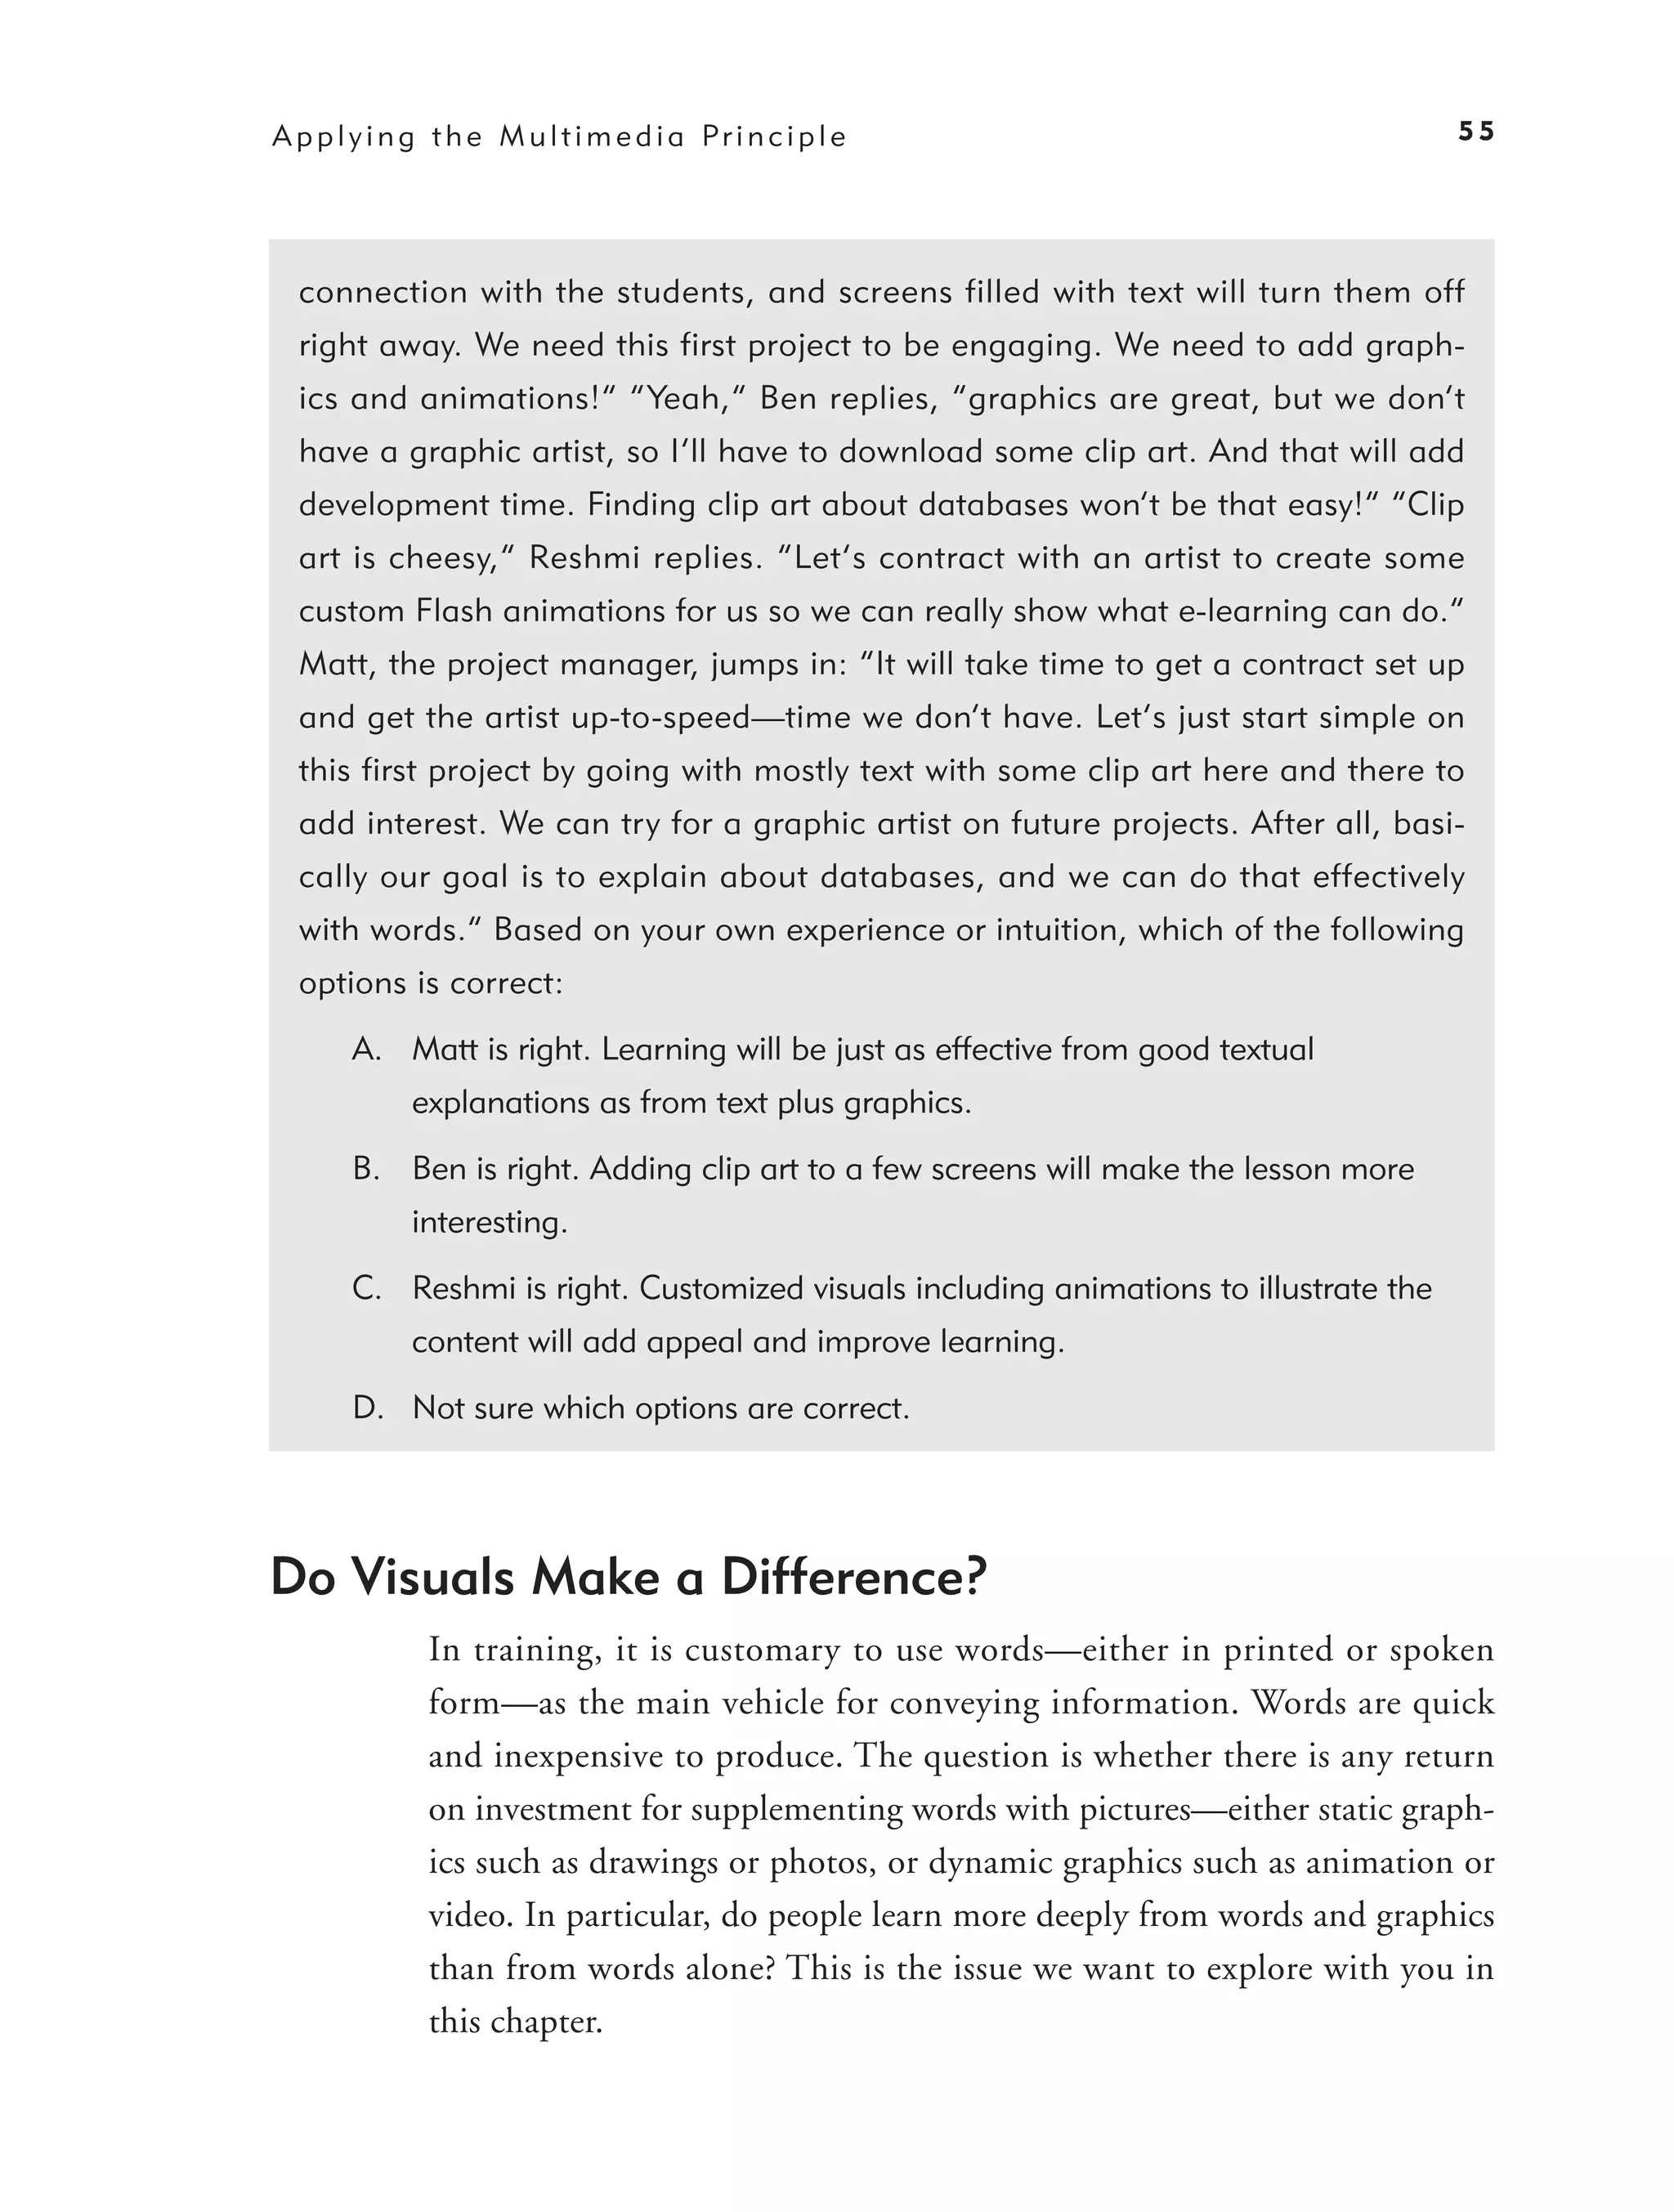
Multimedia Principle: Include Both Words and Graphics 56
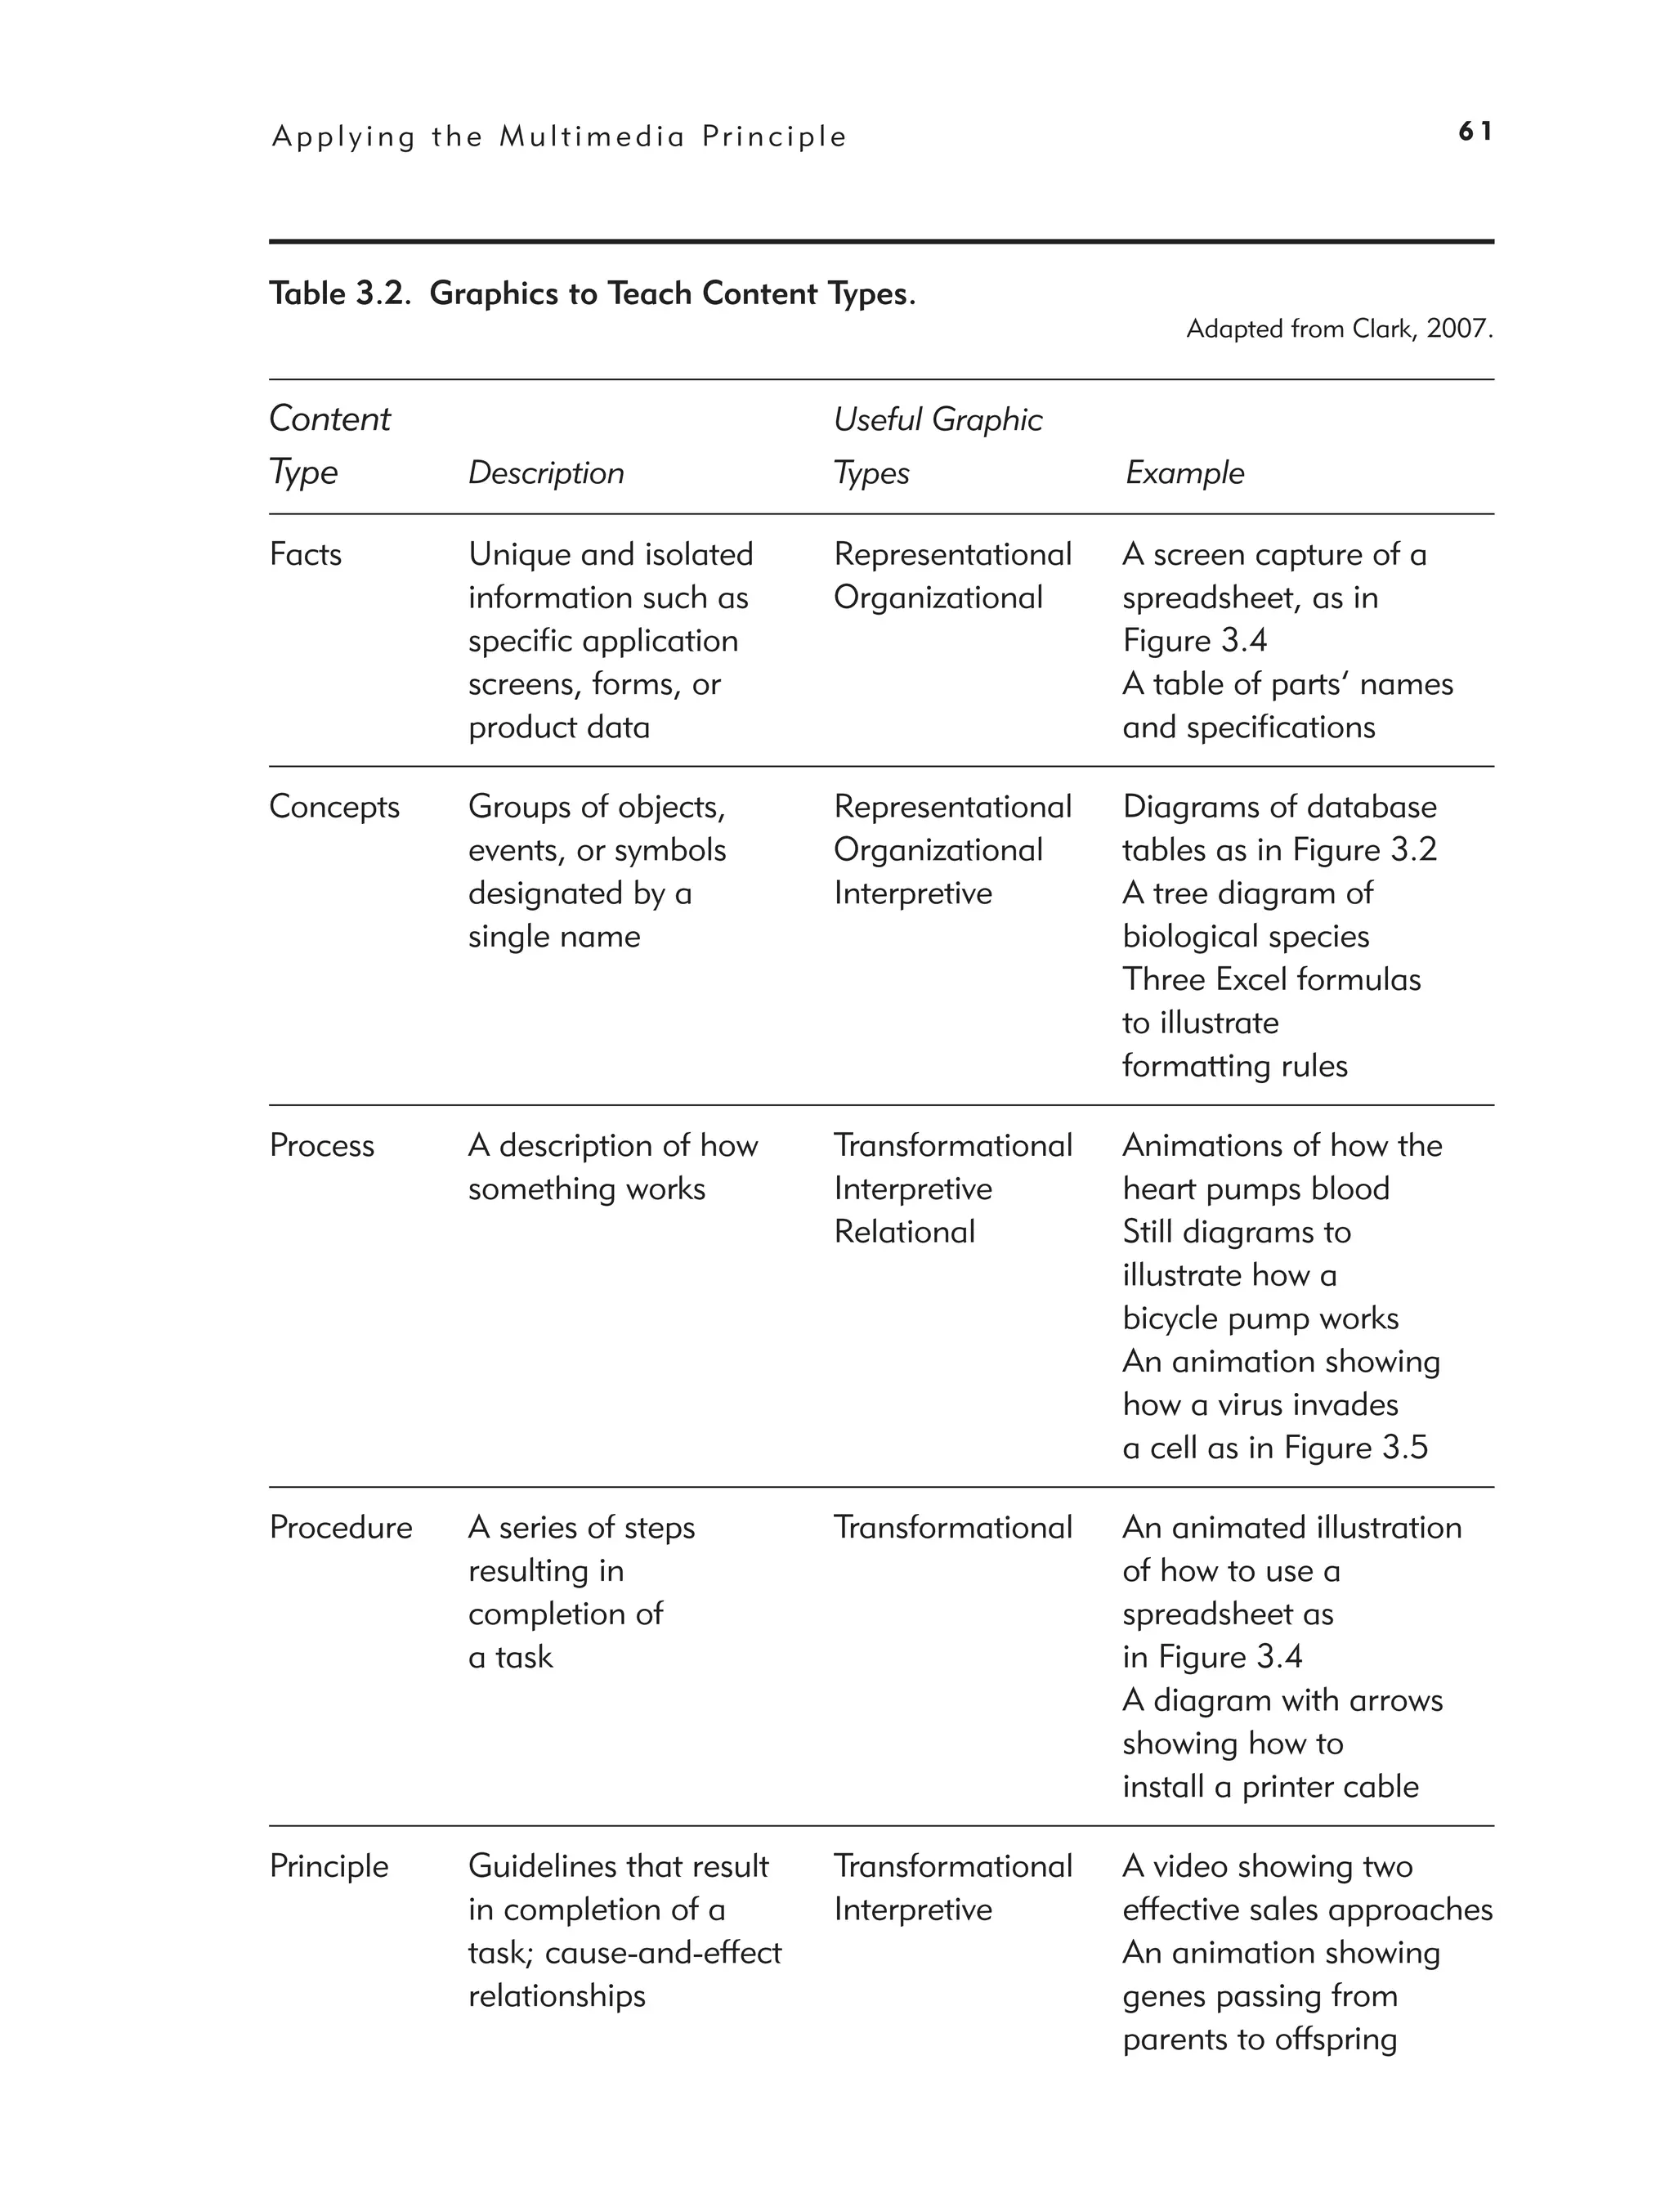
Some Ways to Use Graphics to Promote Learning 60
Psychological Reasons for the Multimedia Principle 65
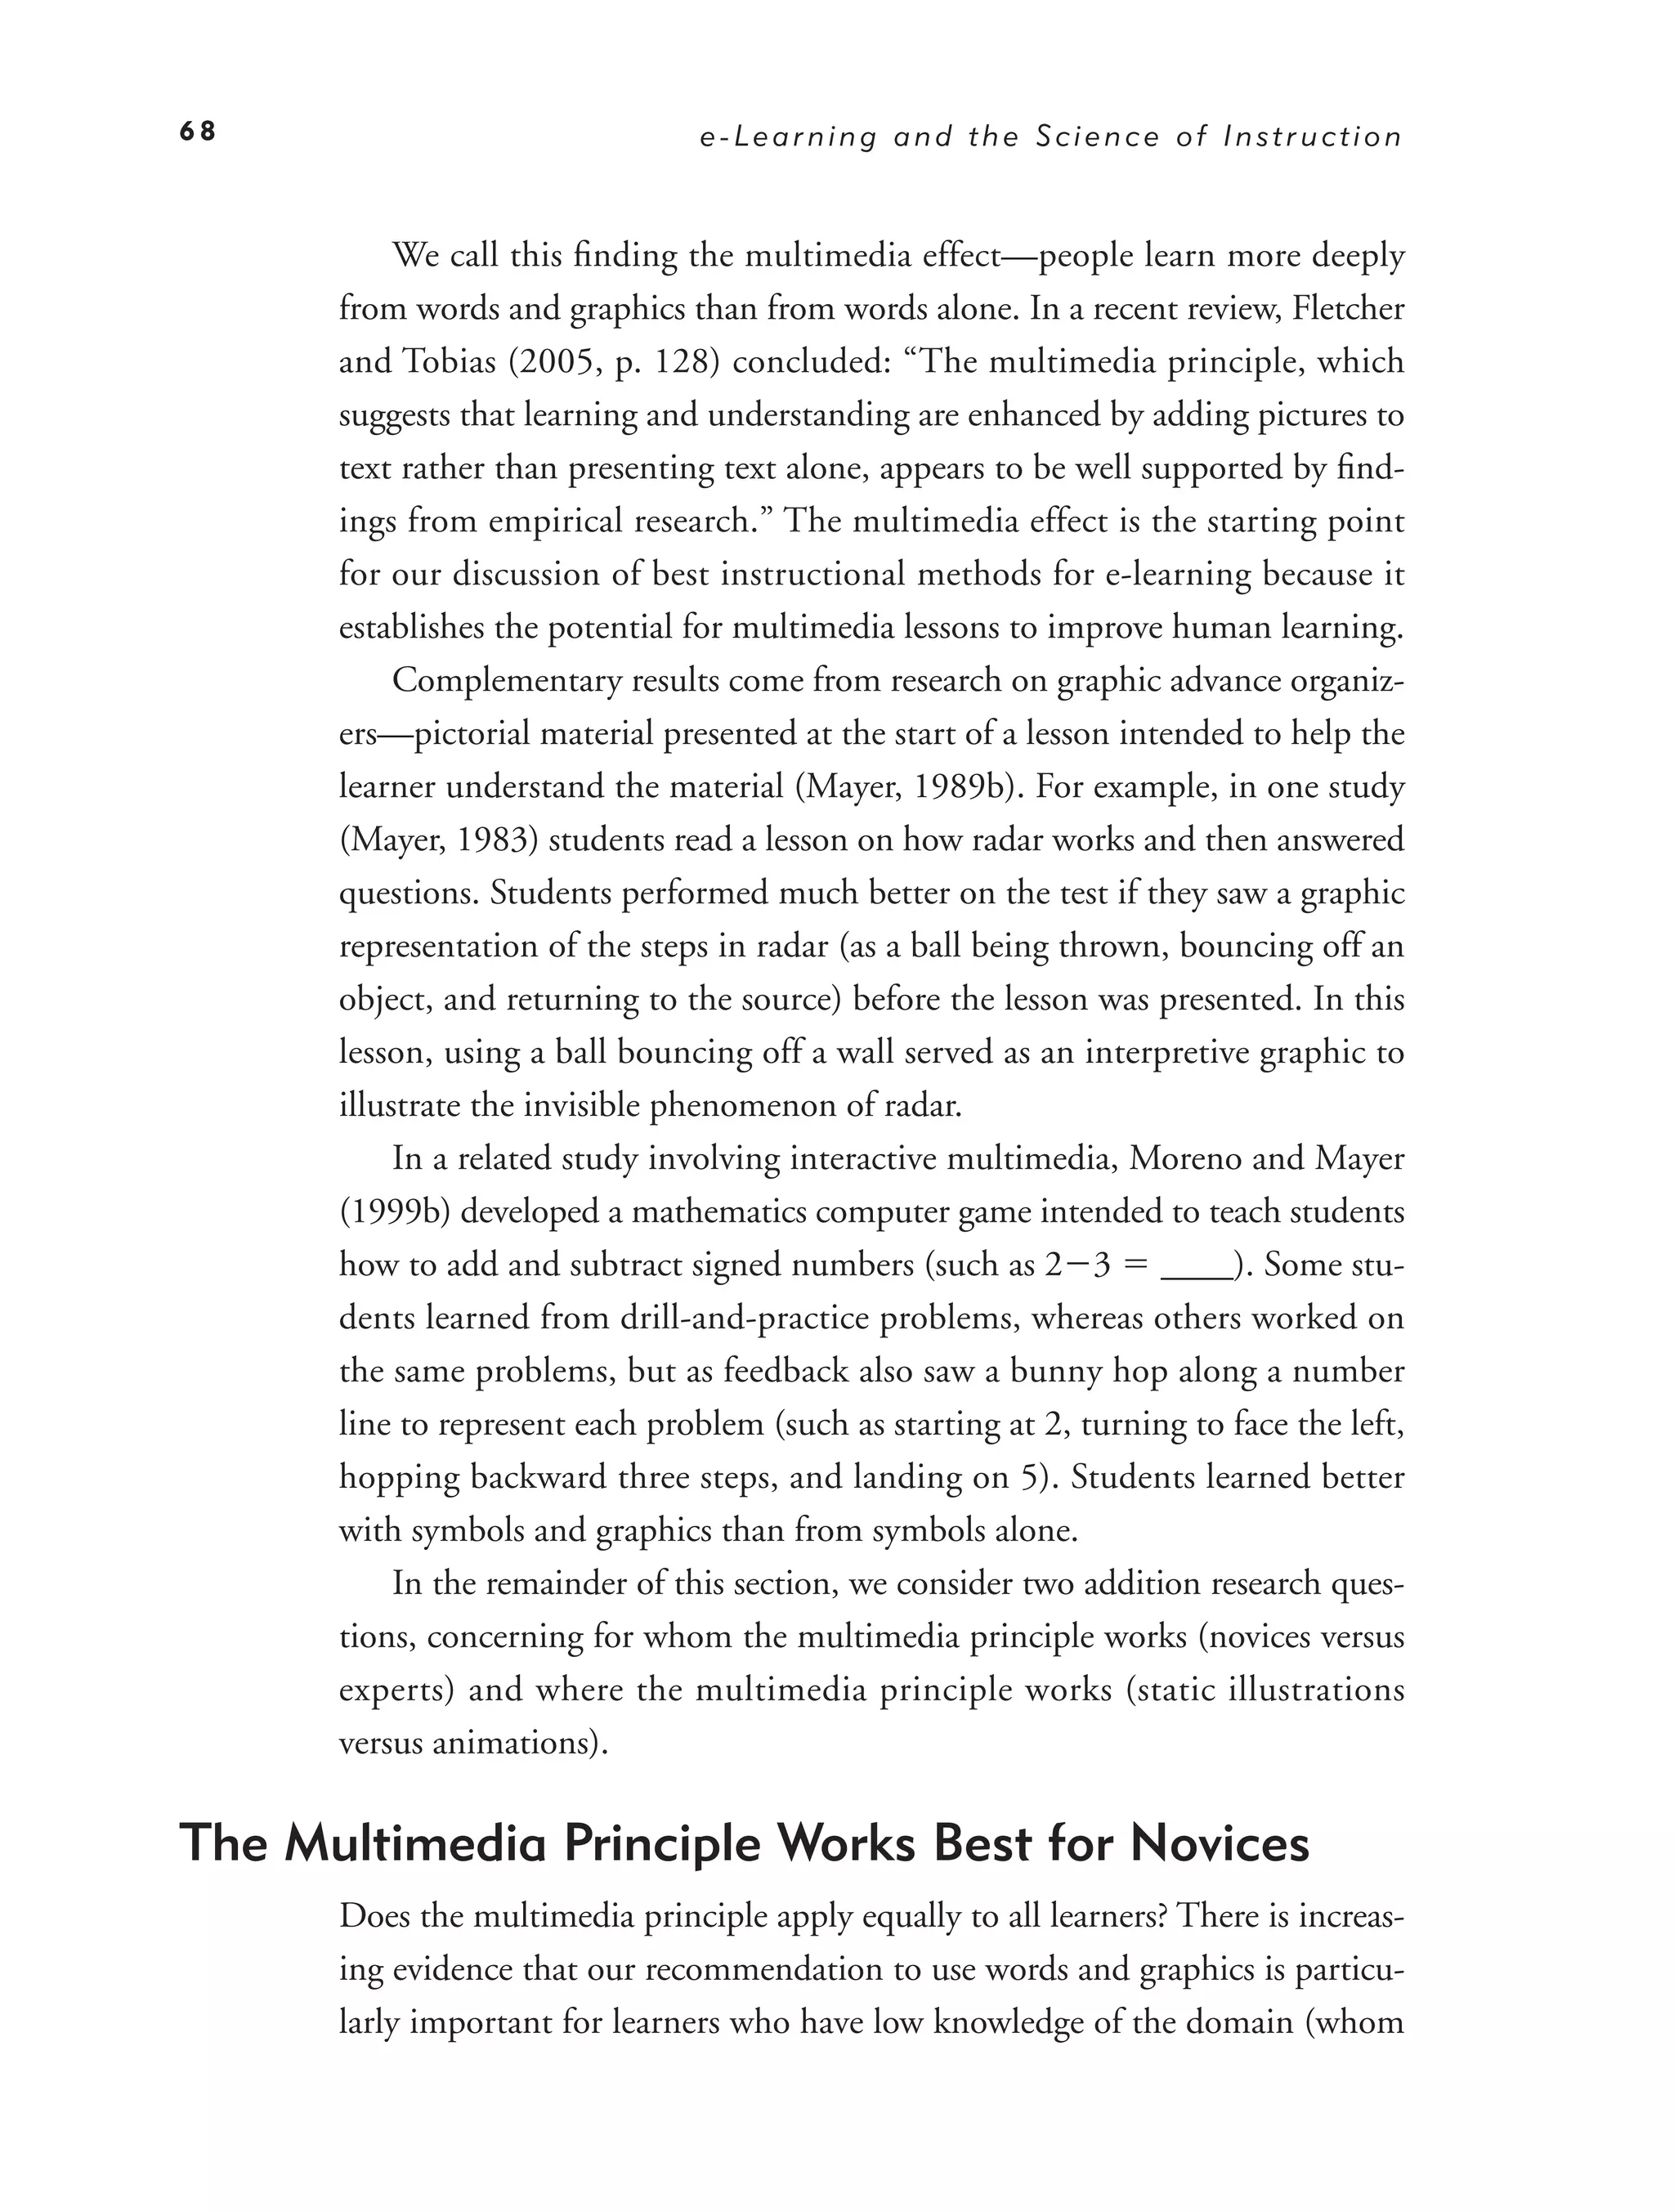
Evidence for Using Words and Pictures 66
The Multimedia Principle Works Best for Novices 68
Should You Change Static Illustrations into Animations? 69
What We Don’t Know About Visuals 72
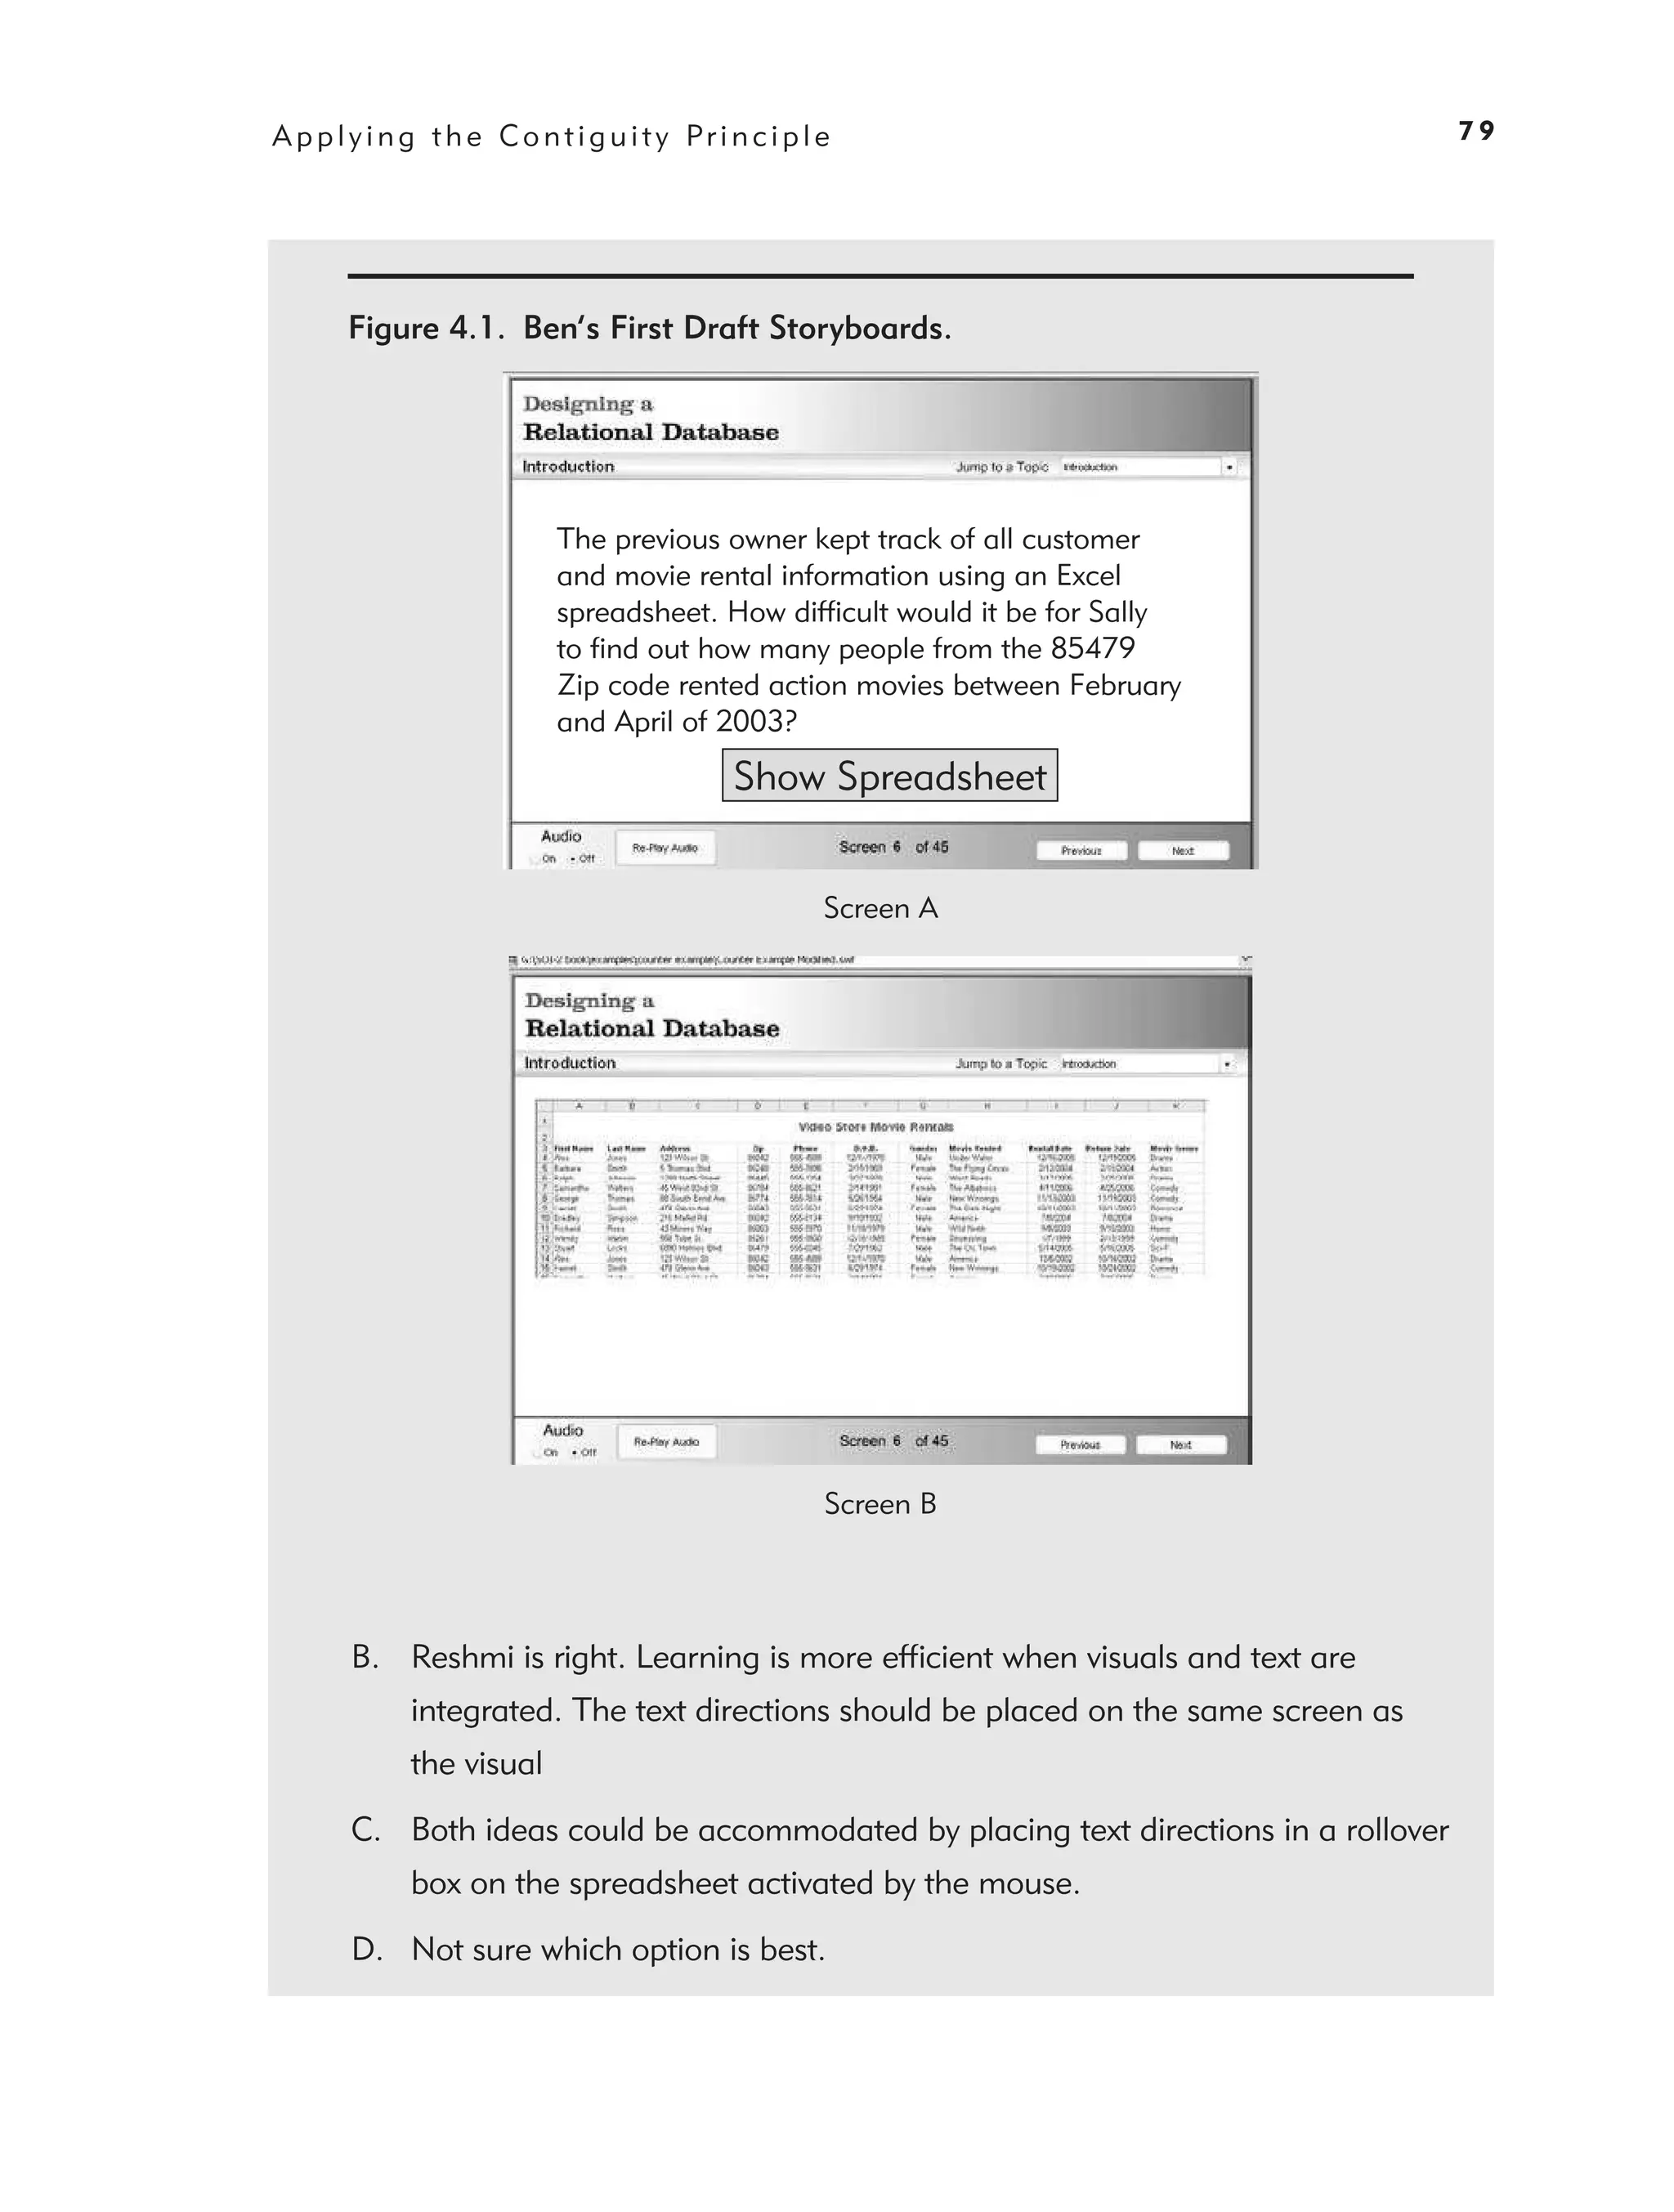
4. Applying the Contiguity Principle: Align Words to
Corresponding Graphics 77
Contiguity Principle 1: Place Printed Words Near Corresponding
Graphics 80
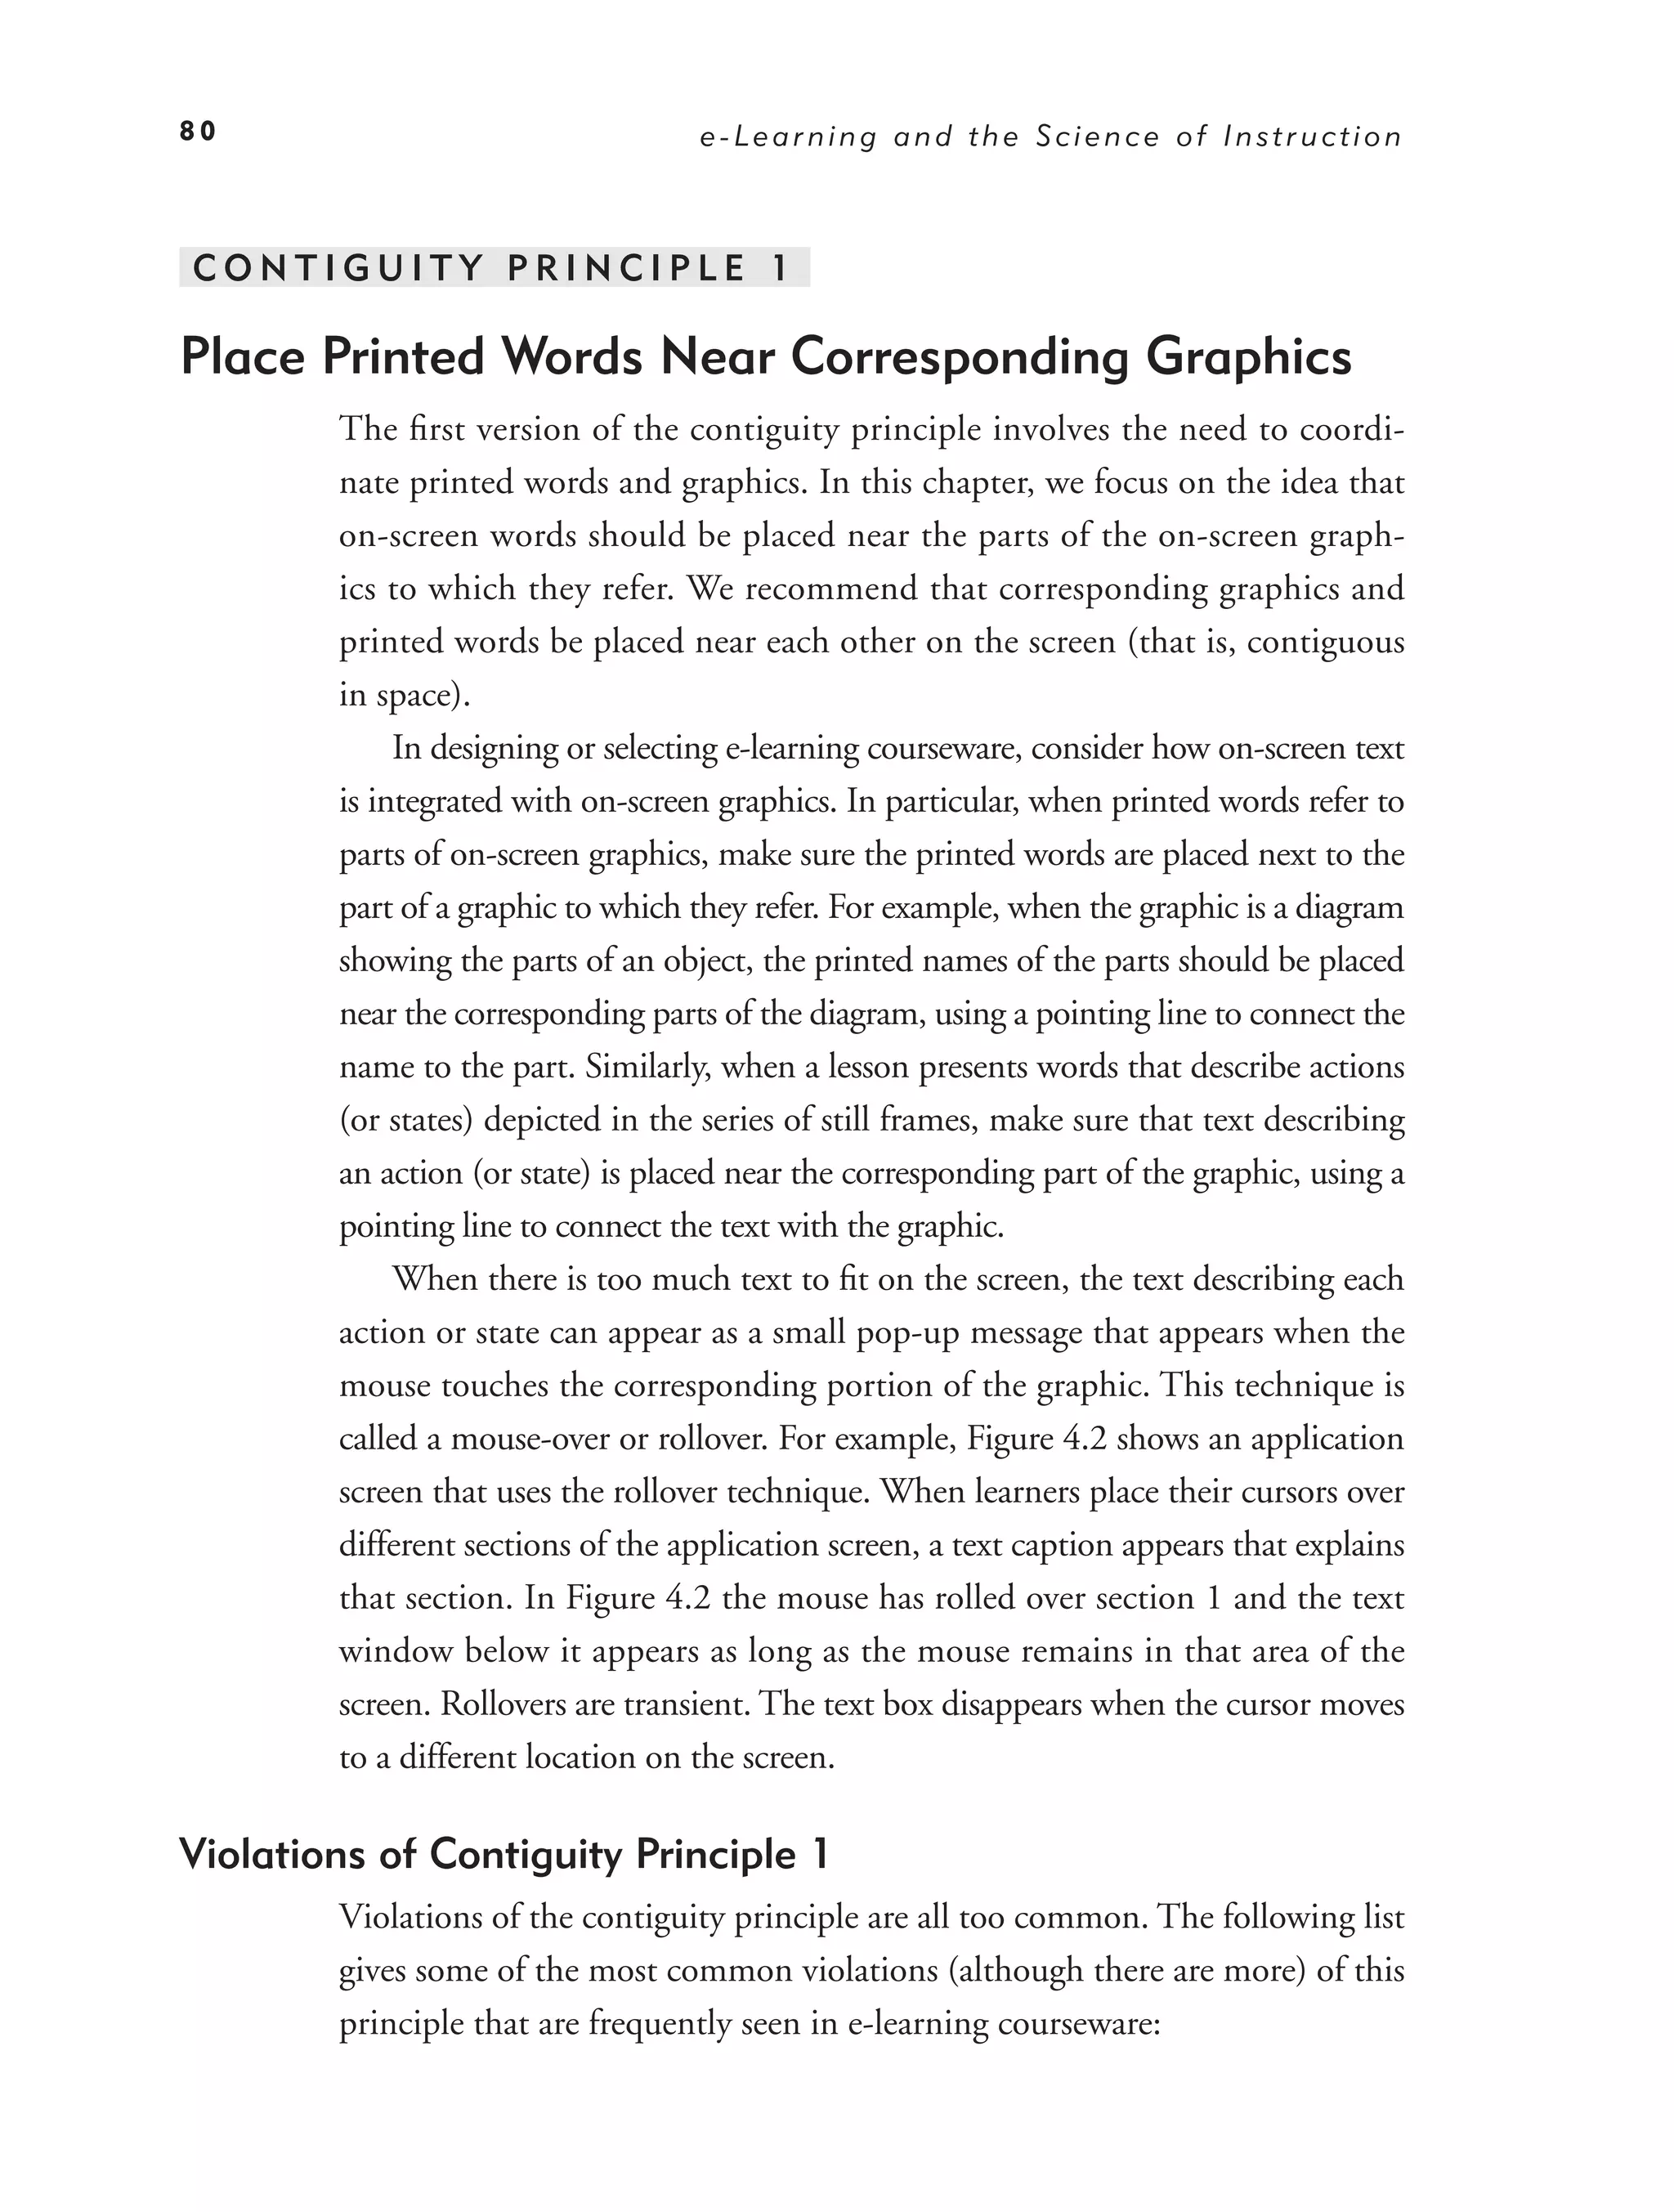
Contiguity Principle 2: Synchronize Spoken Words with
Corresponding Graphics 86
Psychological Reasons for the Contiguity Principle 89
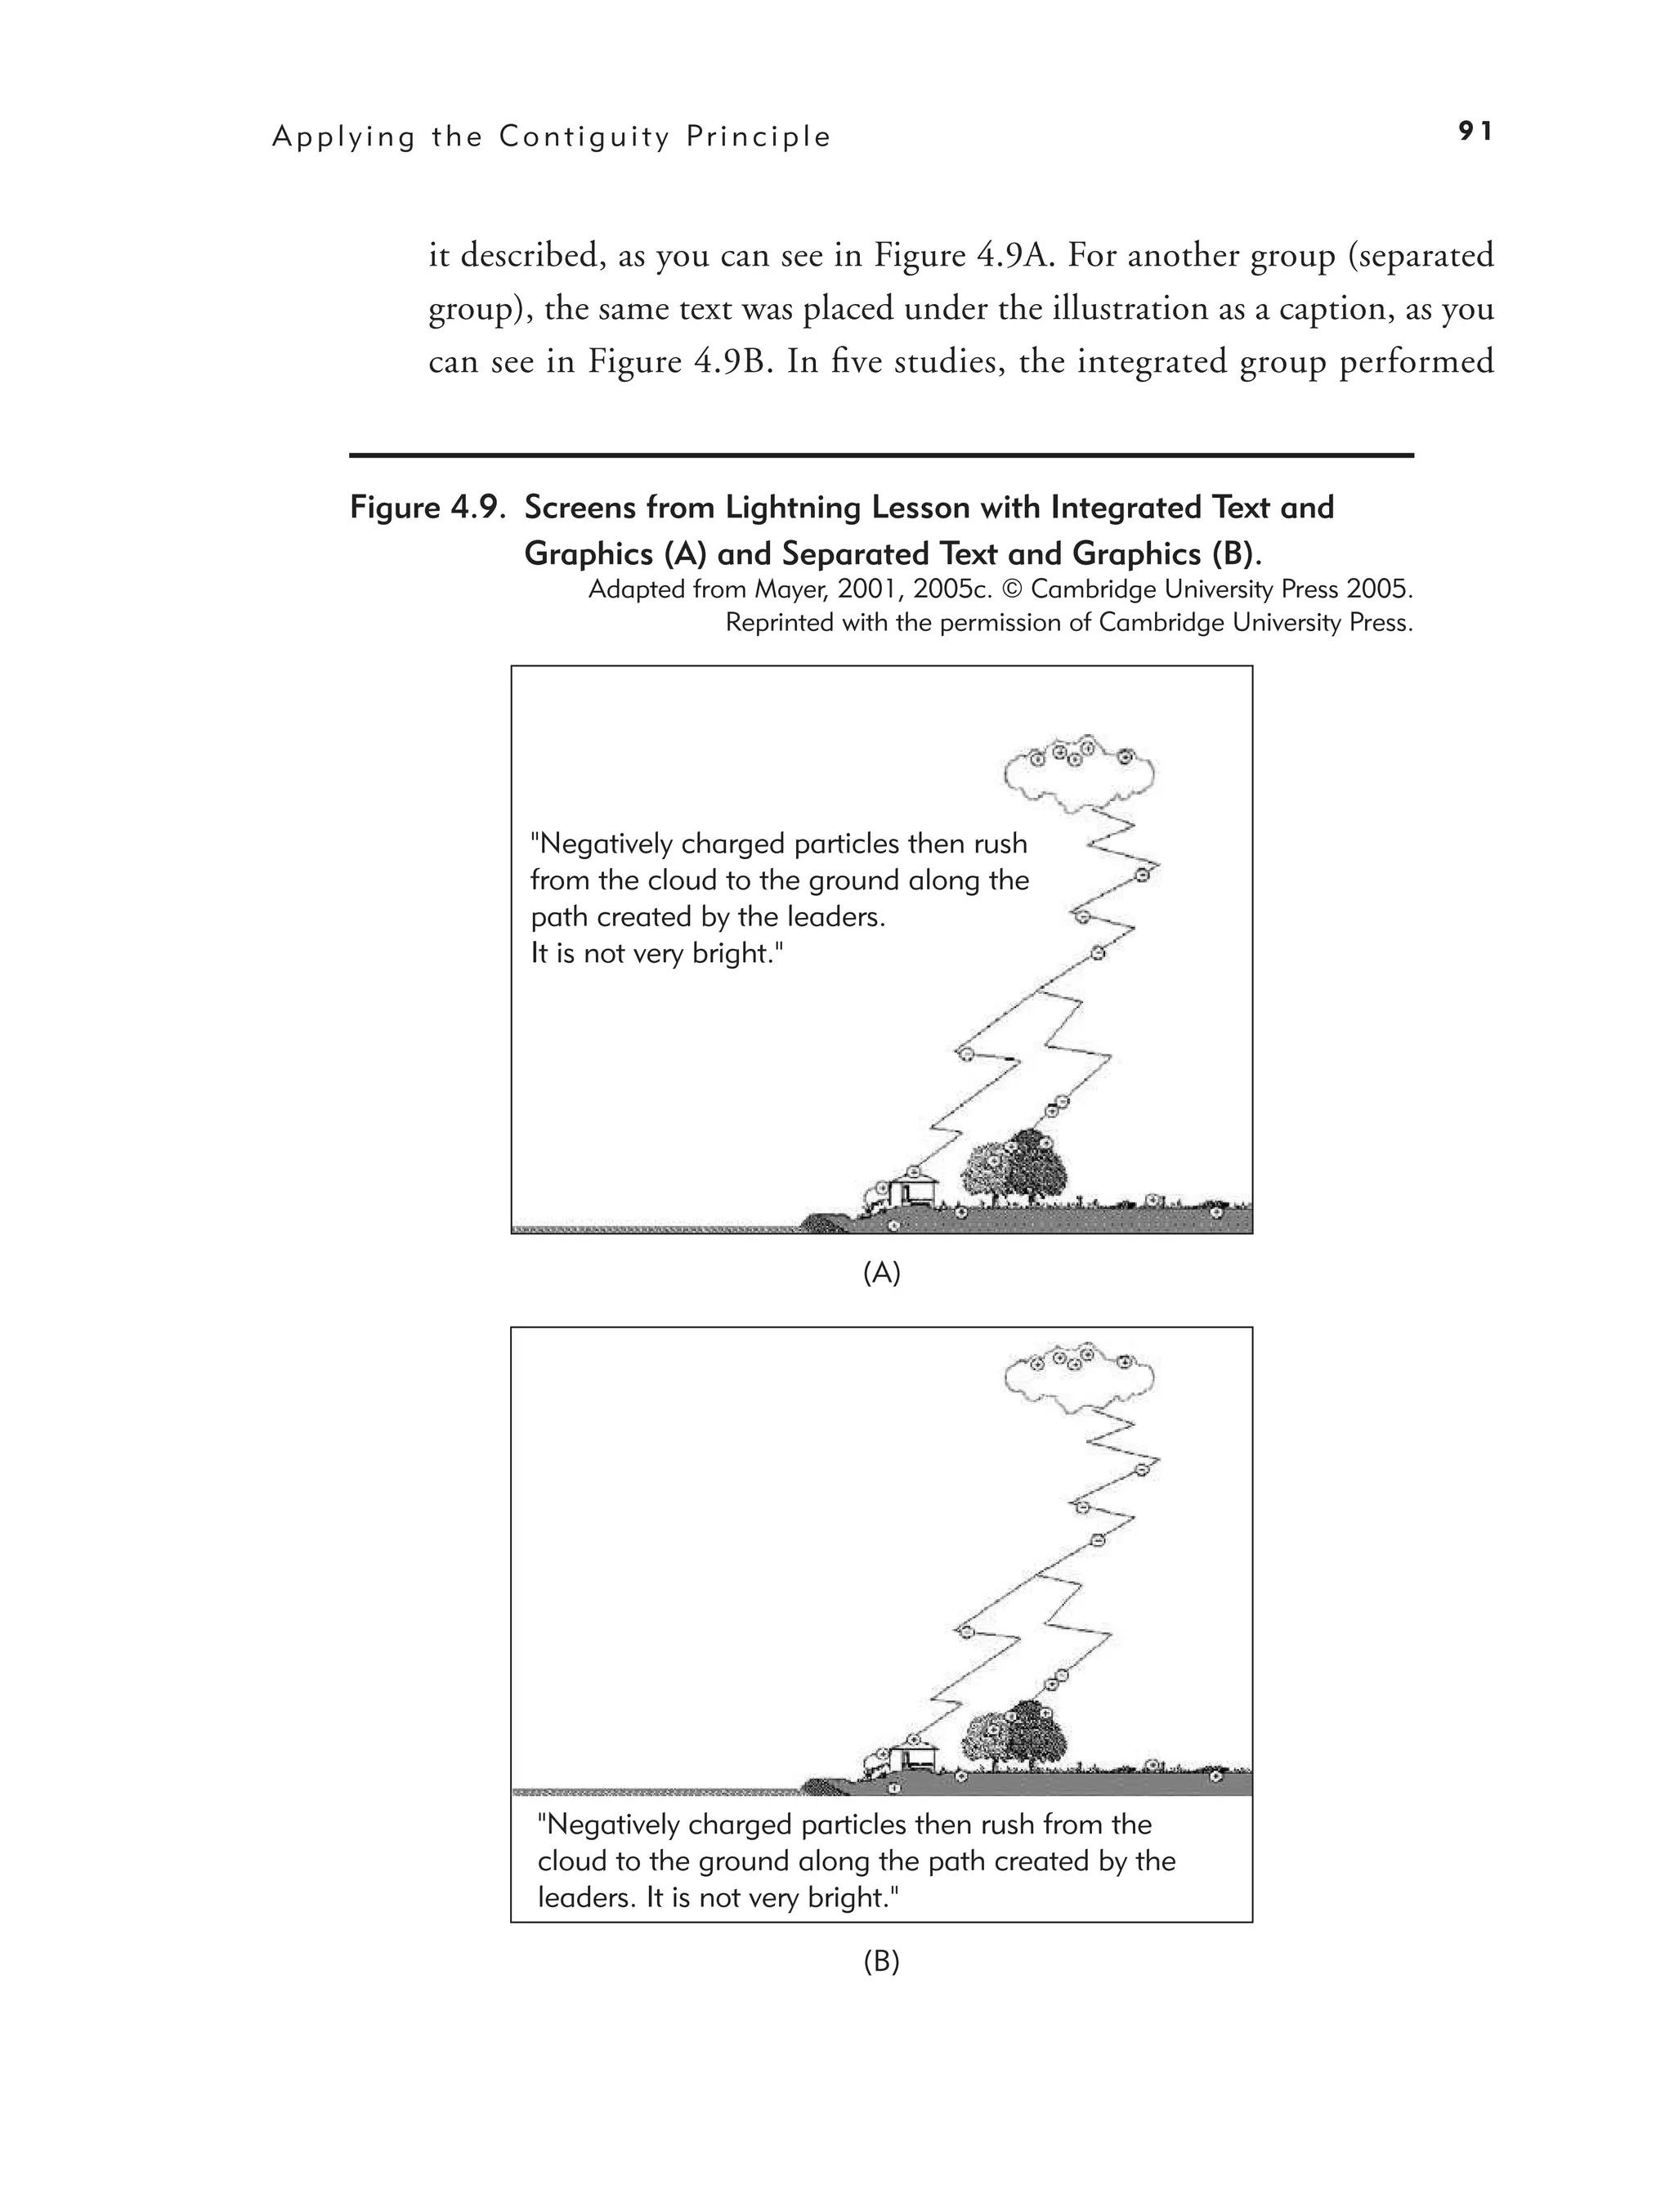
Evidence for Presenting Printed Words Near Corresponding
Graphics 89
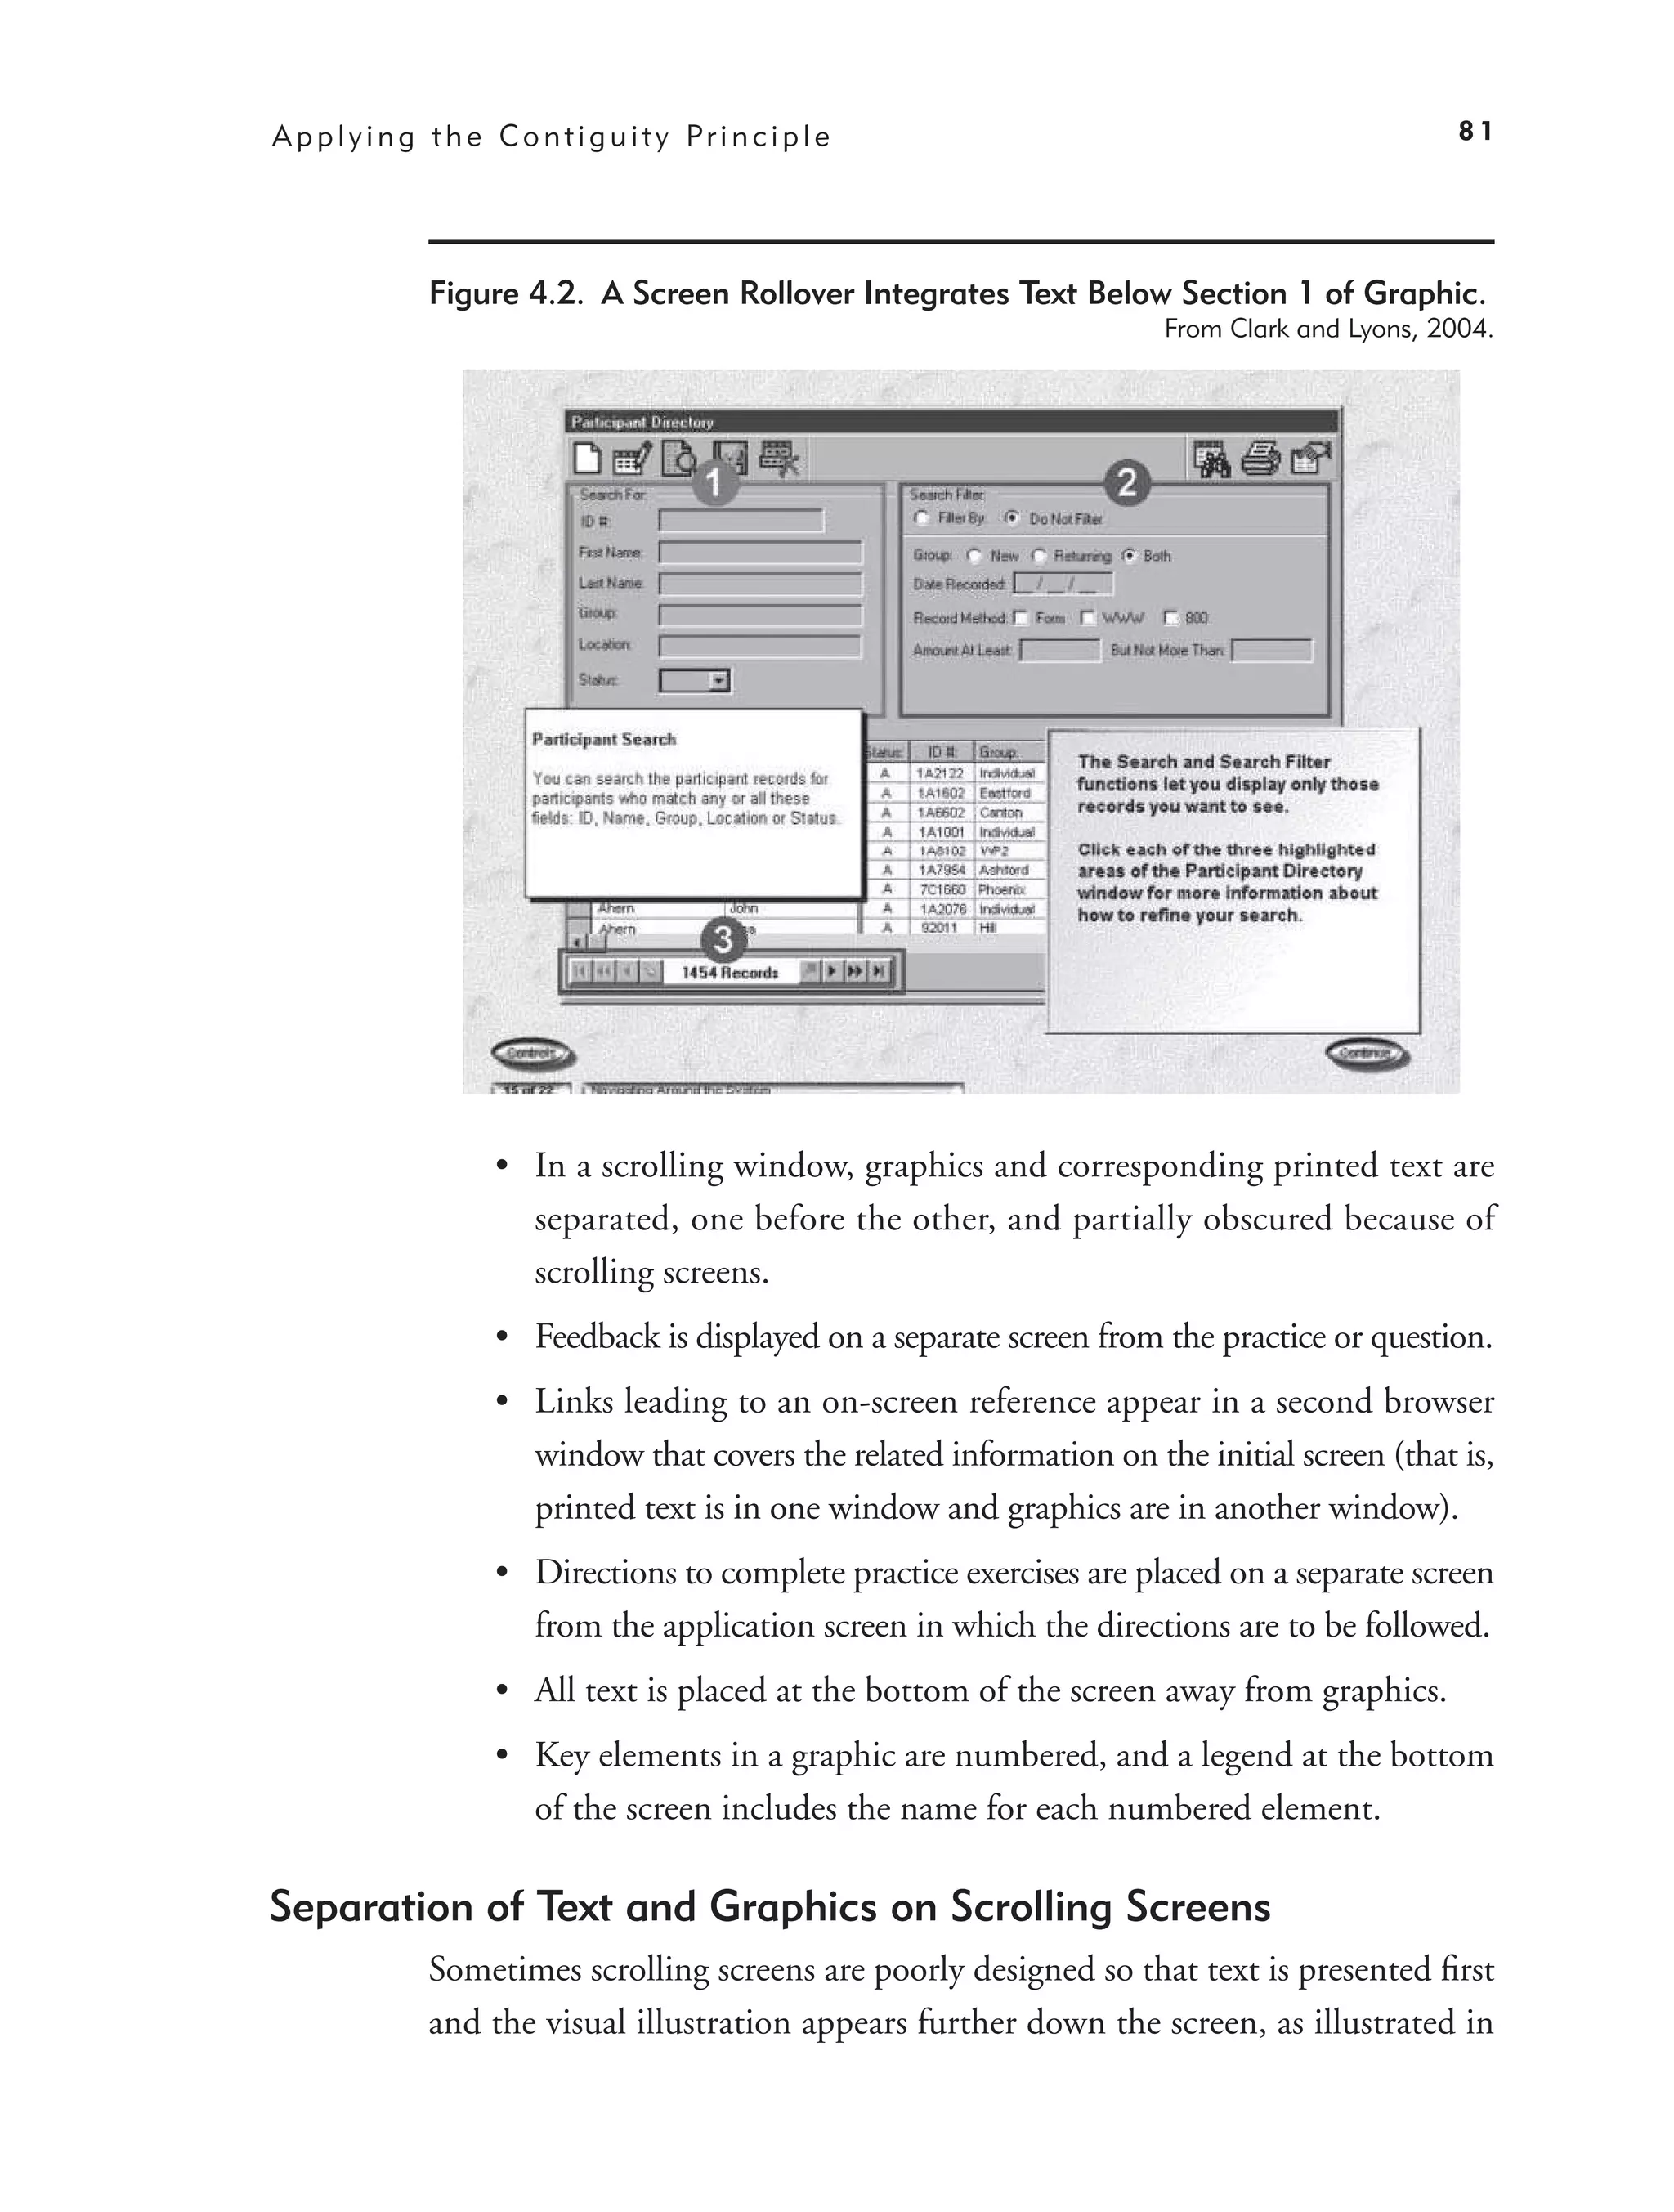
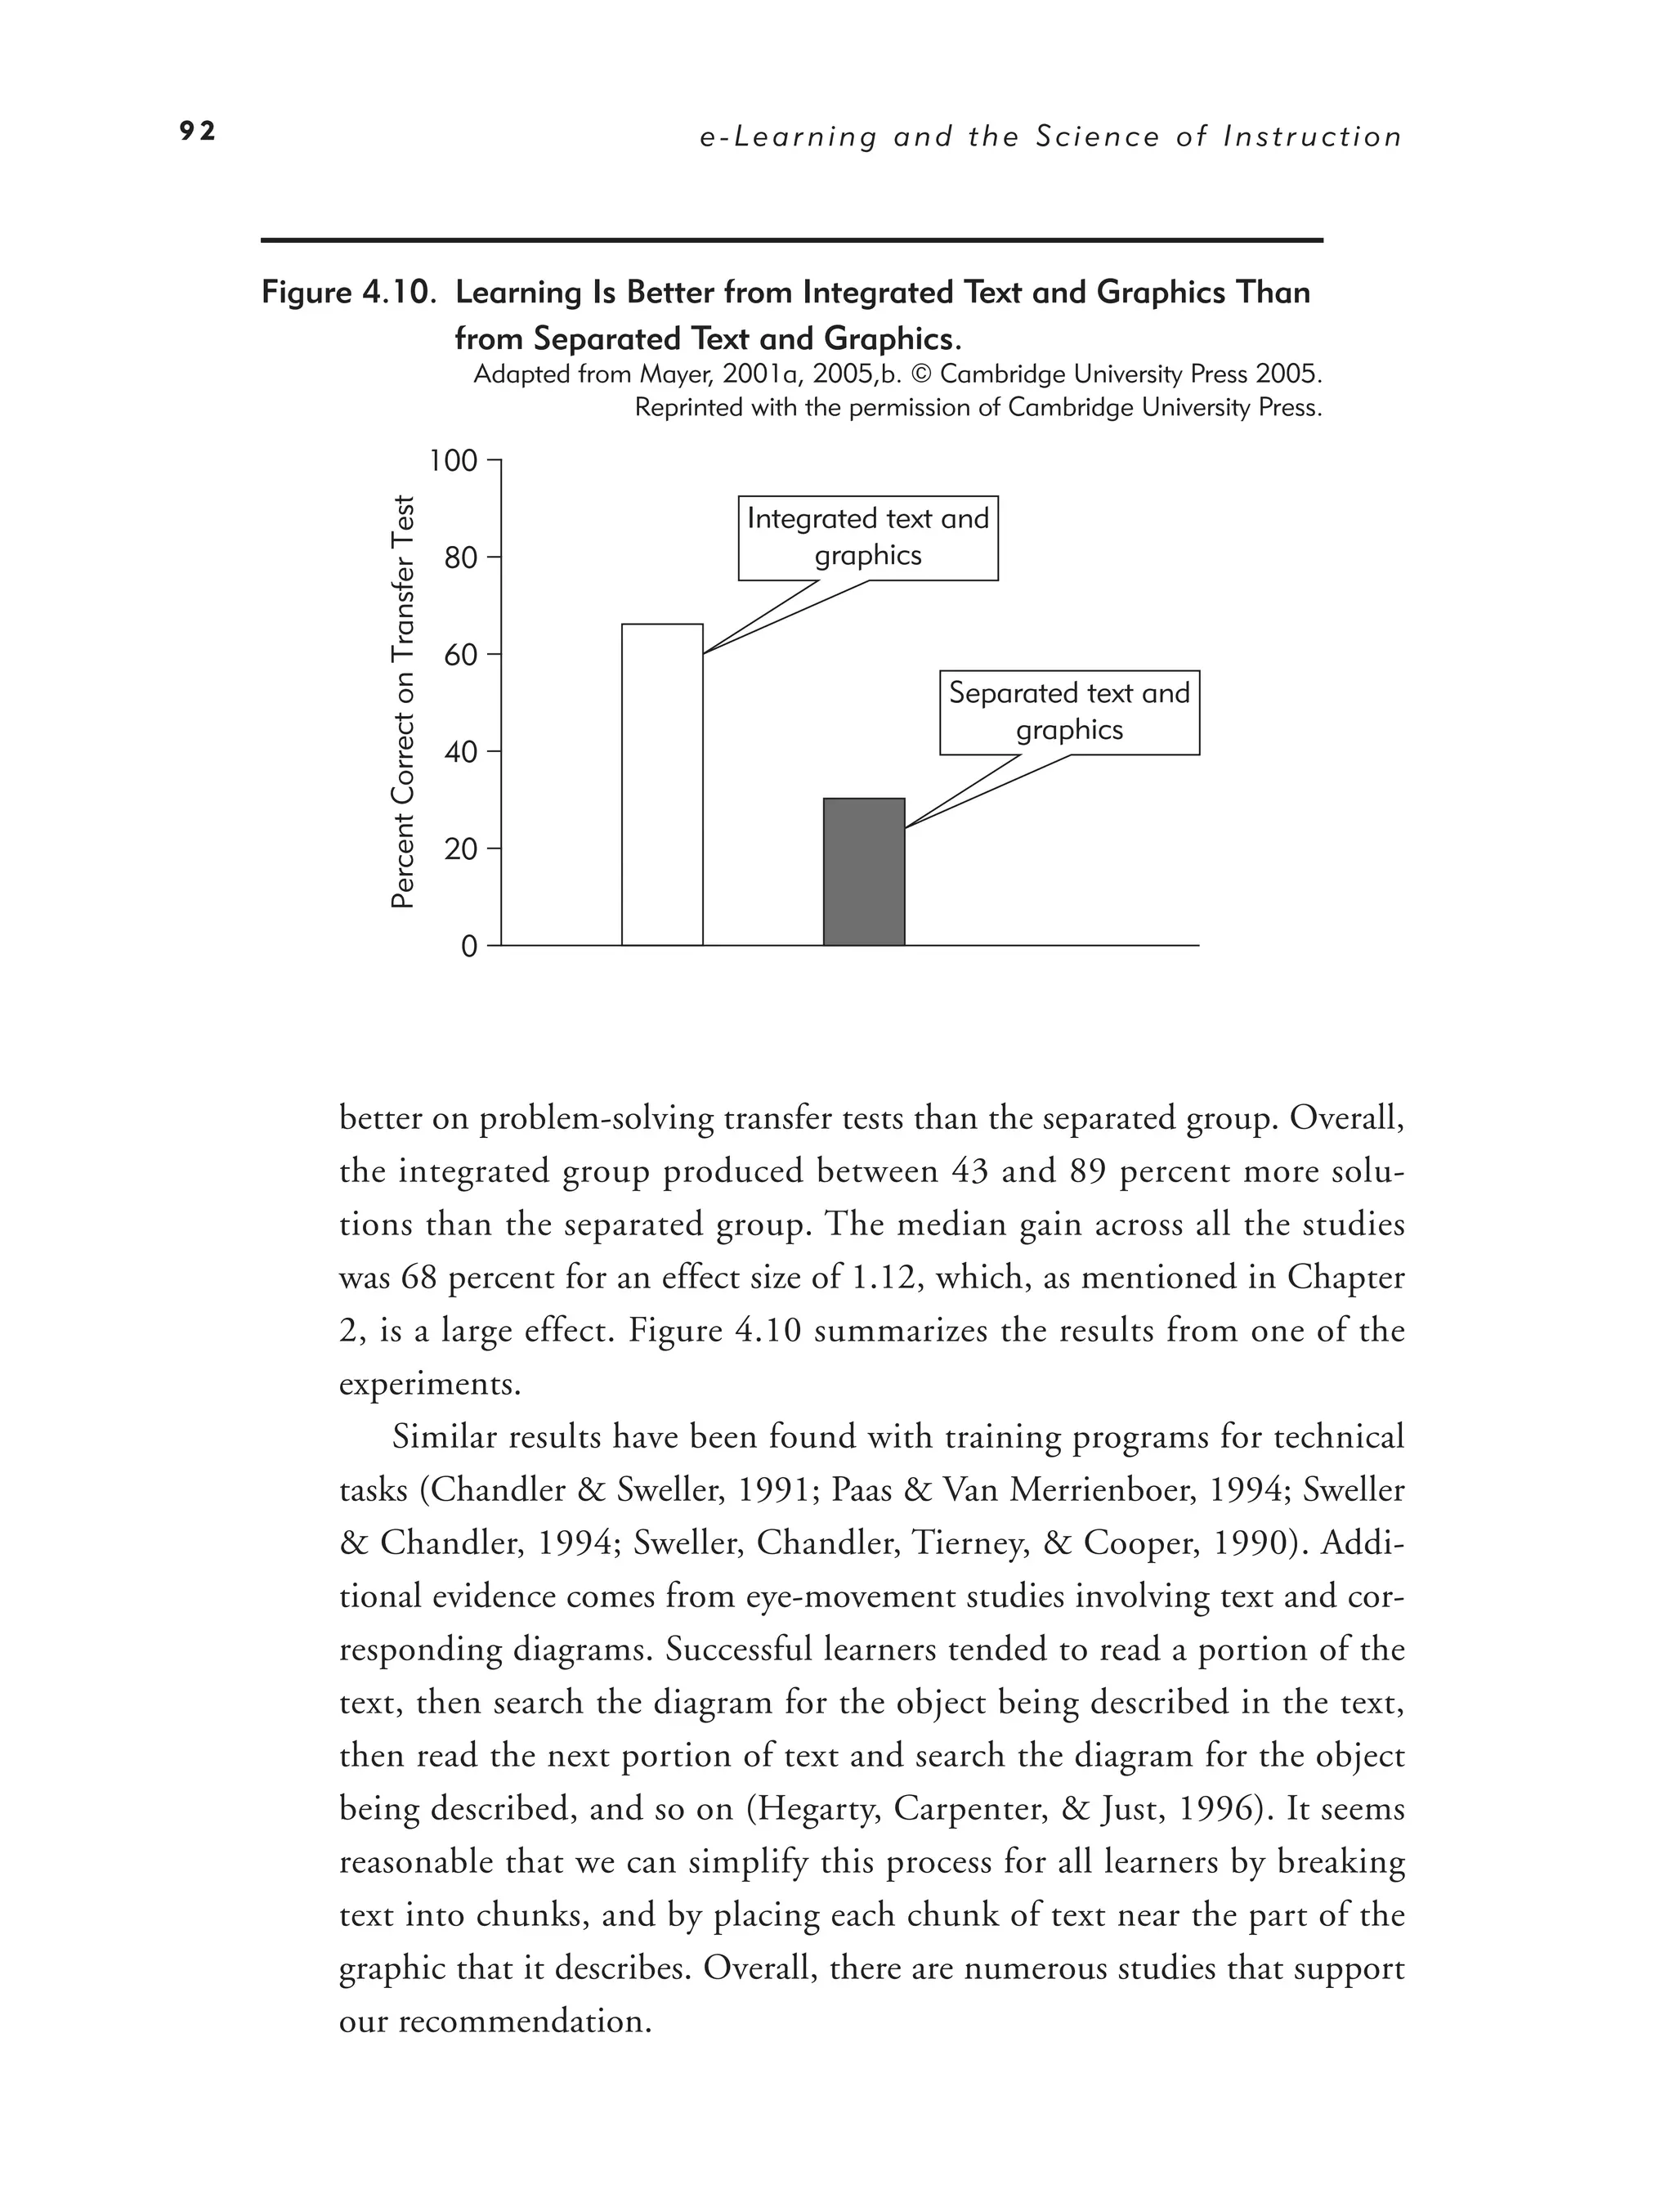
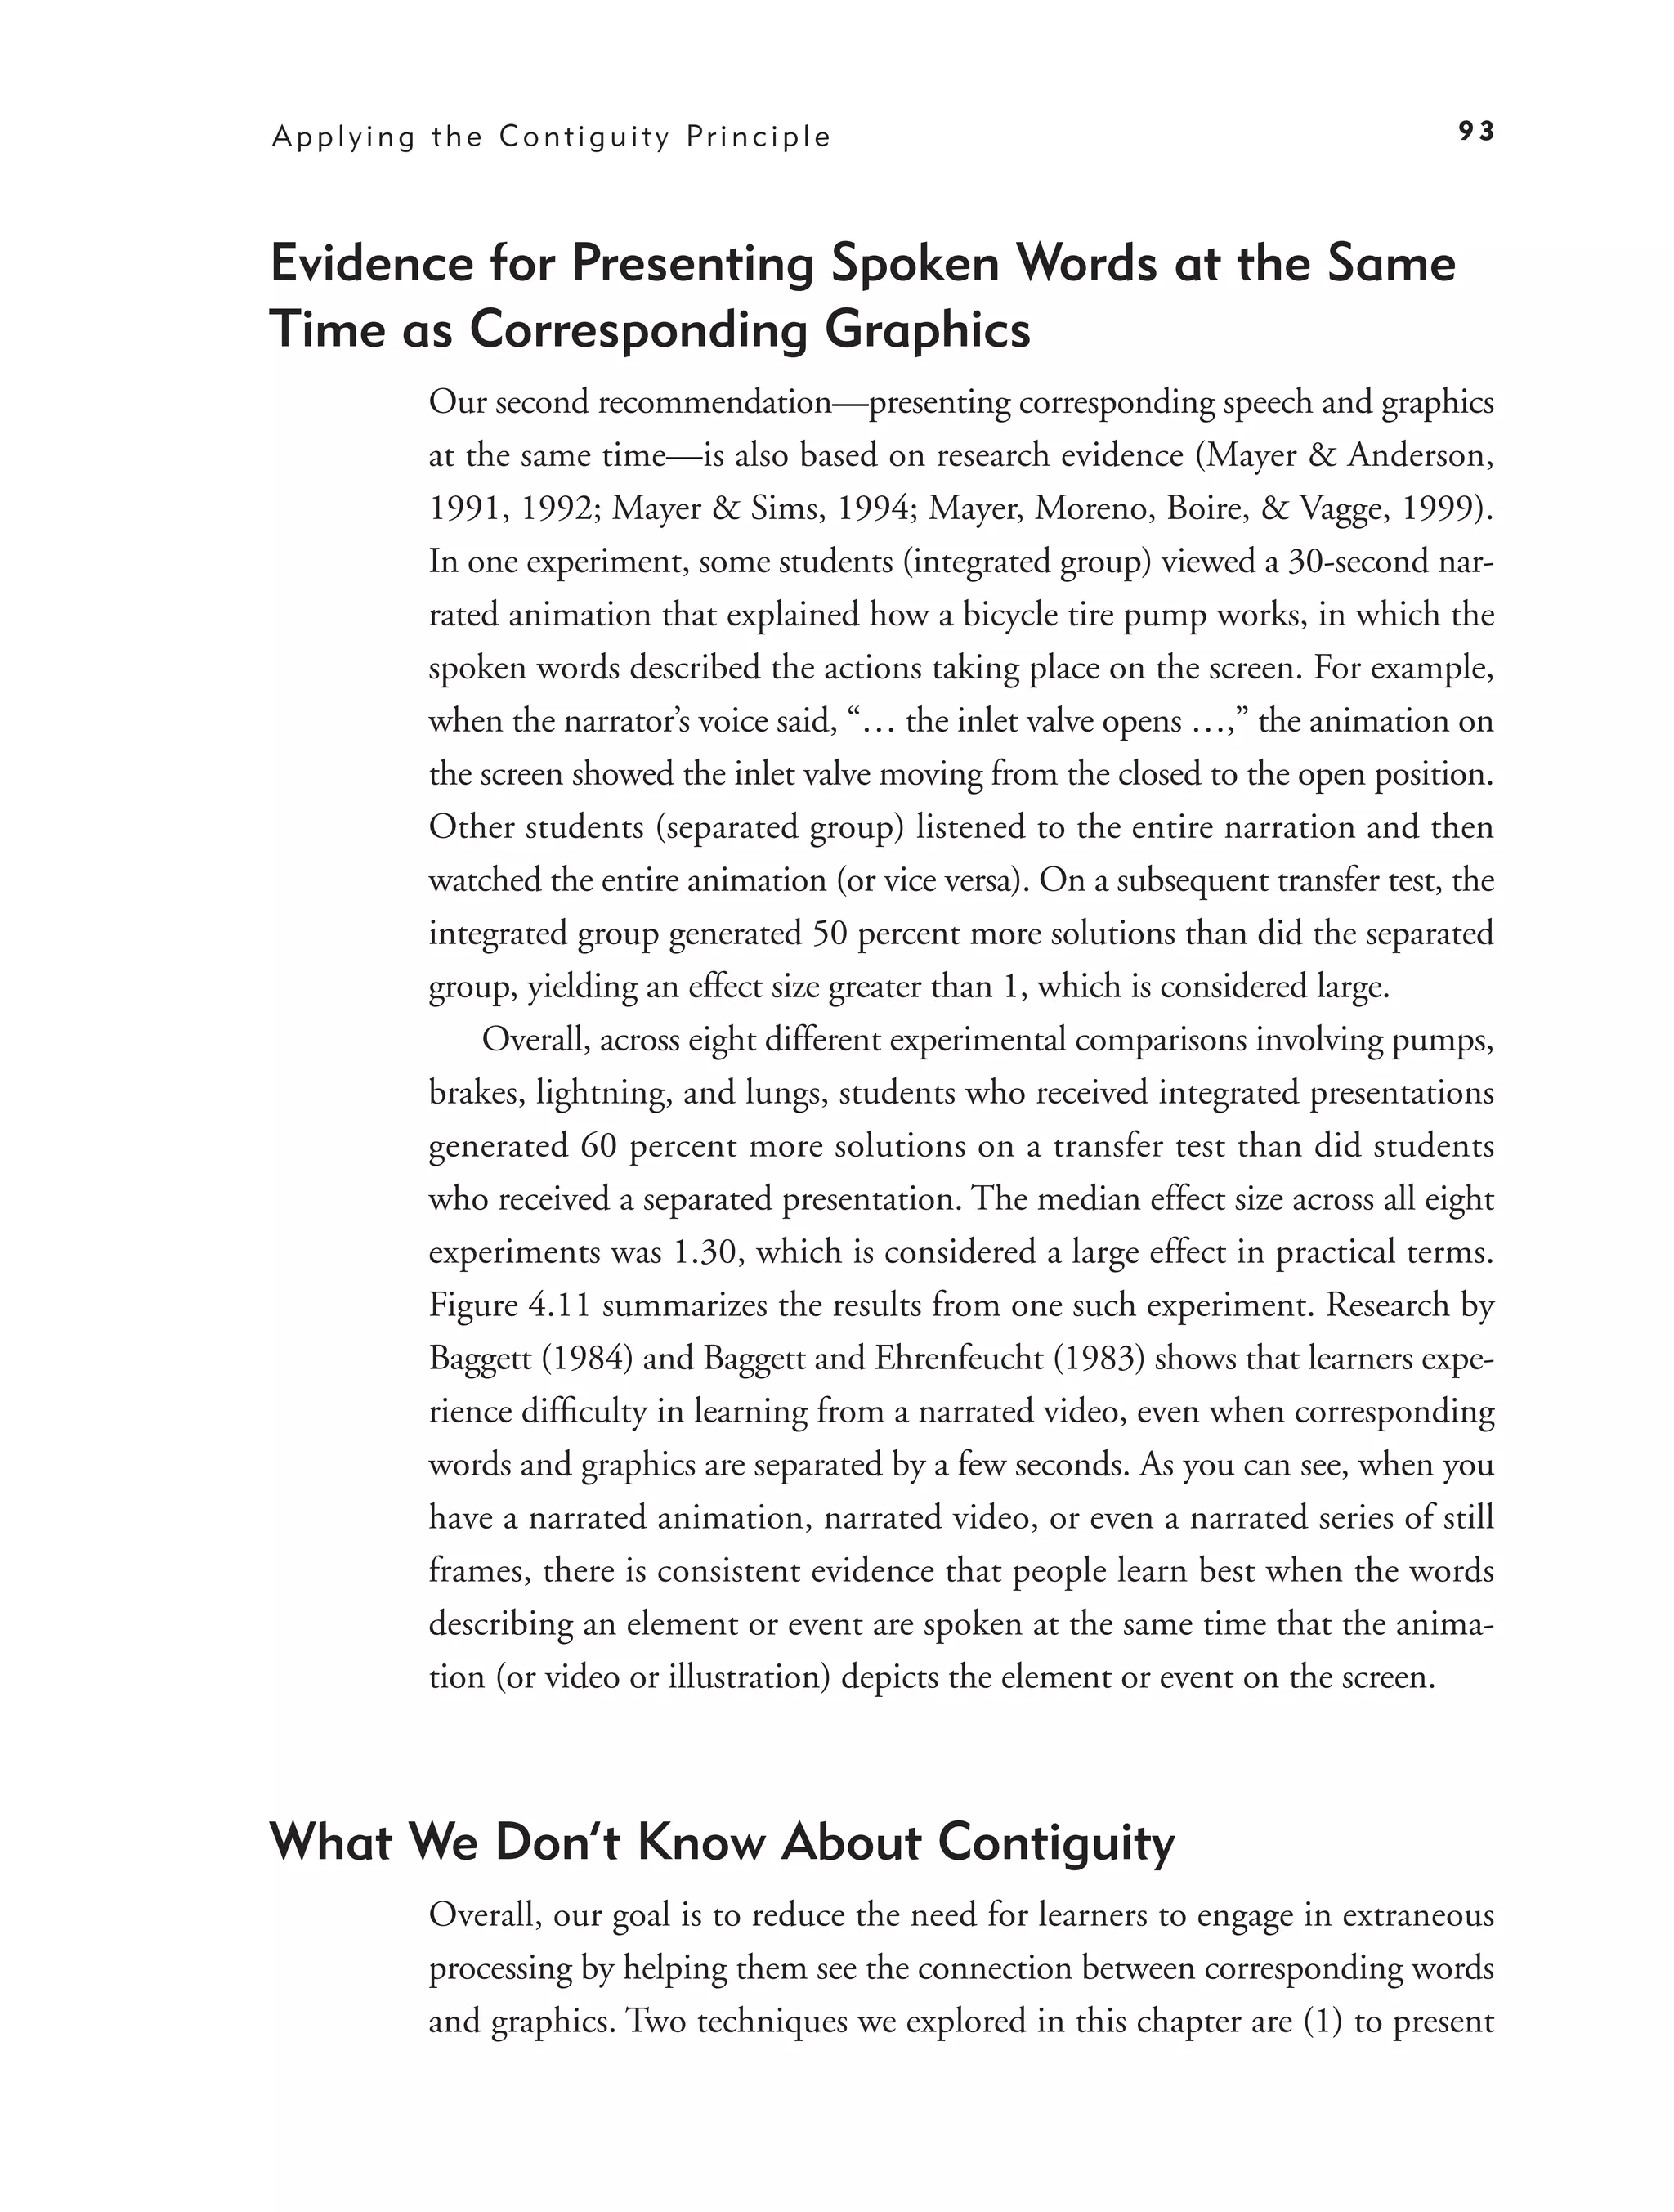
Evidence for Presenting Spoken Words at the Same Time as
Corresponding Graphics 93
What We Don’t Know About Contiguity 93
10.
Contents ix
5. Applying the Modality Principle: Present Words as Audio
Narration, Rather Than On-Screen Text 99
Modality Principle: Present Words as Speech Rather Than
On-Screen Text 101
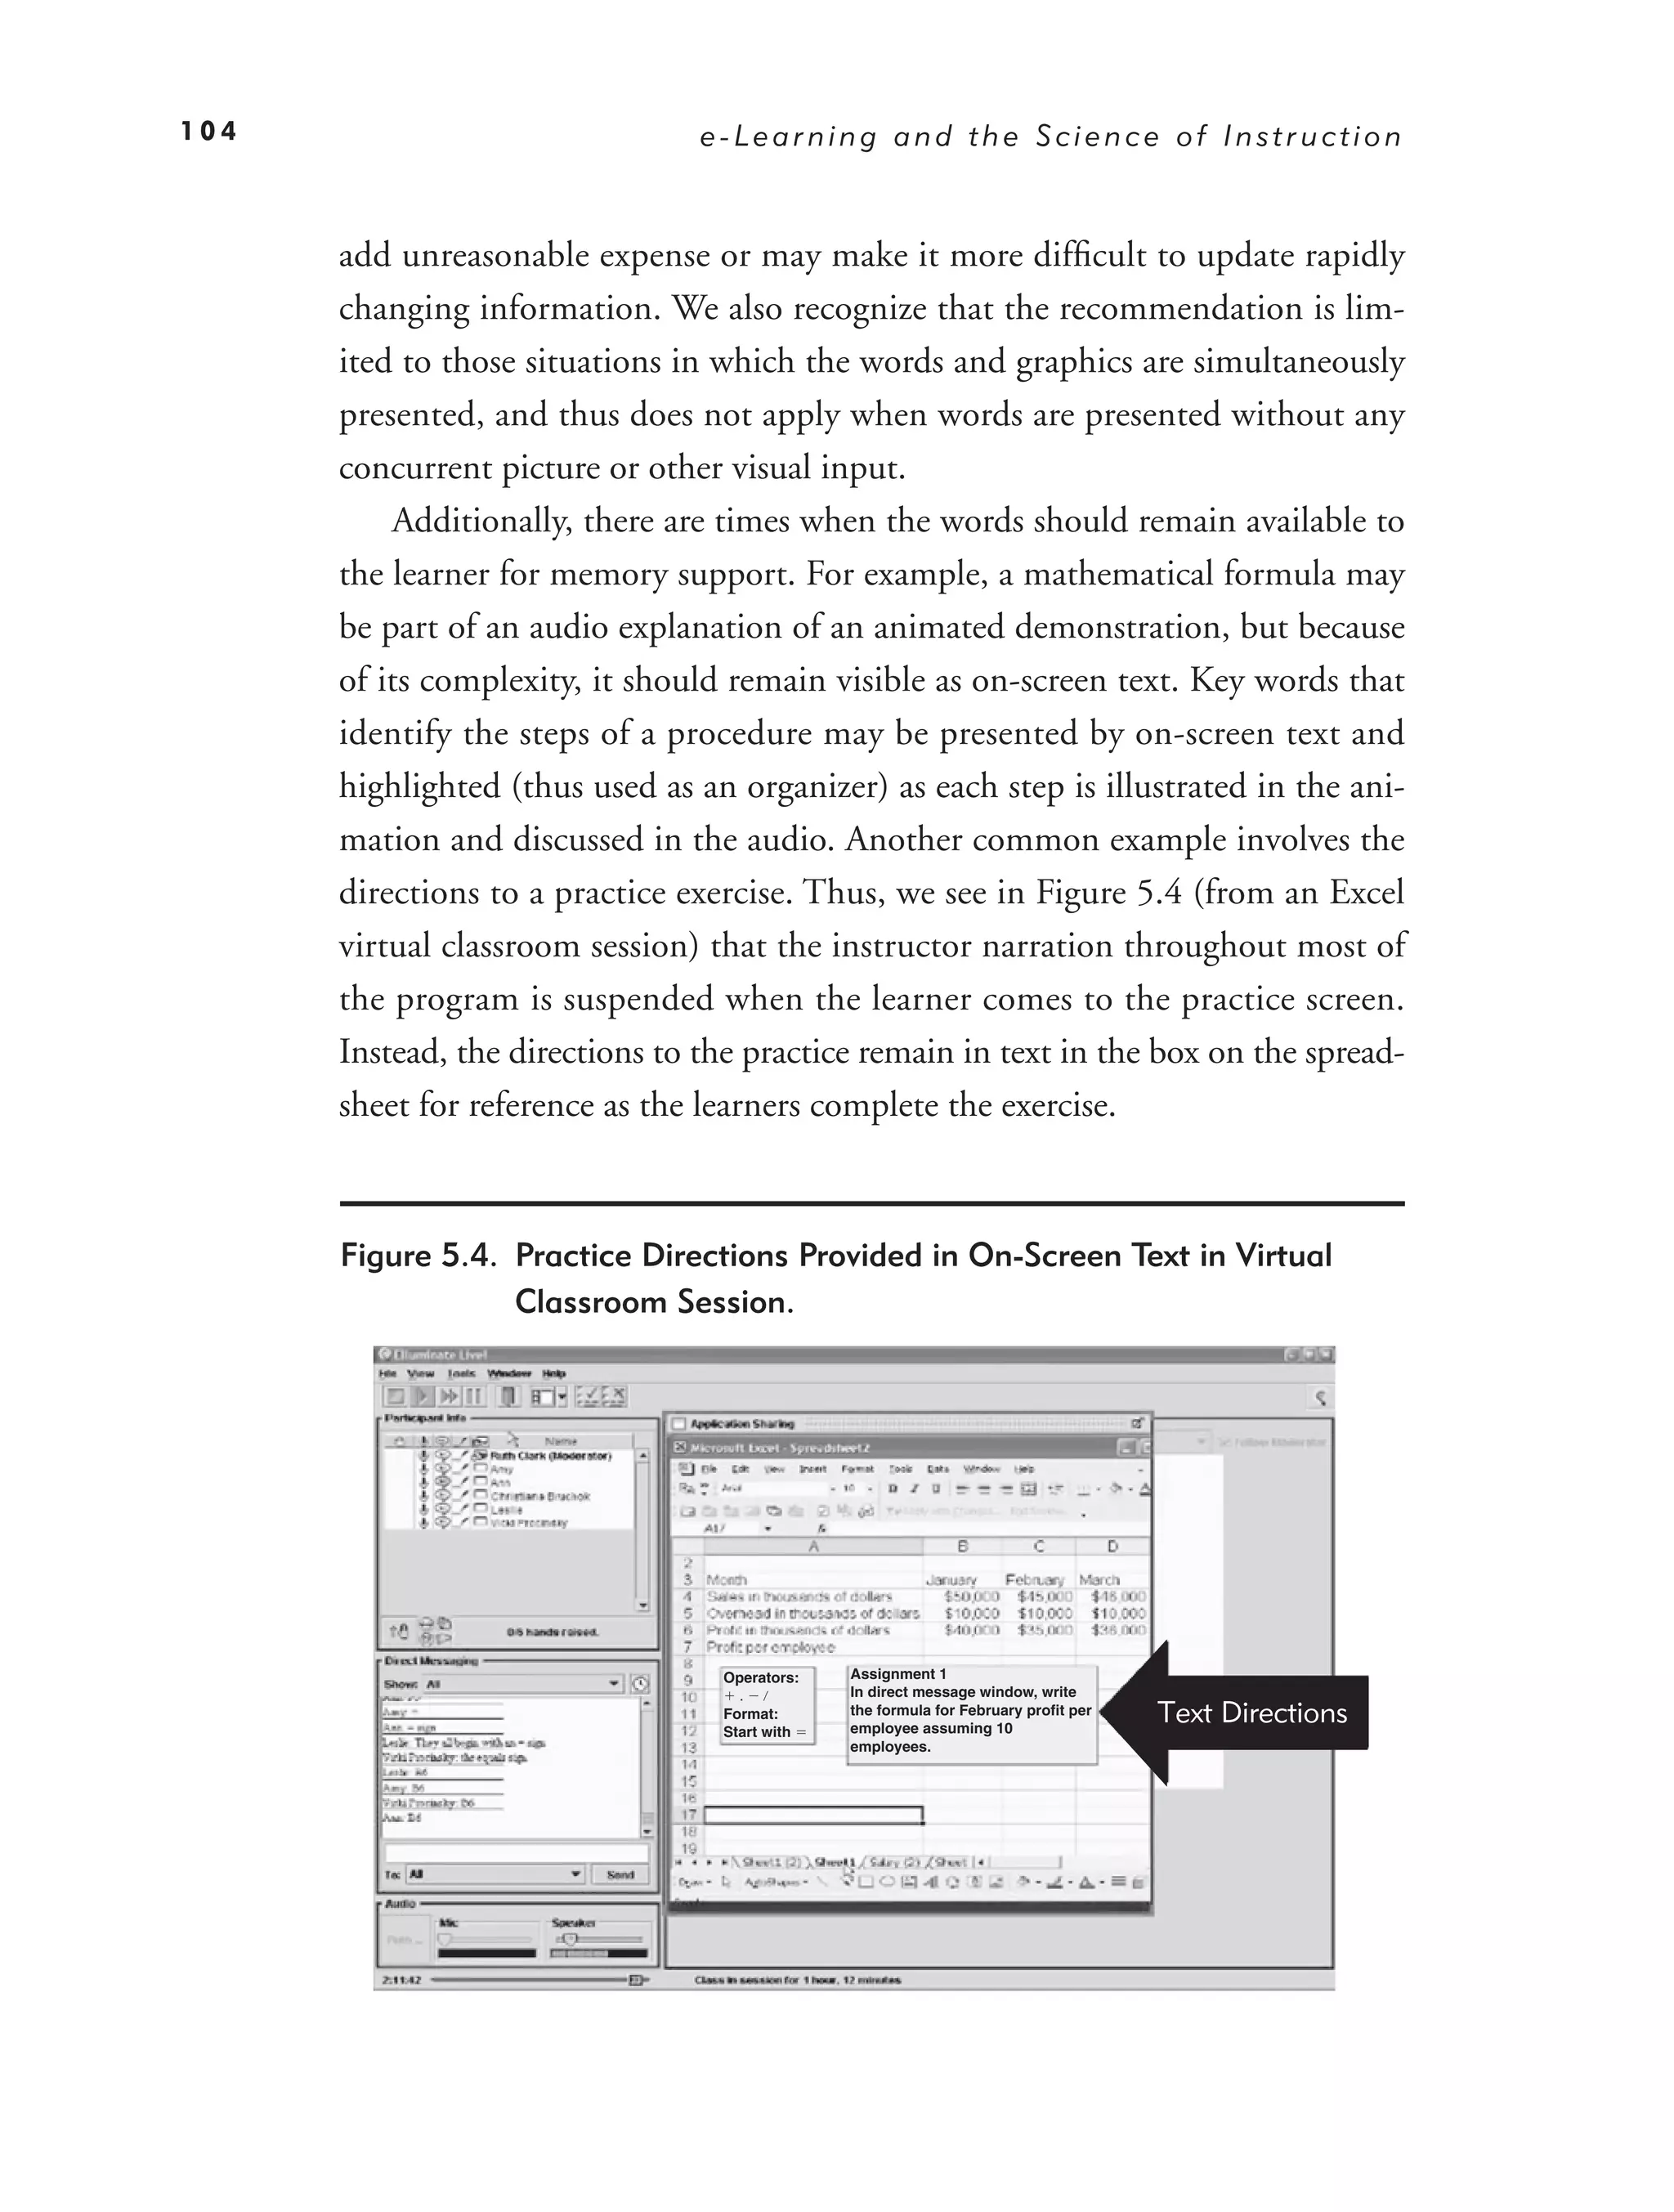
Limitations to the Modality Principle 103
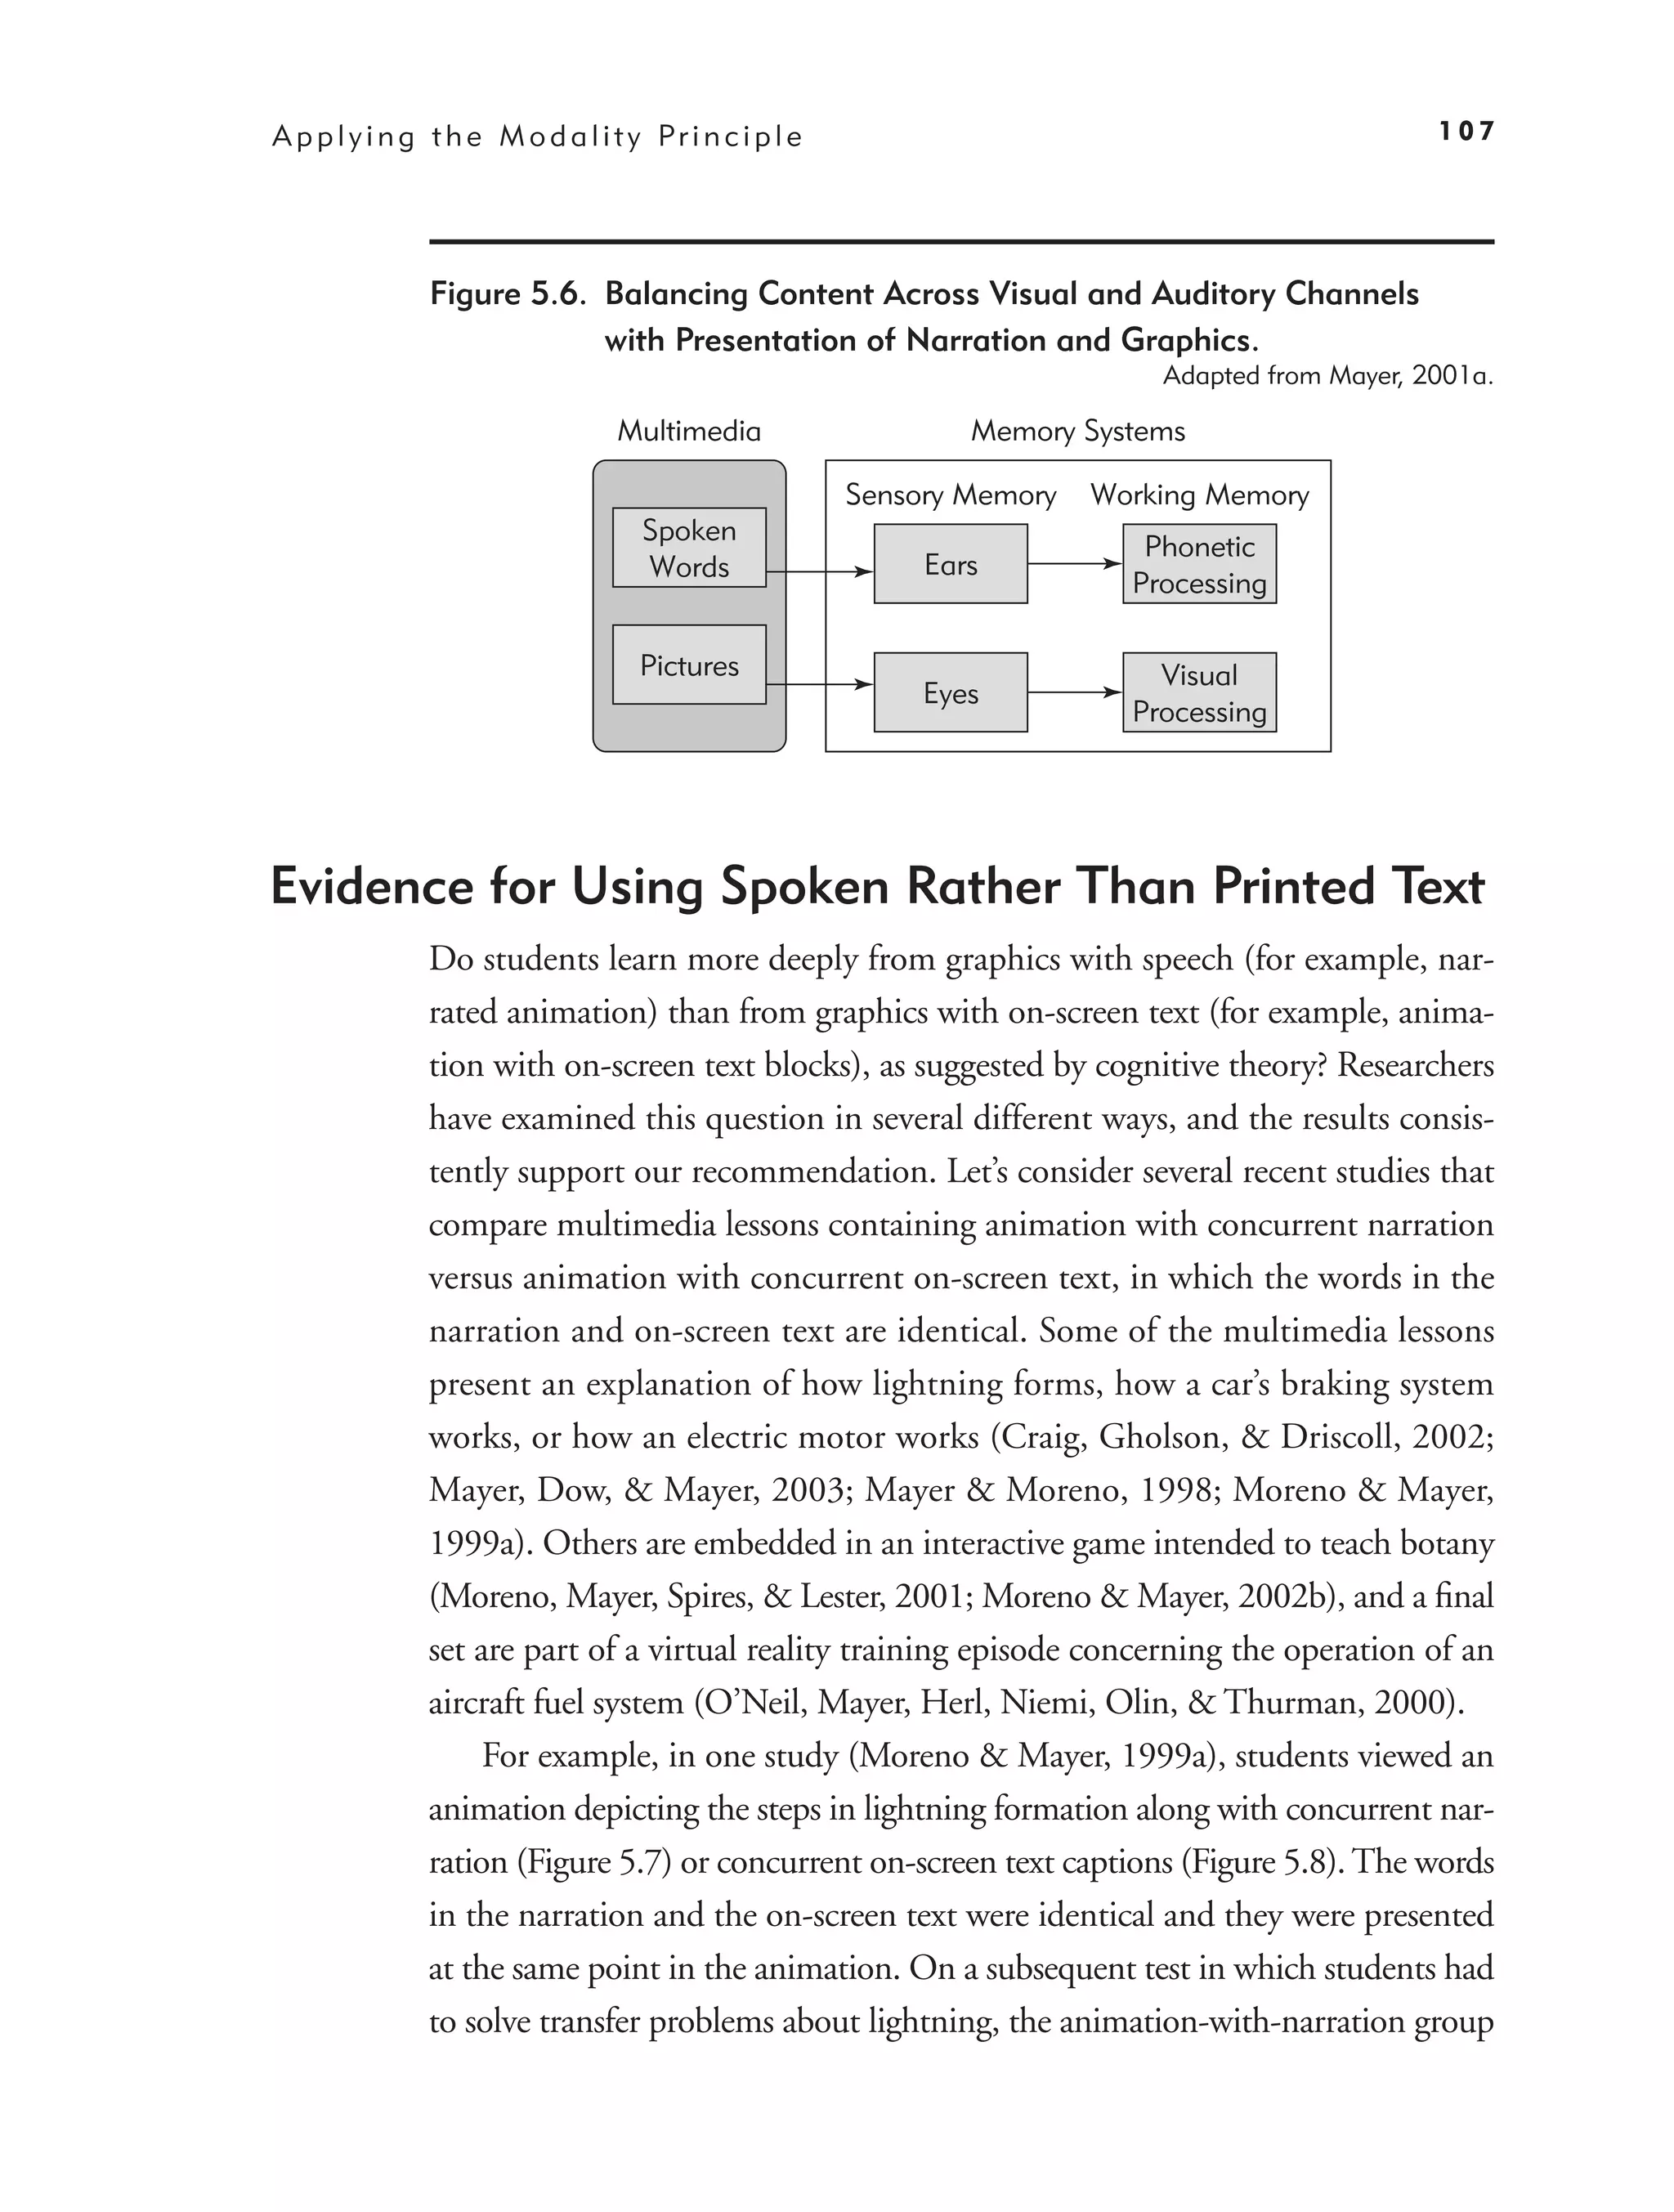
Psychological Reasons for the Modality Principle 105
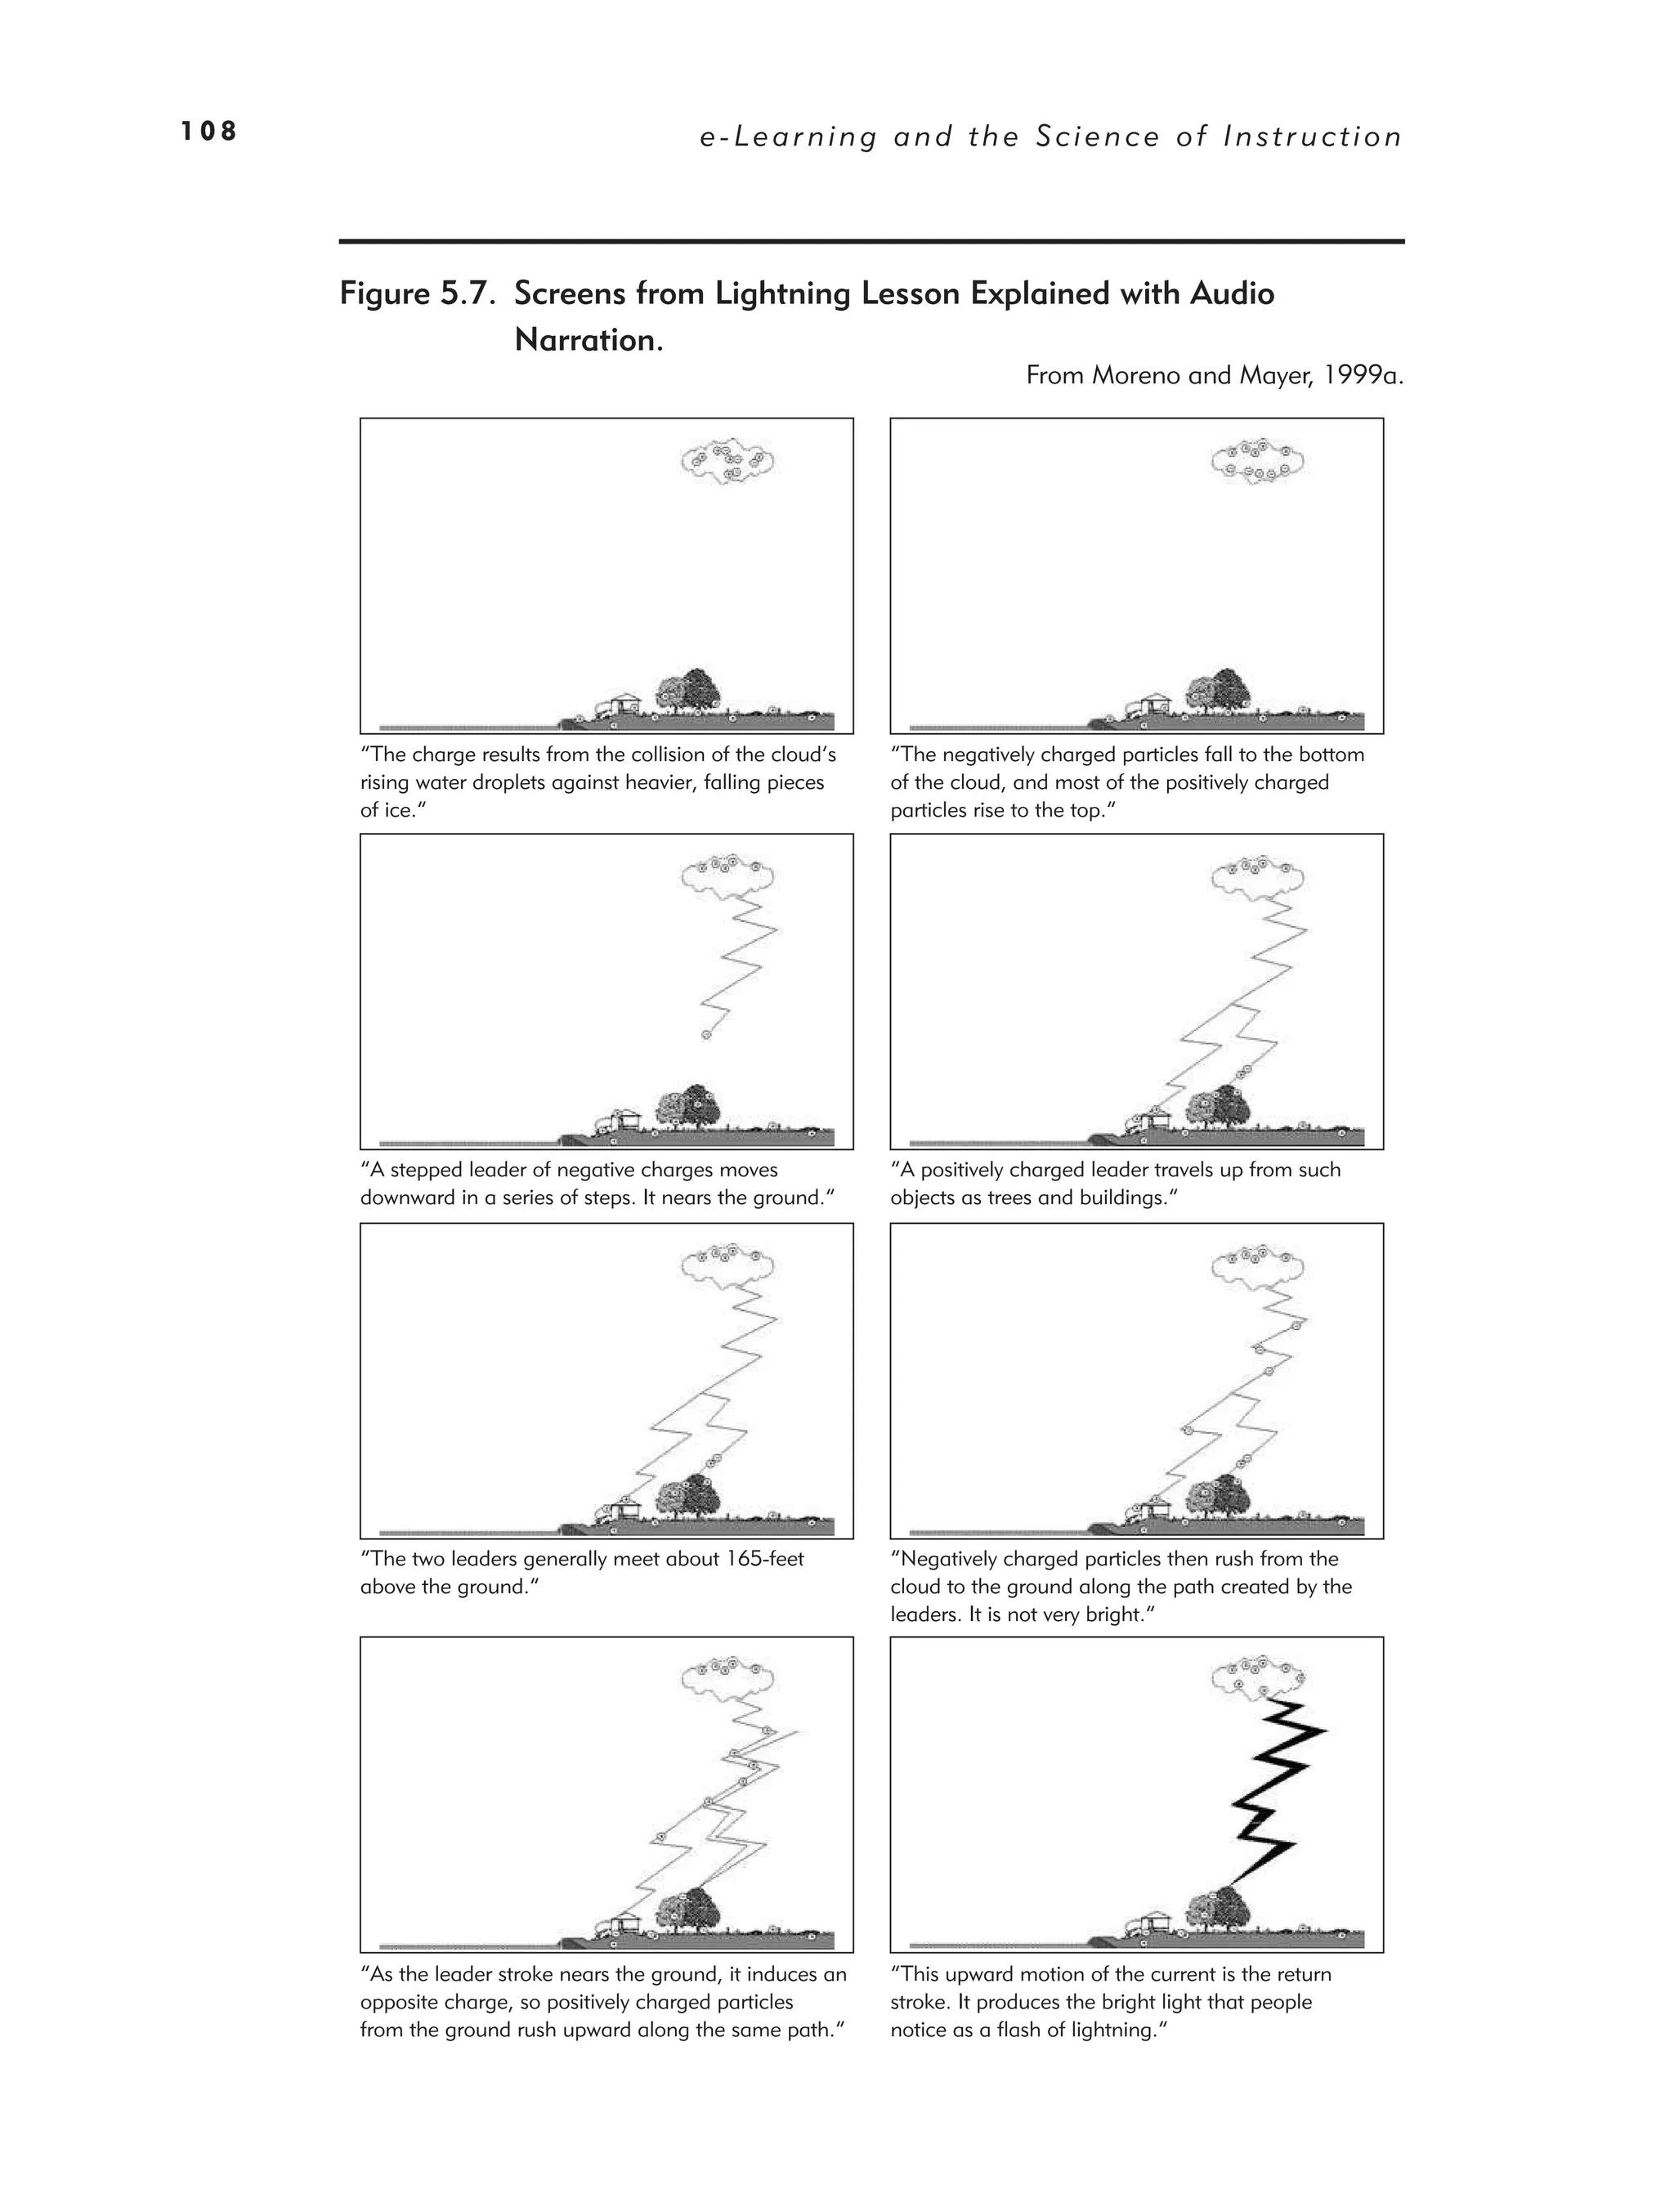
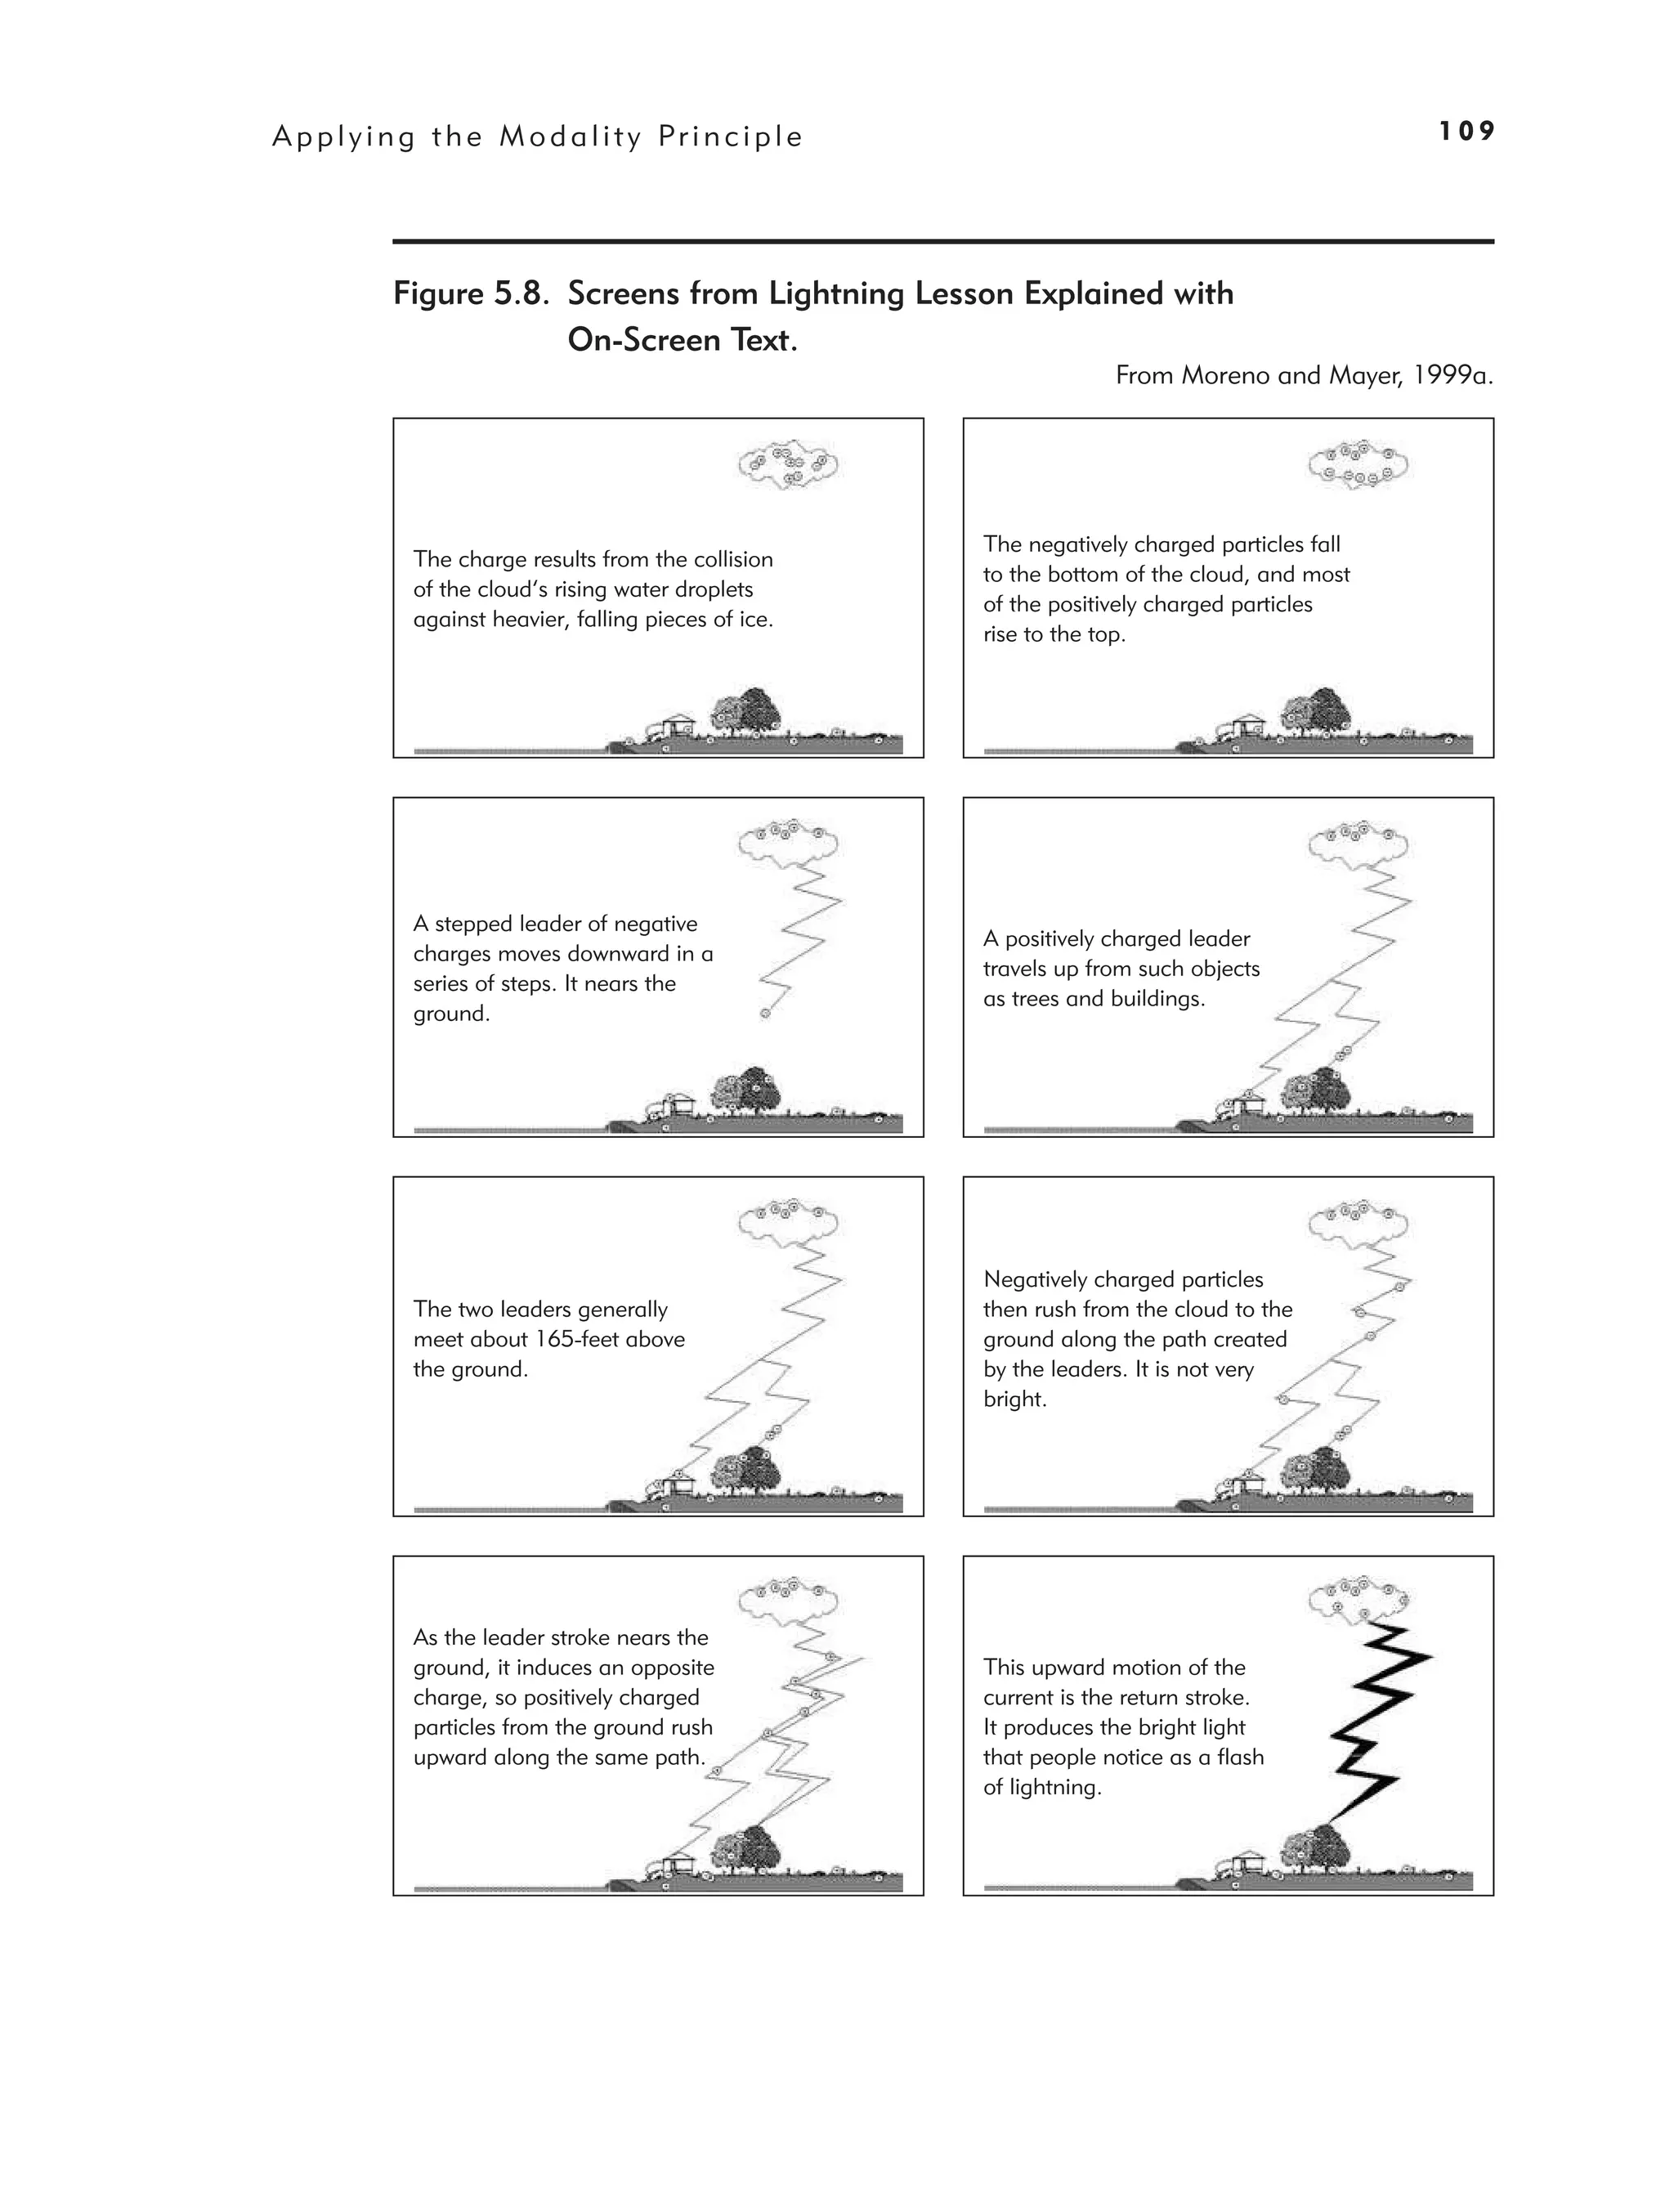
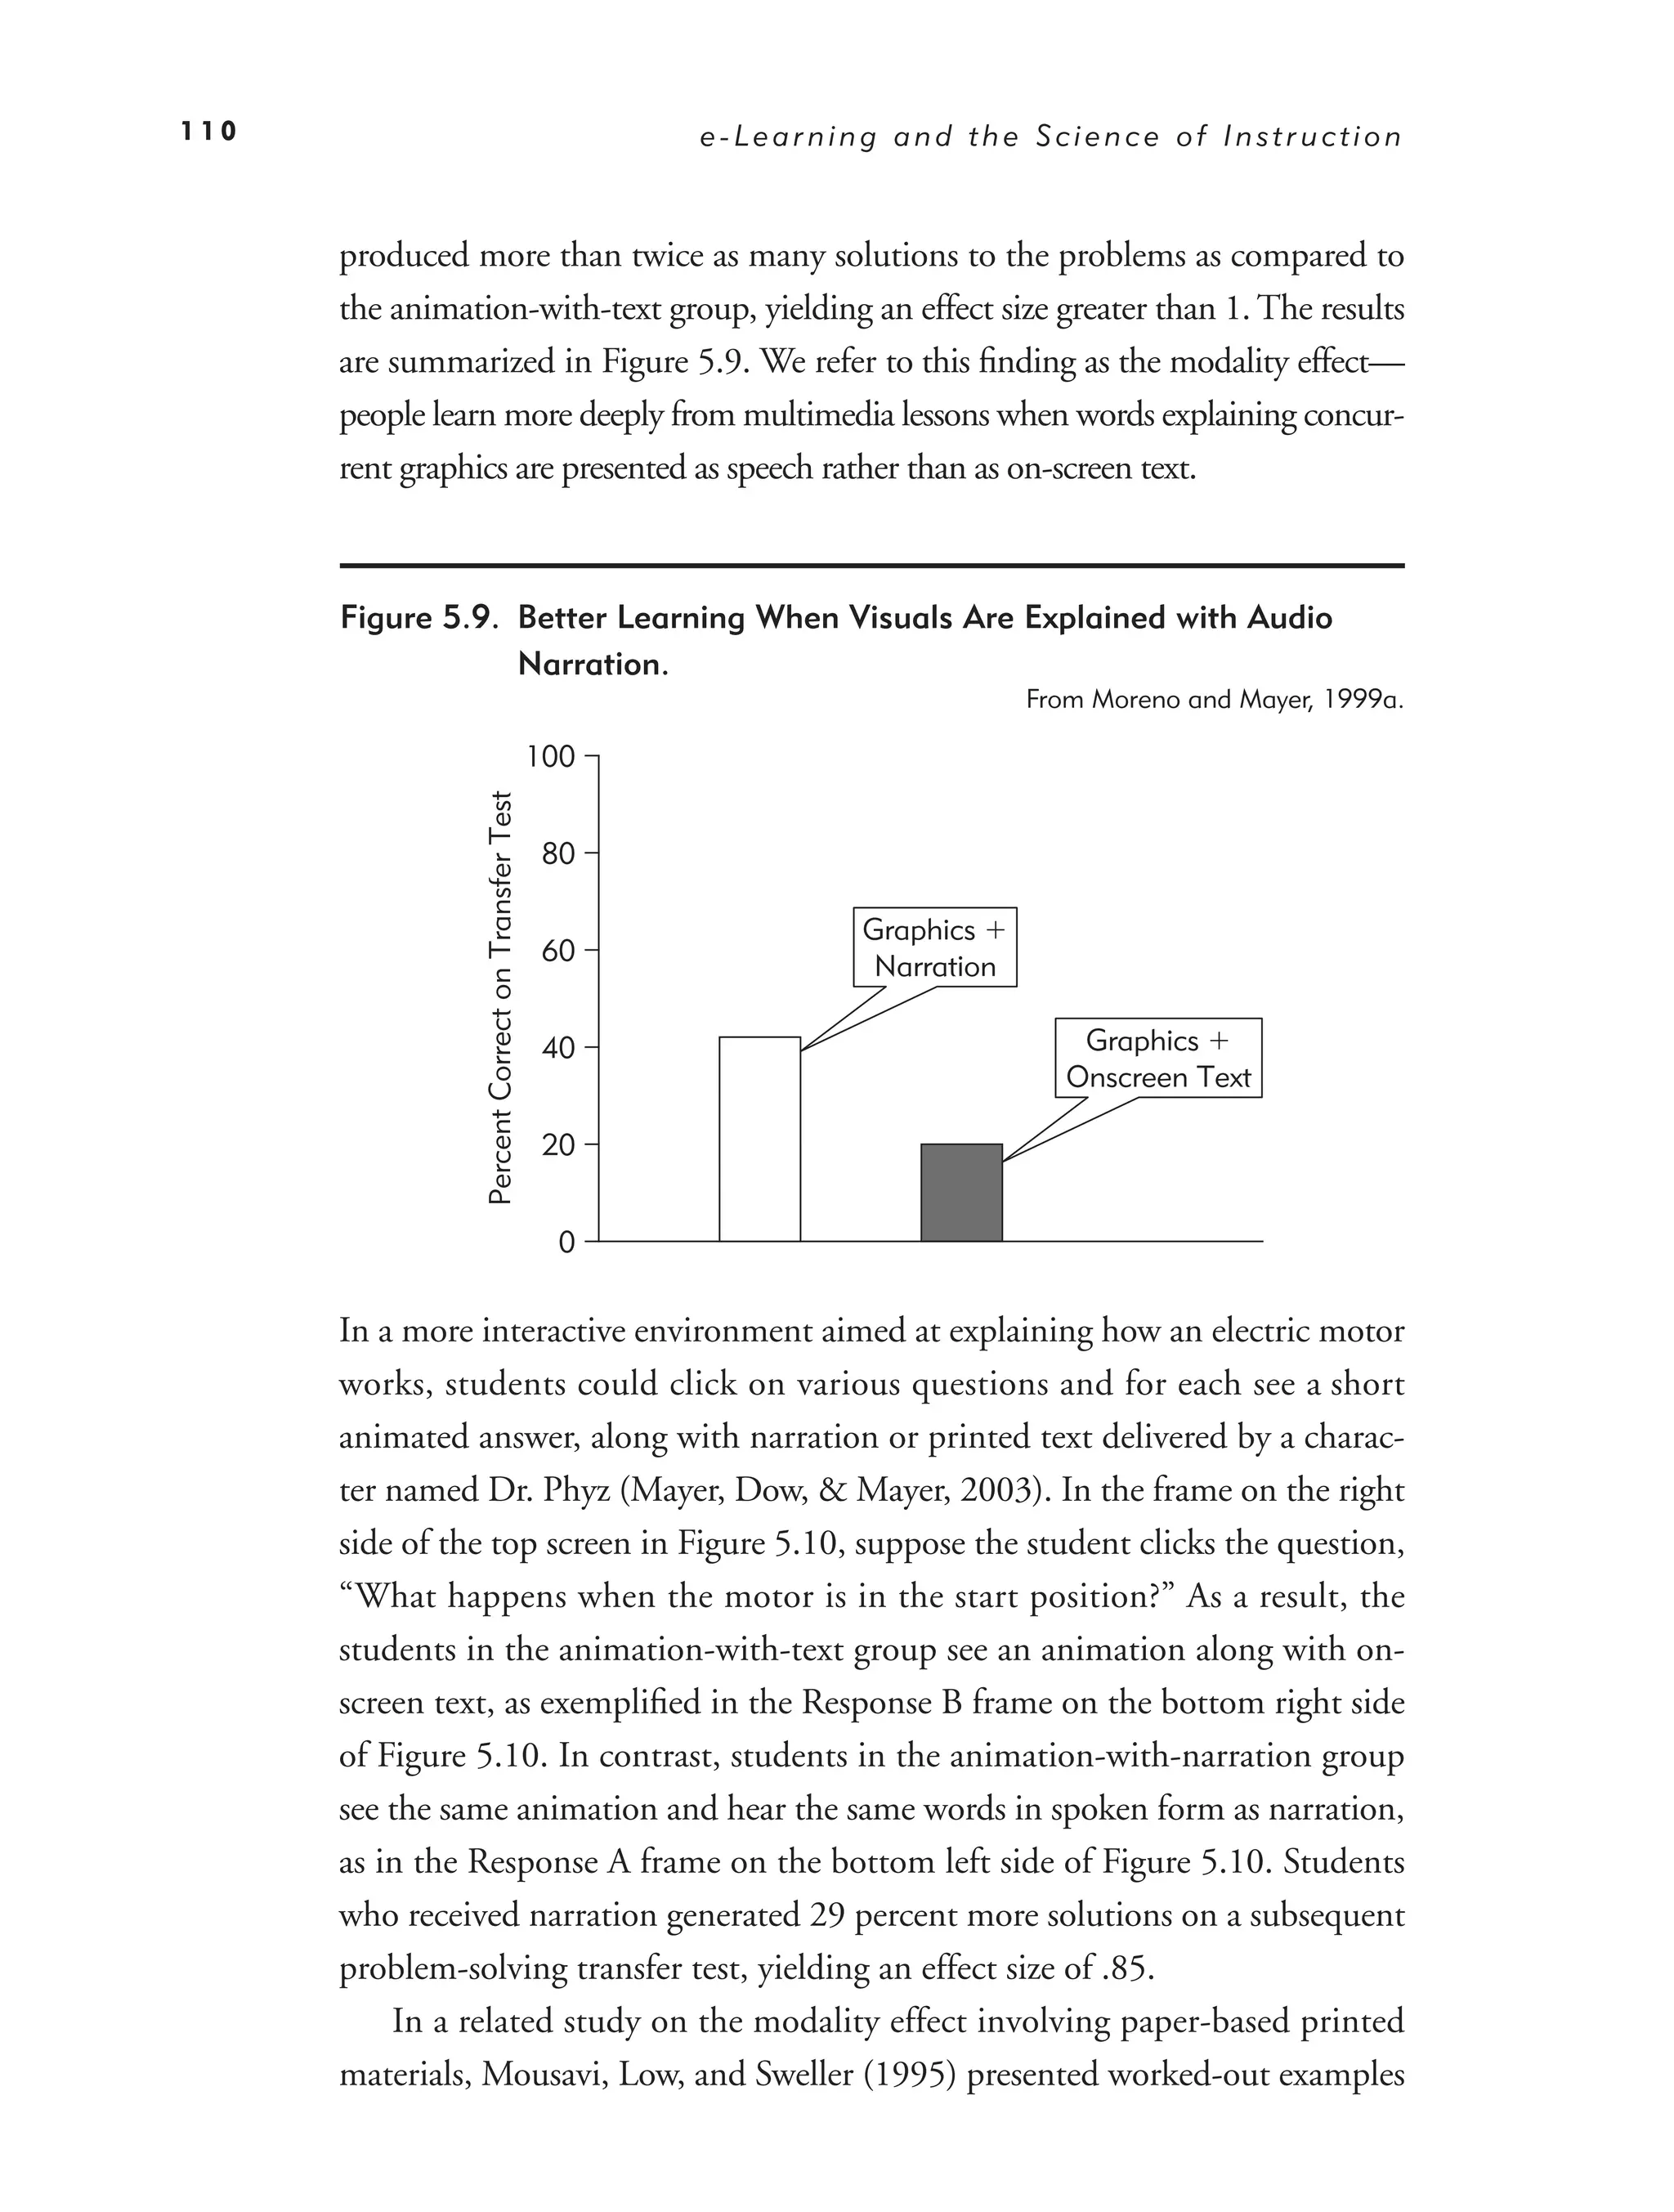
Evidence for Using Spoken Rather Than Printed Text 107
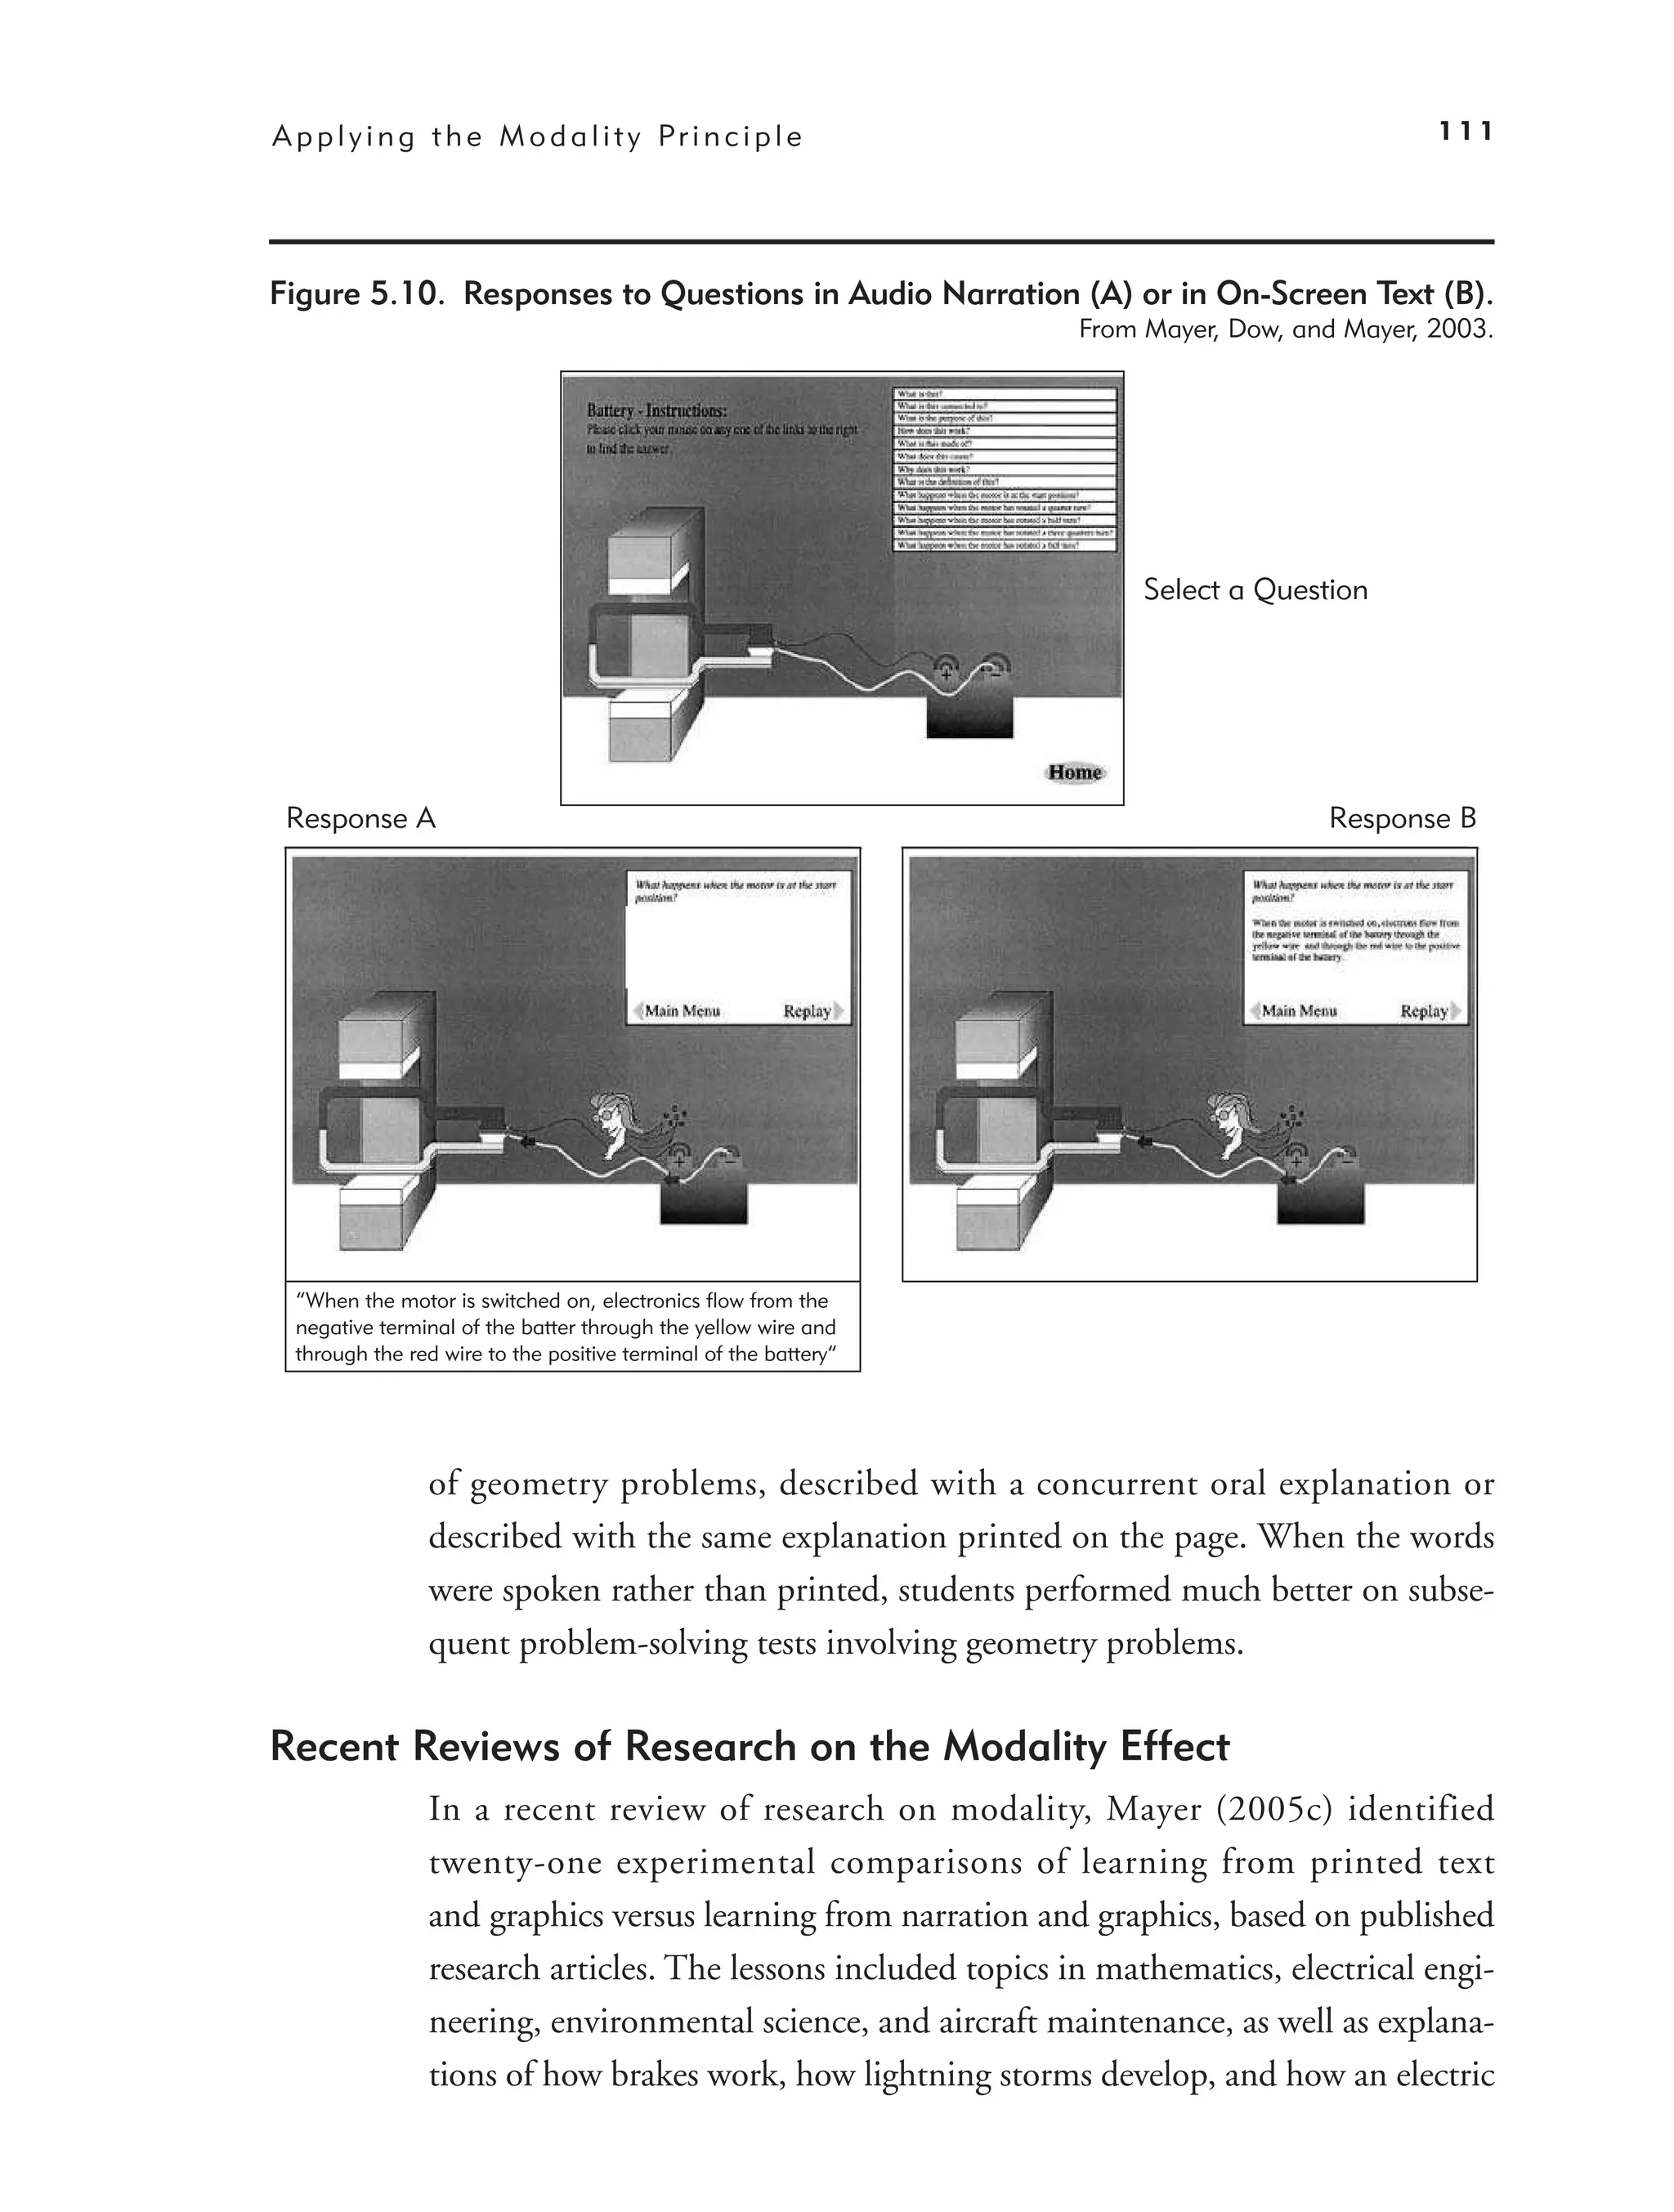
When the Modality Principle Applies 112
What We Don’t Know About Modality 113
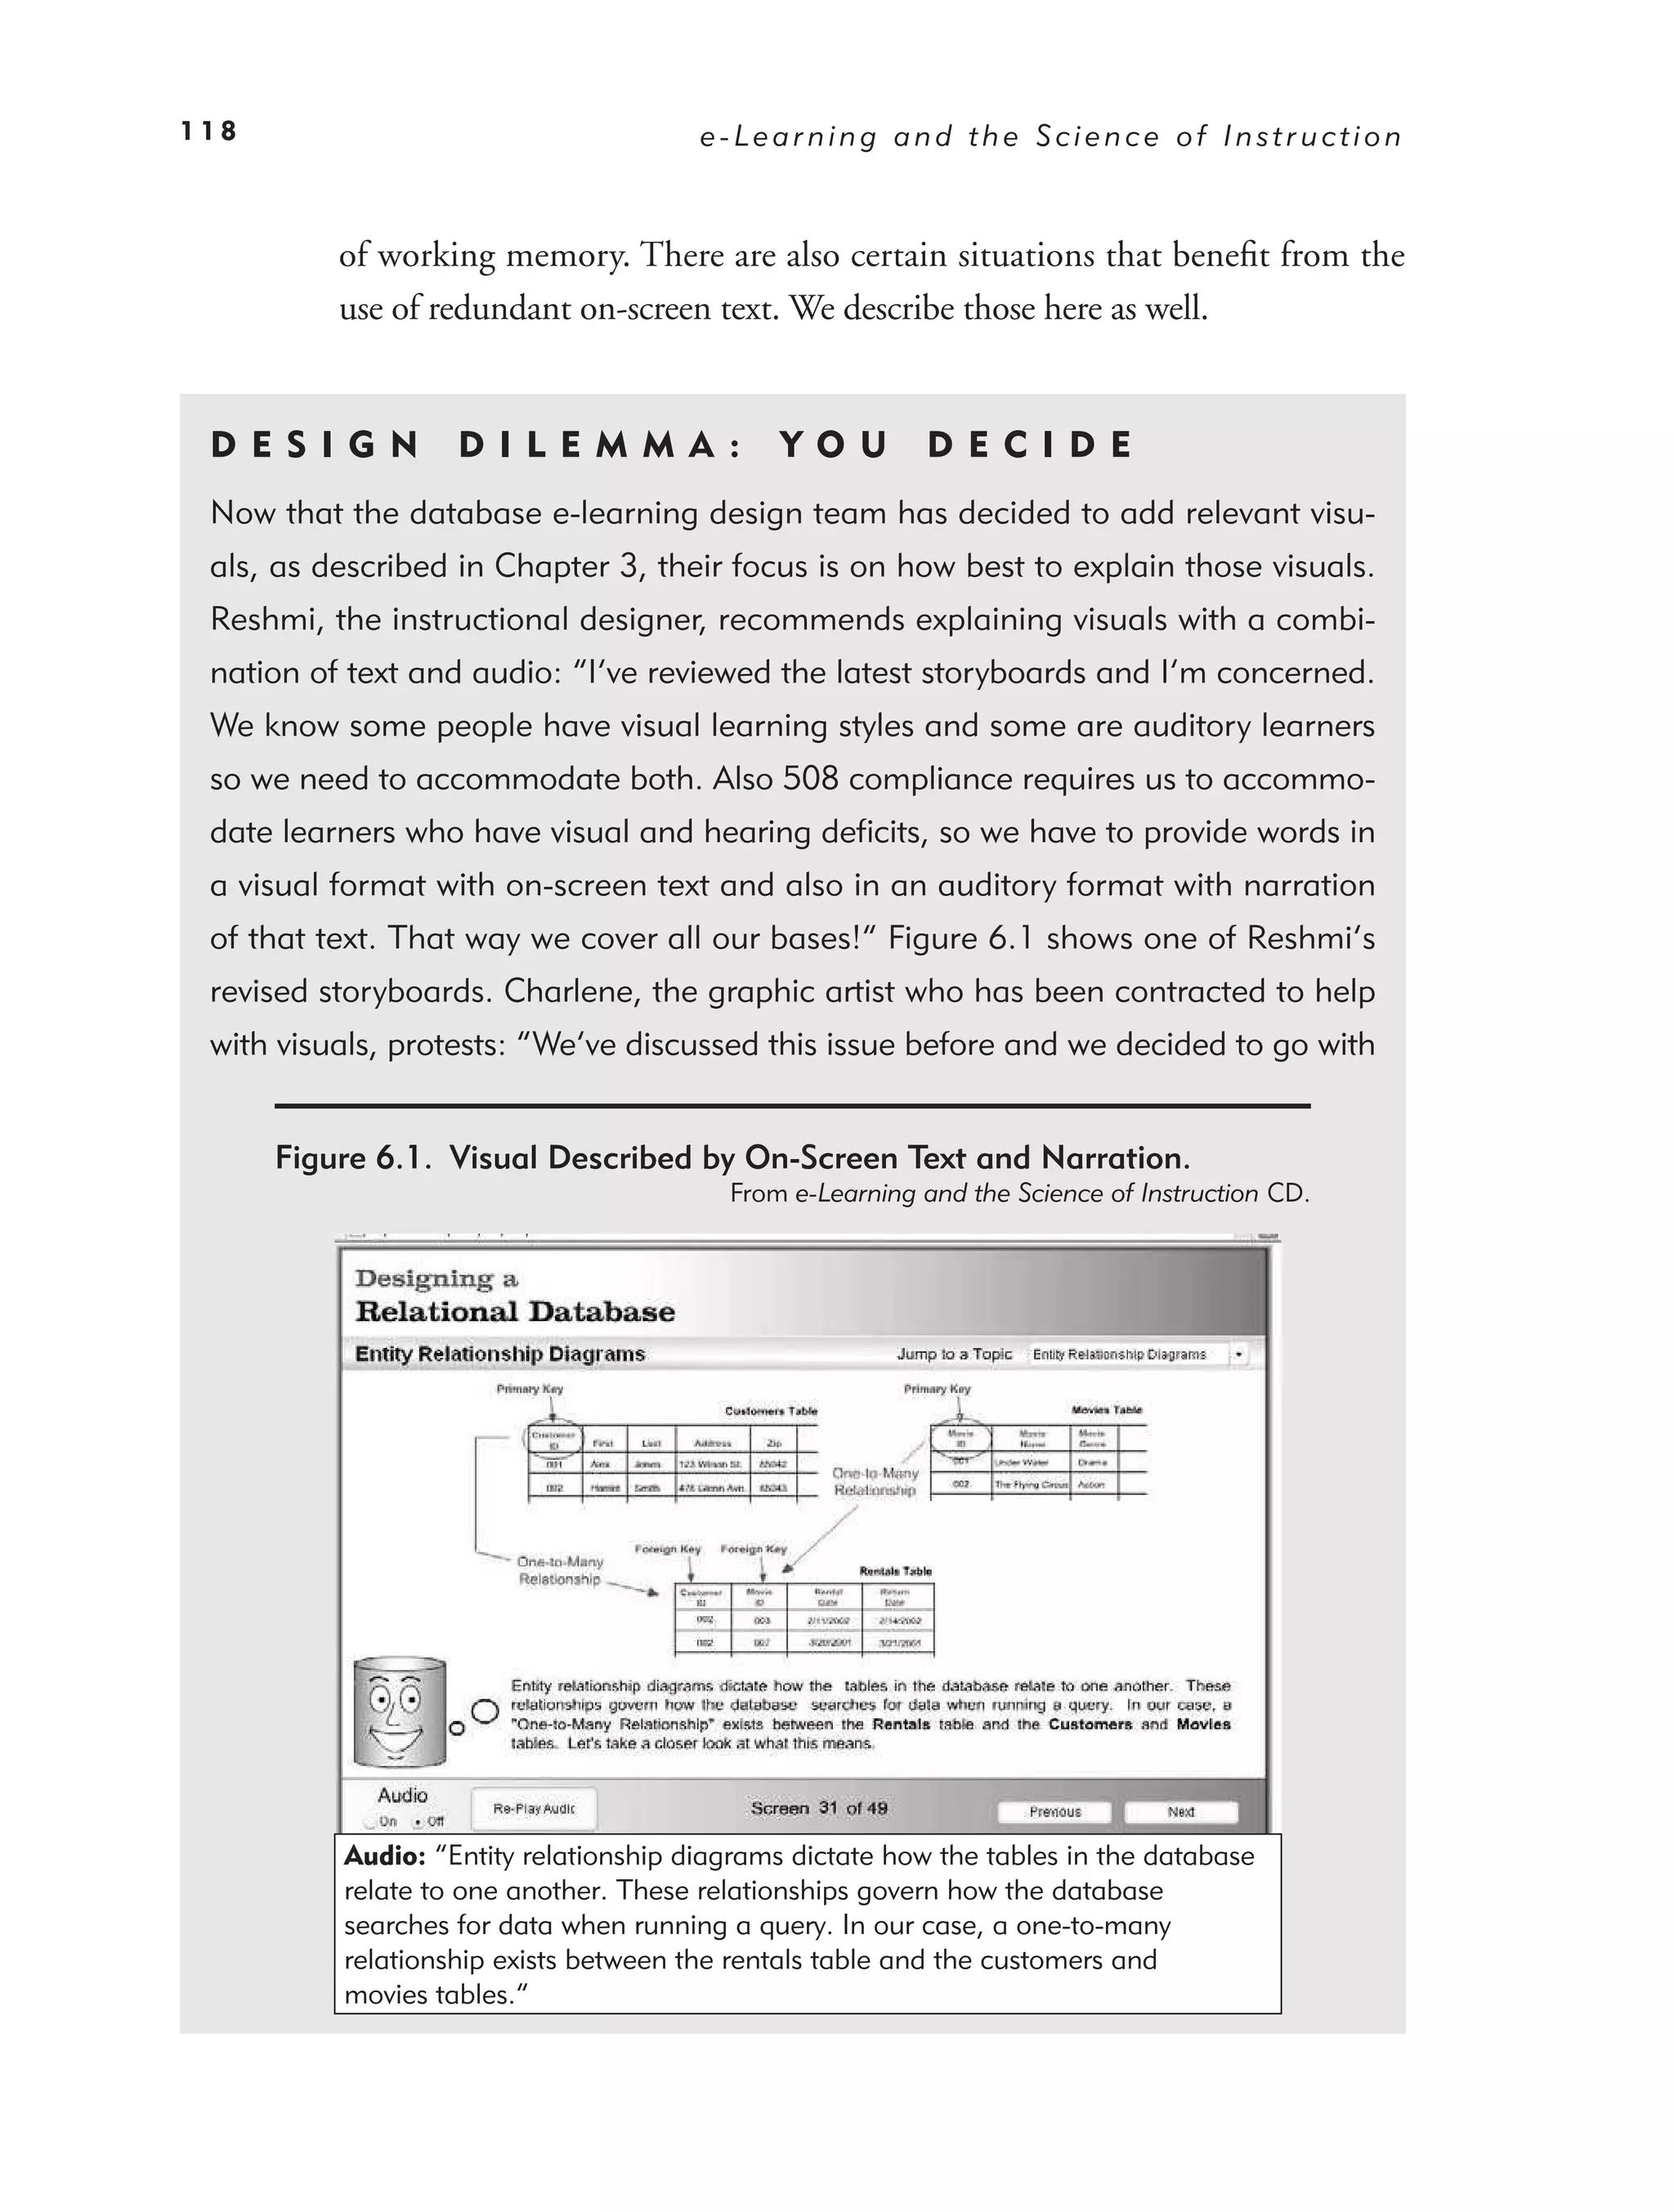
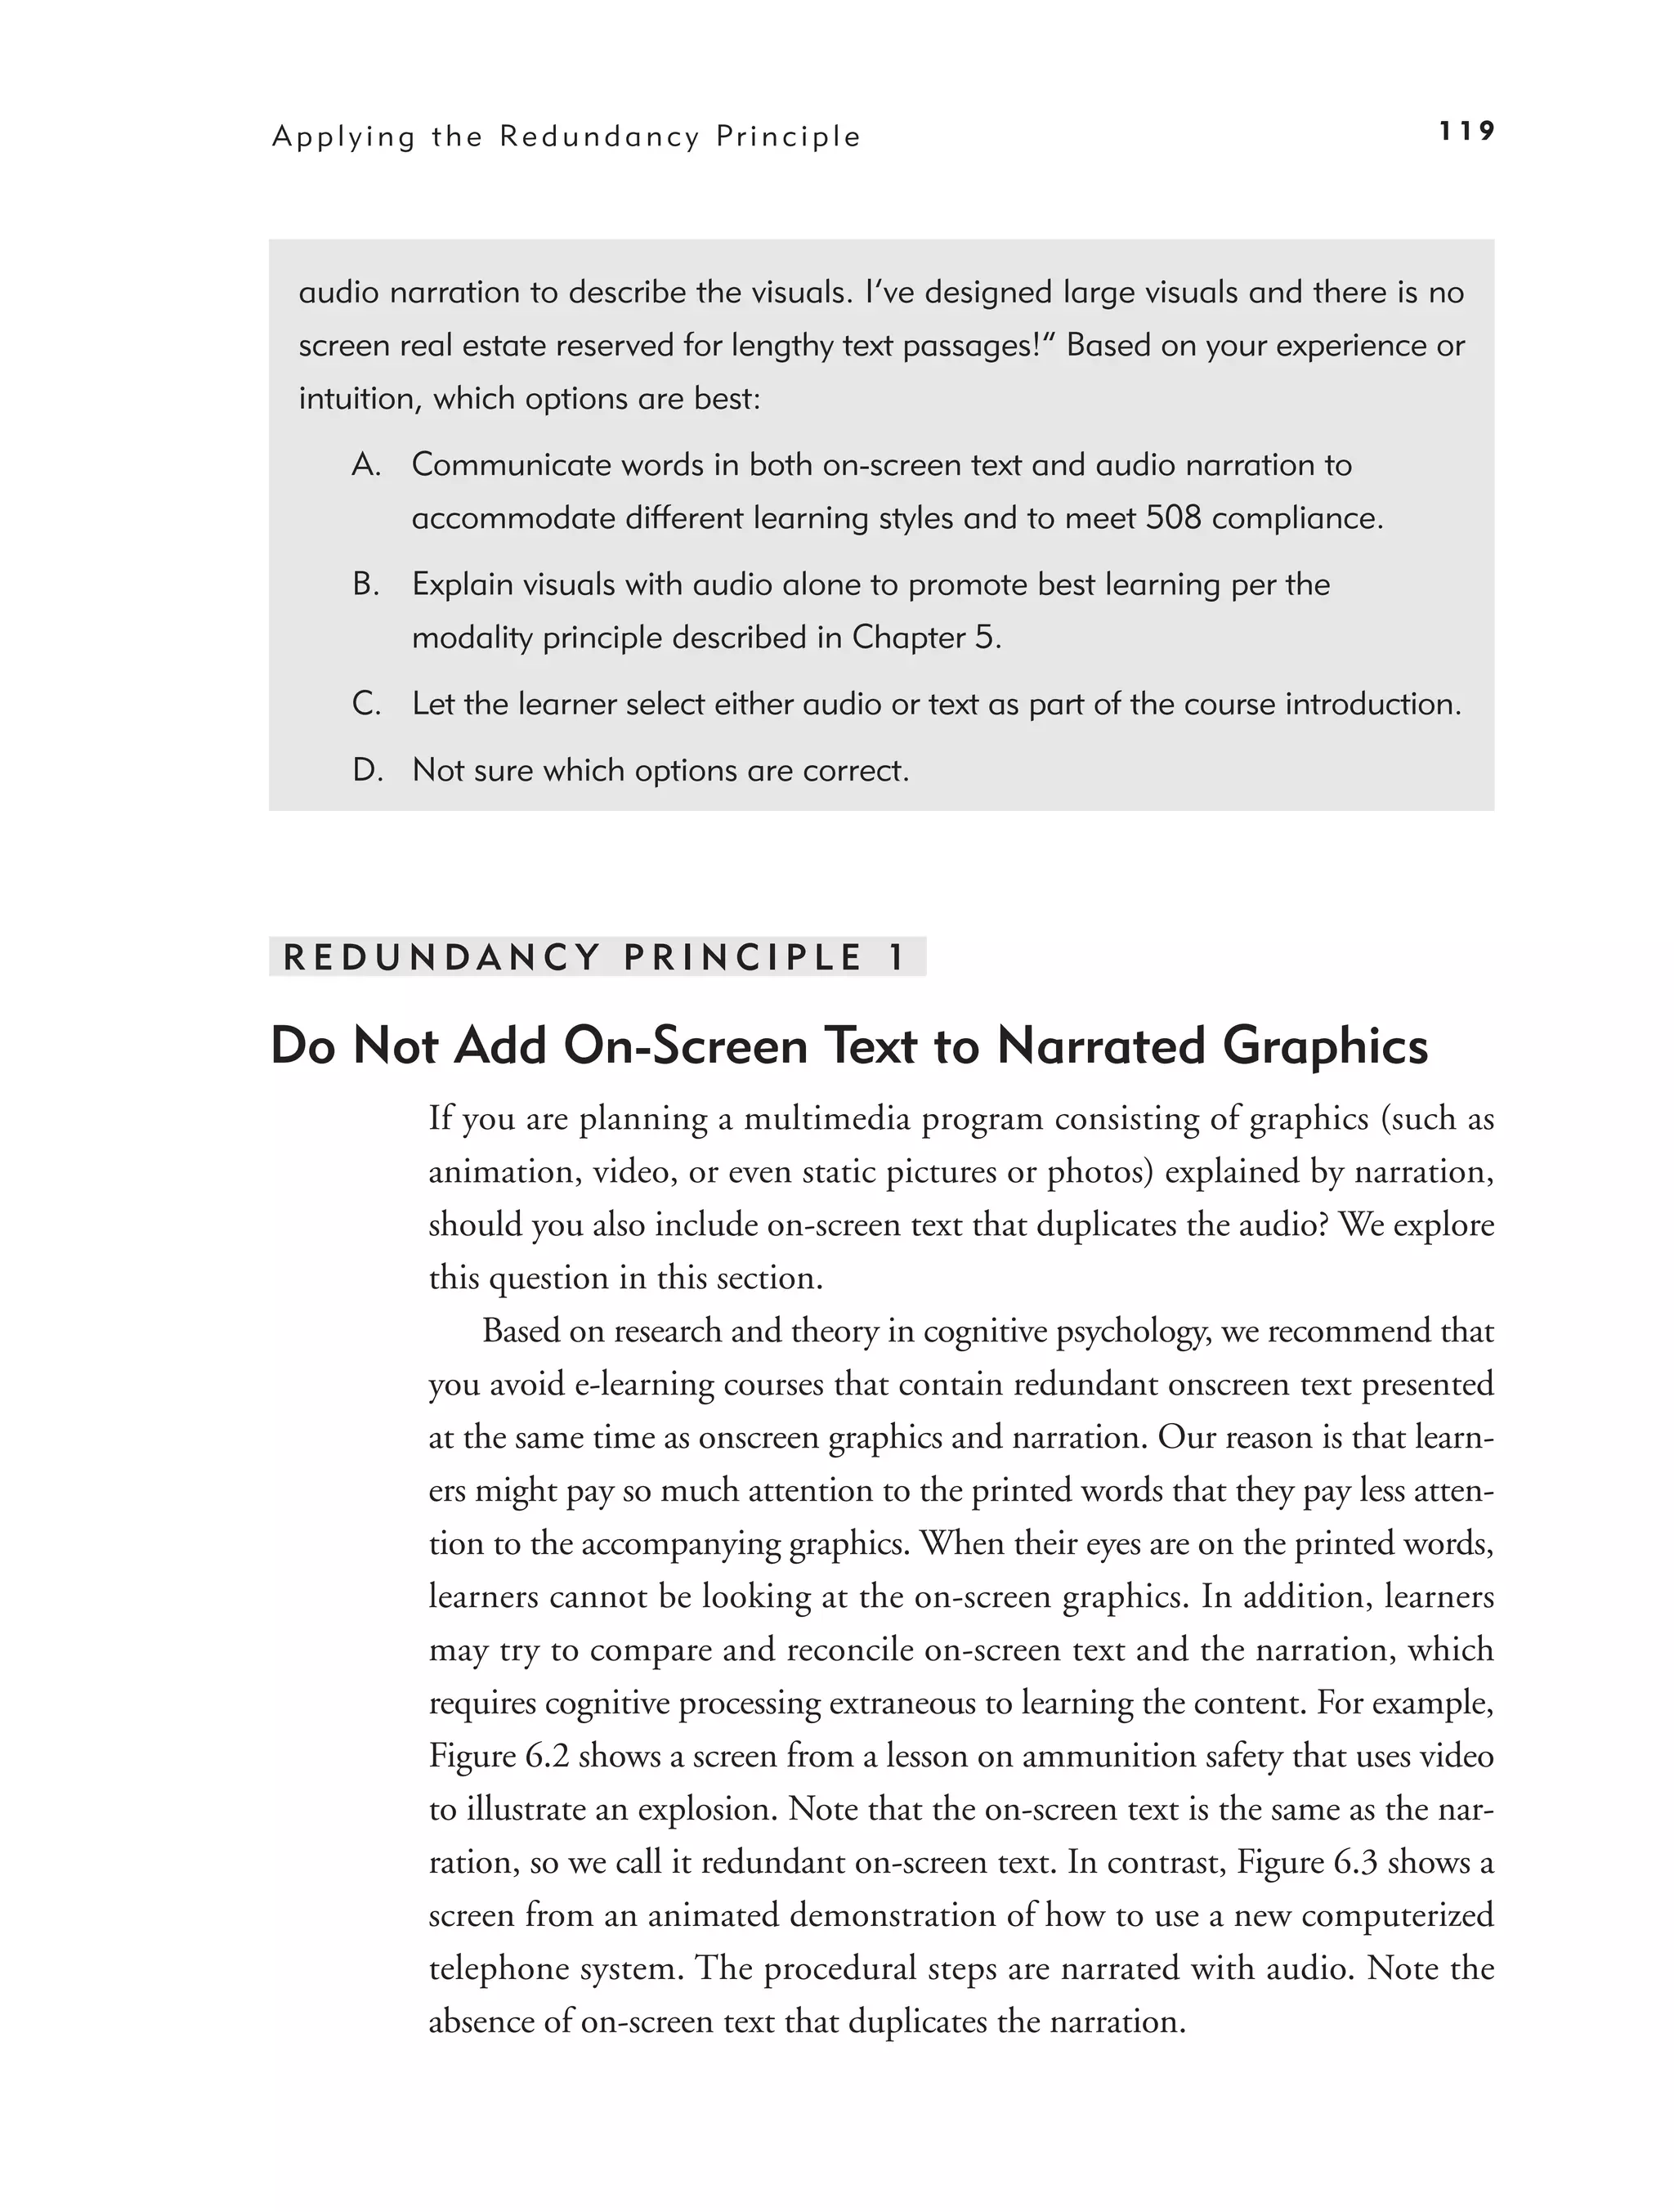
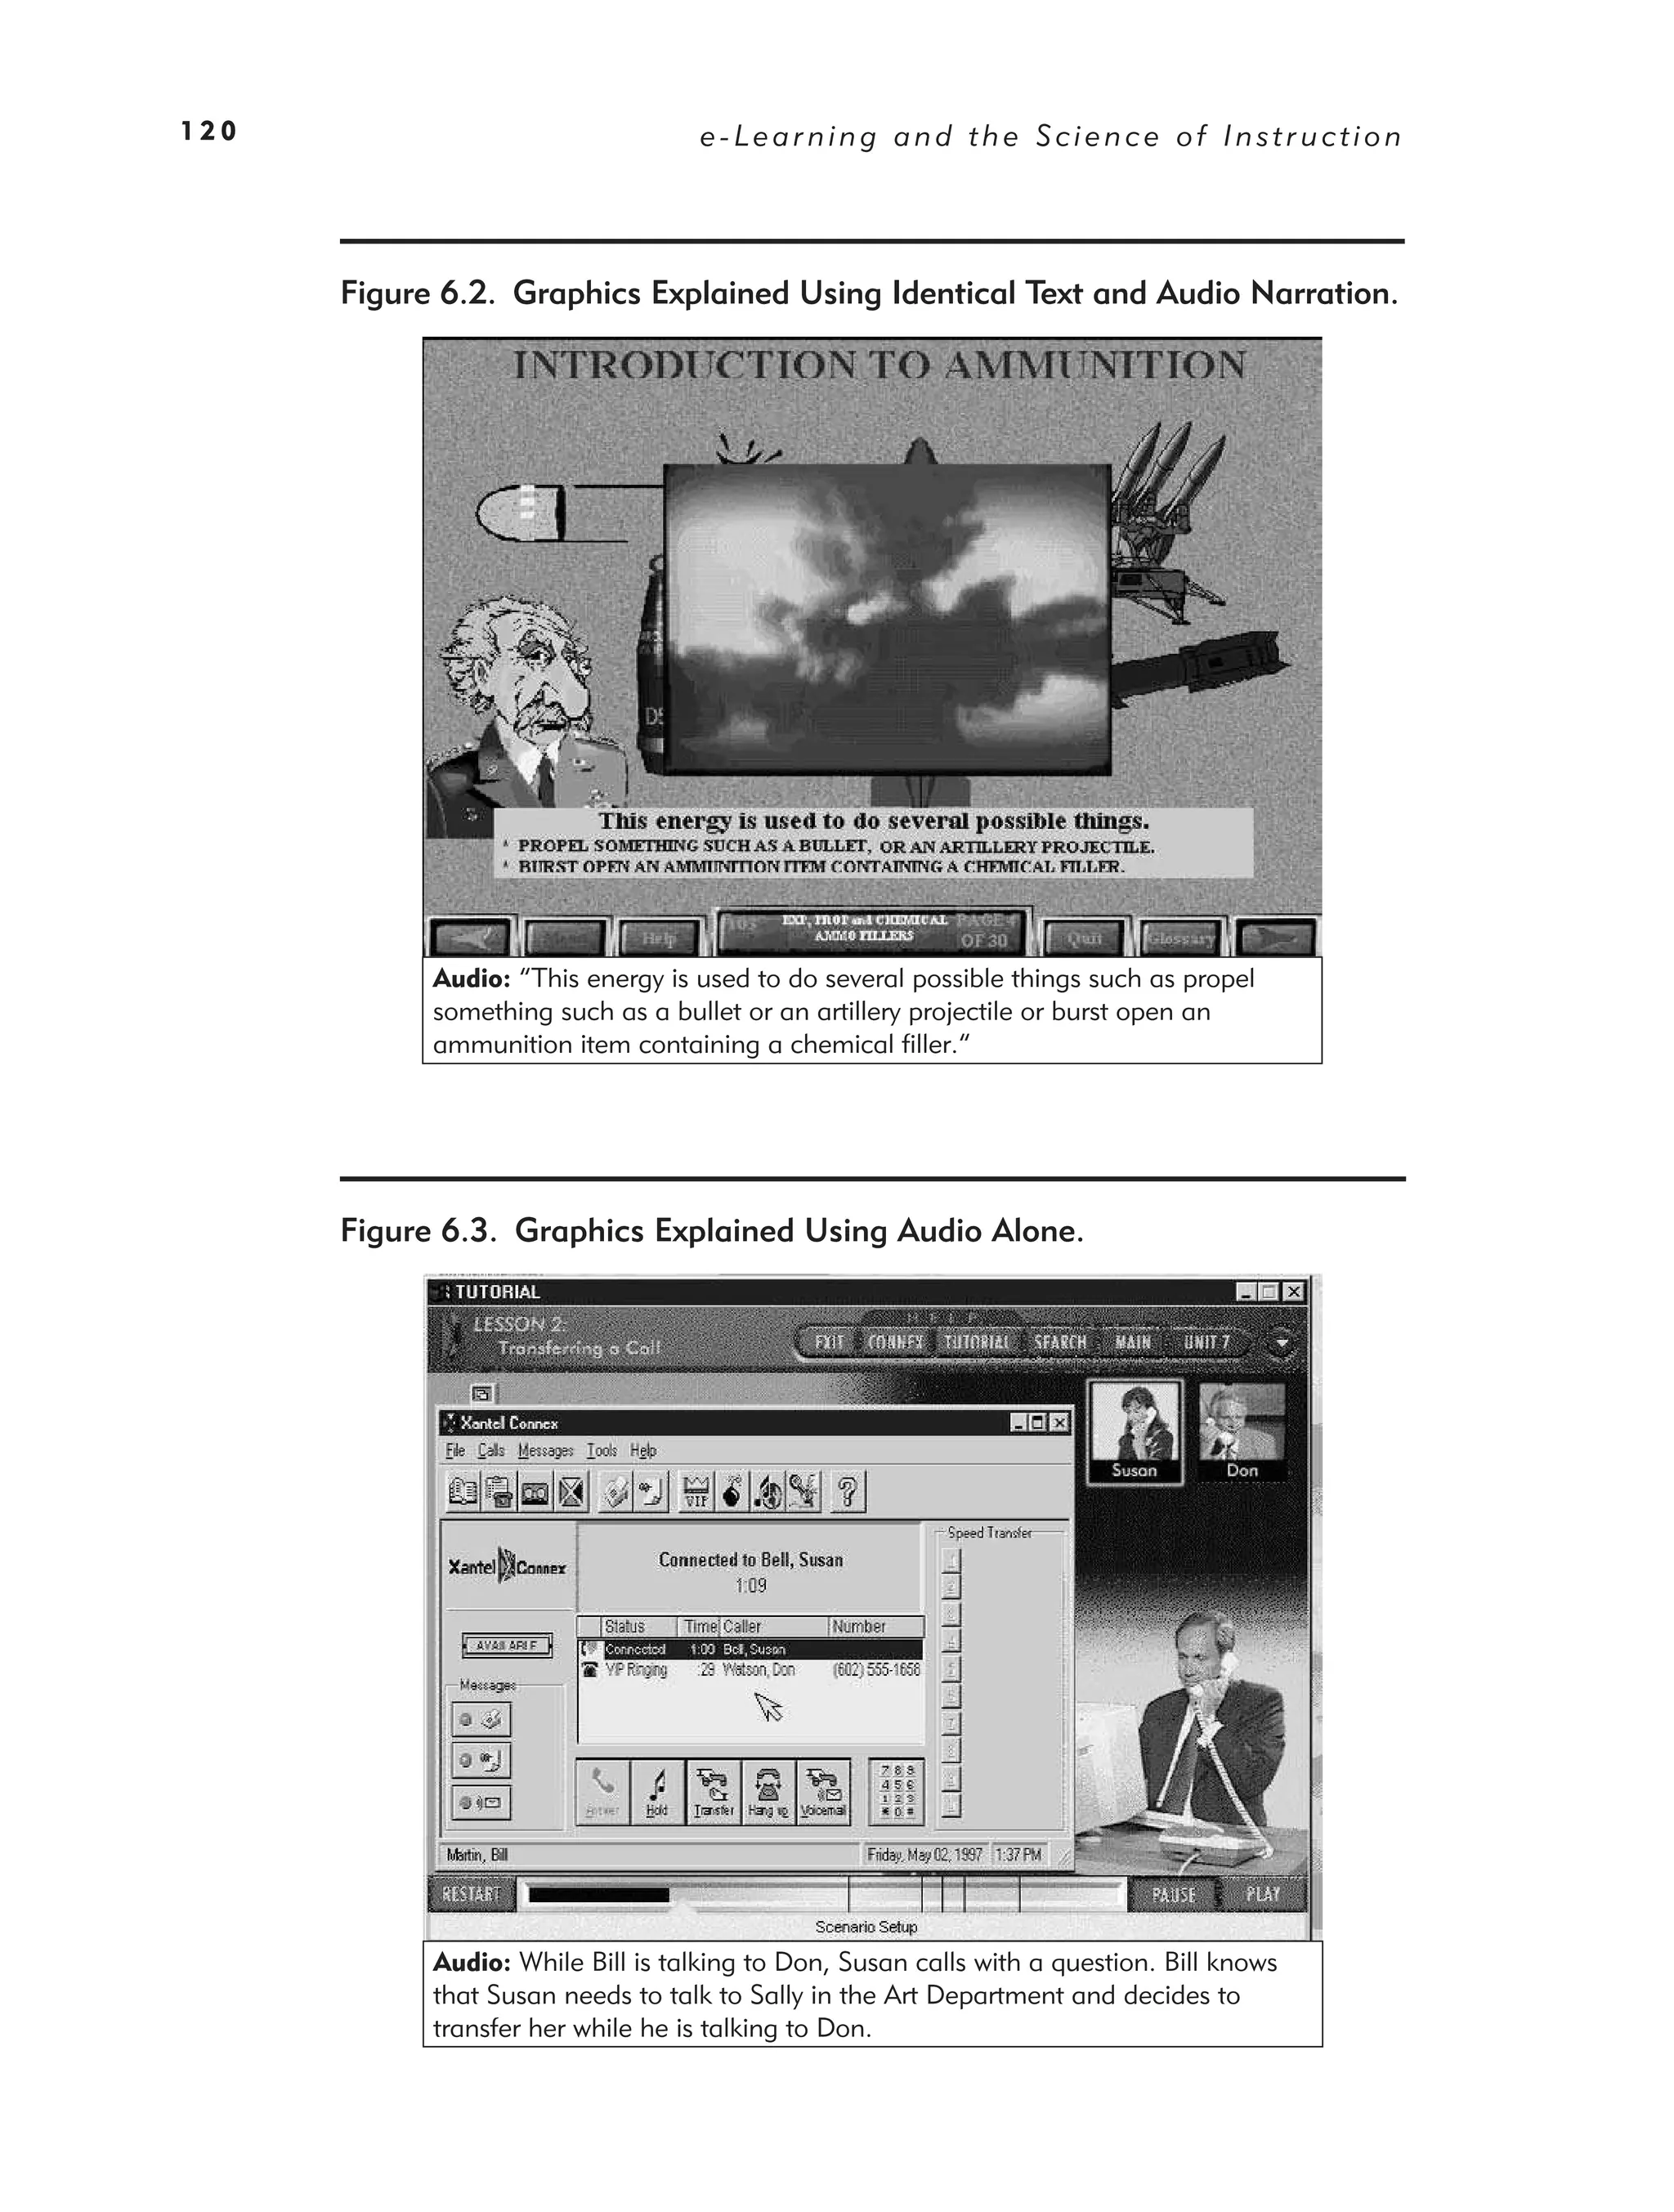
6. Applying the Redundancy Principle: Explain Visuals with Words
in Audio or Text: Not Both 117
Redundancy Principle 1: Do Not Add On-Screen Text to Narrated
Graphics 119
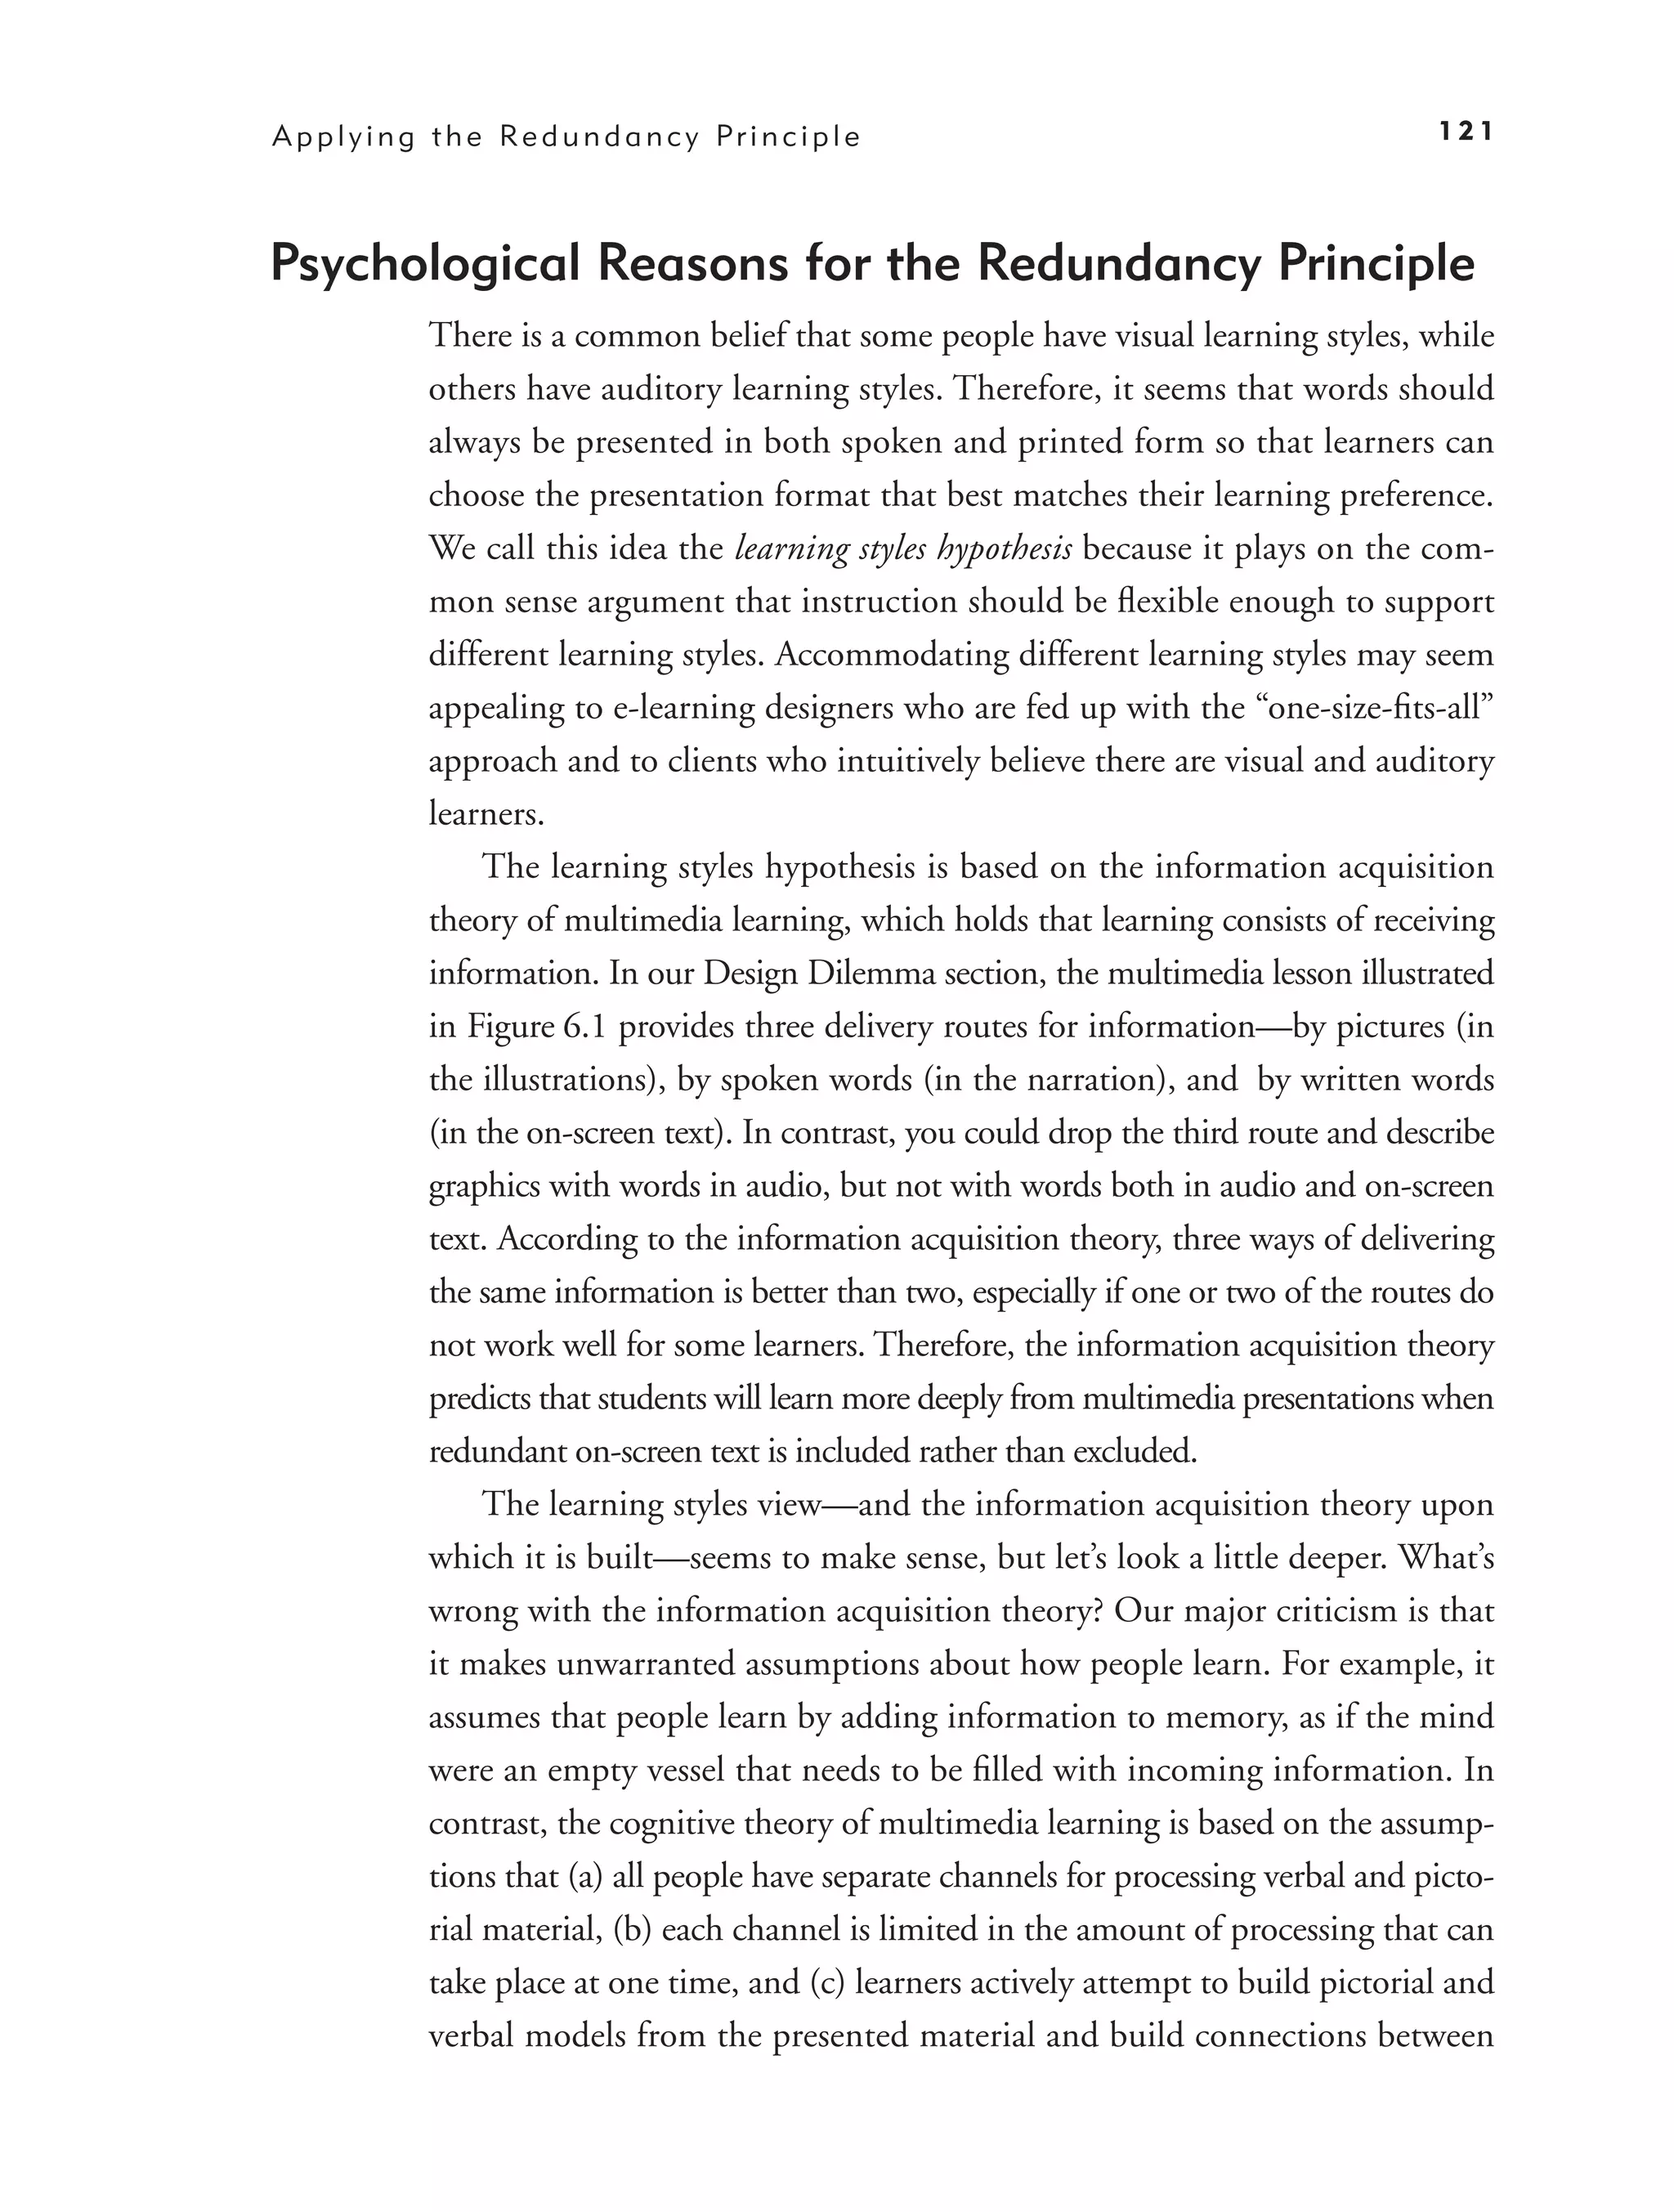
Psychological Reasons for the Redundancy Principle 121
Evidence for Omitting Redundant On-Screen Text 123
Redundancy Principle 2: Consider Adding On-Screen Text to
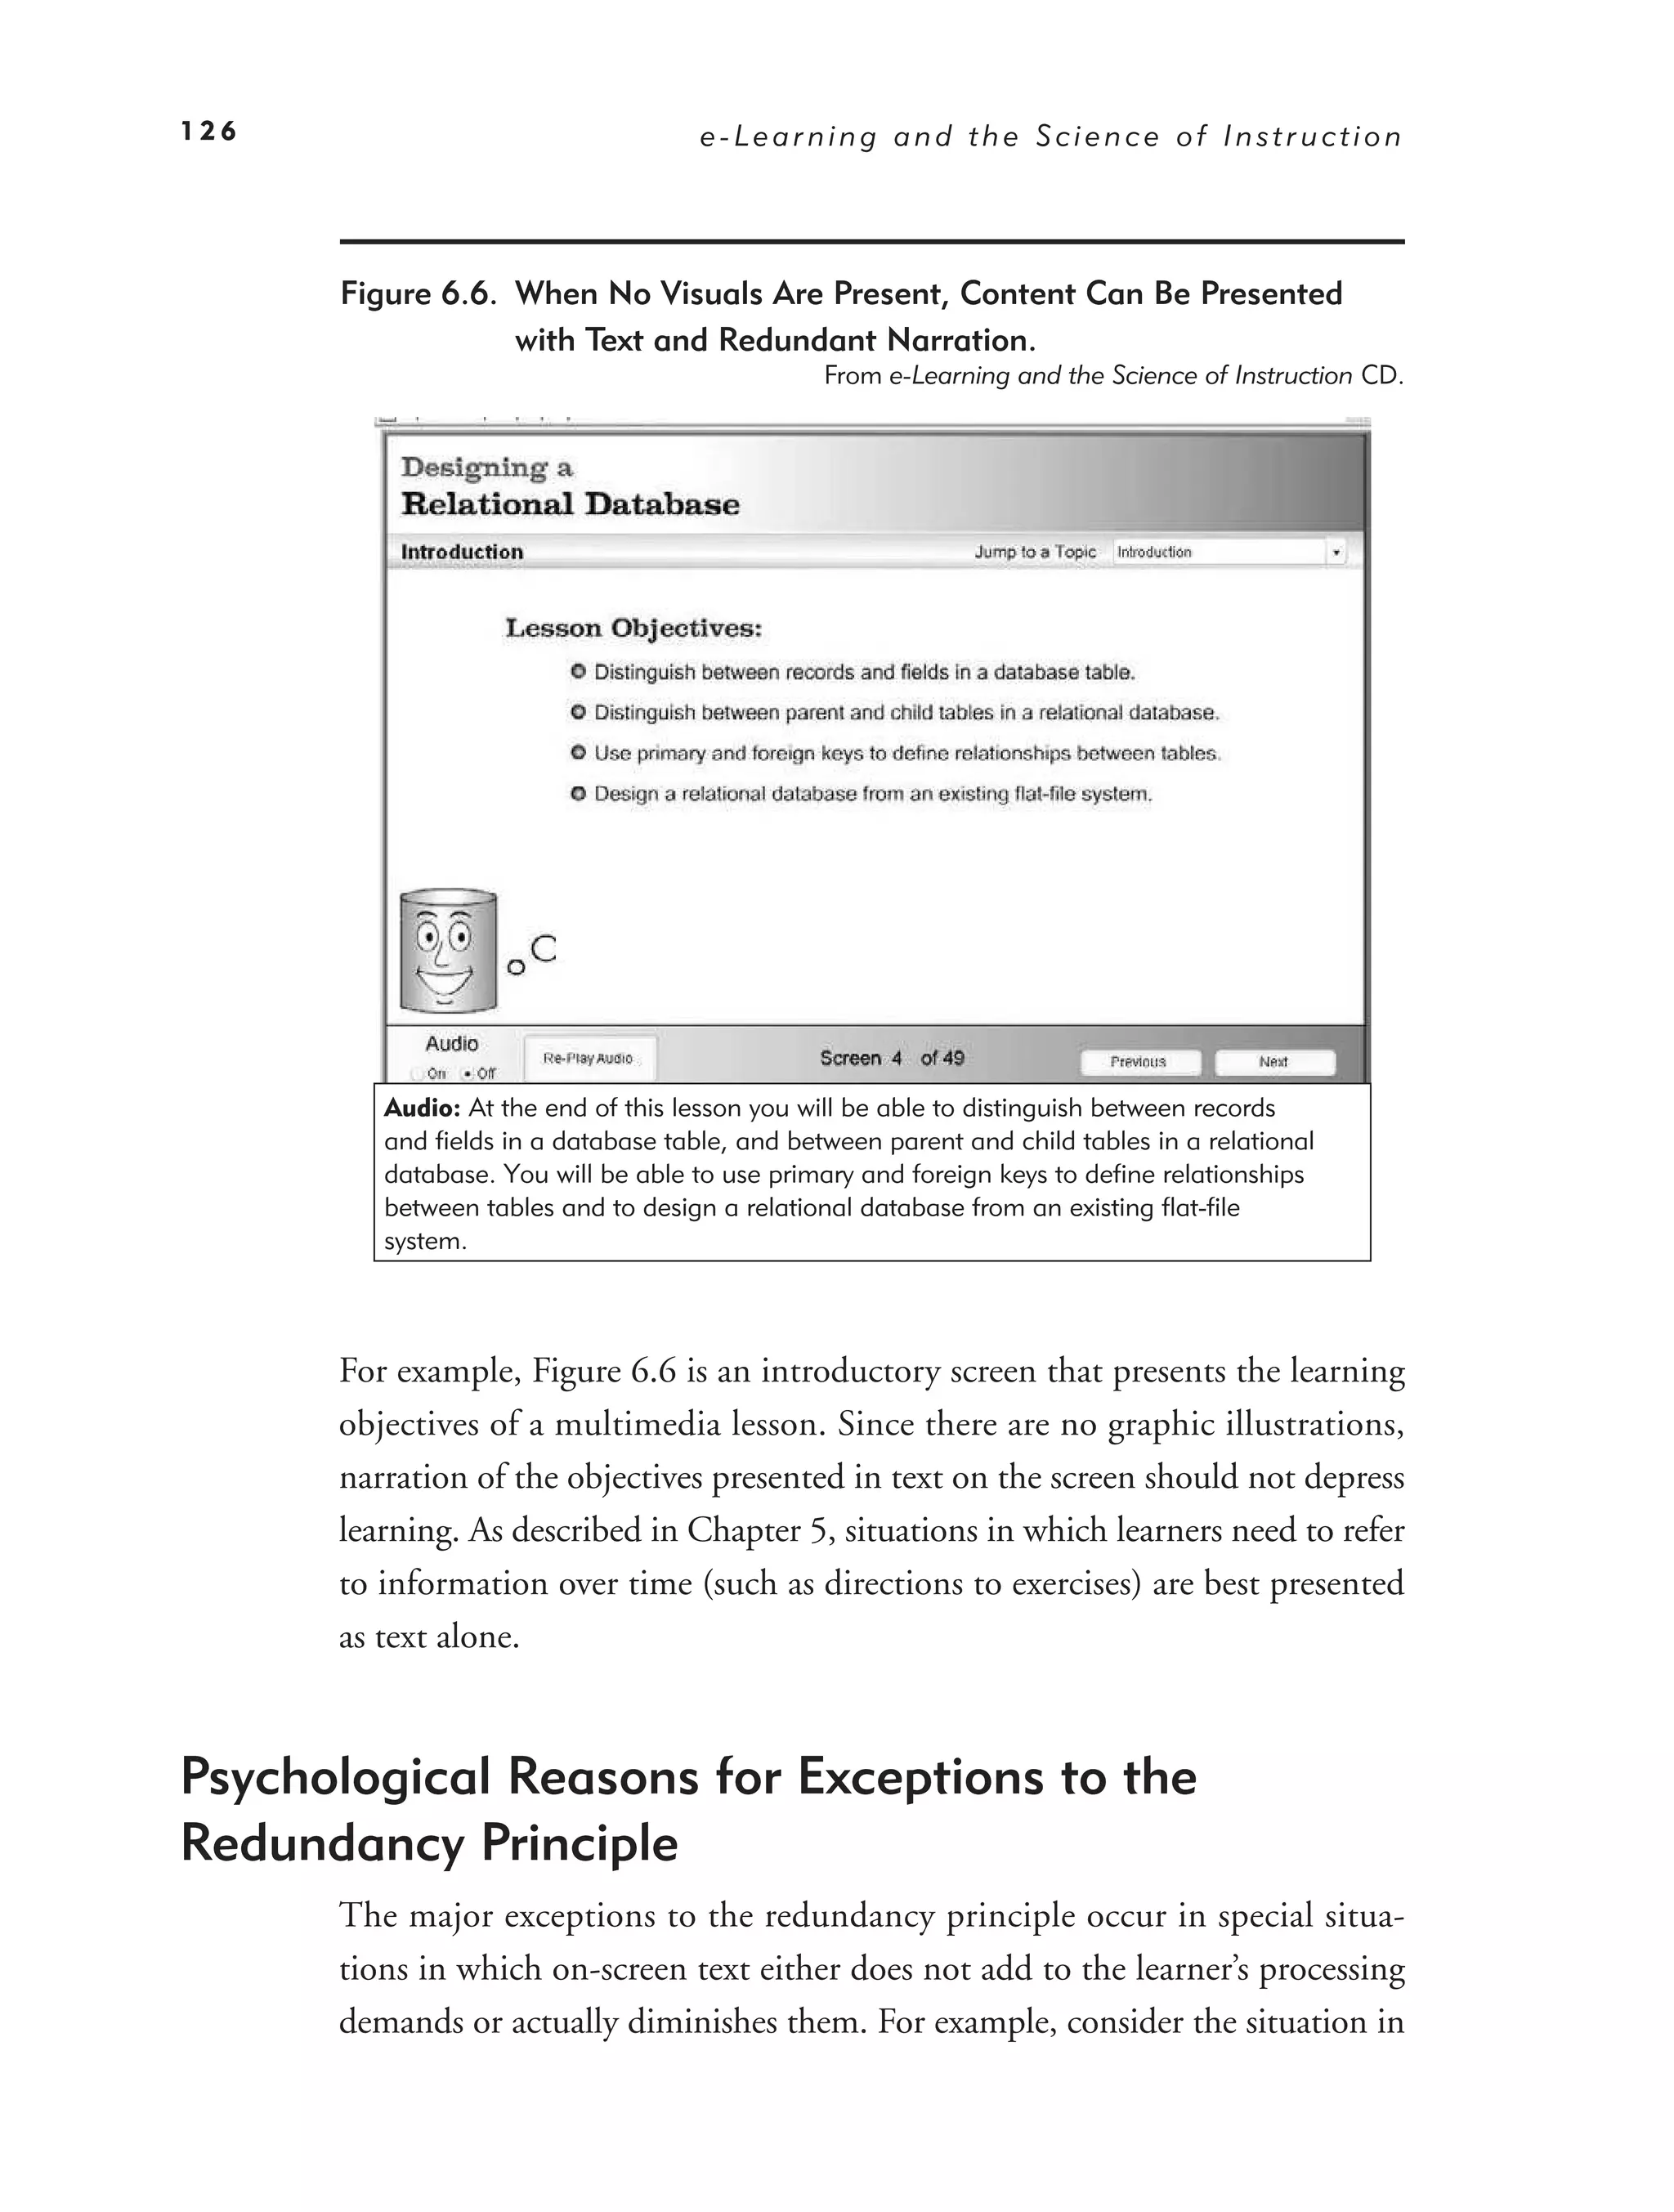
Narration in Special Situations 125
Psychological Reasons for Exceptions to the Redundancy Principle 126
Evidence for Including Redundant On-Screen Text 127
What We Don’t Know About Redundancy 128
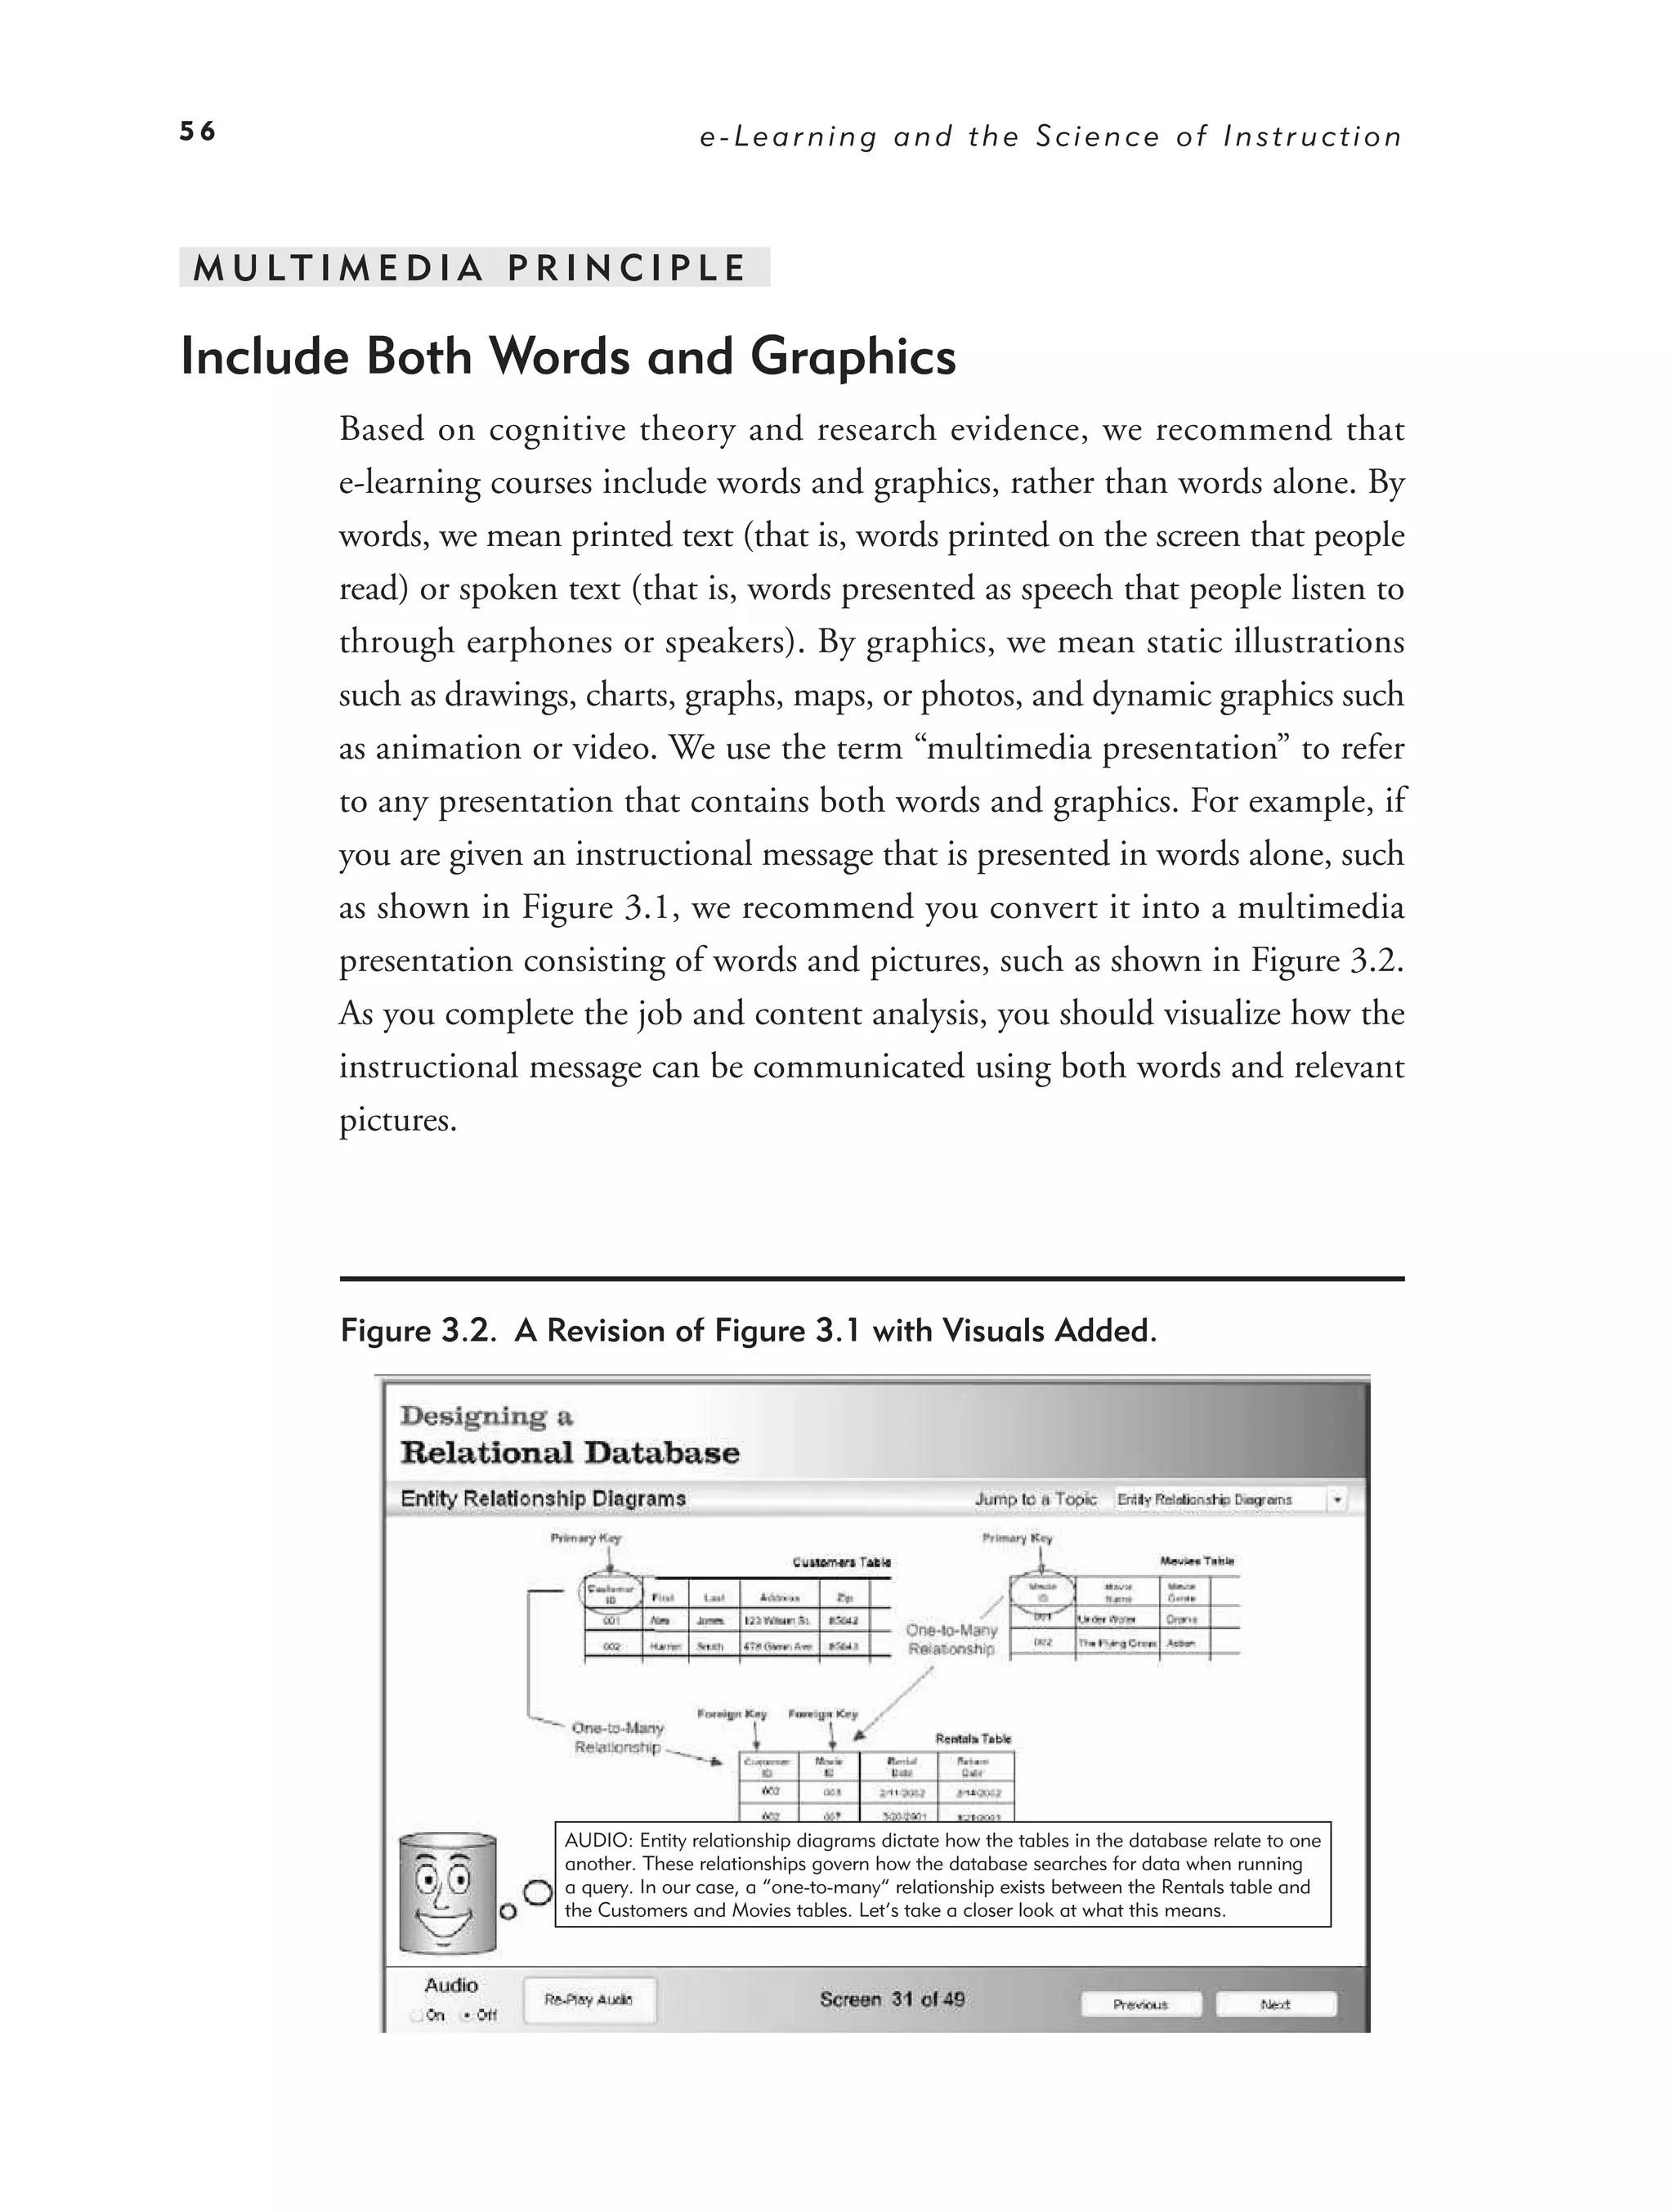
7. Applying the Coherence Principle: Adding Interesting Material
Can Hurt Learning 133
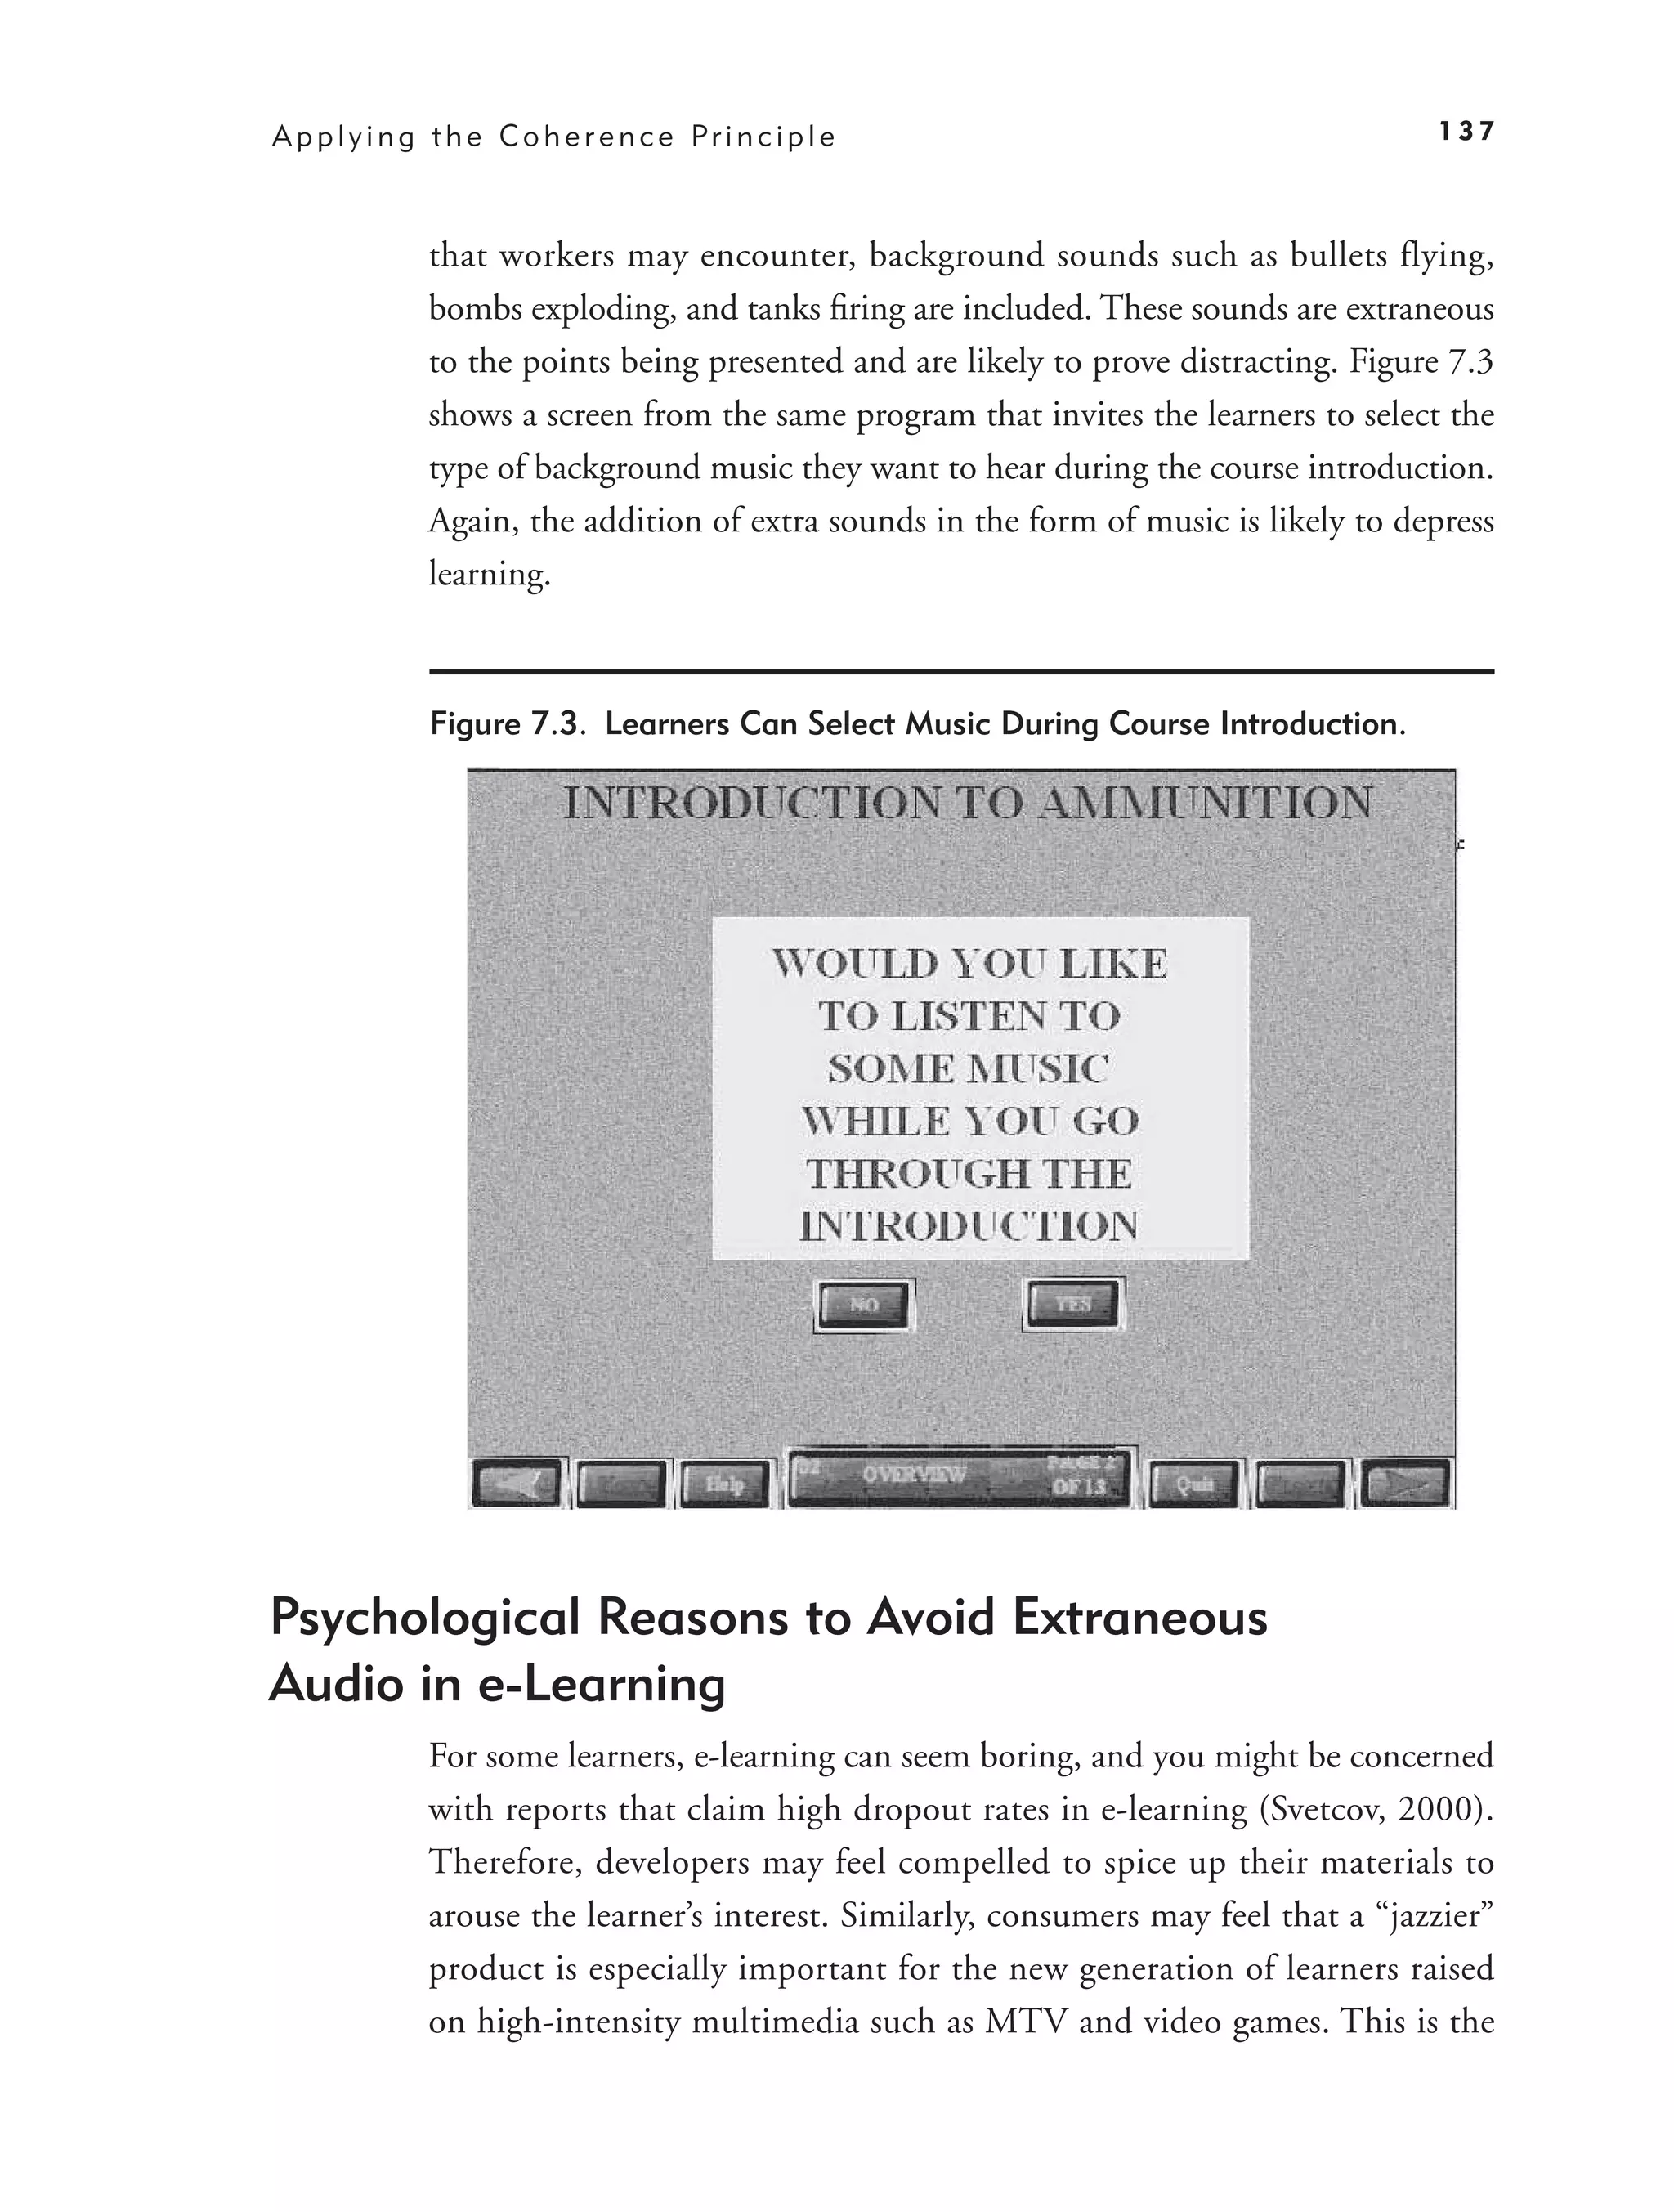
Coherence Principle 1: Avoid e-Lessons with Extraneous Audio 135
Psychological Reasons to Avoid Extraneous Audio in e-Learning 137
Evidence for Omitting Extraneous Audio 138
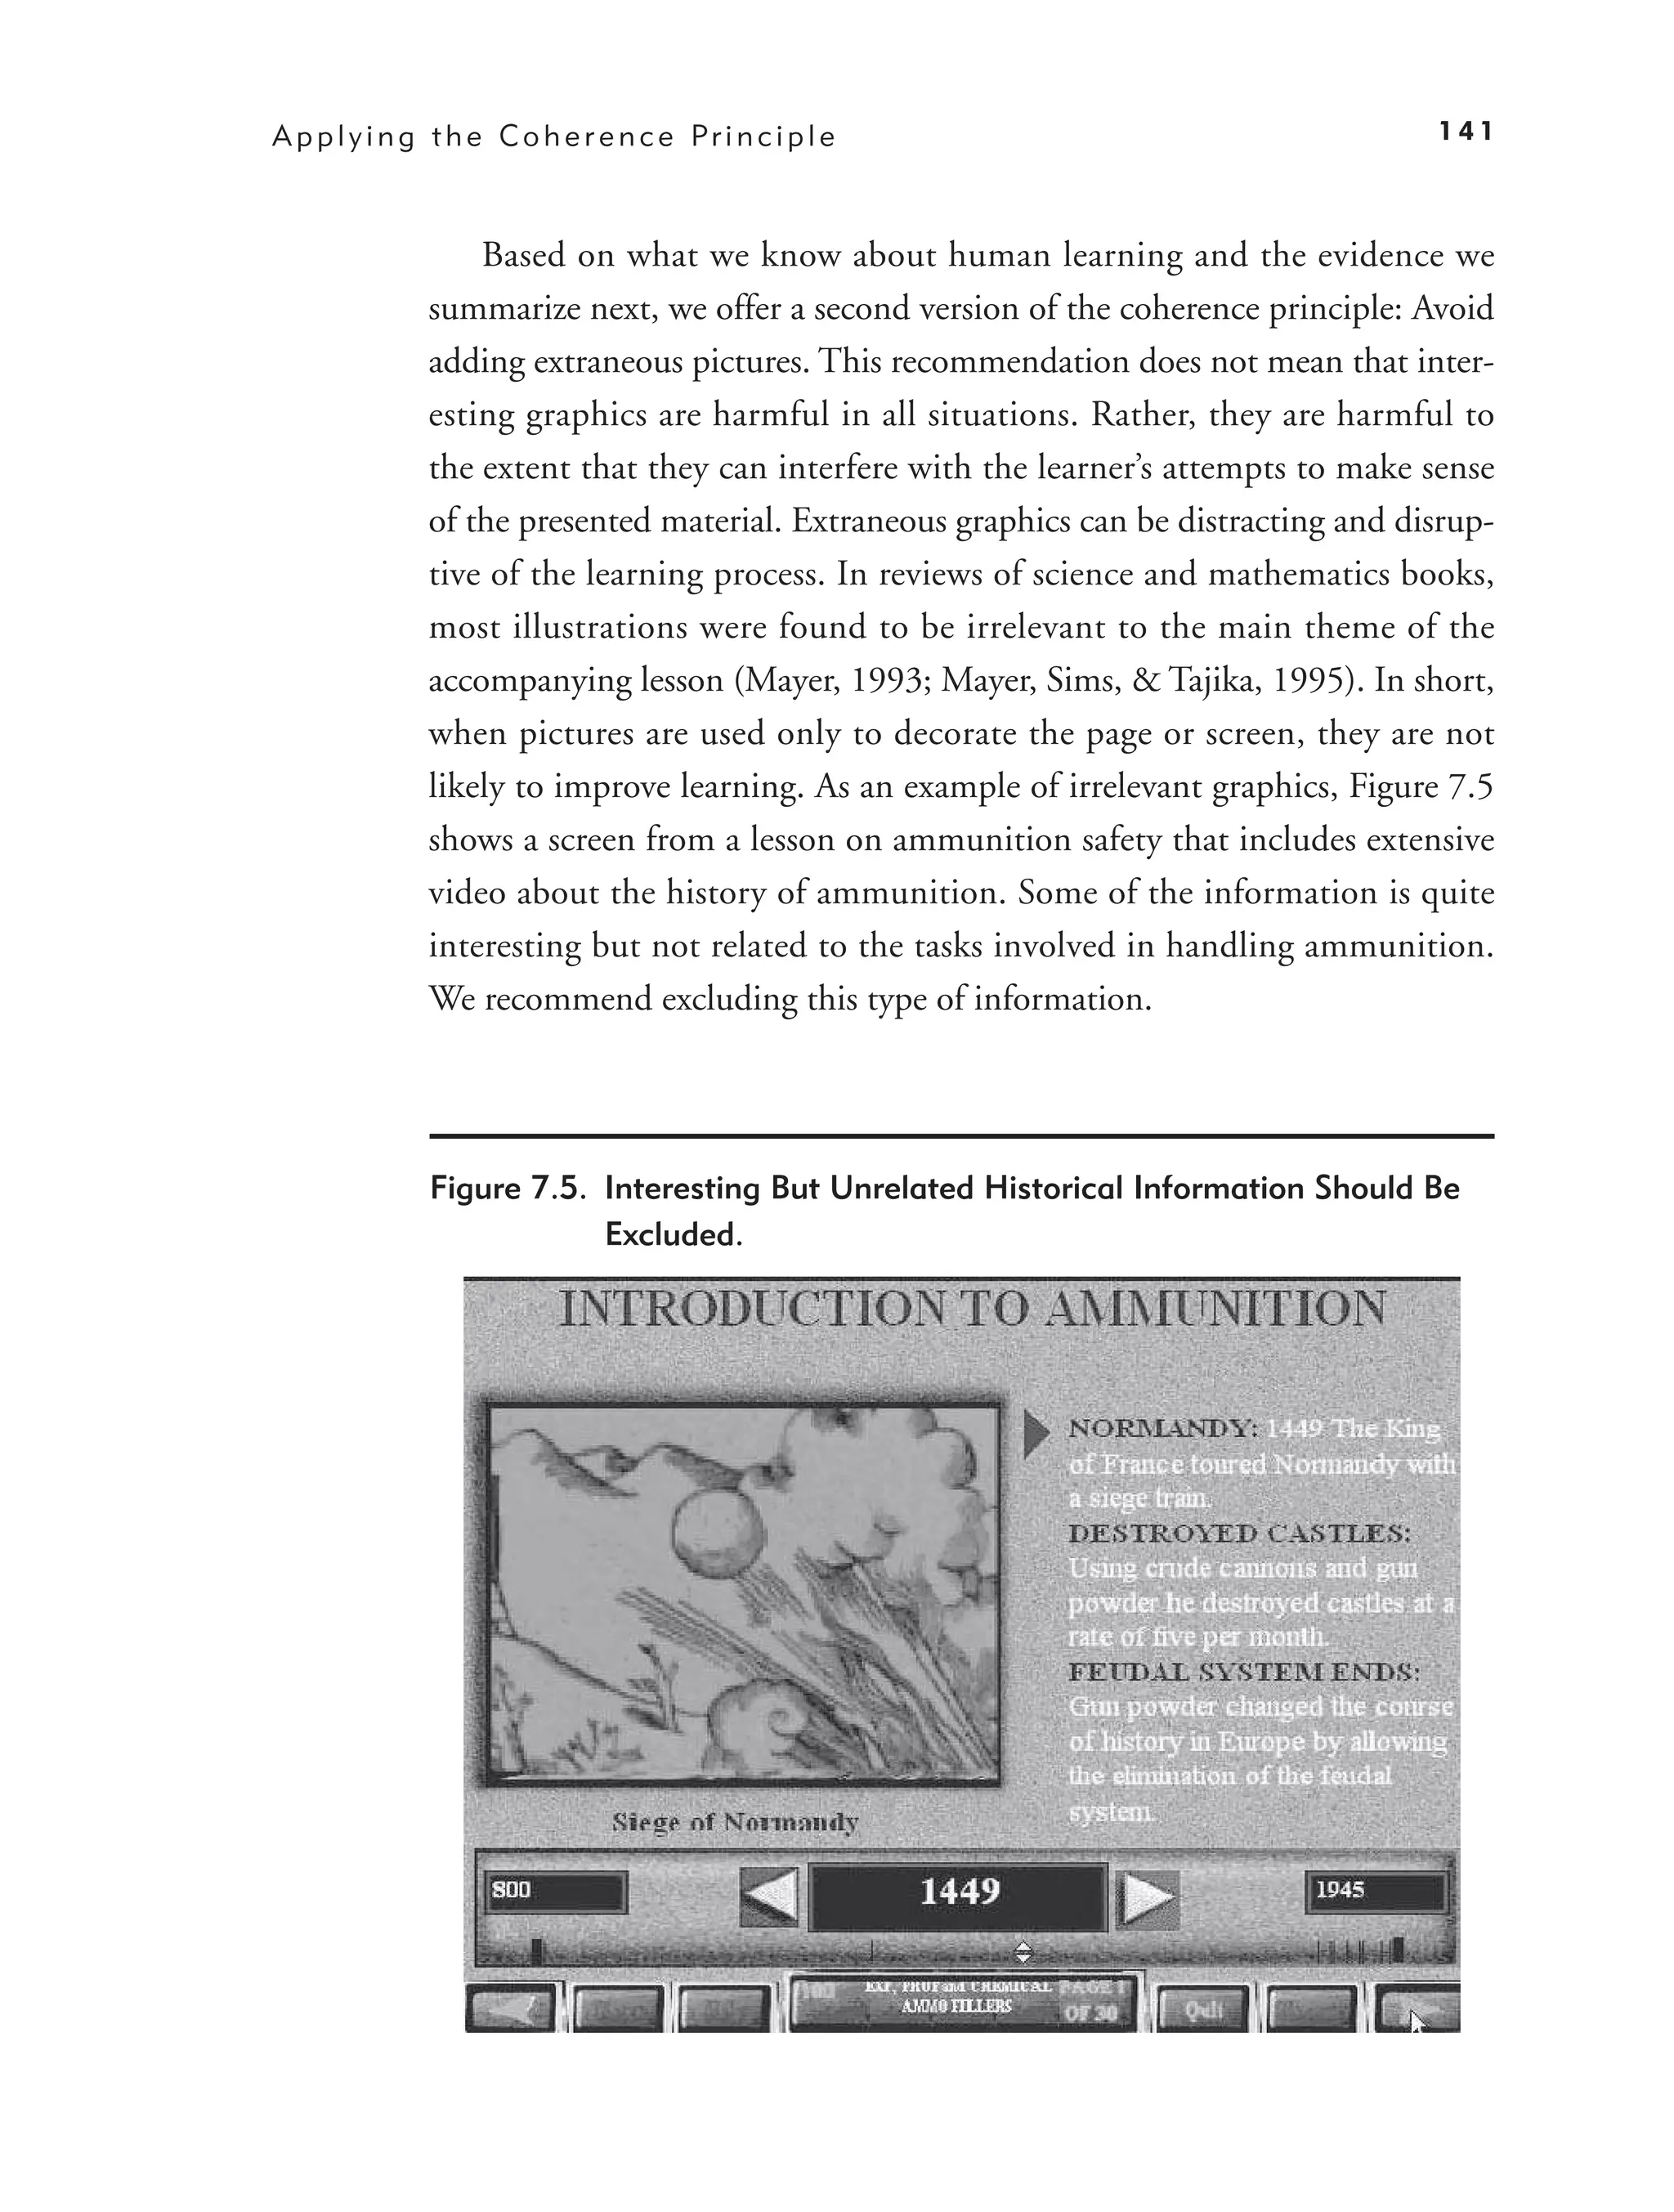
Coherence Principle 2: Avoid e-Lessons with Extraneous Graphics 140
Psychological Reasons to Avoid Extraneous Graphics in e-Learning 142
Evidence for Omitting Extraneous Graphics 143
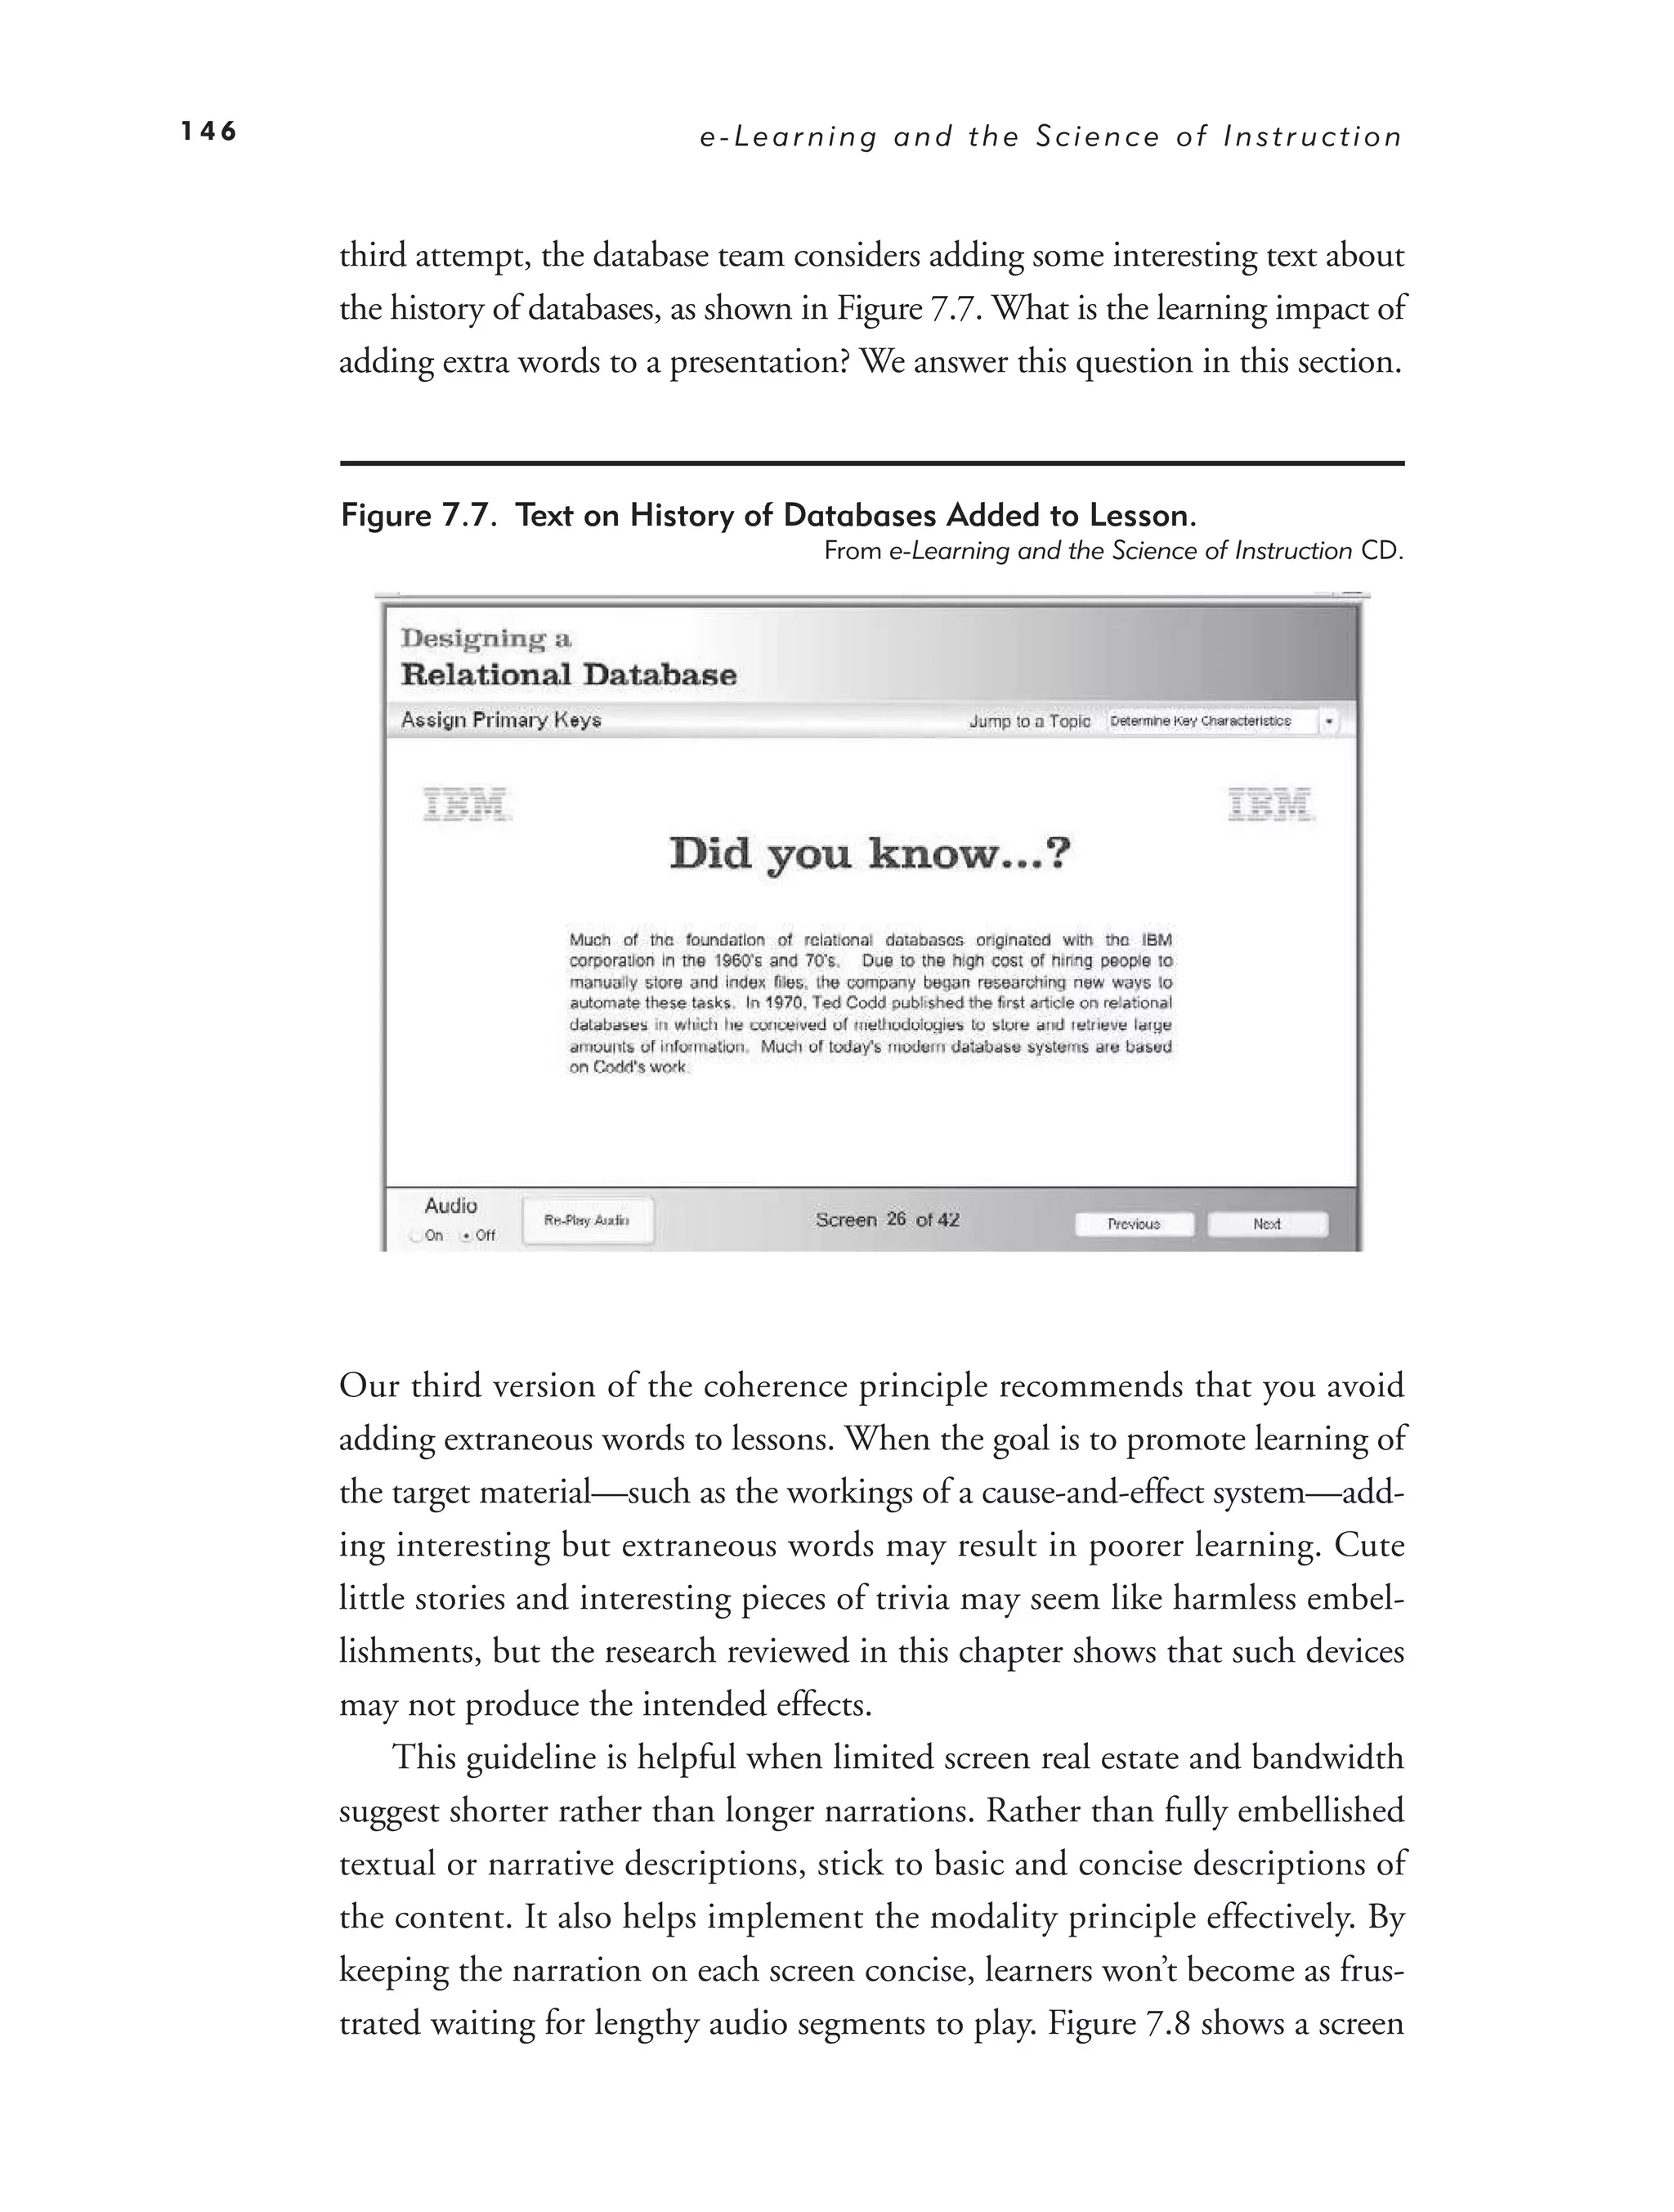
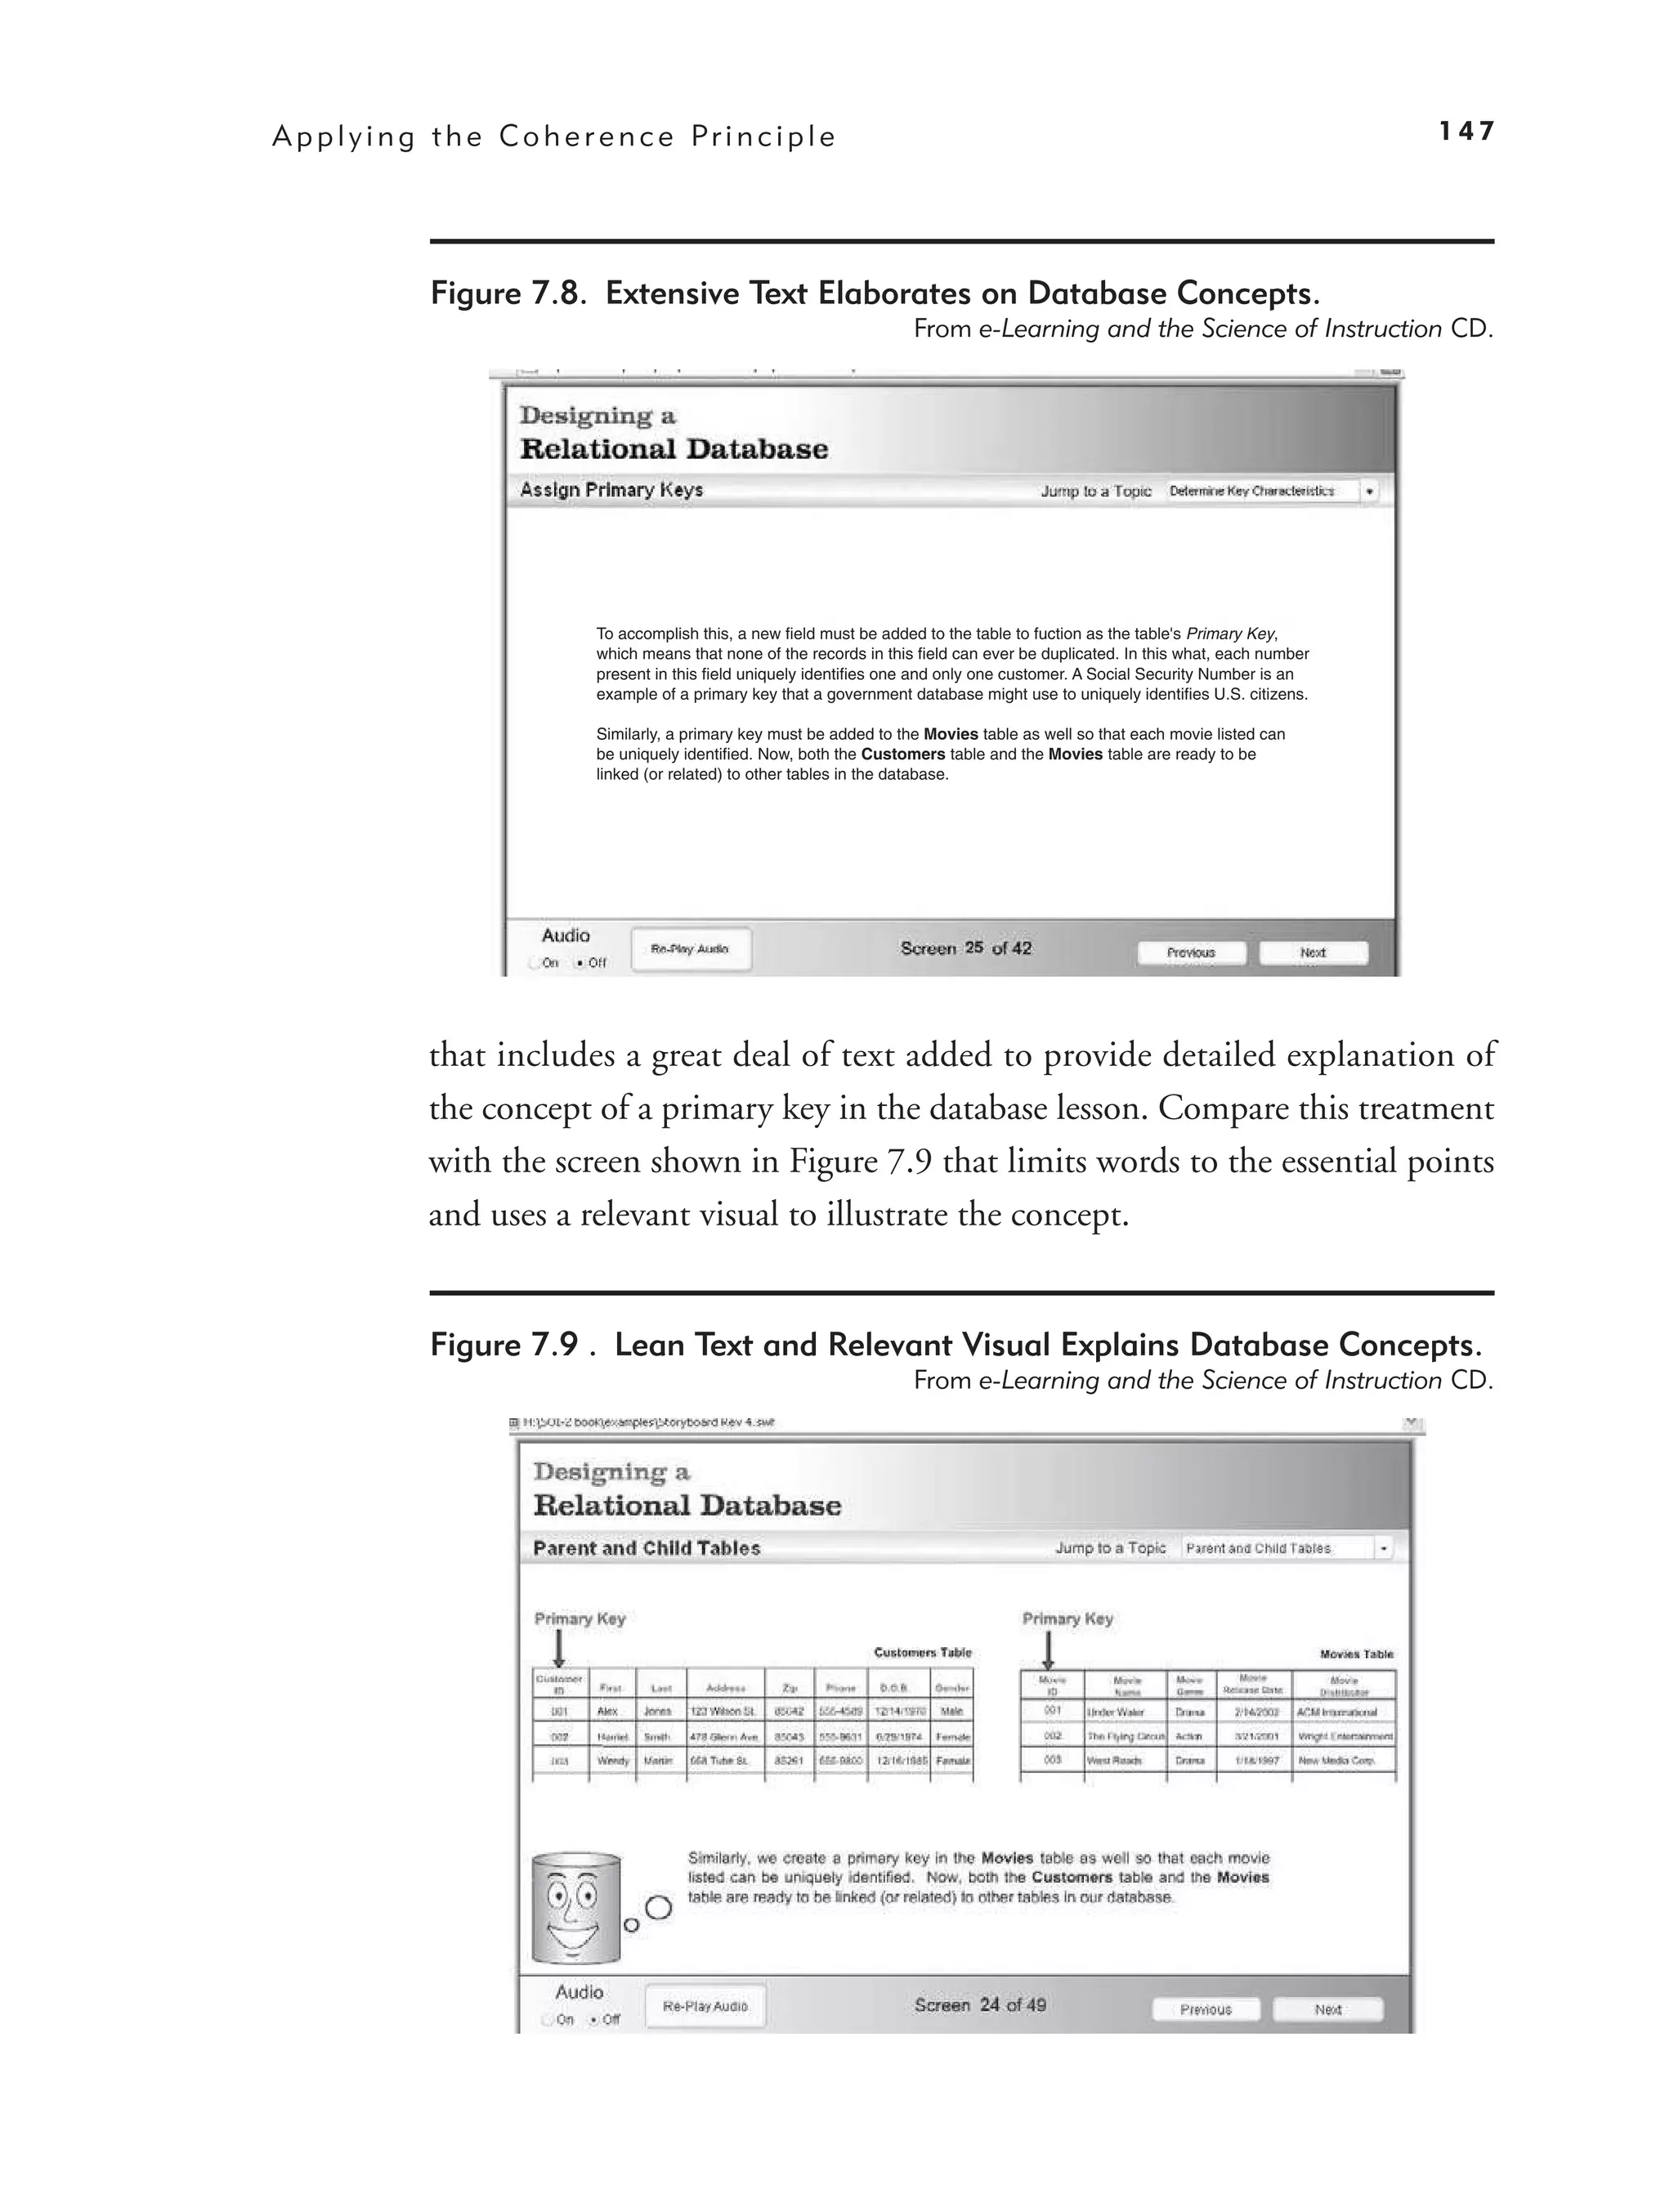
Coherence Principle 3: Avoid e-Lessons with Extraneous Words 145
11.
x Contents
Psychological Reasons to Avoid Extraneous Words in
e-Learning 148
Evidence for Omitting Extraneous Words Added for
Interest 148
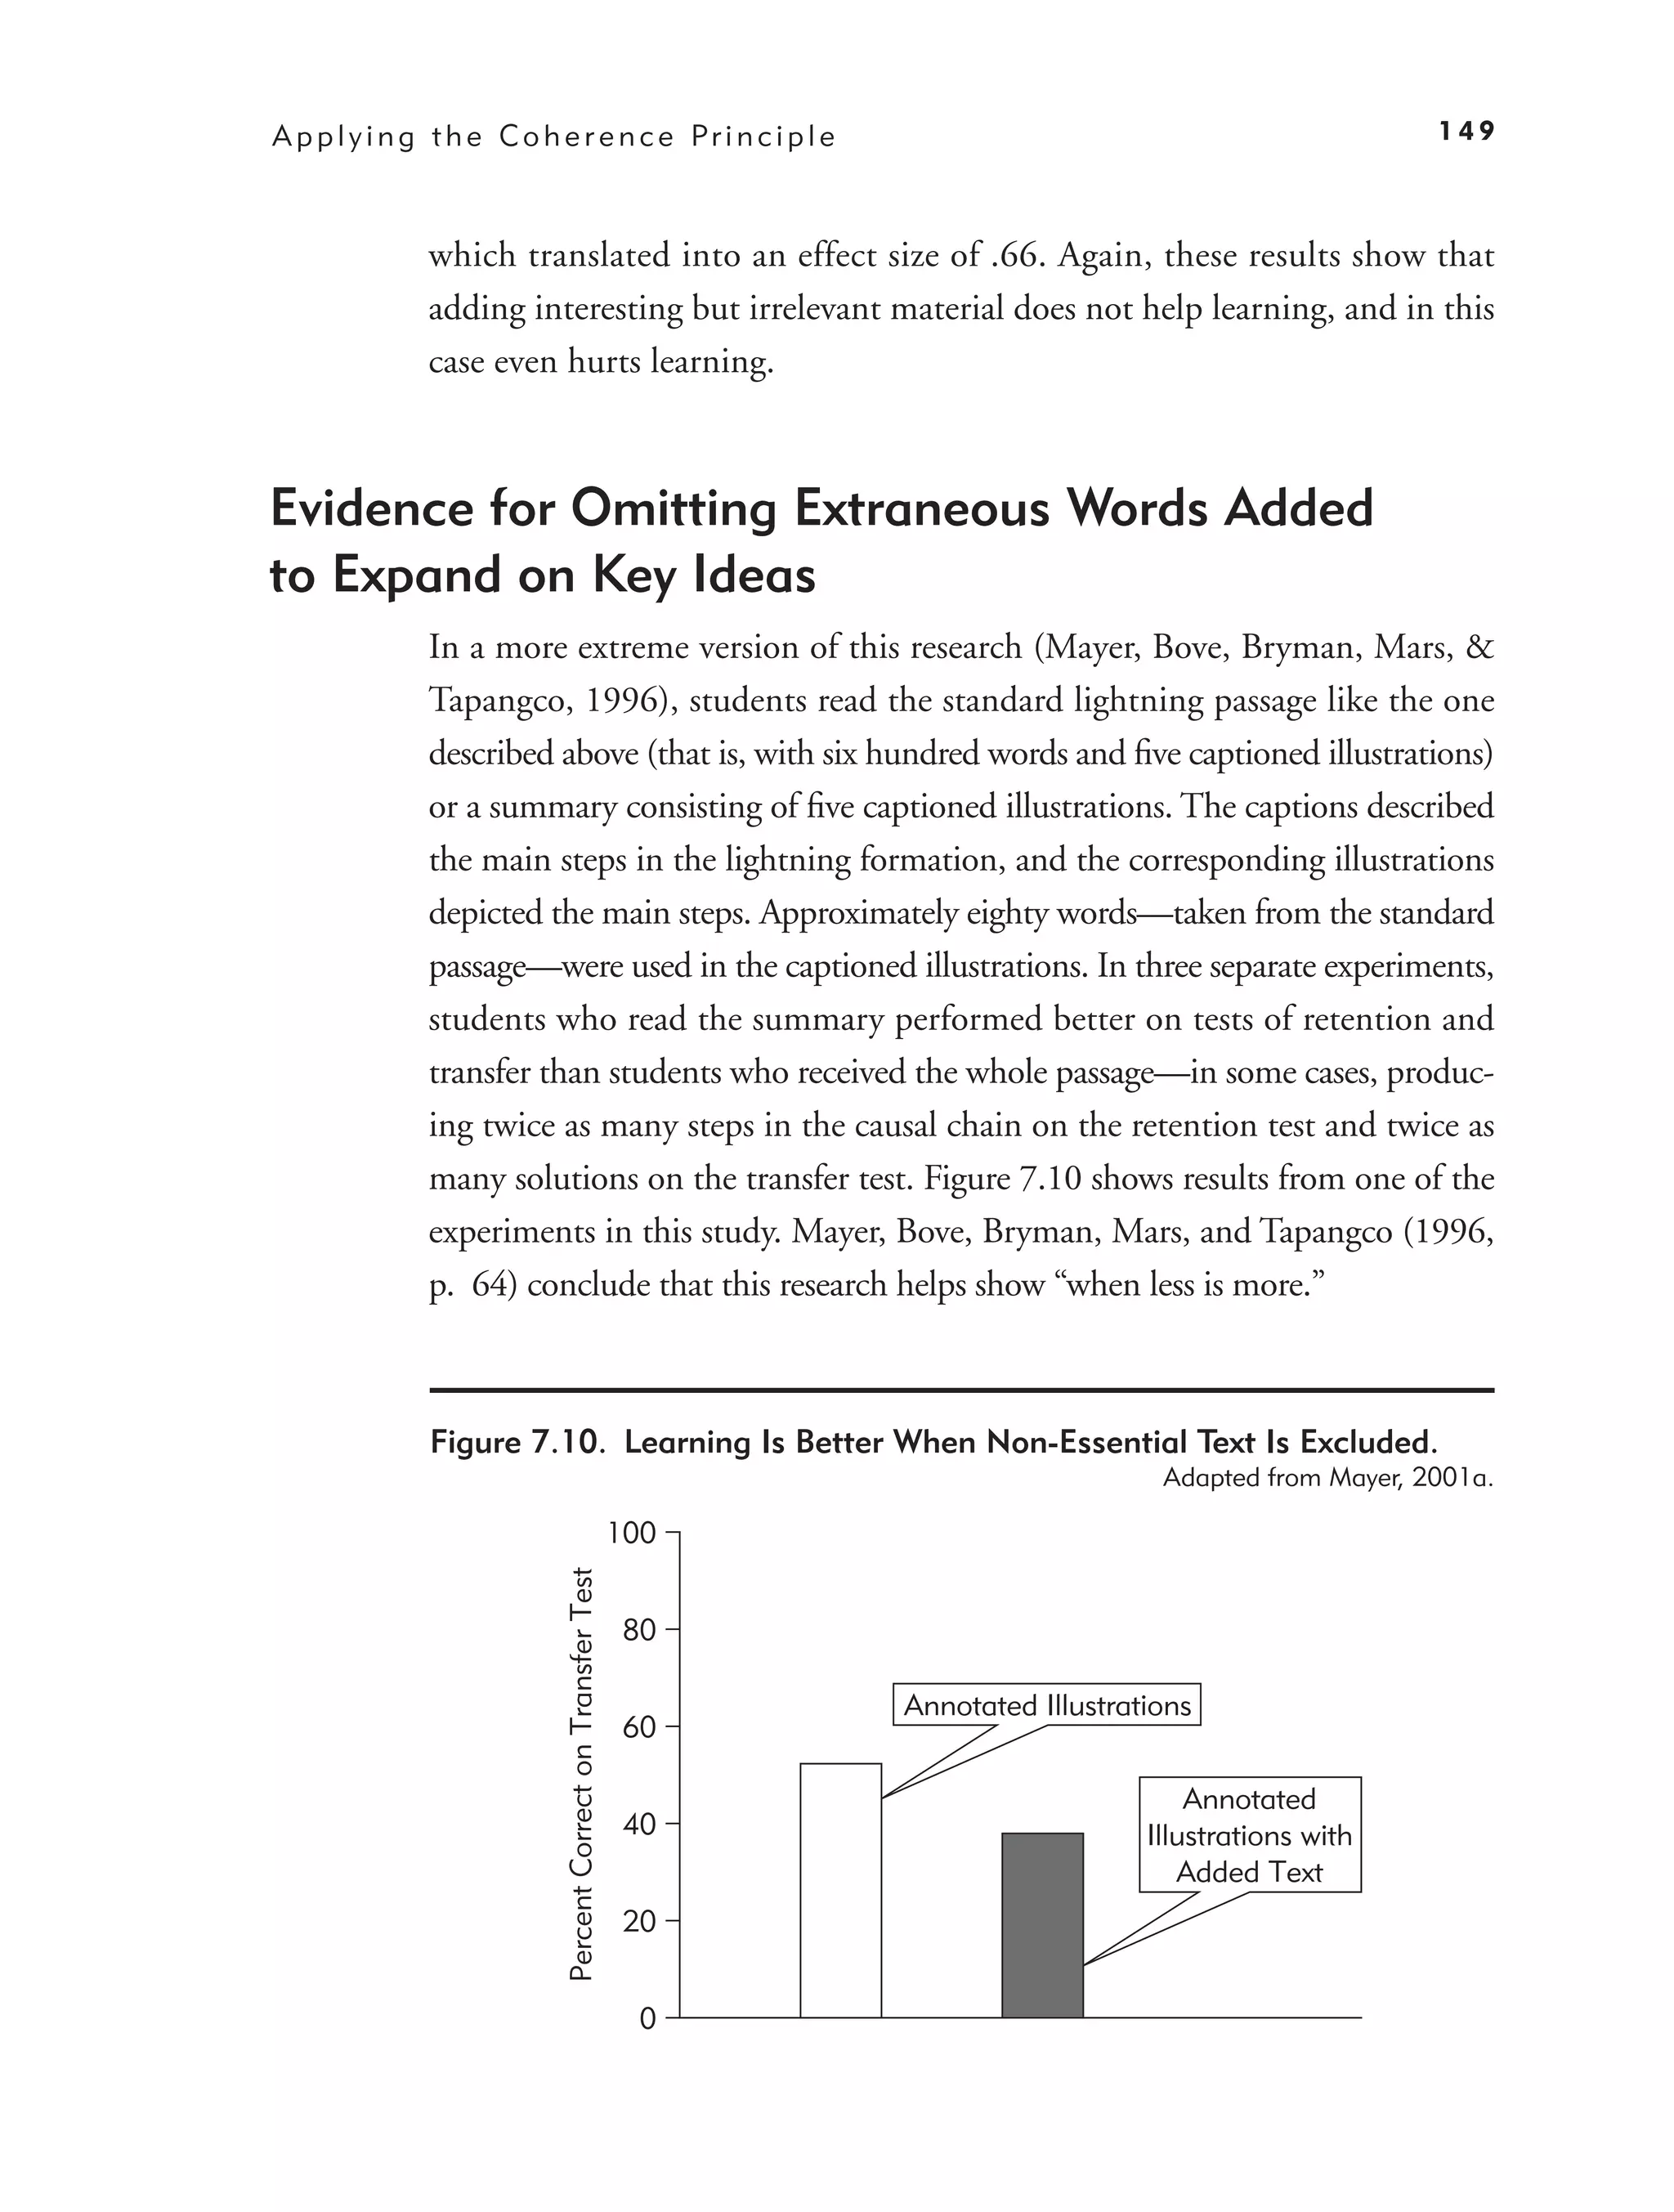
Evidence for Omitting Extraneous Words Added to Expand
on Key Ideas 149
Evidence for Omitting Extraneous Words Added for Technical
Depth 150
What We Don’t Know About Coherence 150
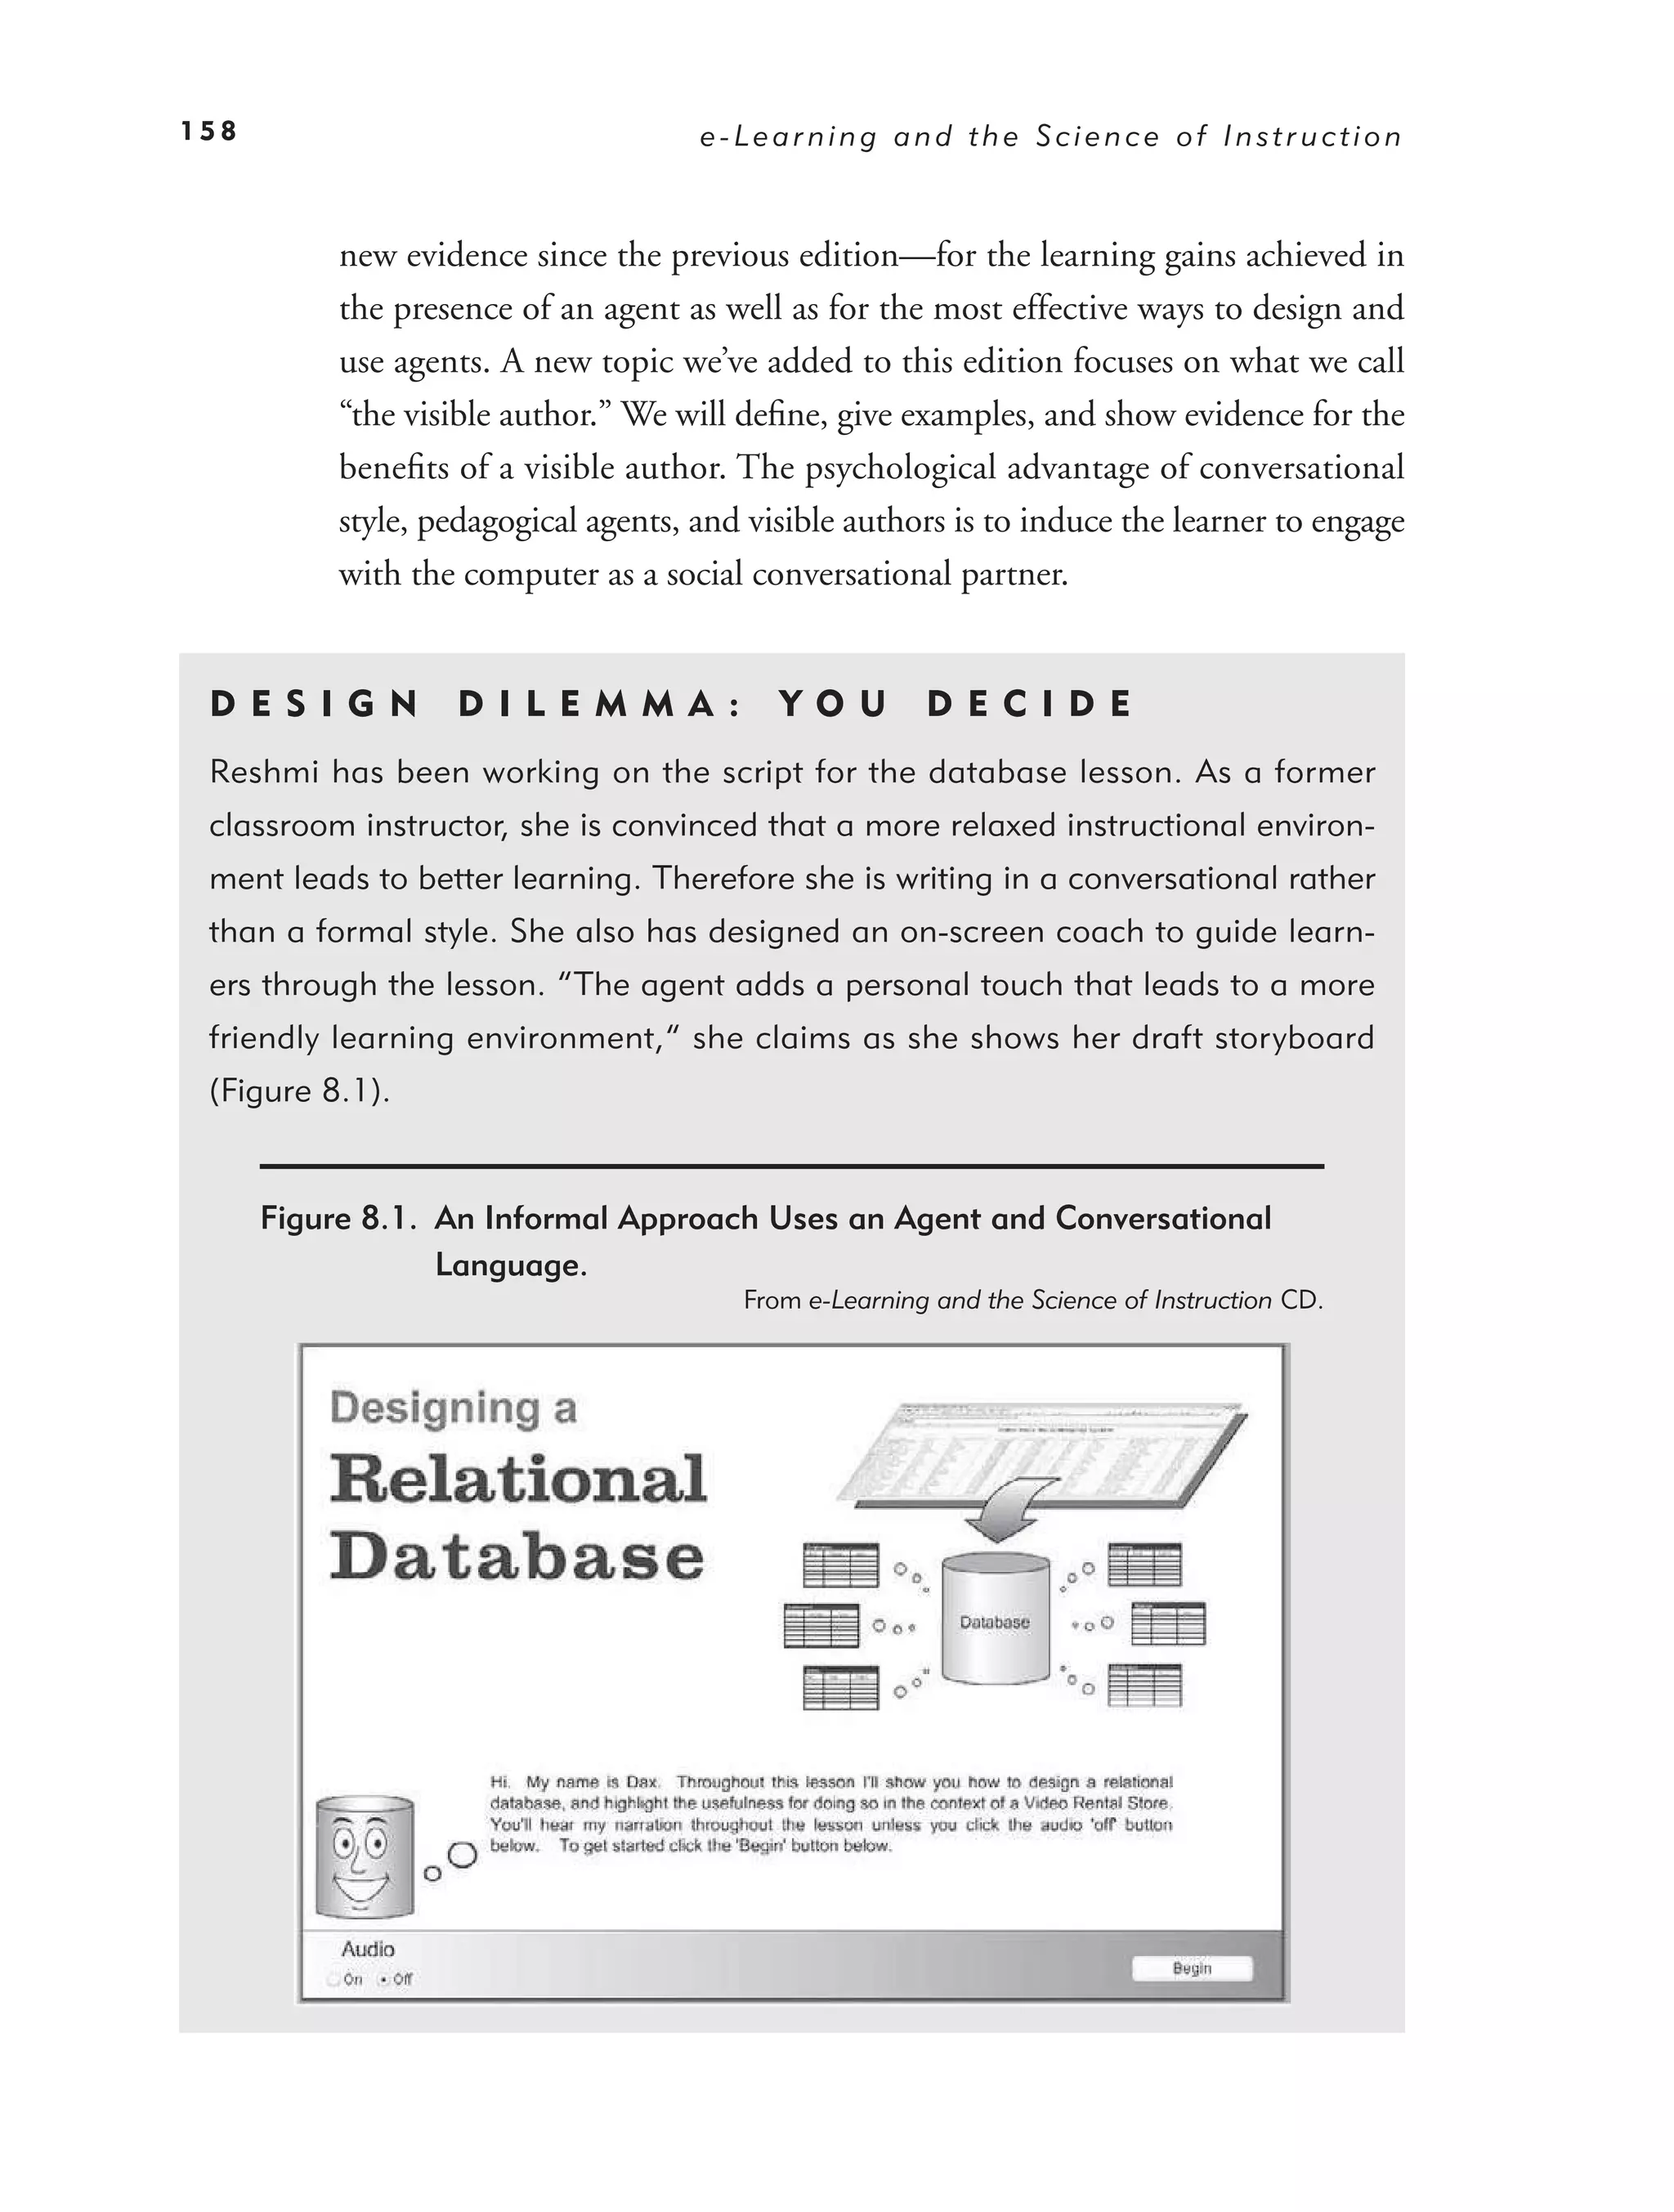
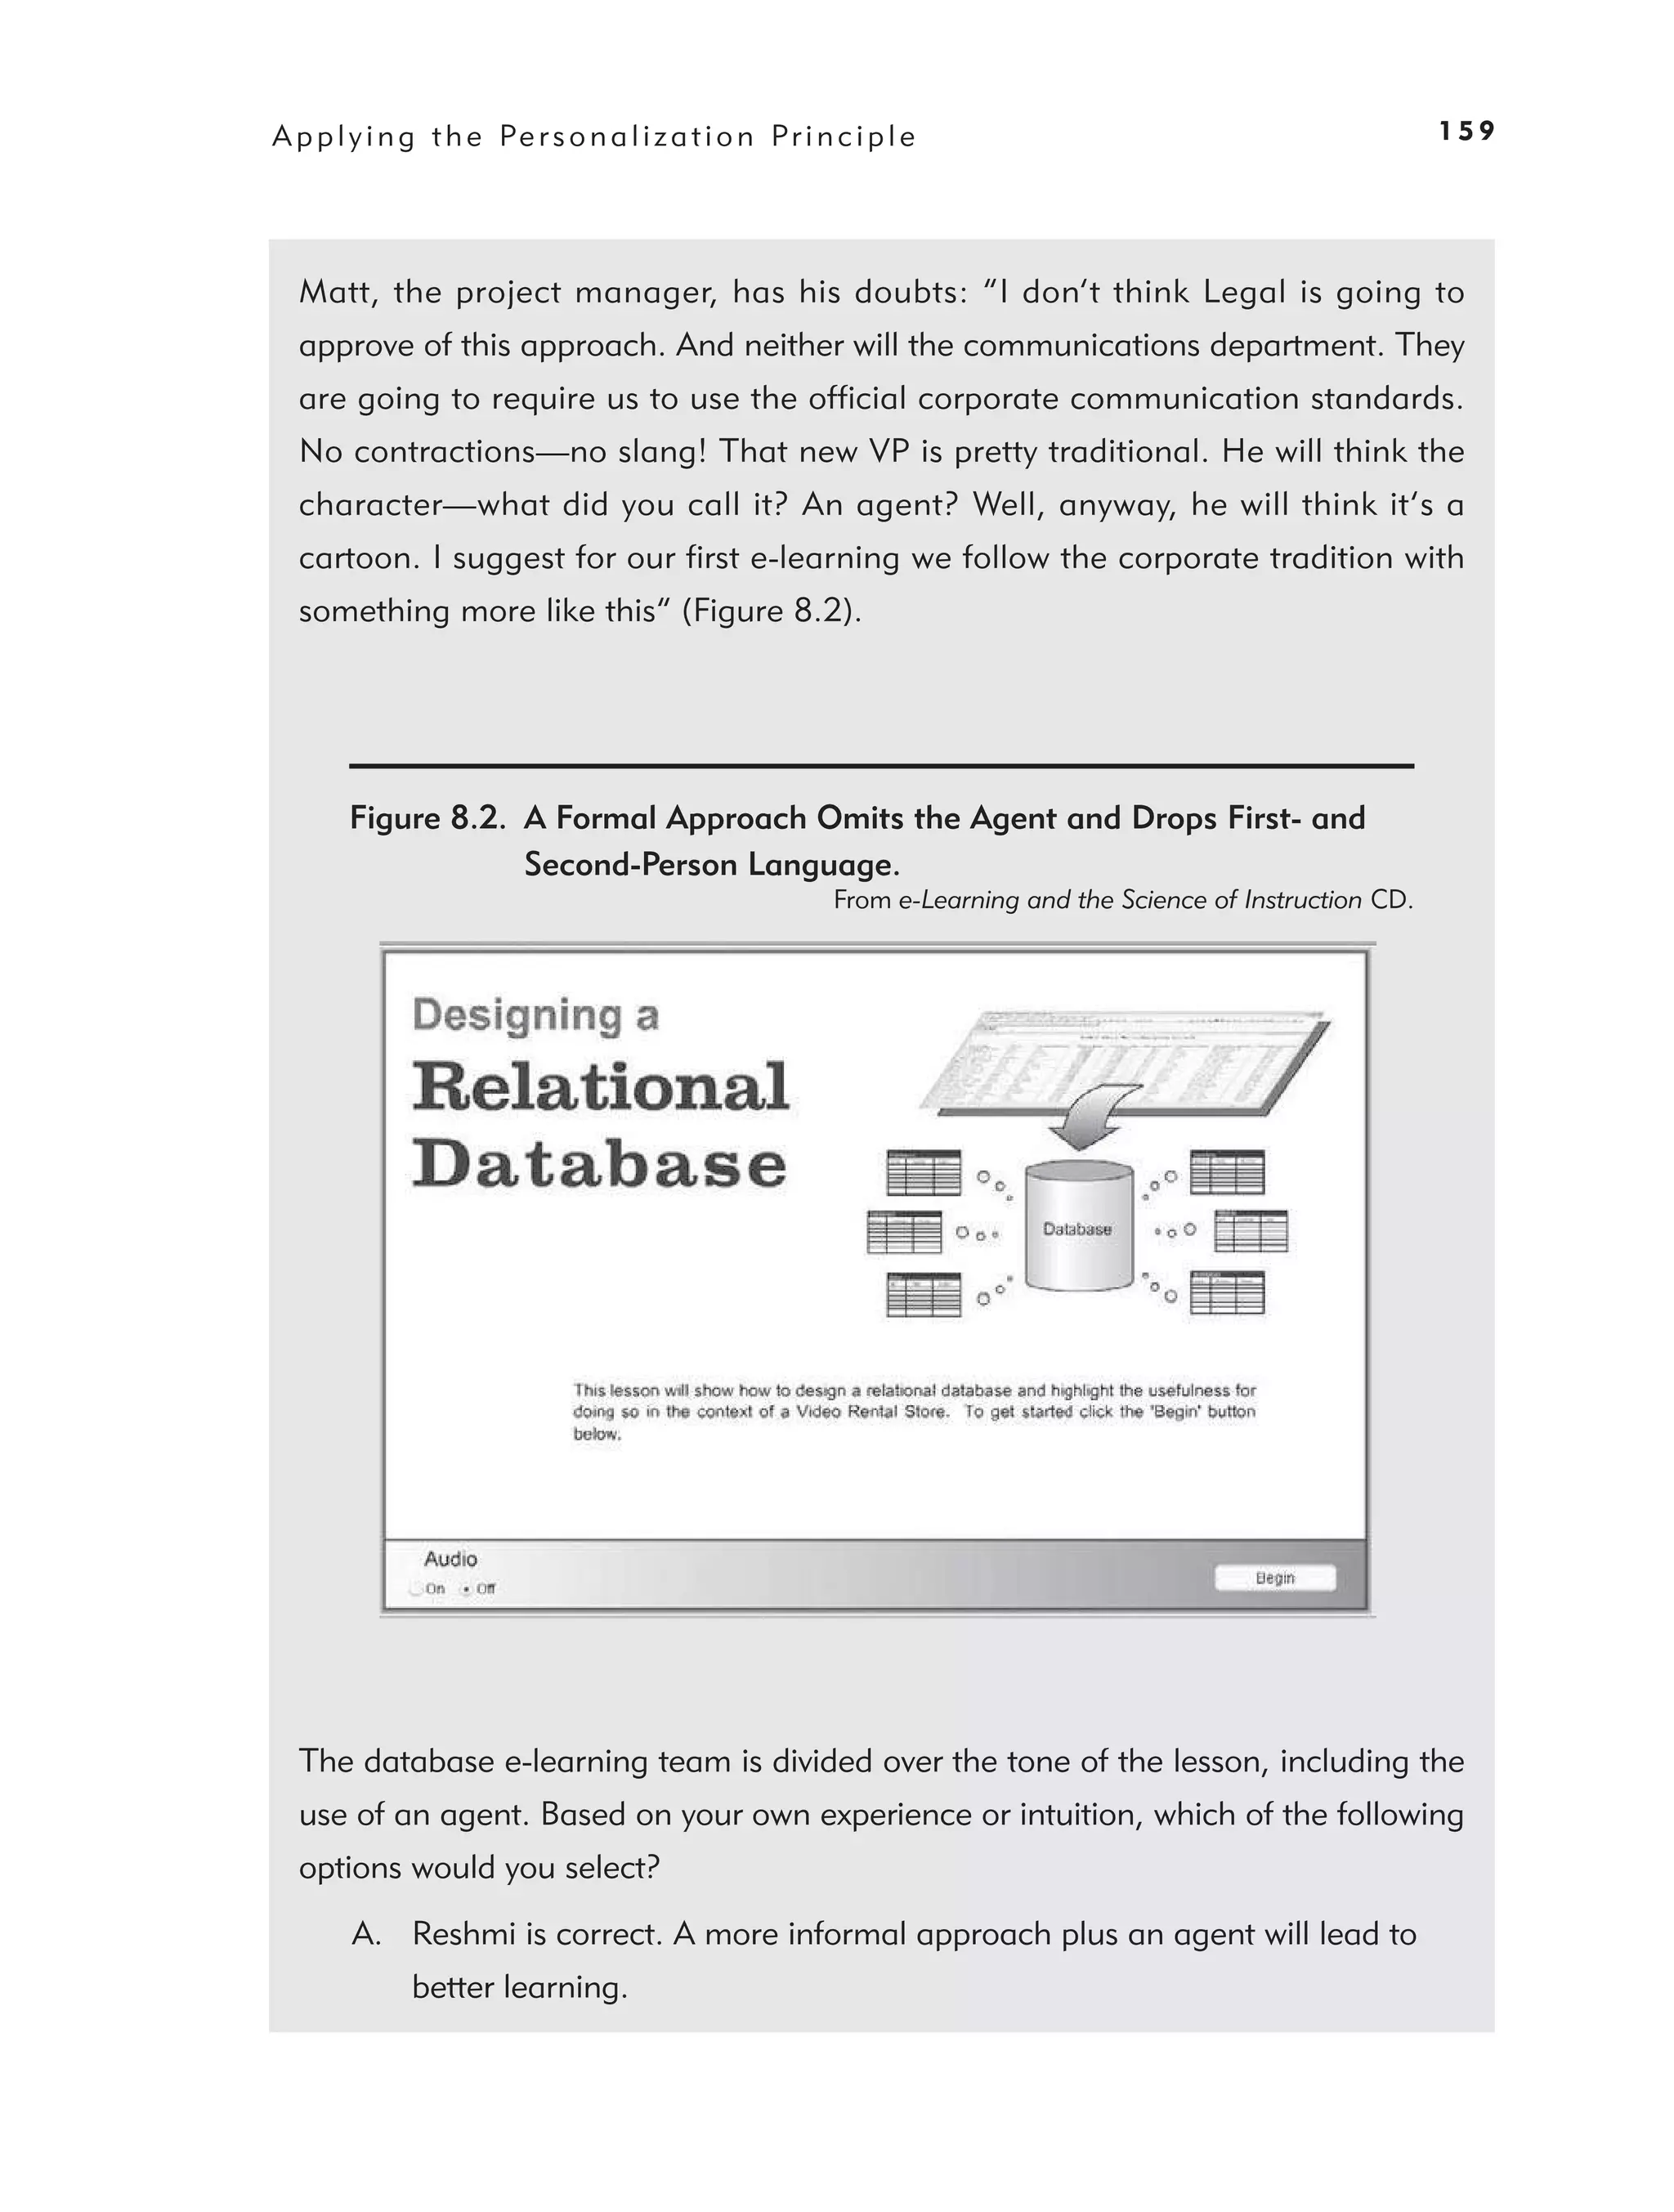
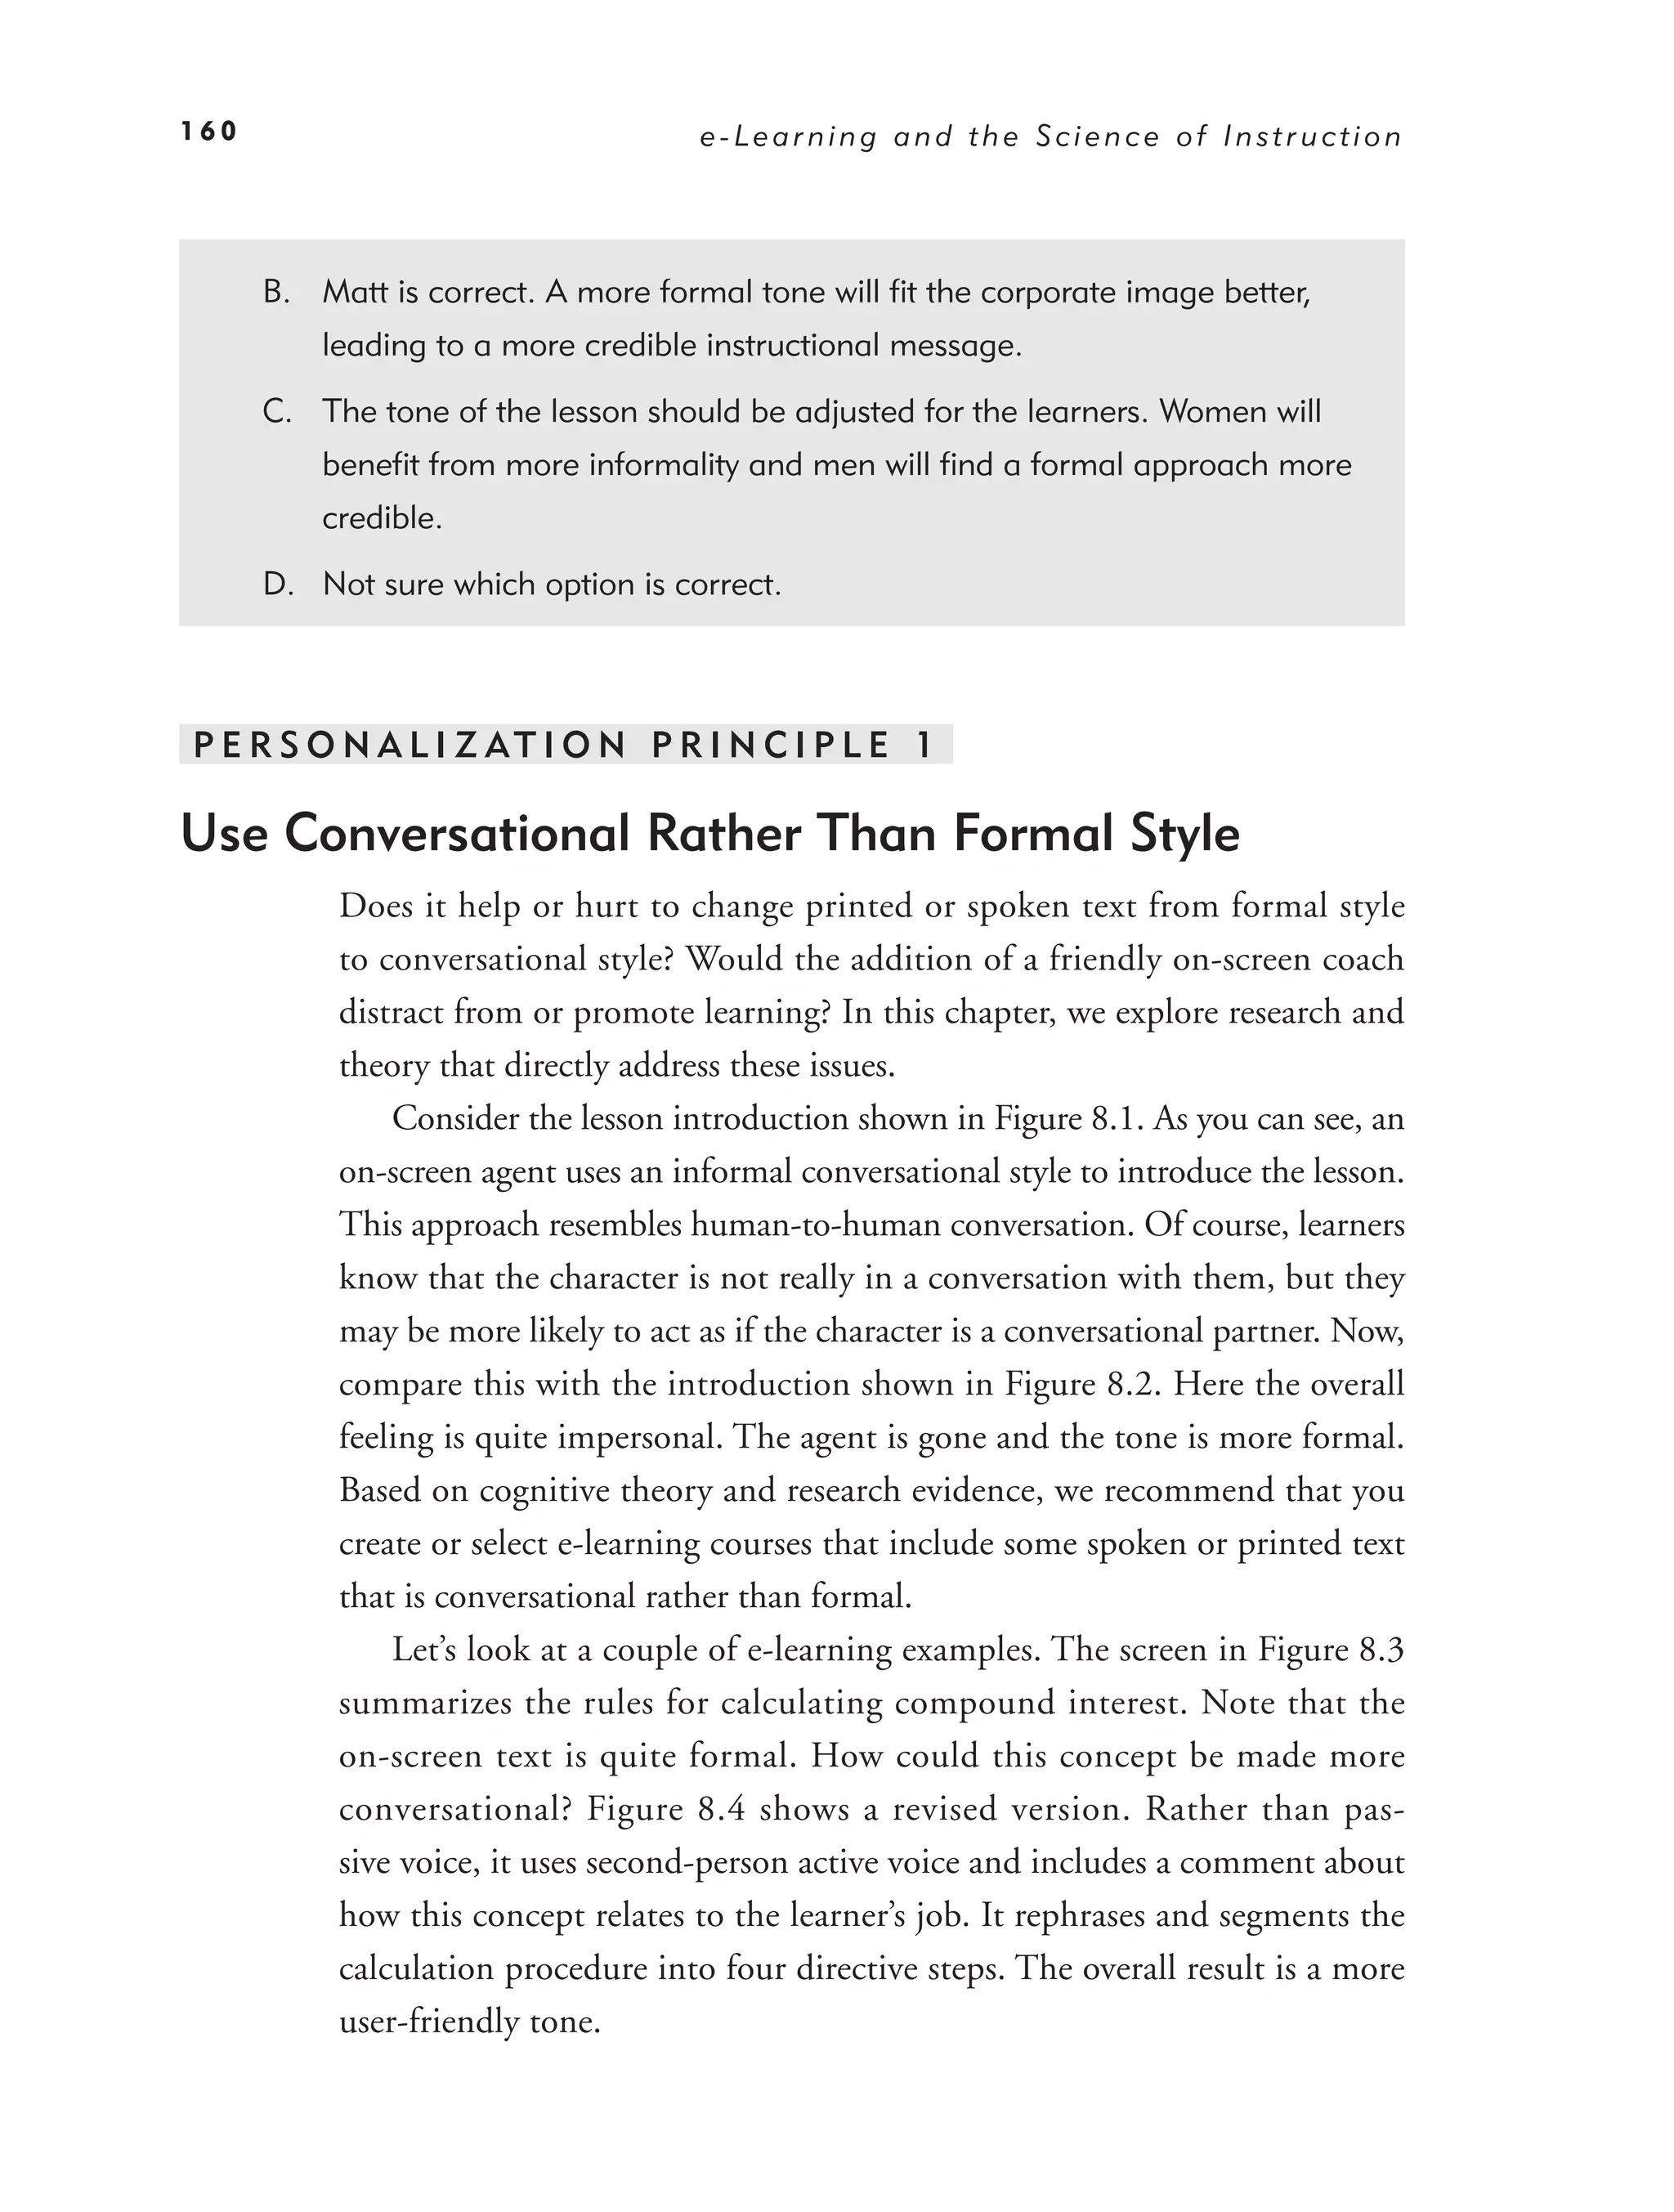
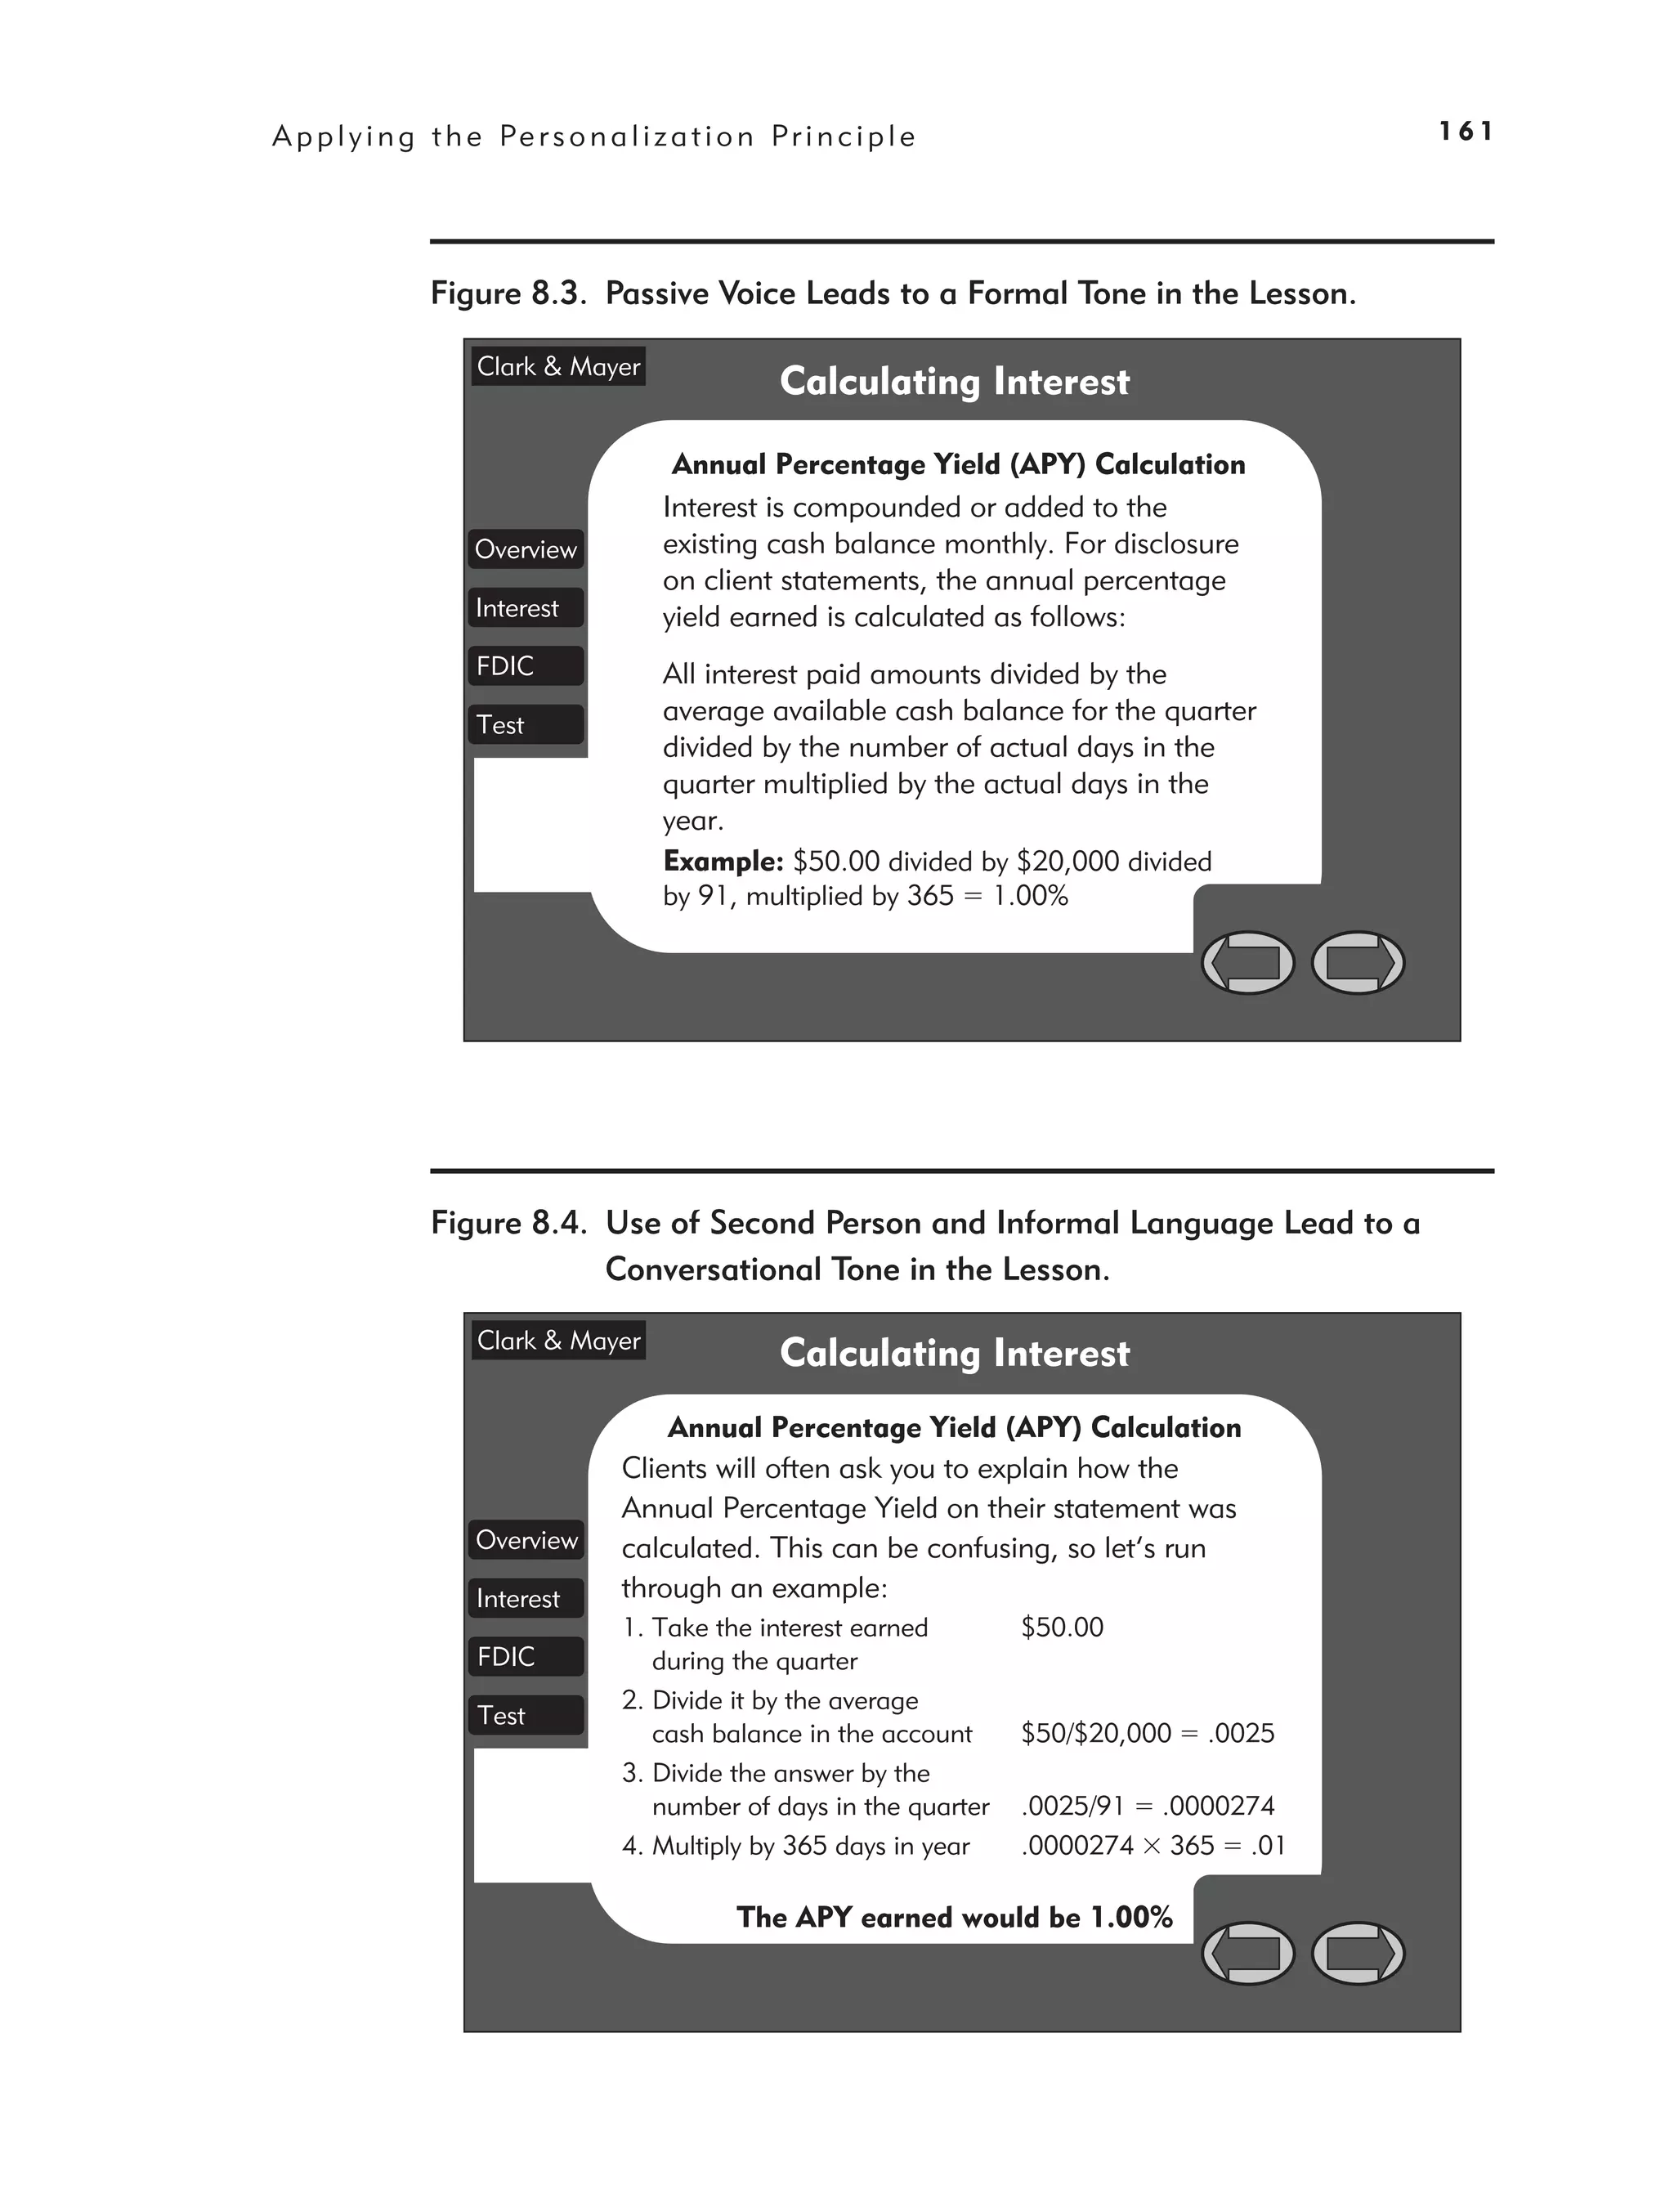
8. Applying the Personalization Principle: Use Conversational
Style and Virtual Coaches 157
Personalization Principle 1: Use Conversational Rather Than Formal
Style 160
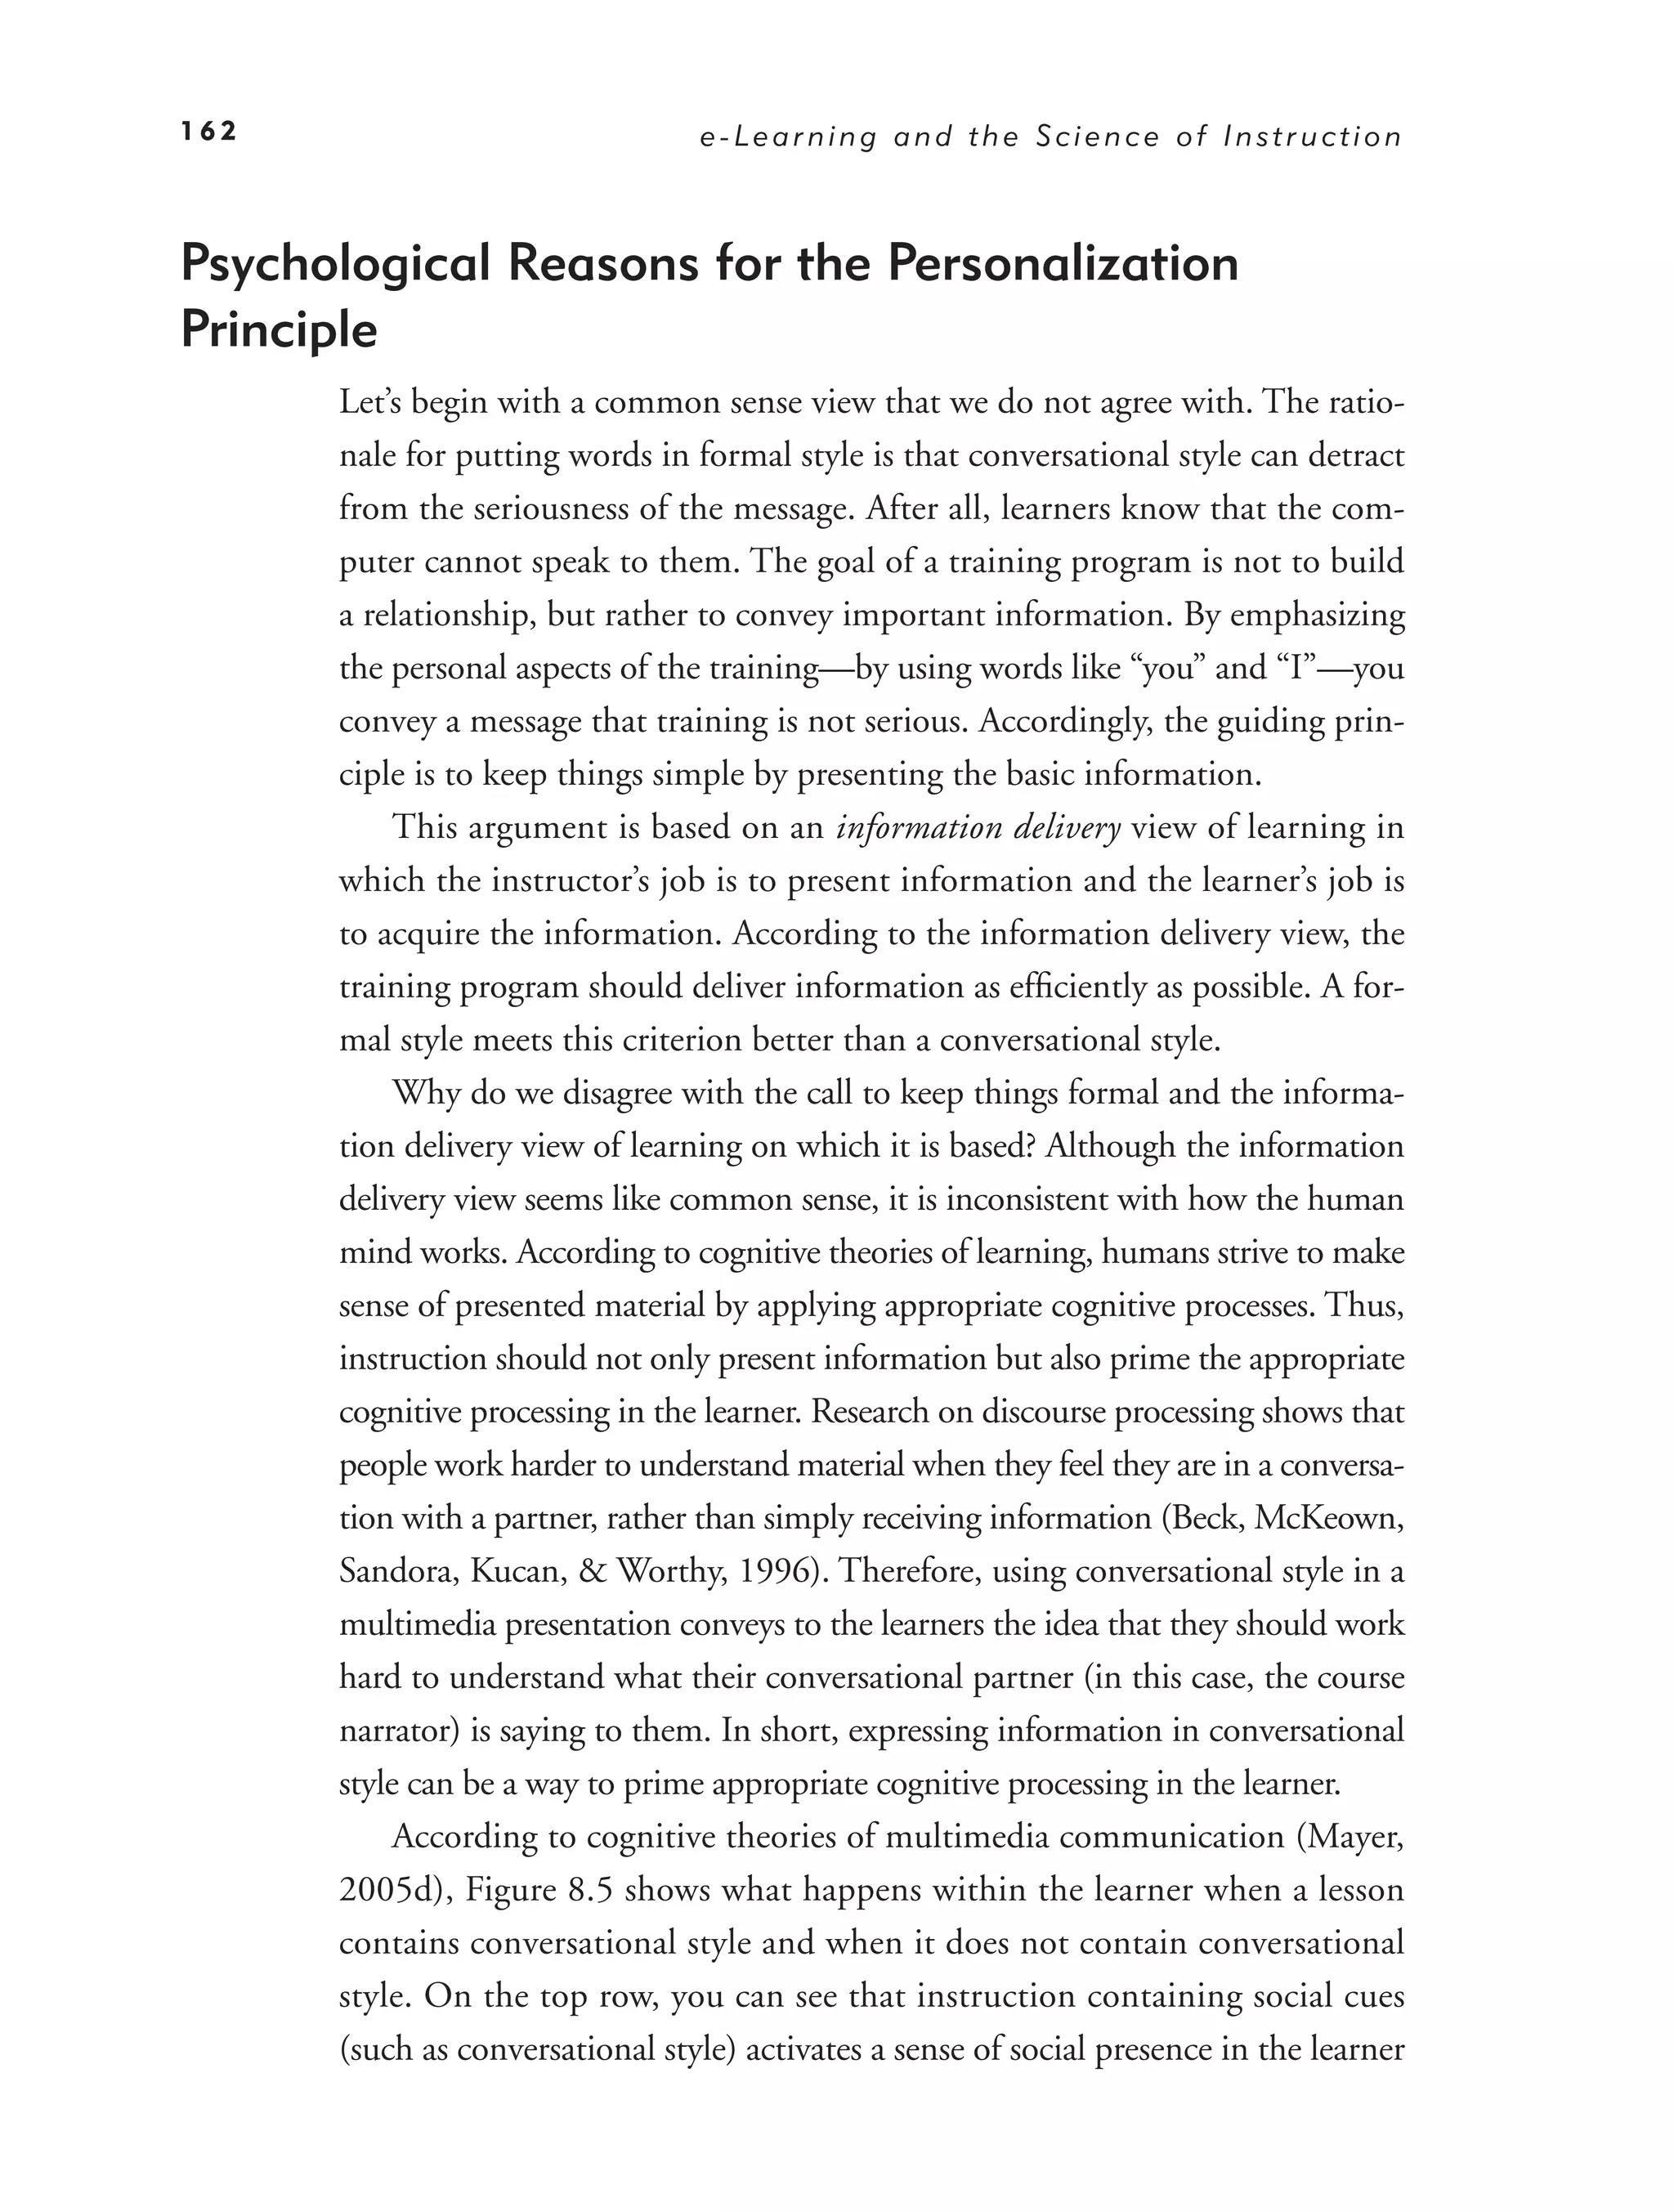
Psychological Reasons for the Personalization Principle 162
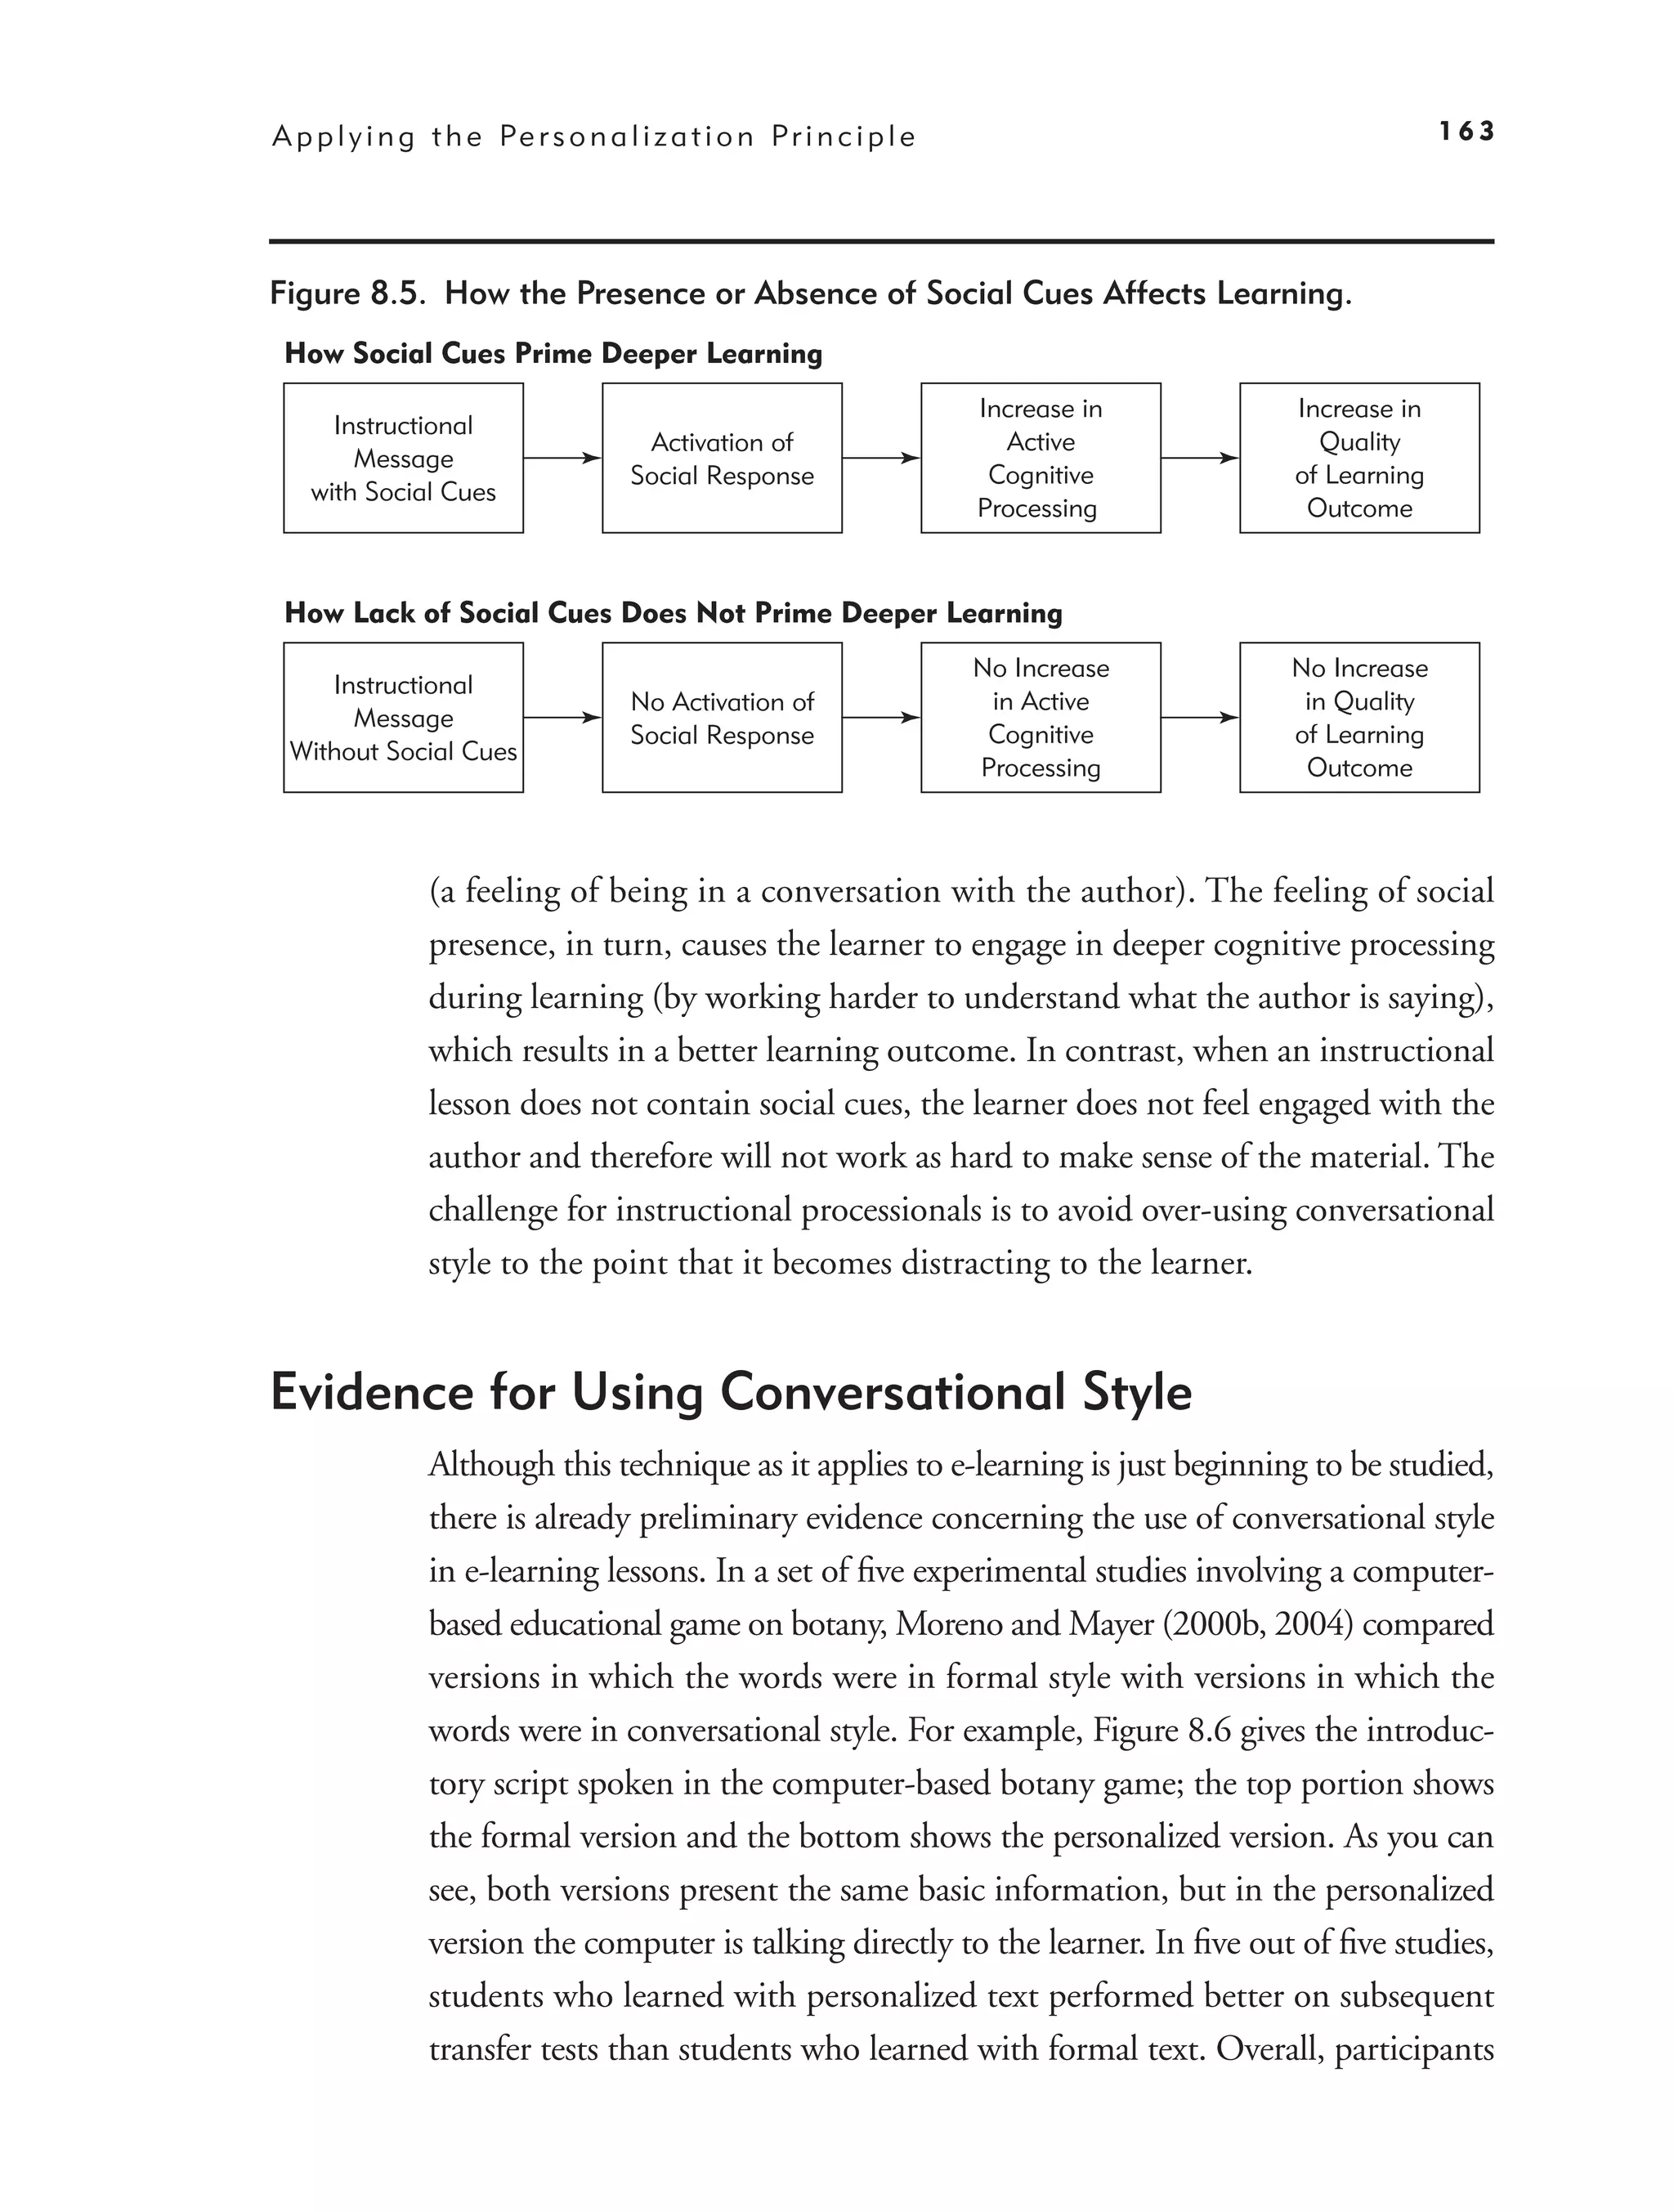
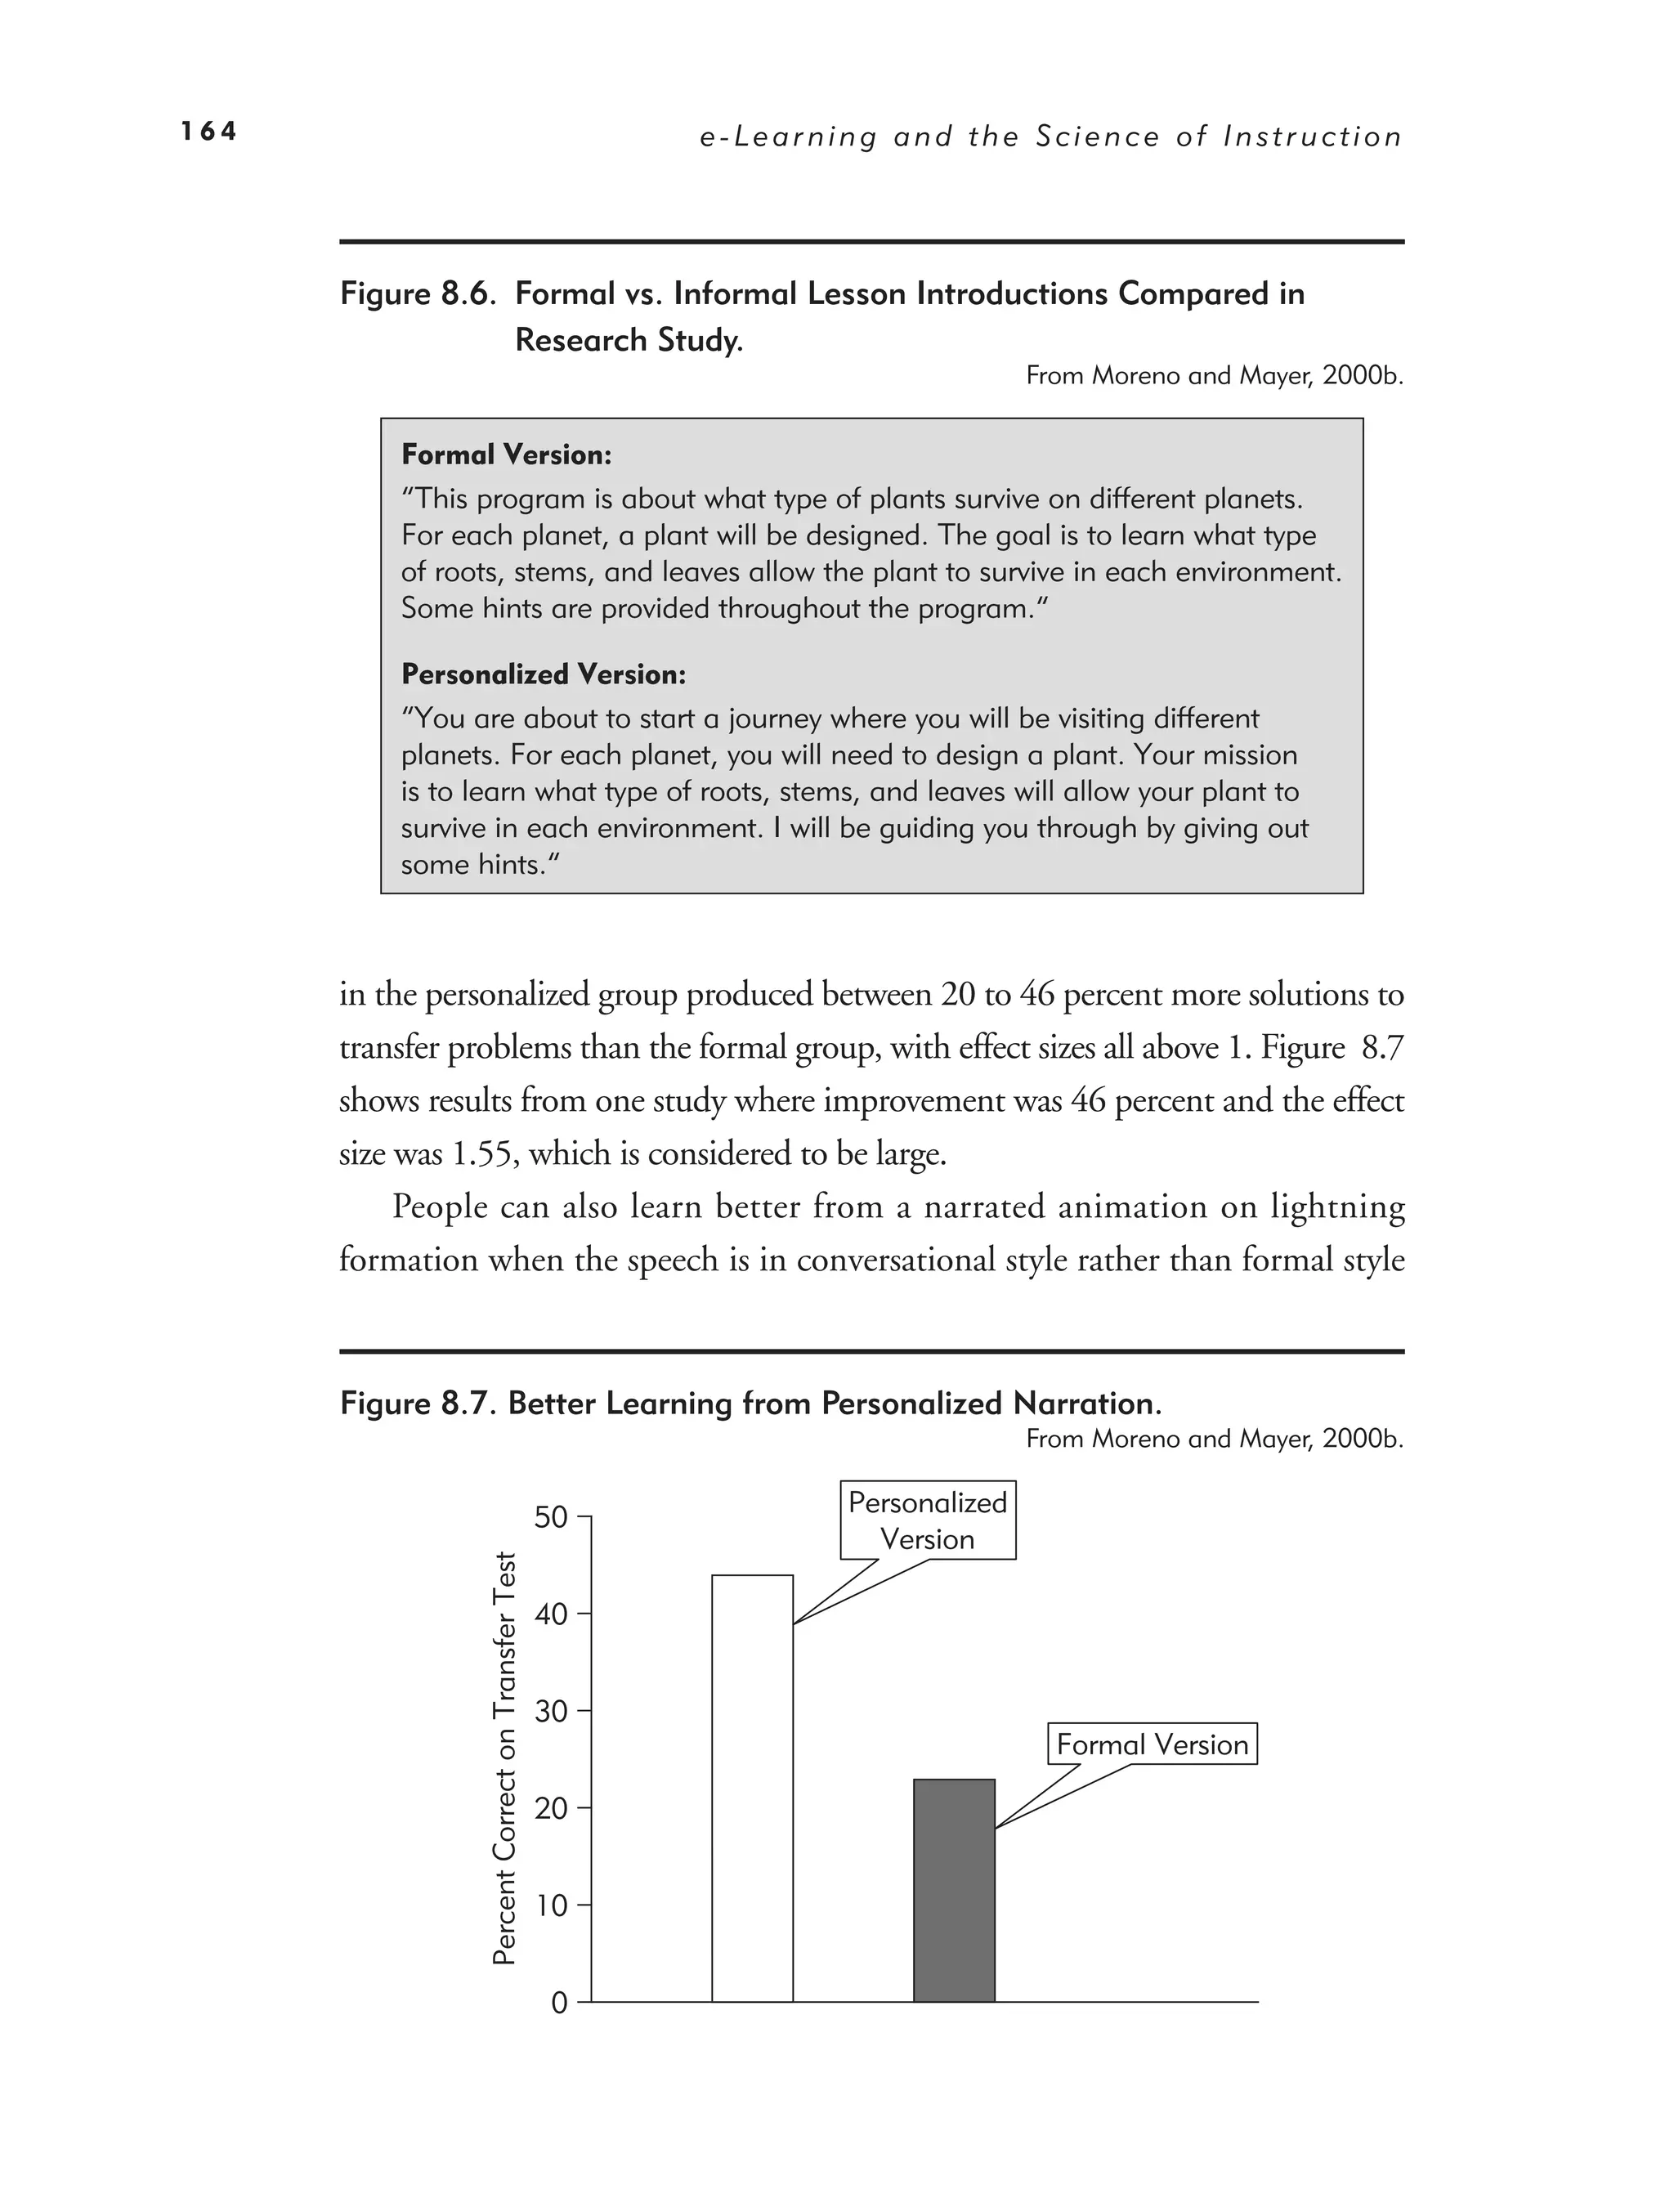
Evidence for Using Conversational Style 163
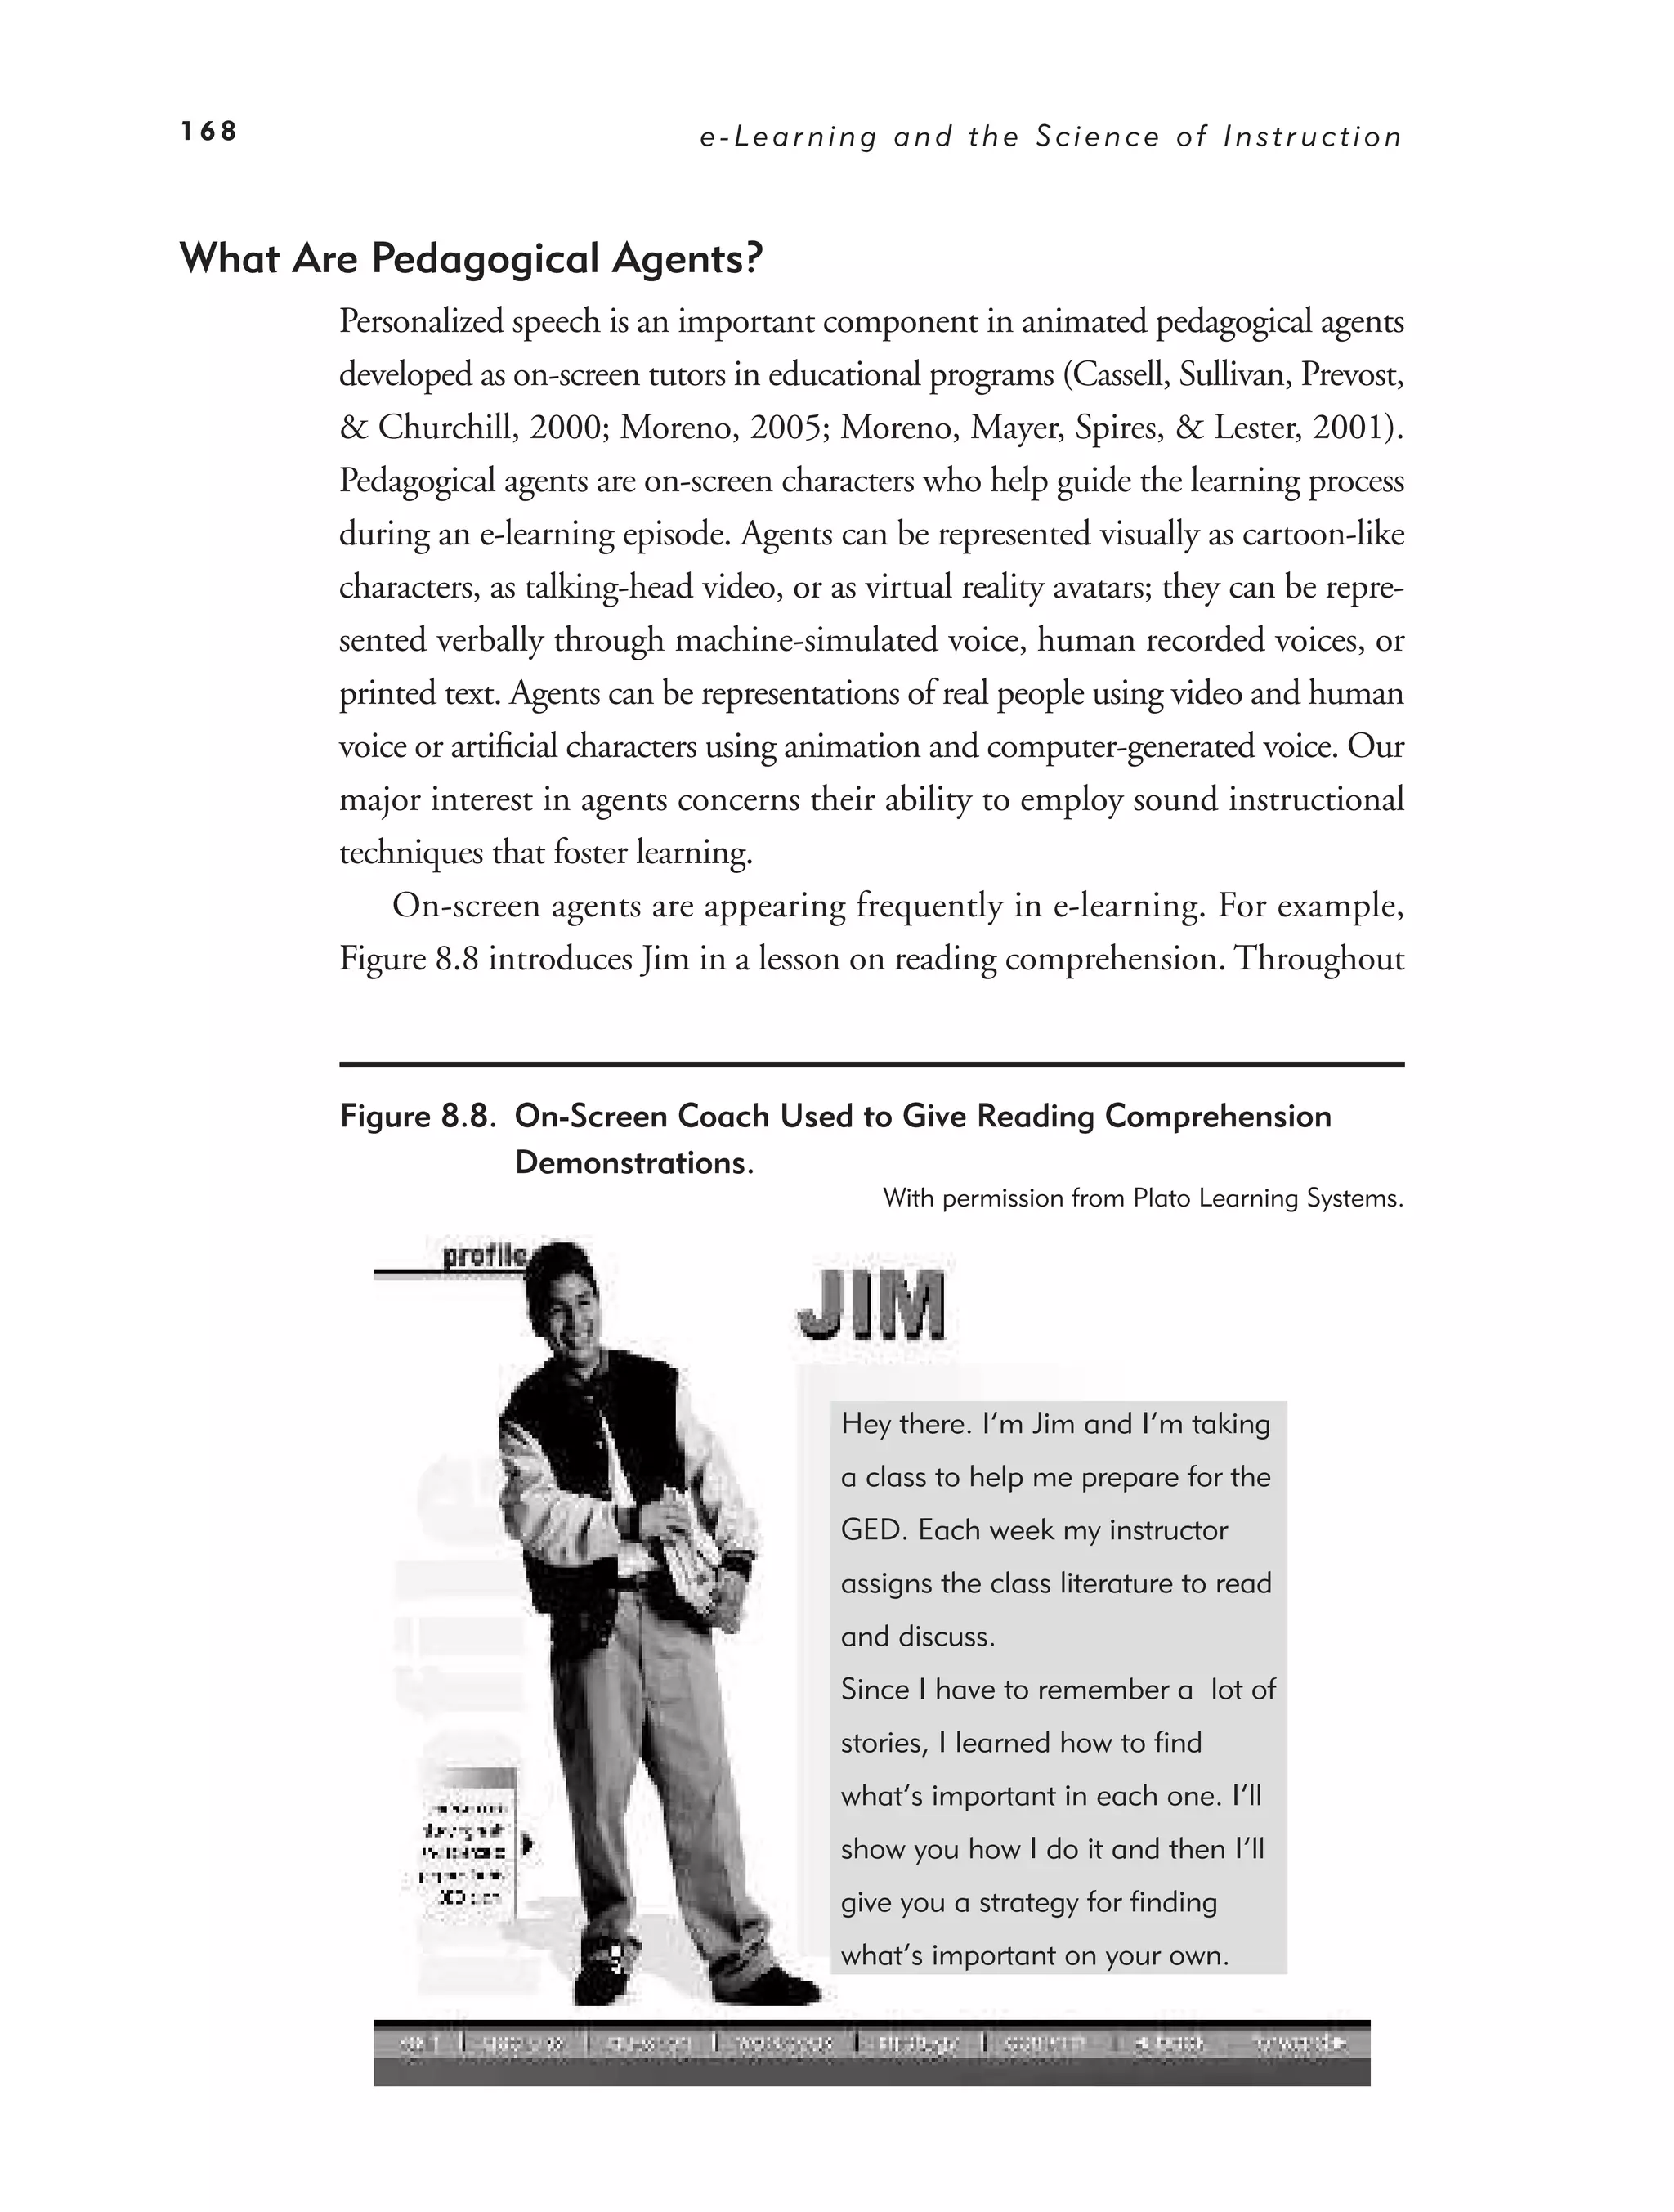
Promote Personalization Through Voice Quality 166
Promote Personalization Through Polite Speech 166
Personalization Principle 2: Use Effective On-Screen Coaches to
Promote Learning 167
Personalization Principle 3: Make the Author Visible to Promote
Learning 173
Psychological Reasons for Using a Visible Author 176
Evidence for the Visible Author 177
What We Don’t Know About Personalization 177
9. Applying the Segmenting and Pretraining Principles:
Managing Complexity by Breaking a Lesson into Parts 183
Segmenting Principle: Break a Continuous Lesson into Bite-Size
Segments 185
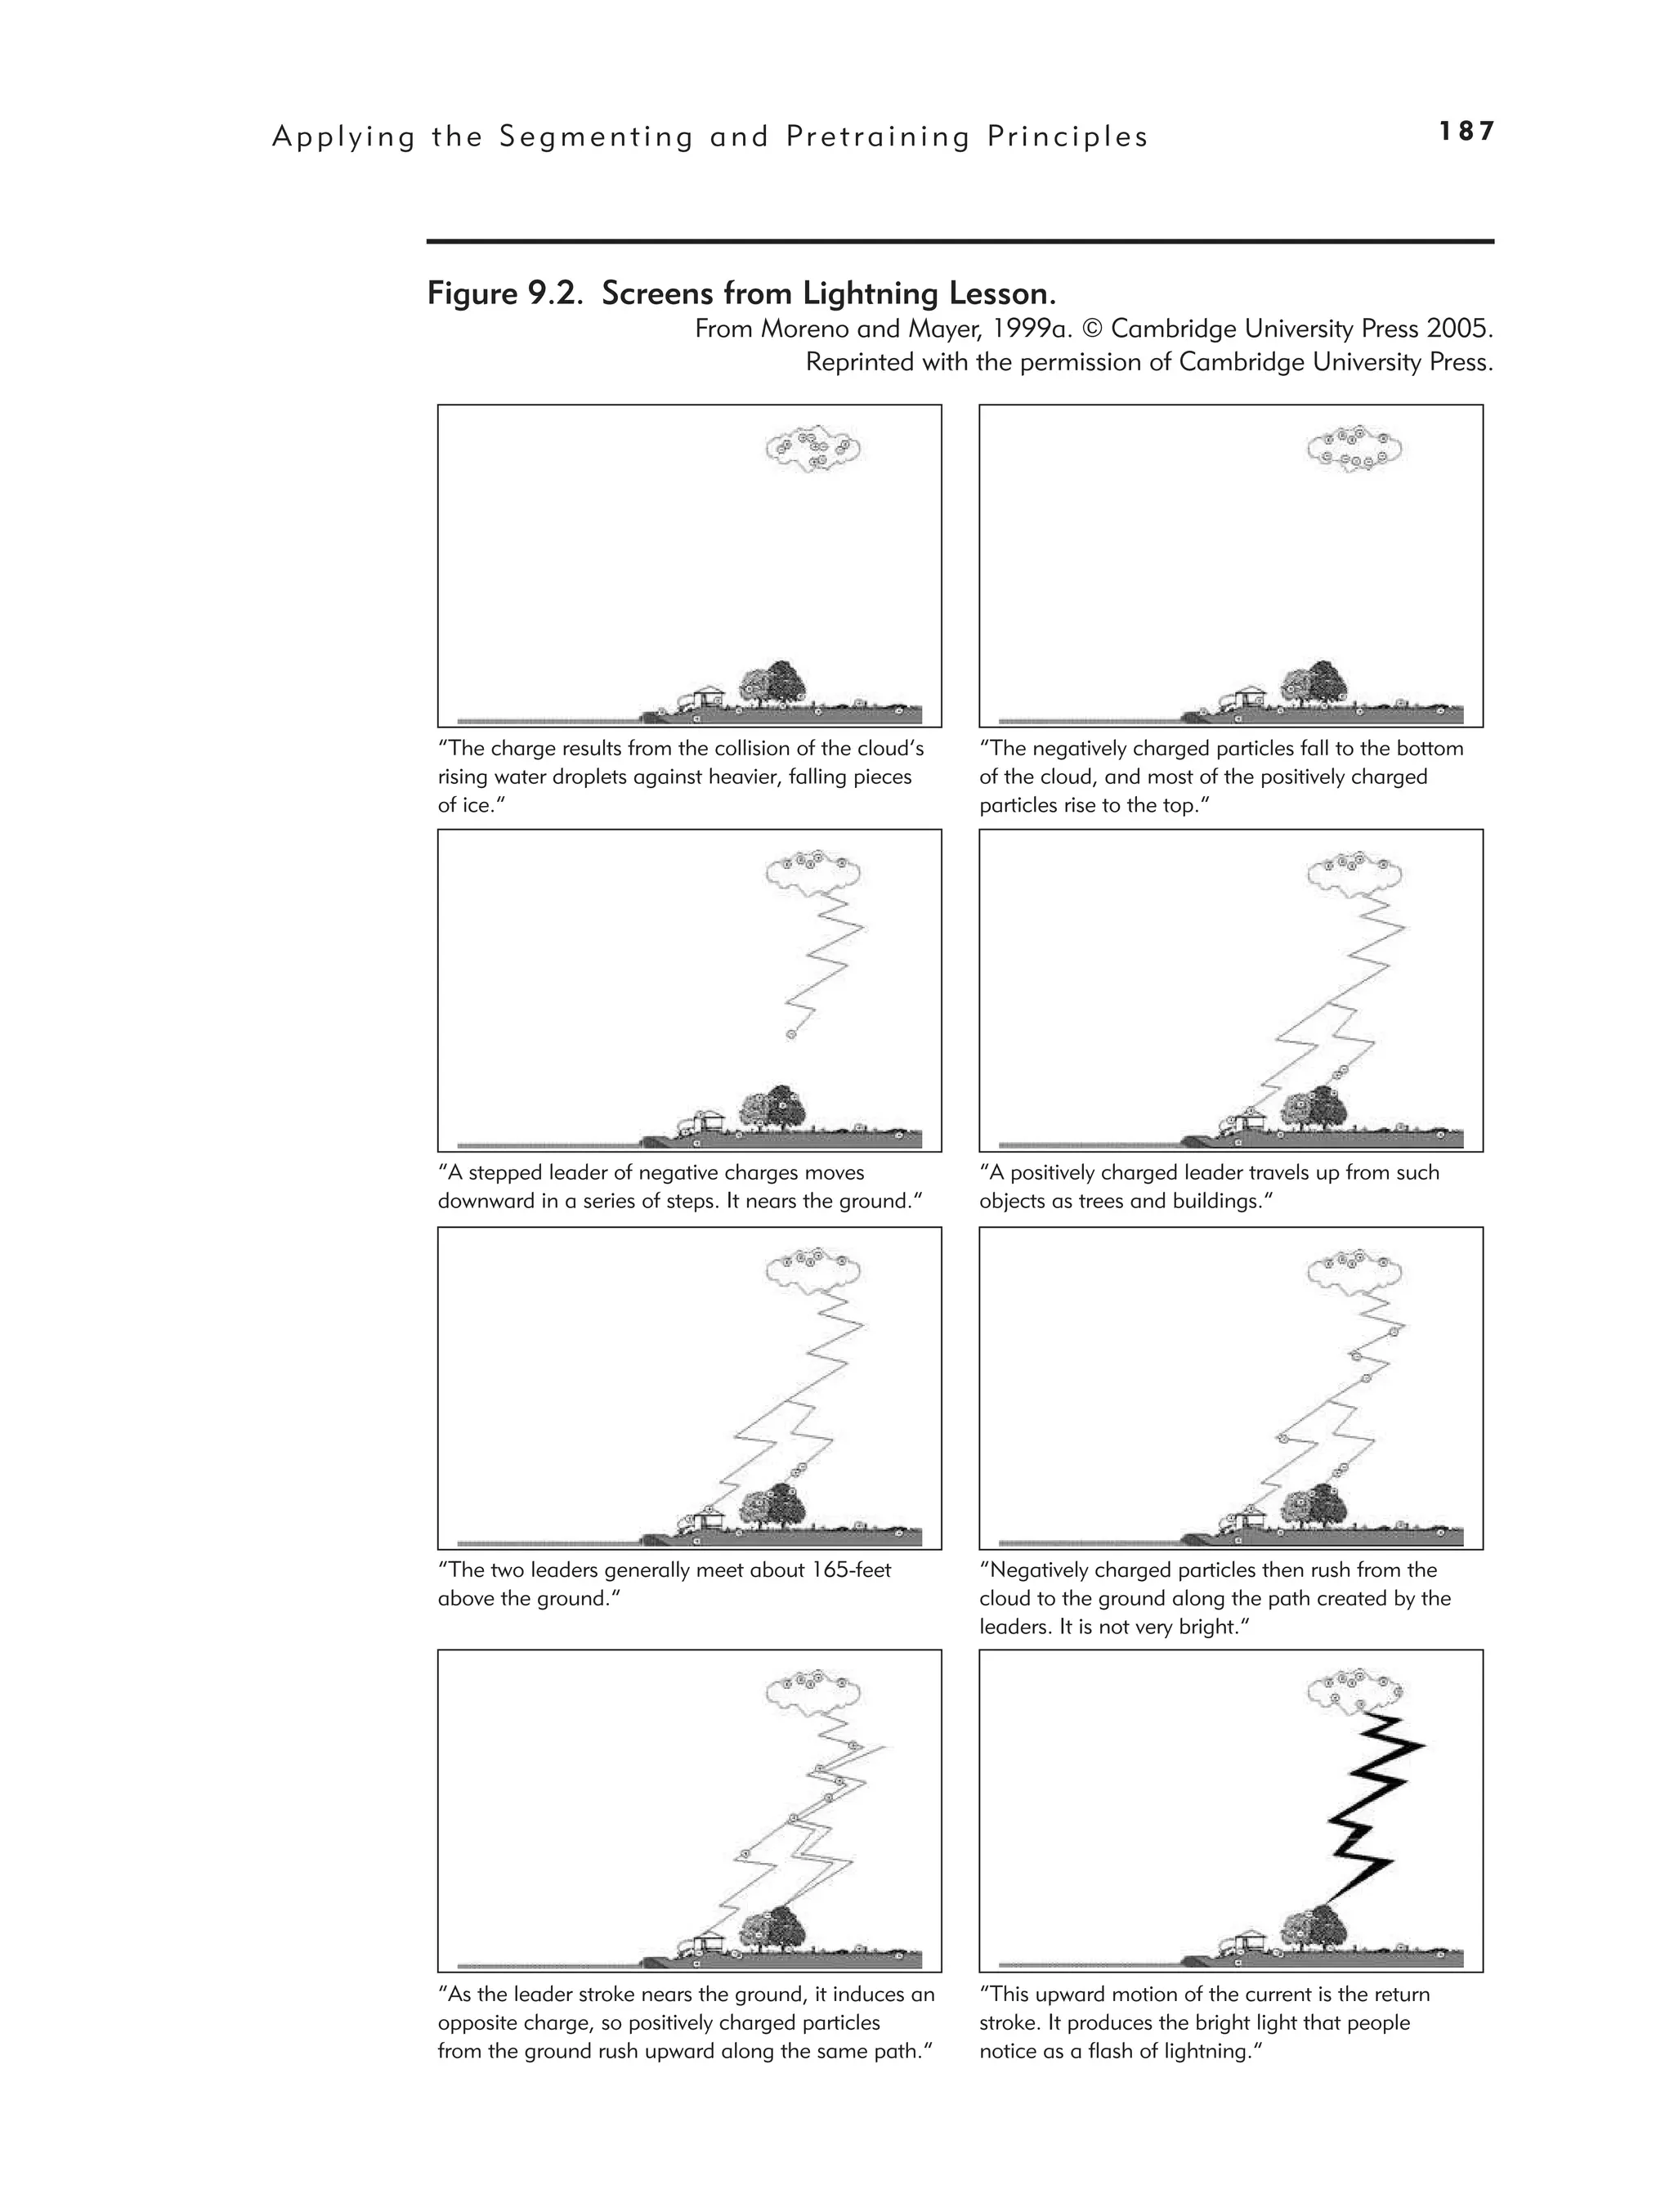
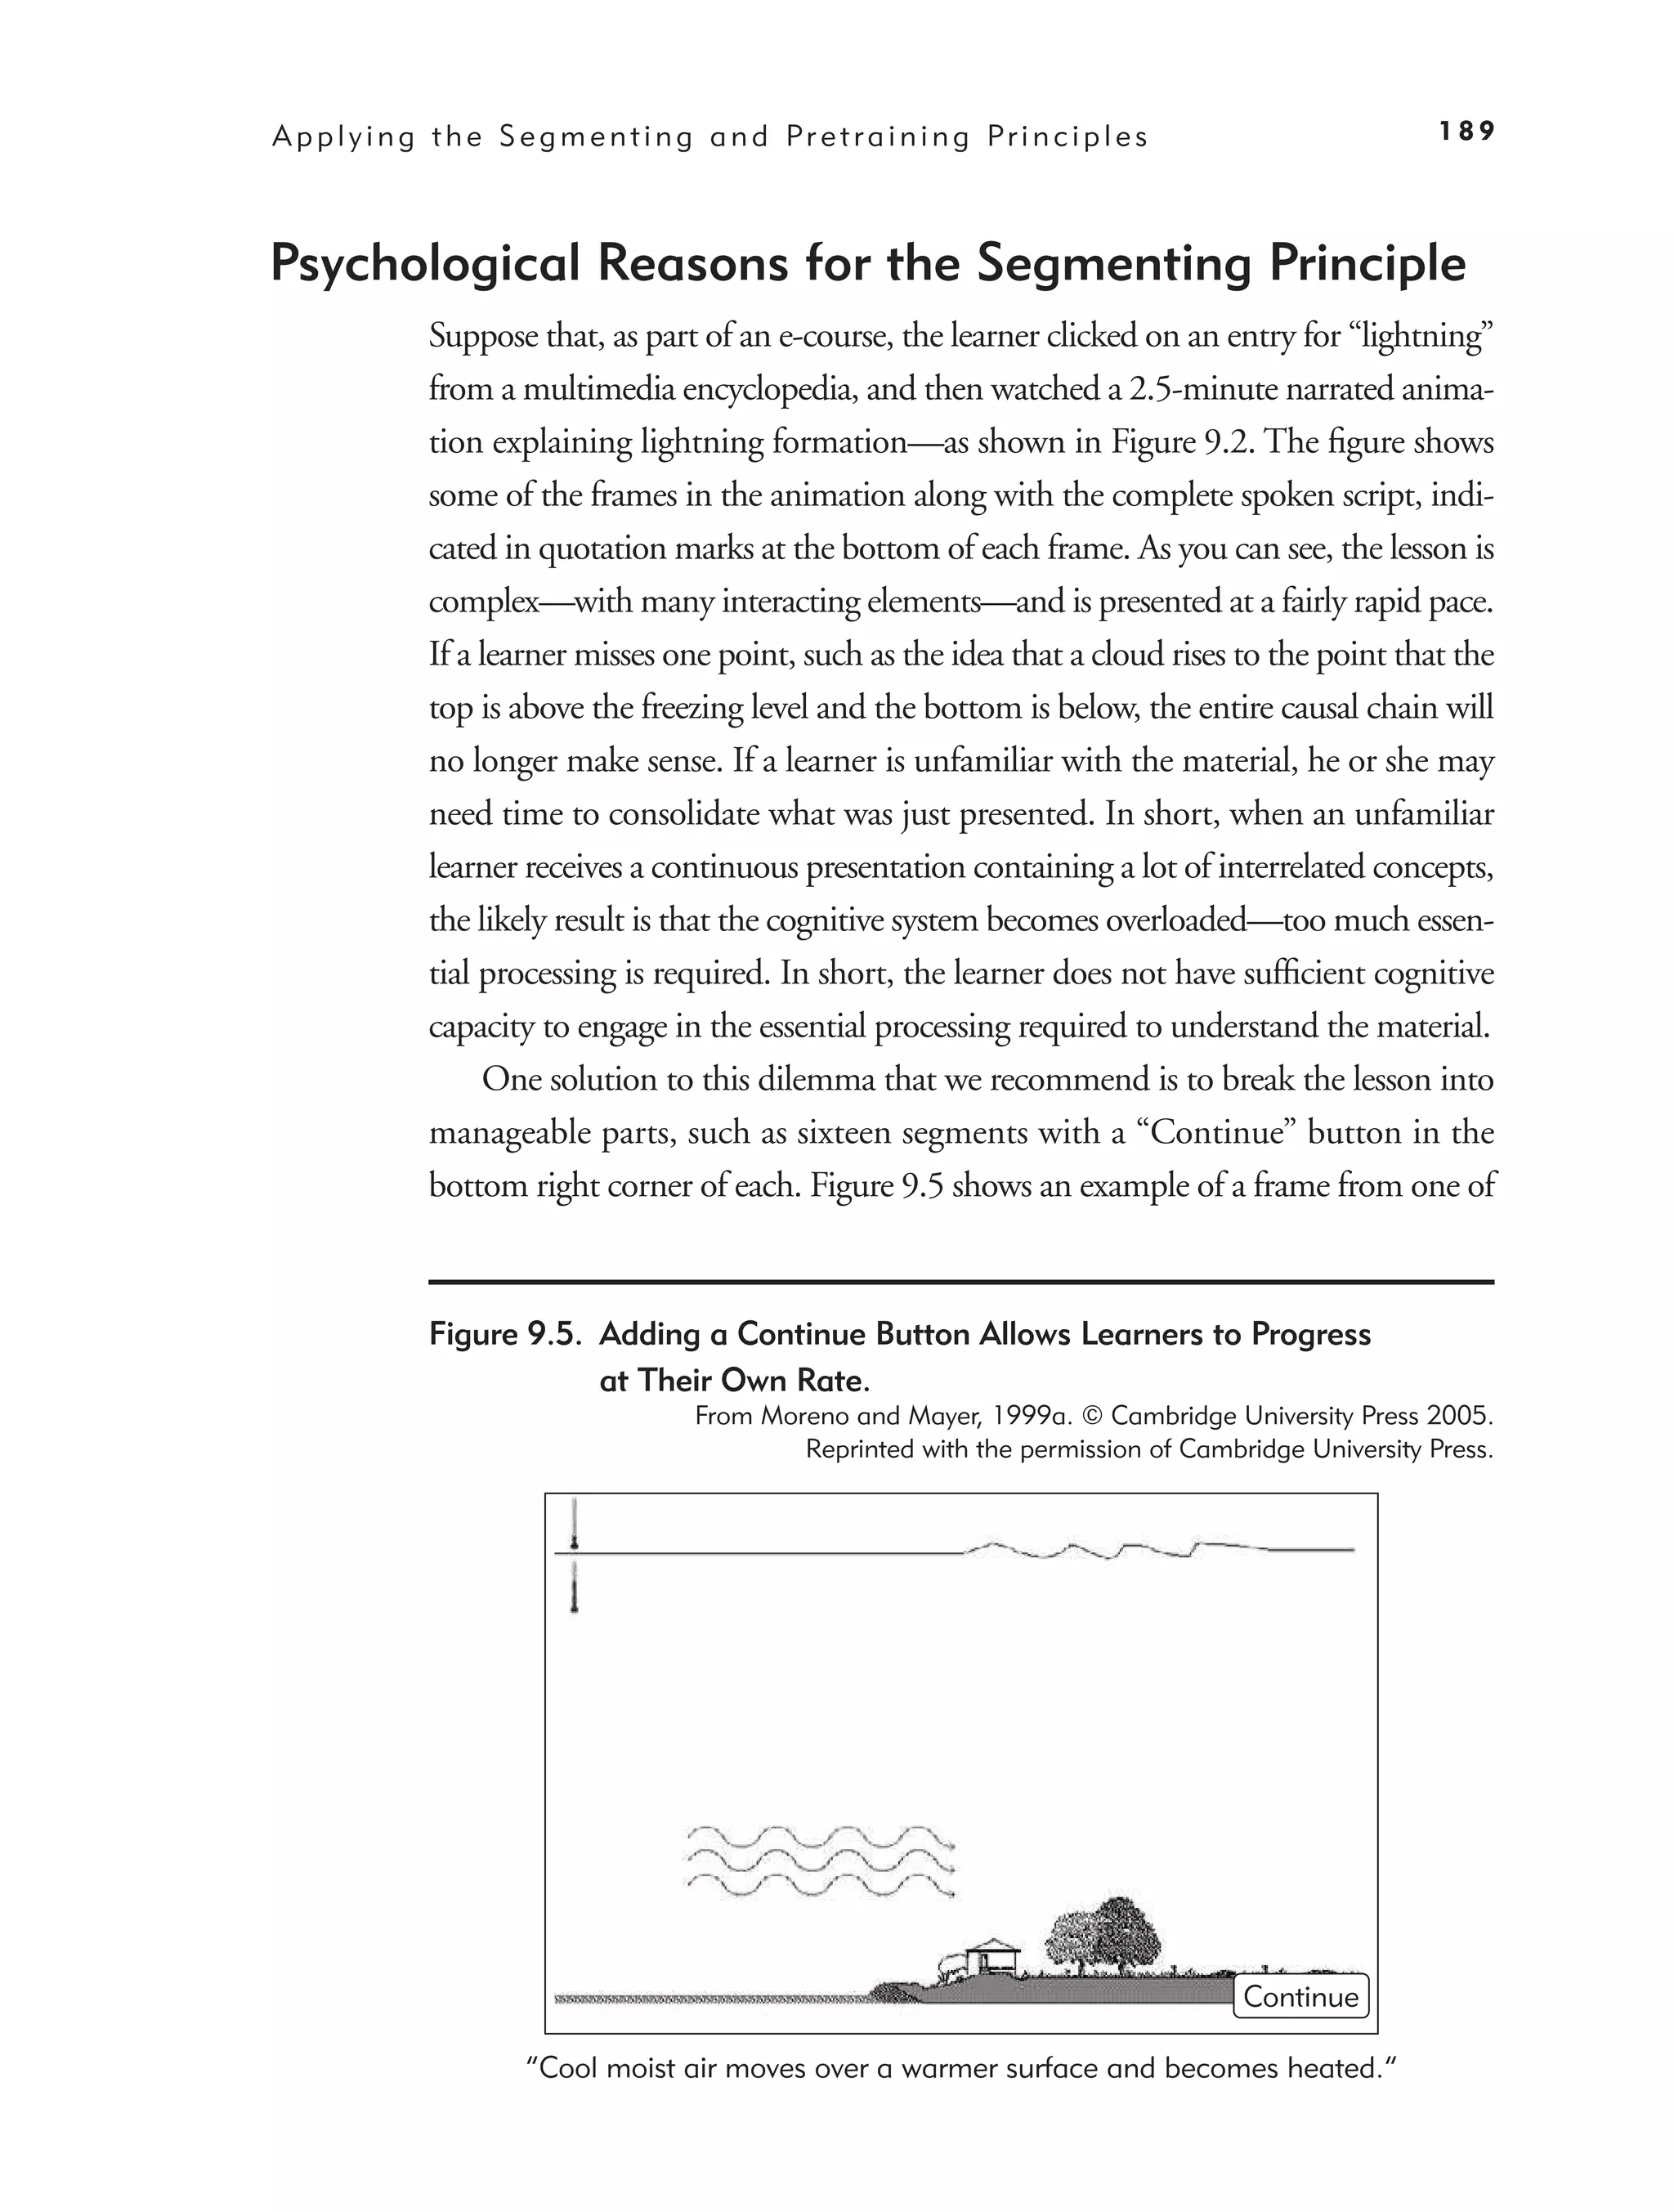
Psychological Reasons for the Segmenting Principle 189
Evidence for Breaking a Continuous Lesson into Bite-Size
Segments 190
12.
Contents xi
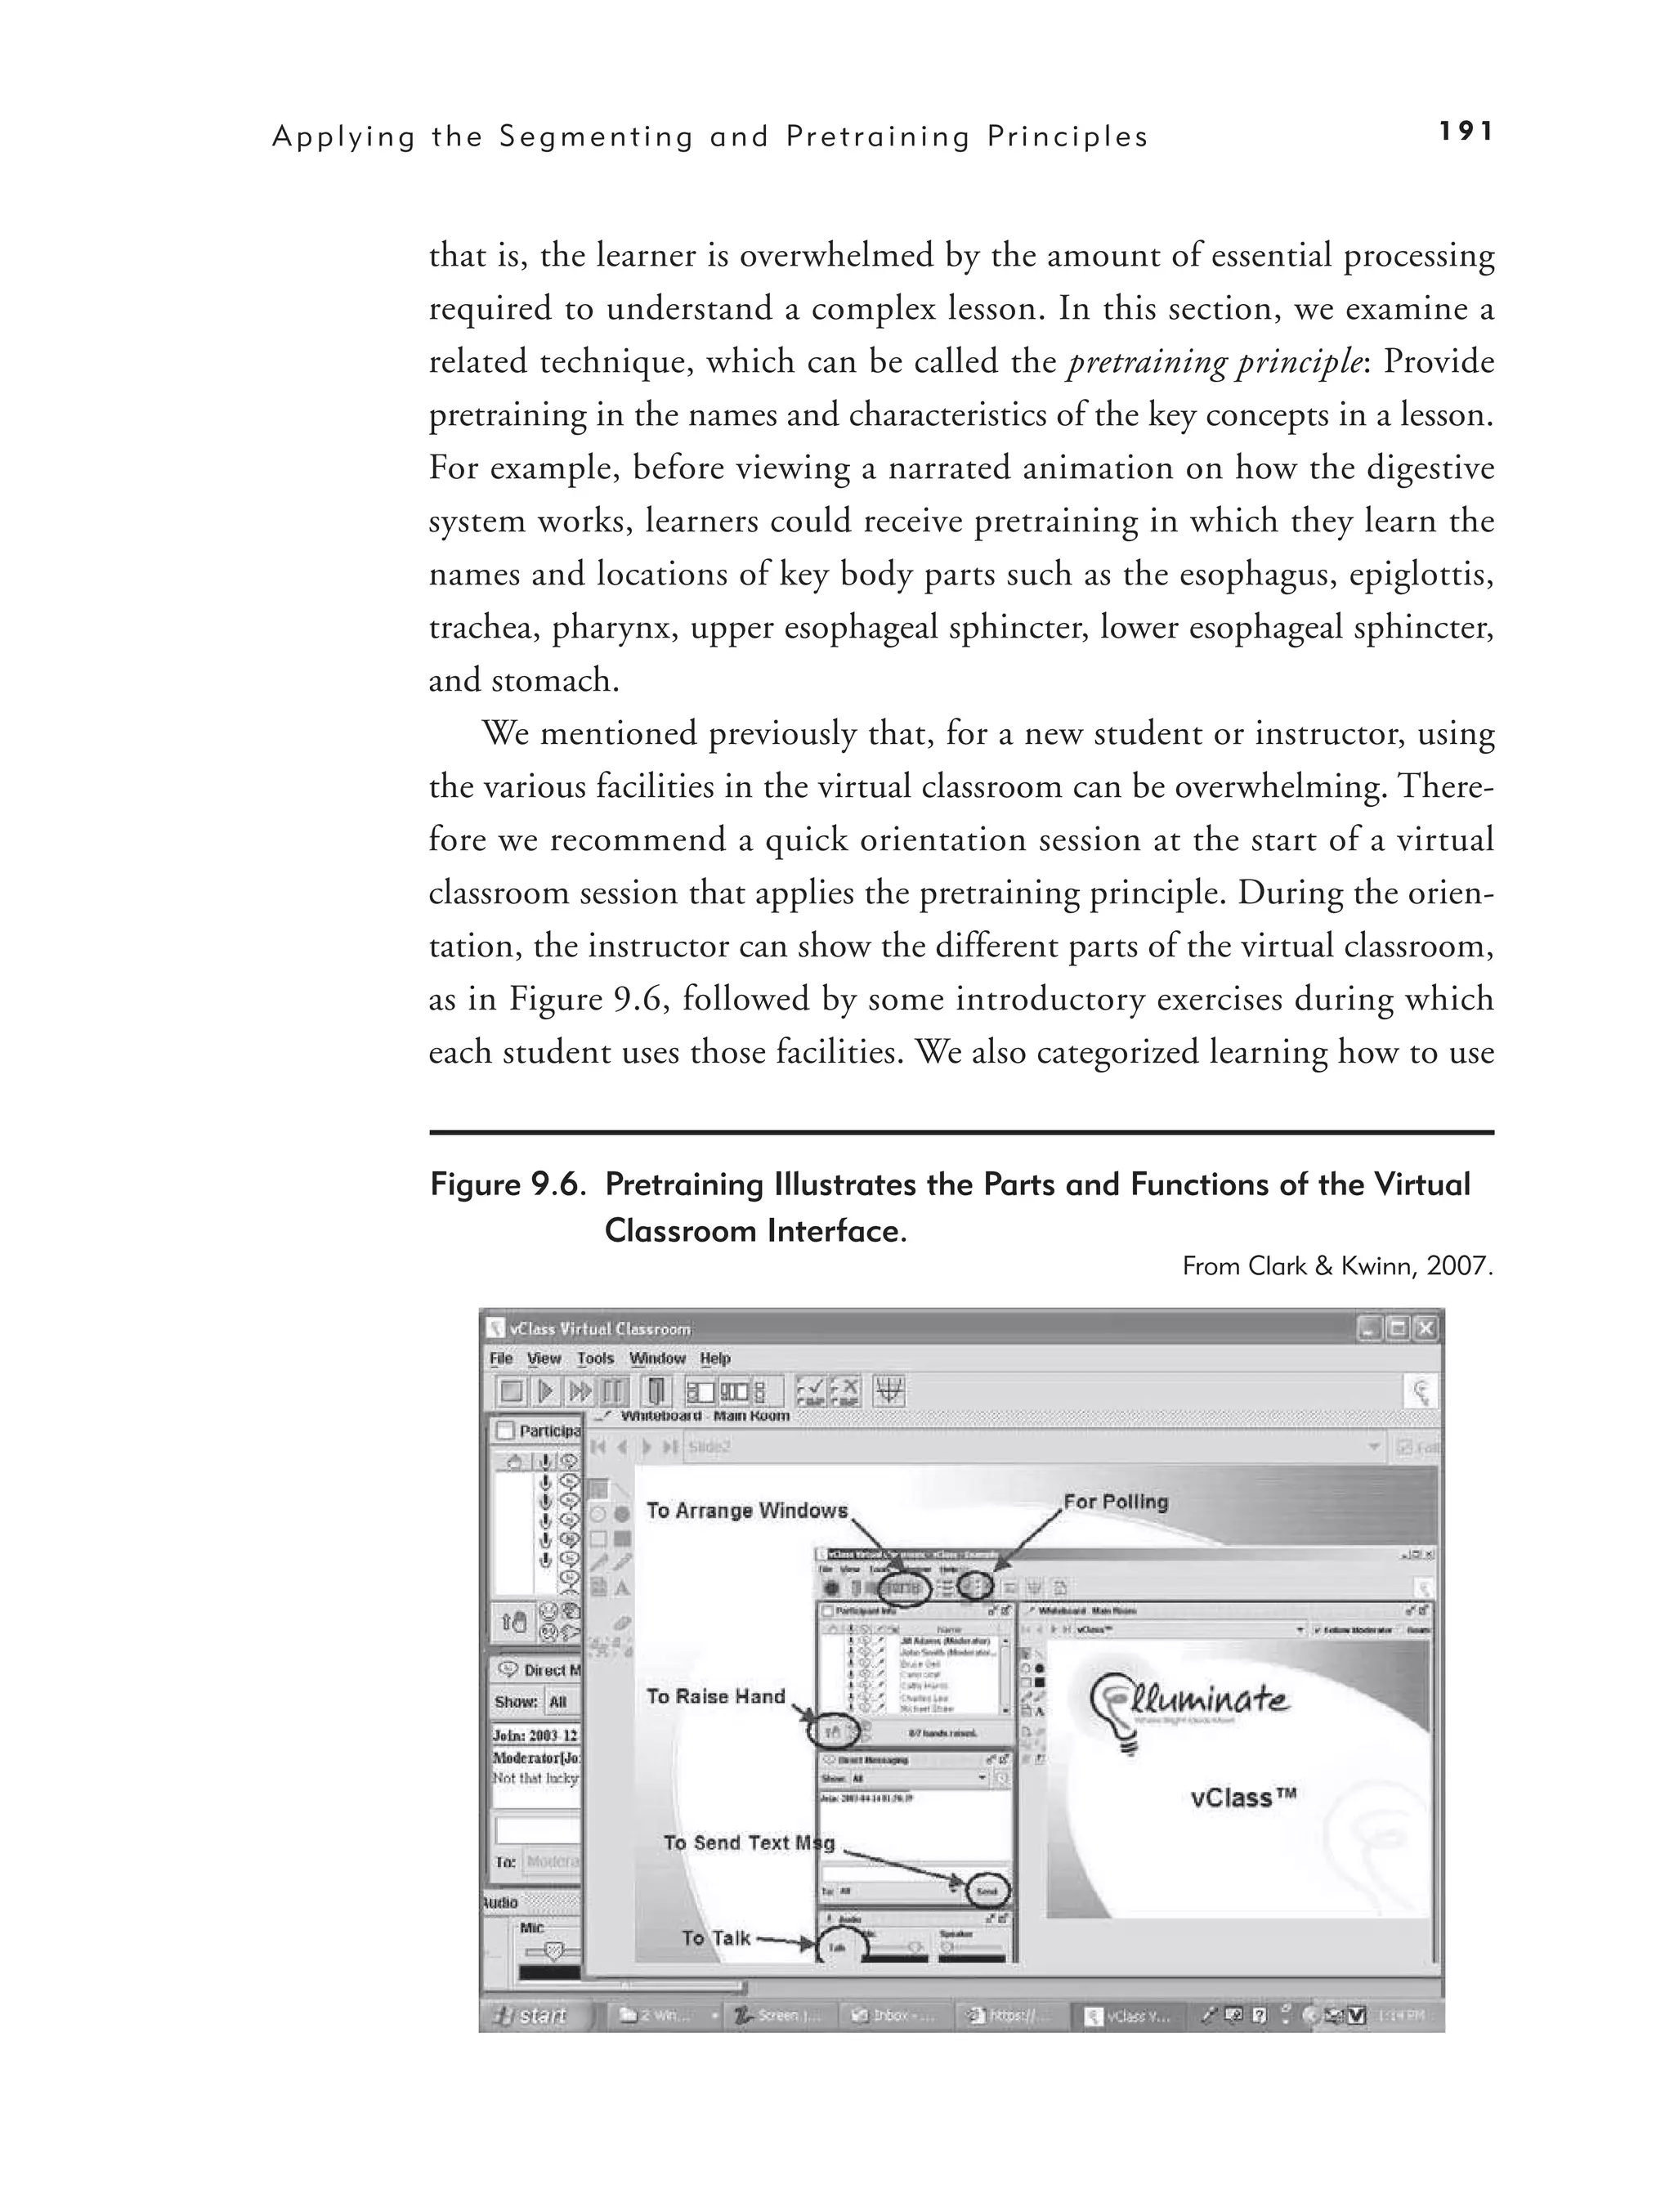
Pretraining Principle: Ensure That Learners Know the Names and
Characteristics of Key Concepts 190
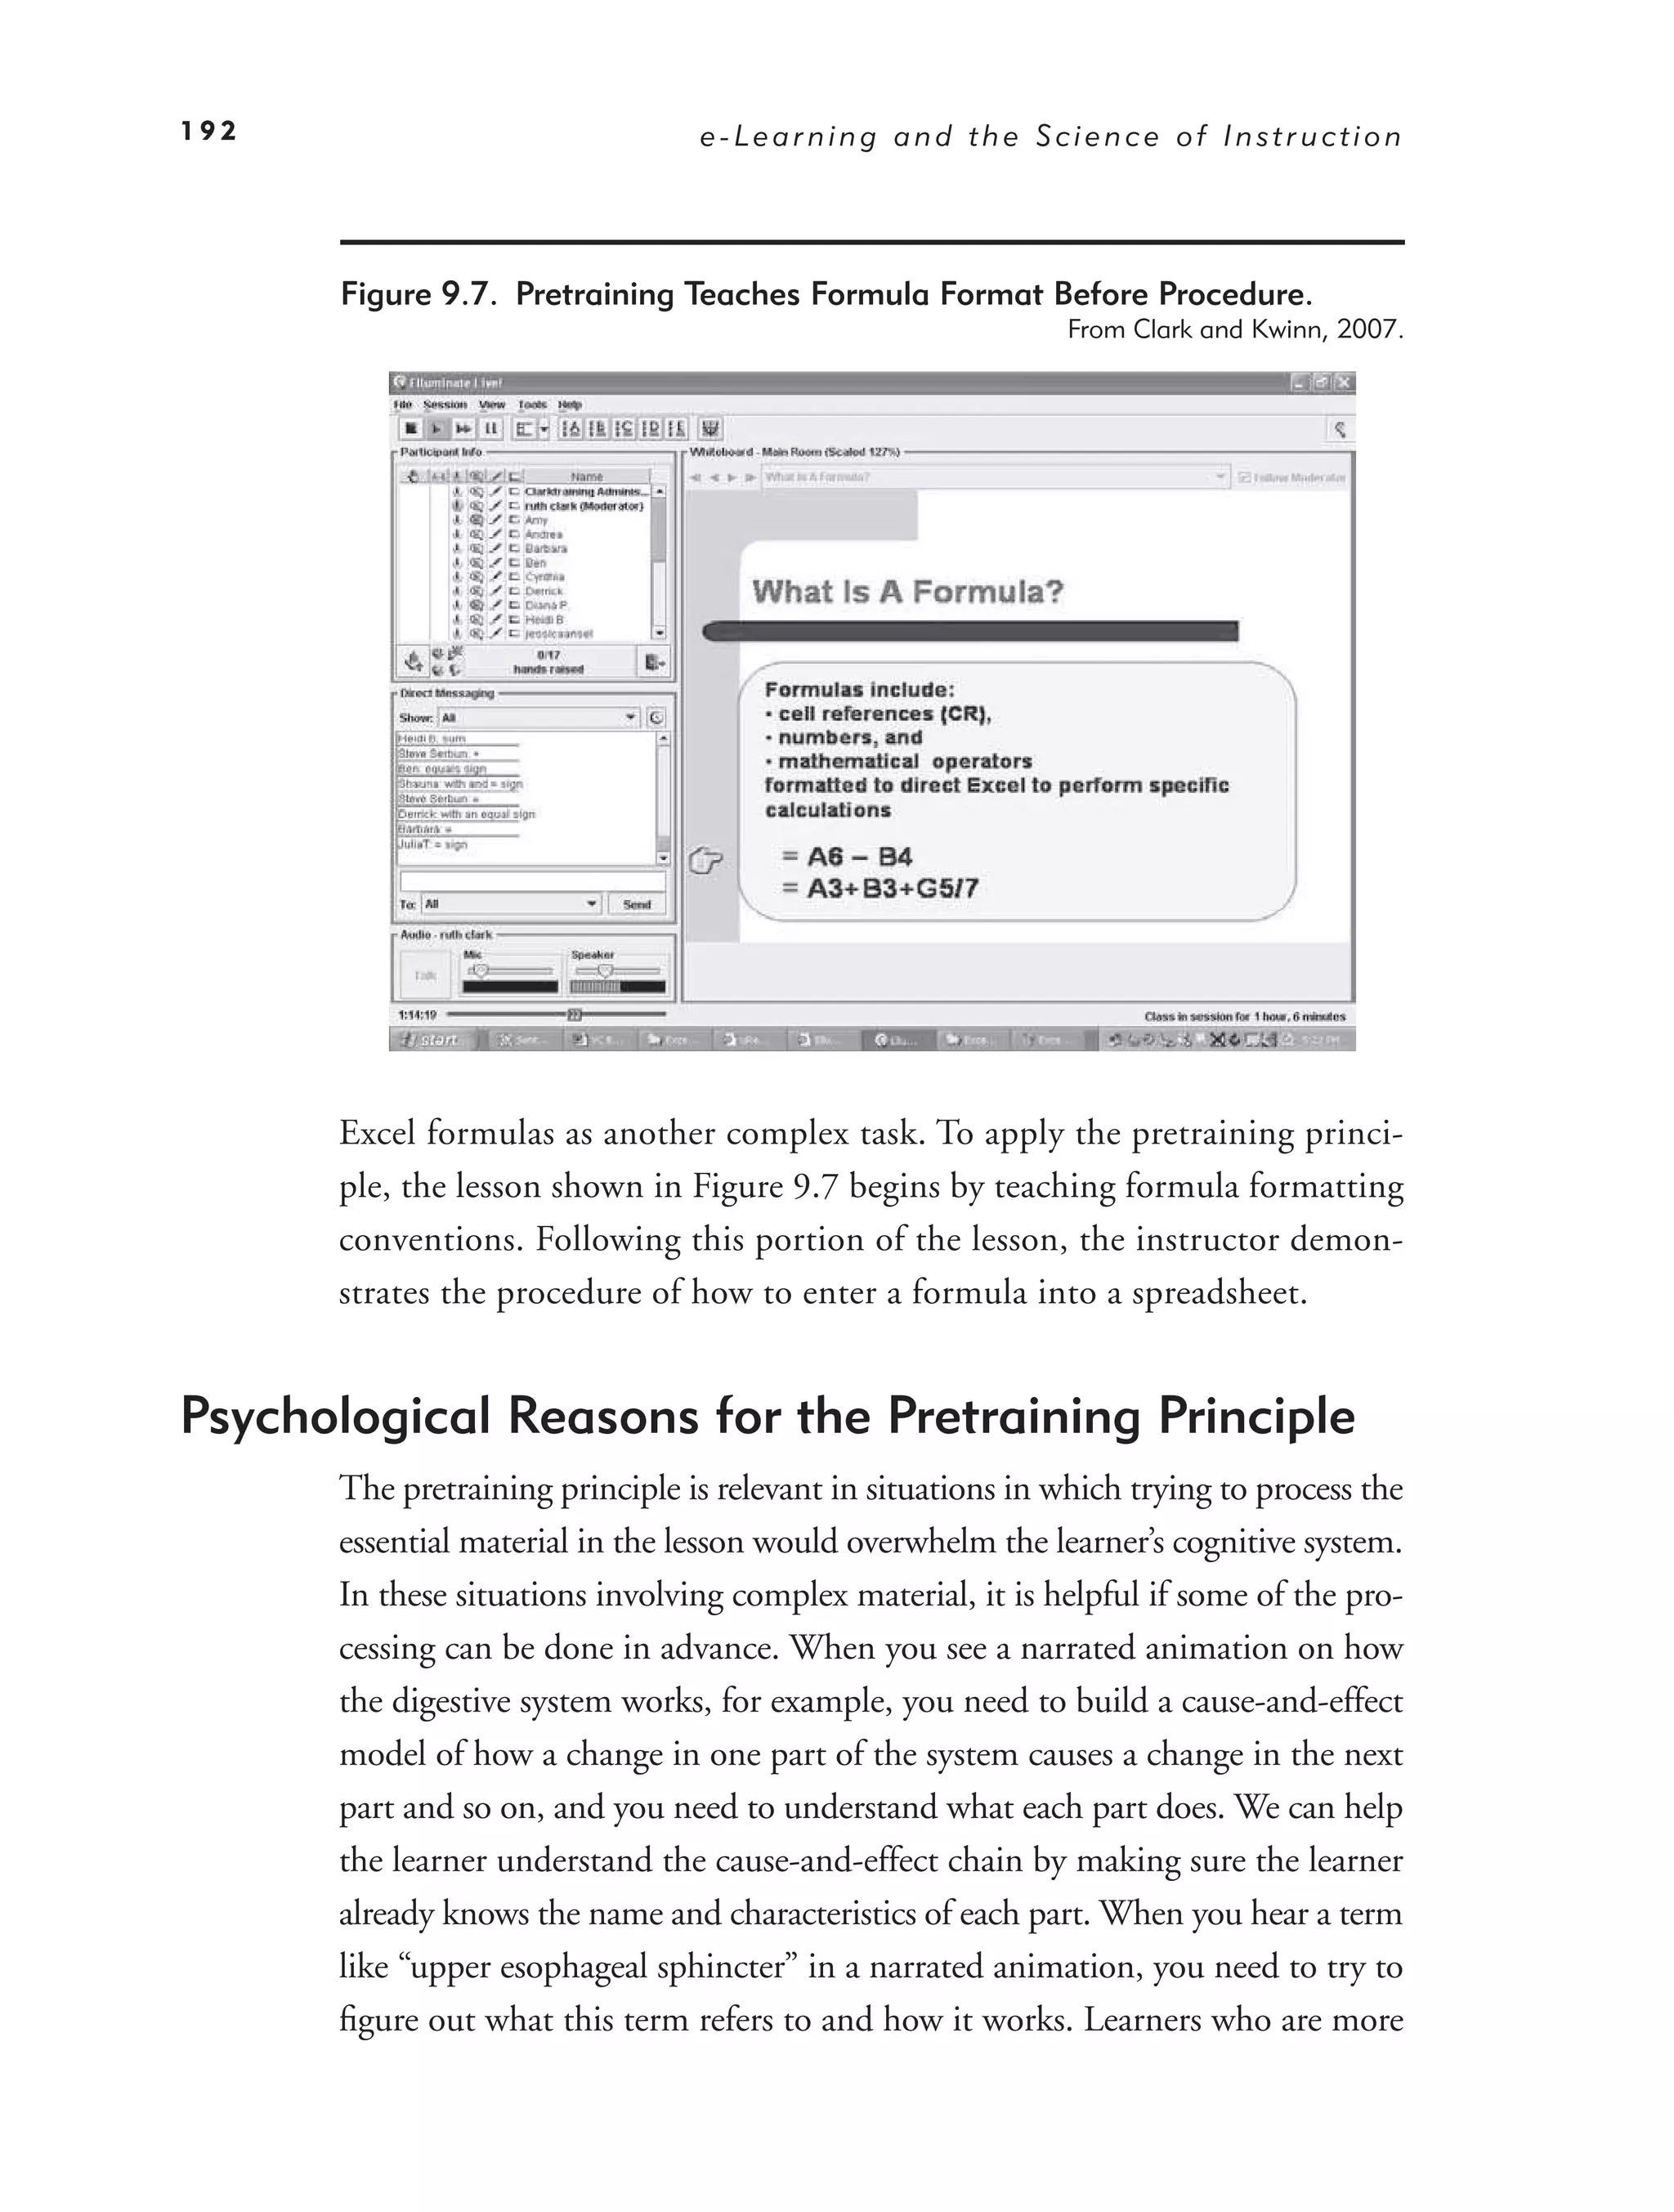
Psychological Reasons for the Pretraining Principle 192
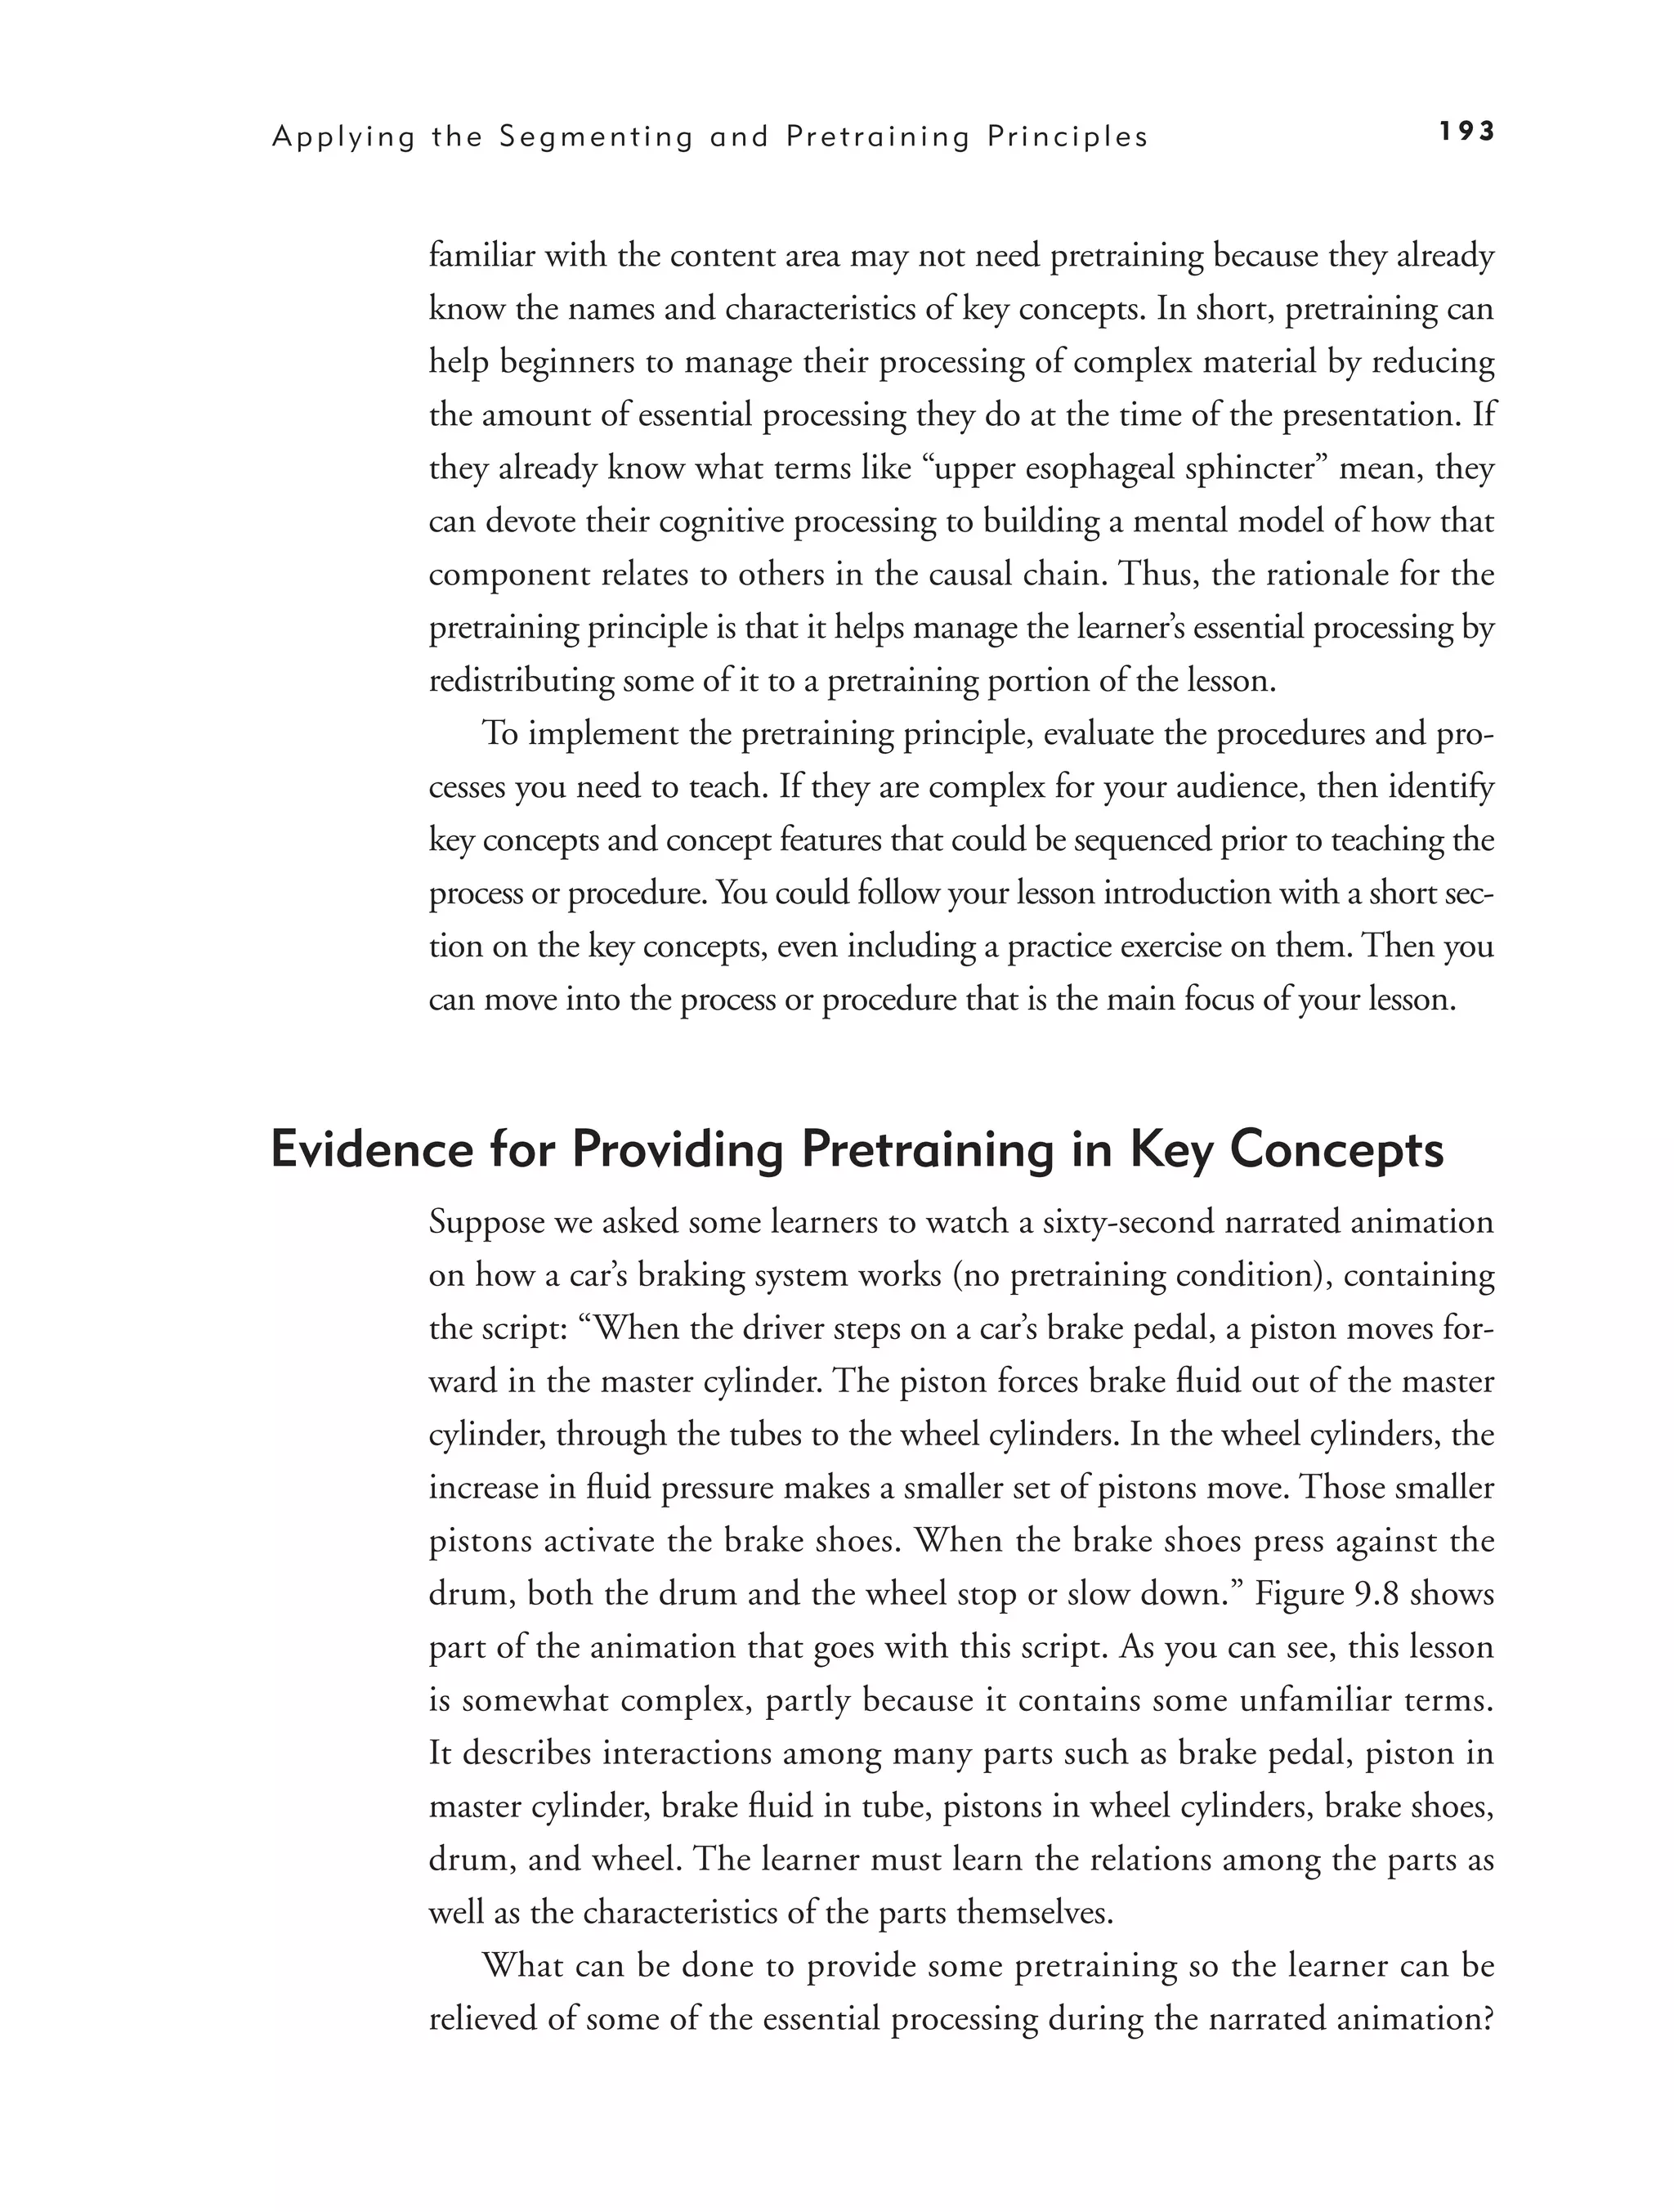
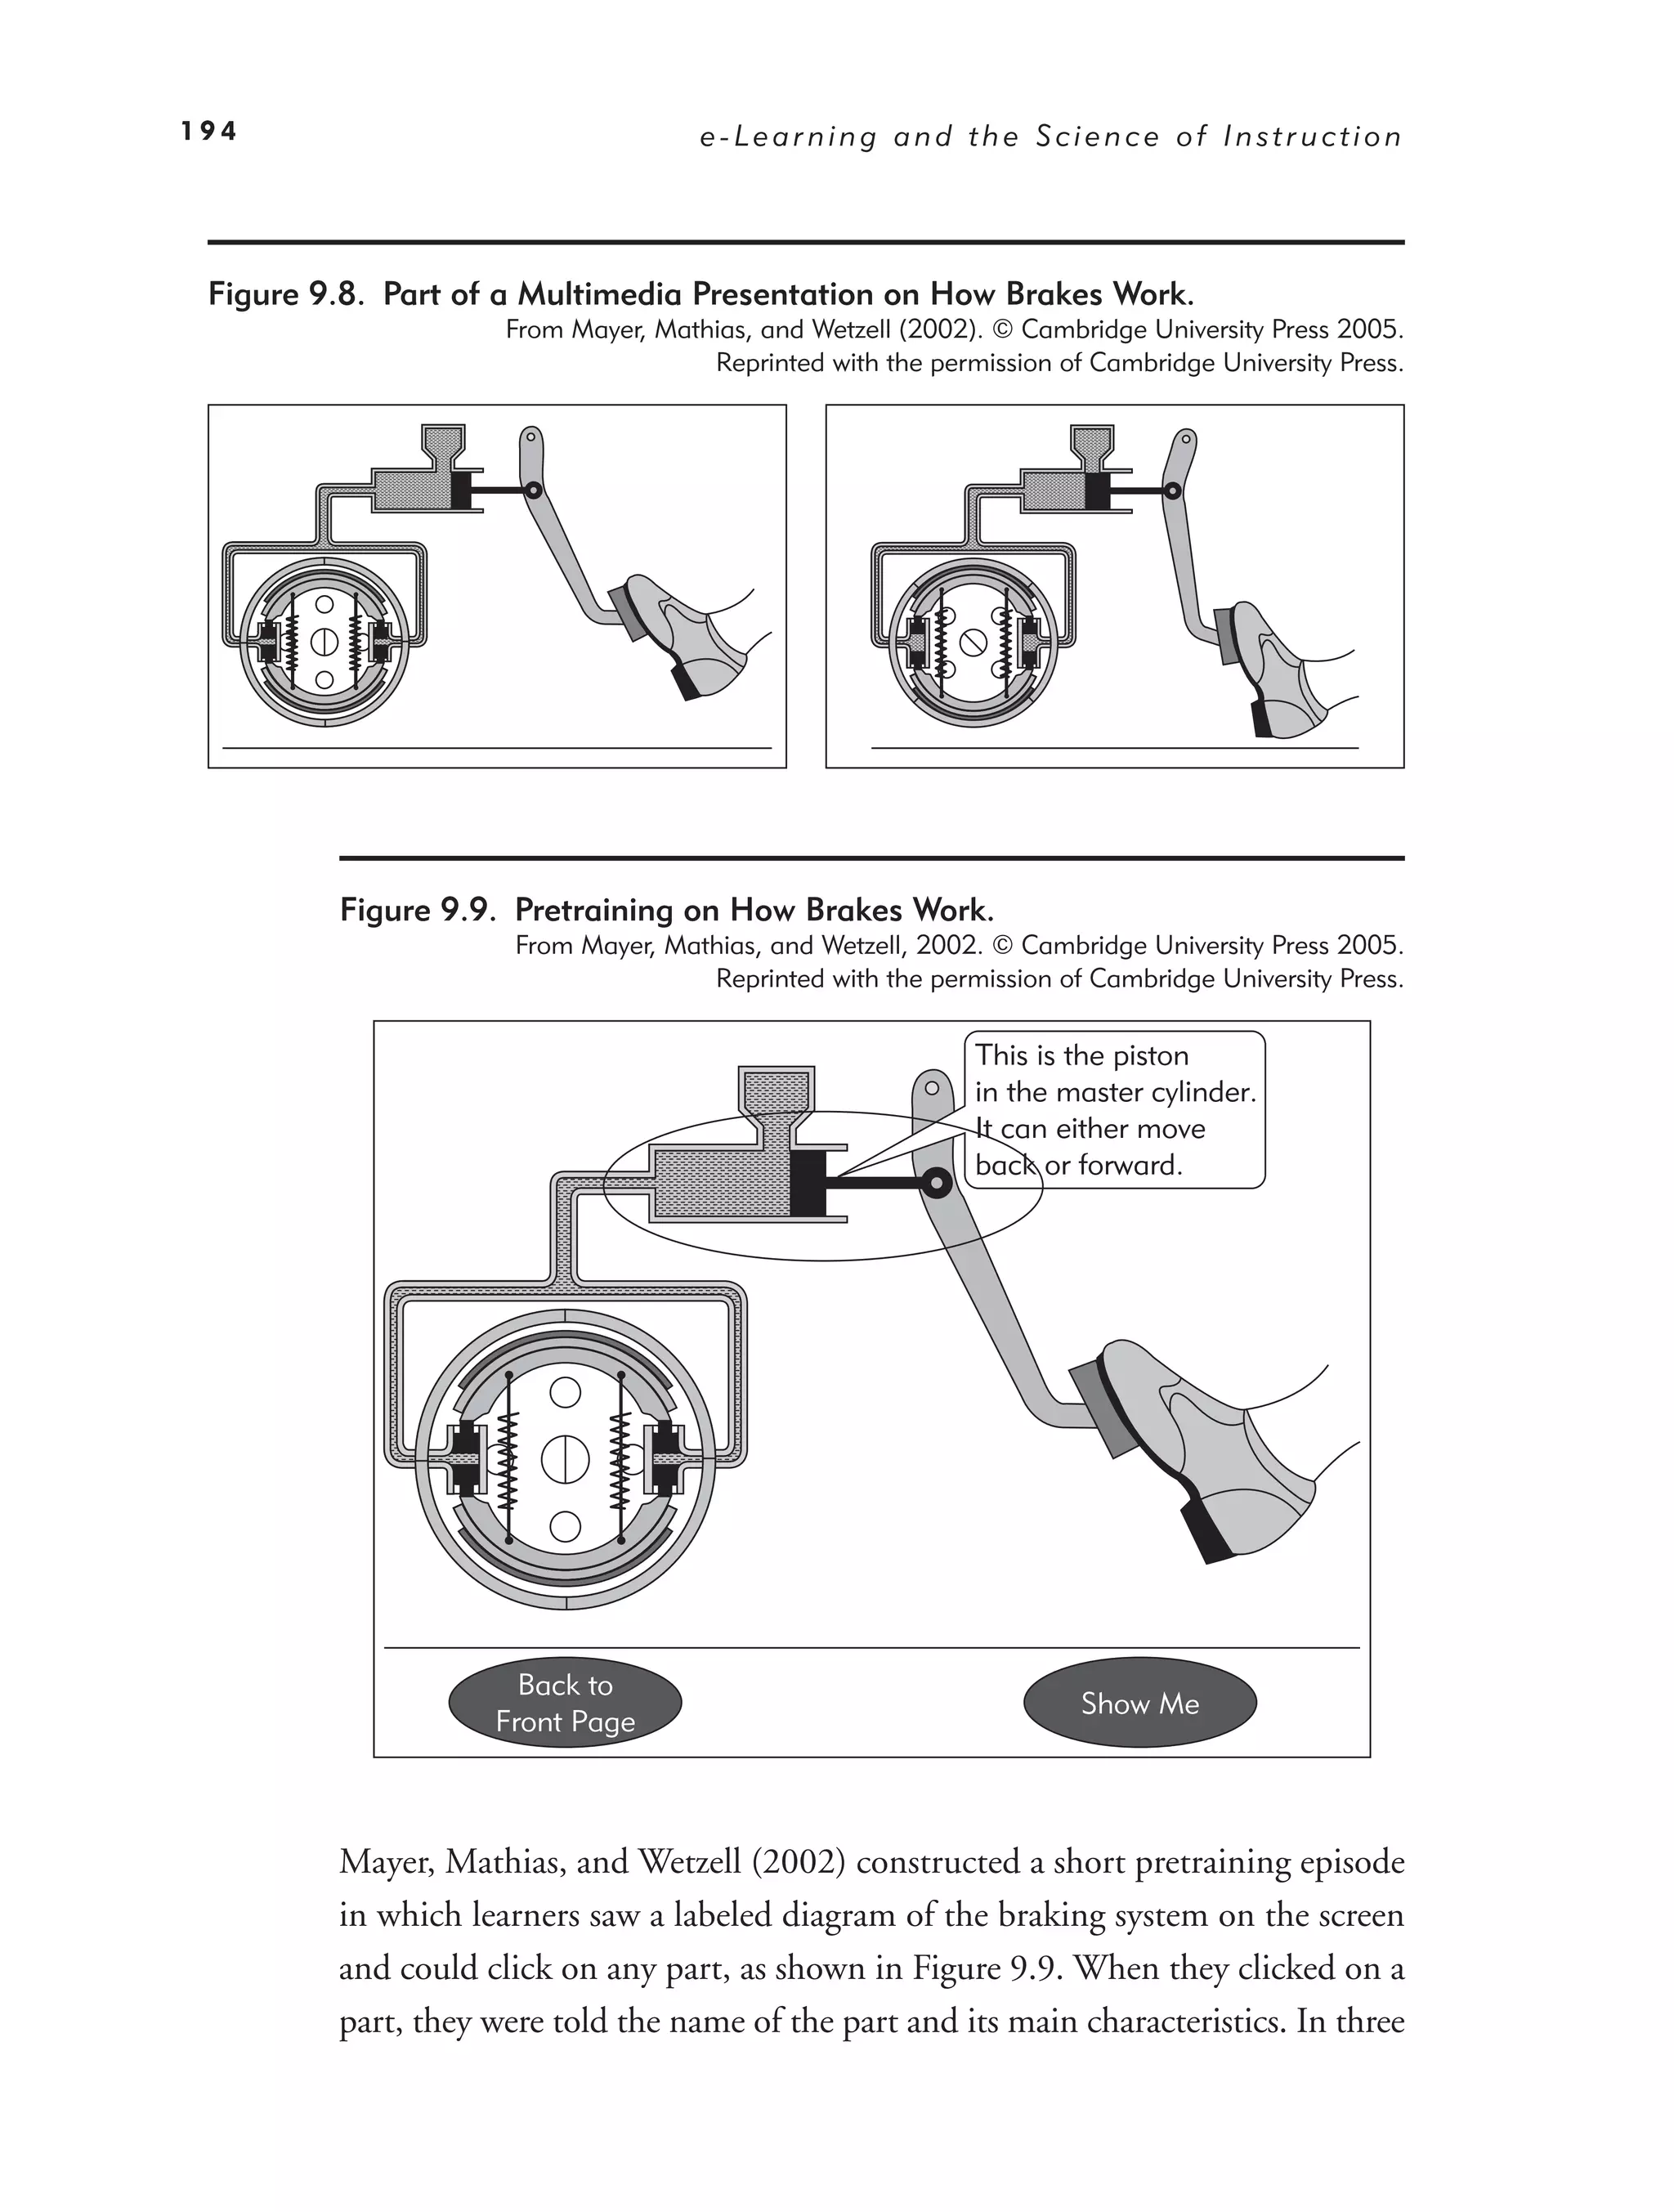
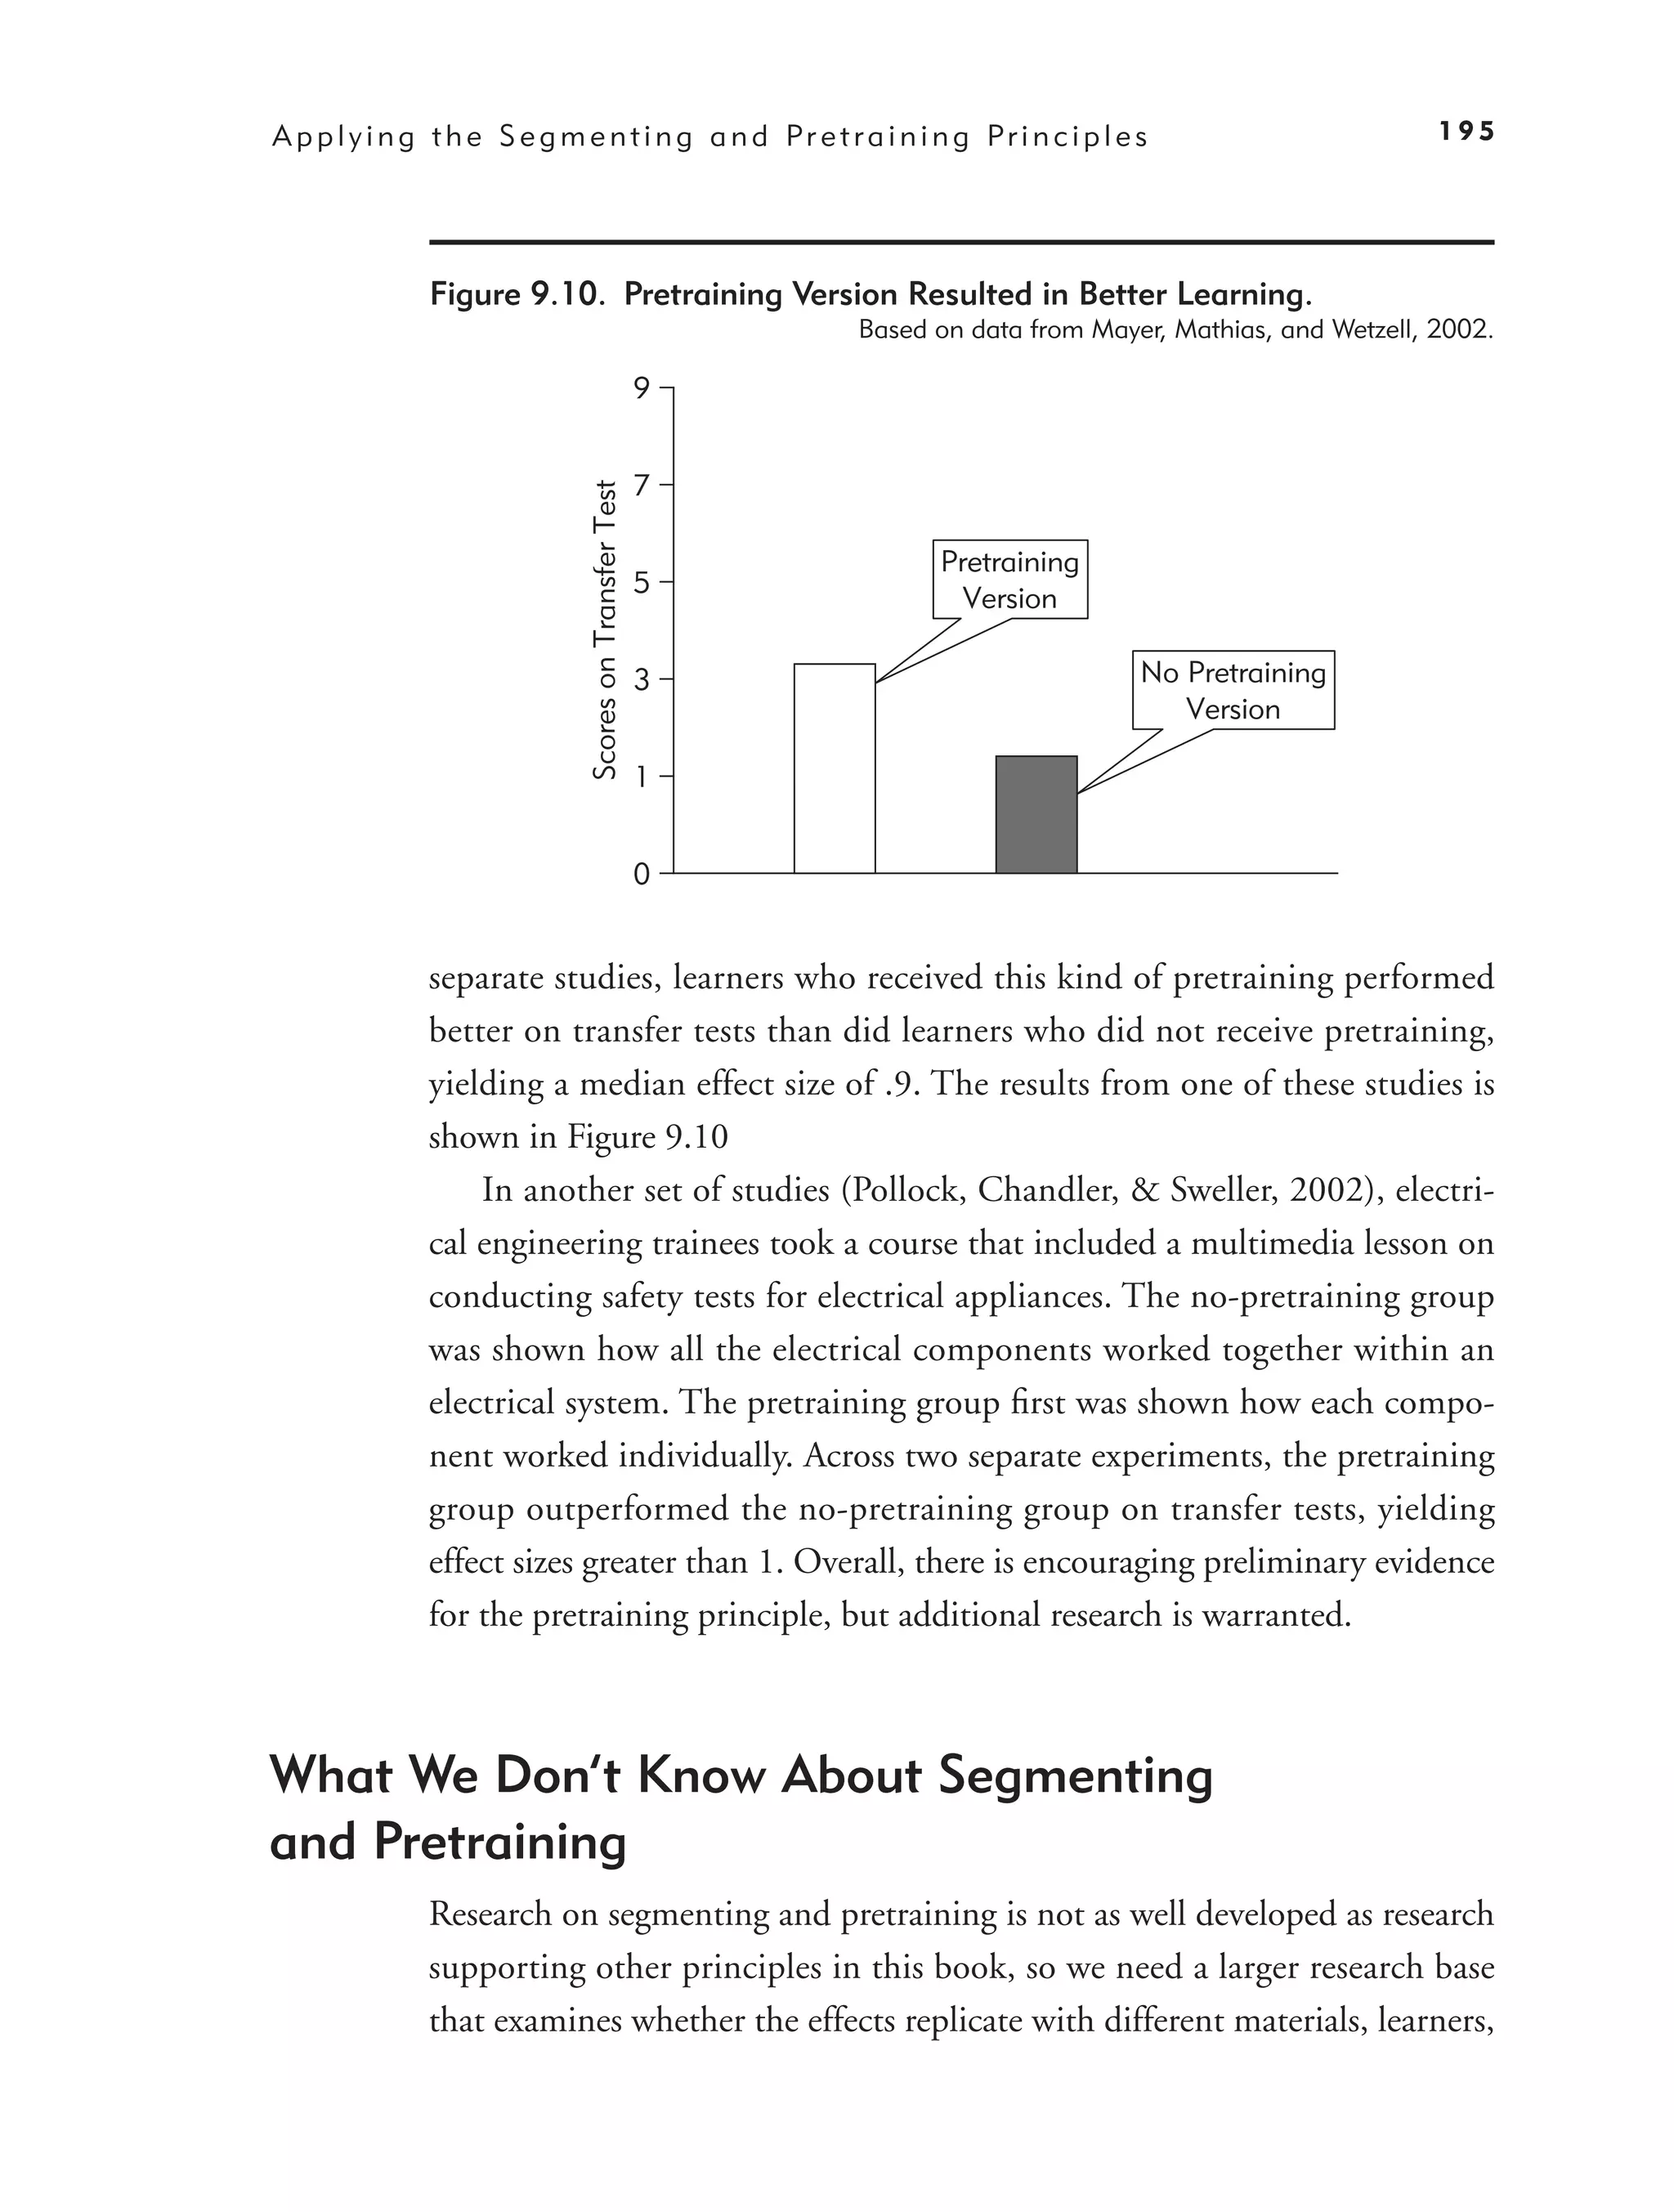
Evidence for Providing Pretraining in Key Concepts 193
What We Don’t Know About Segmenting and Pretraining 195
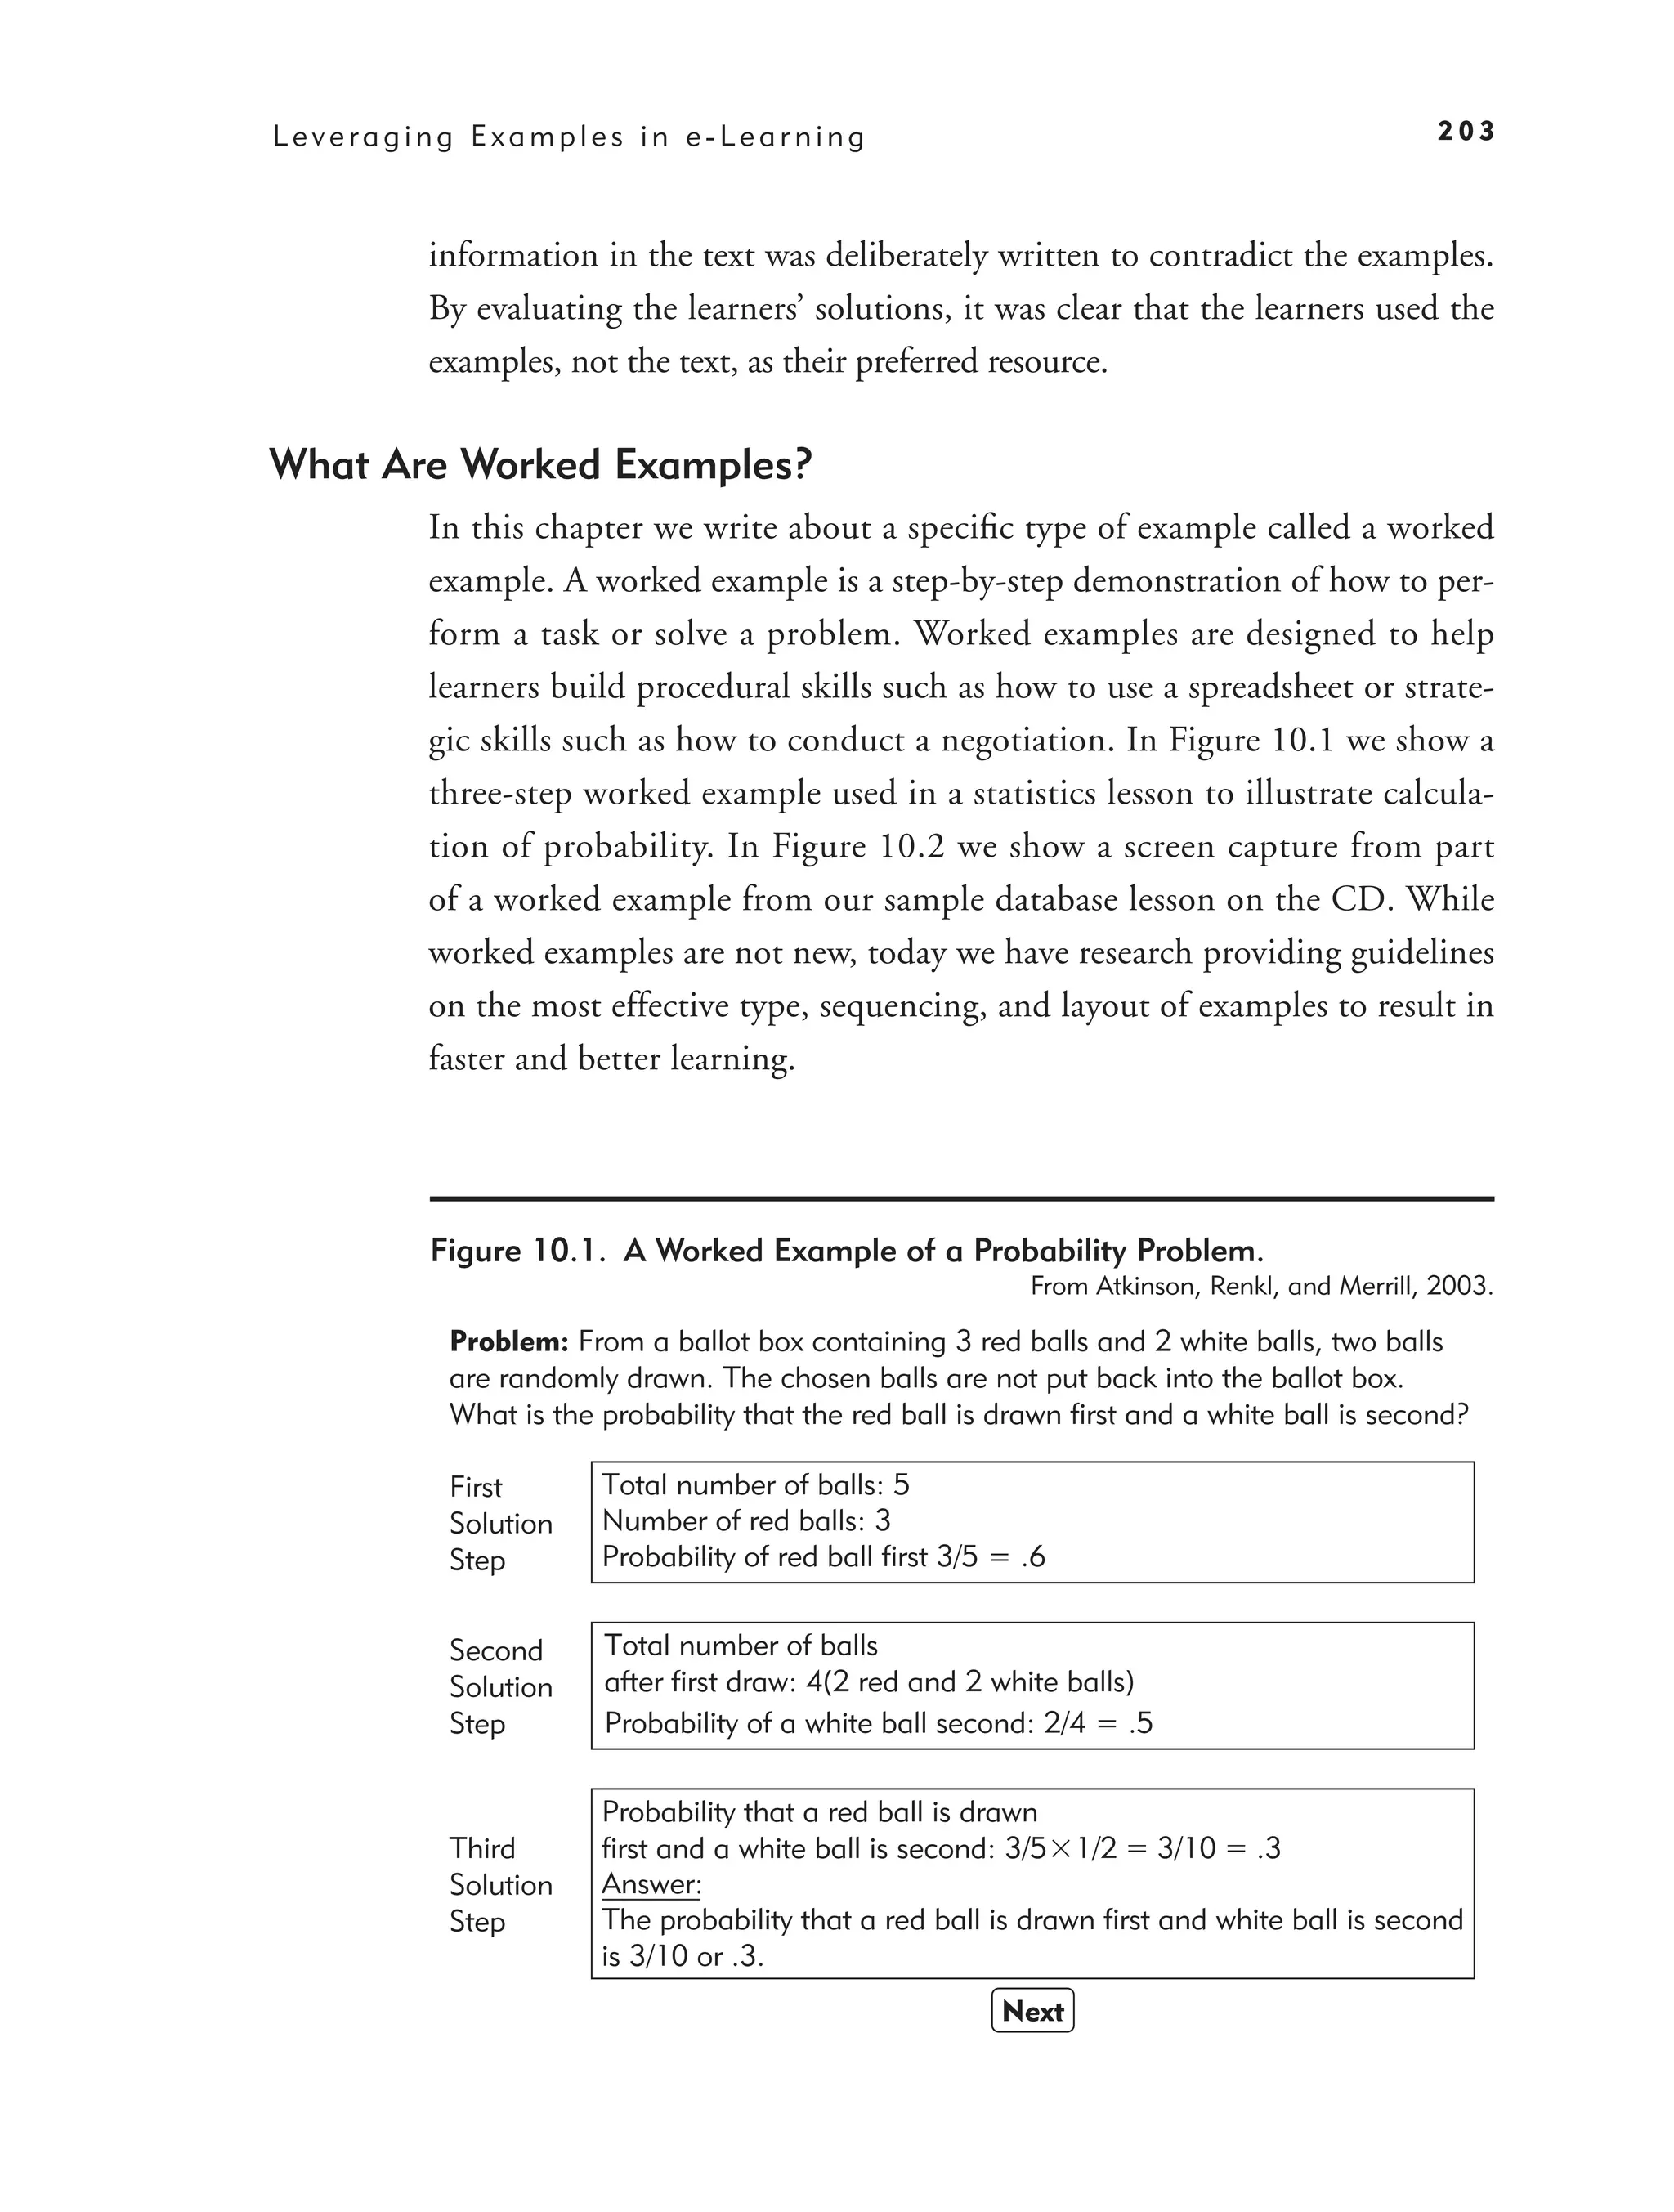
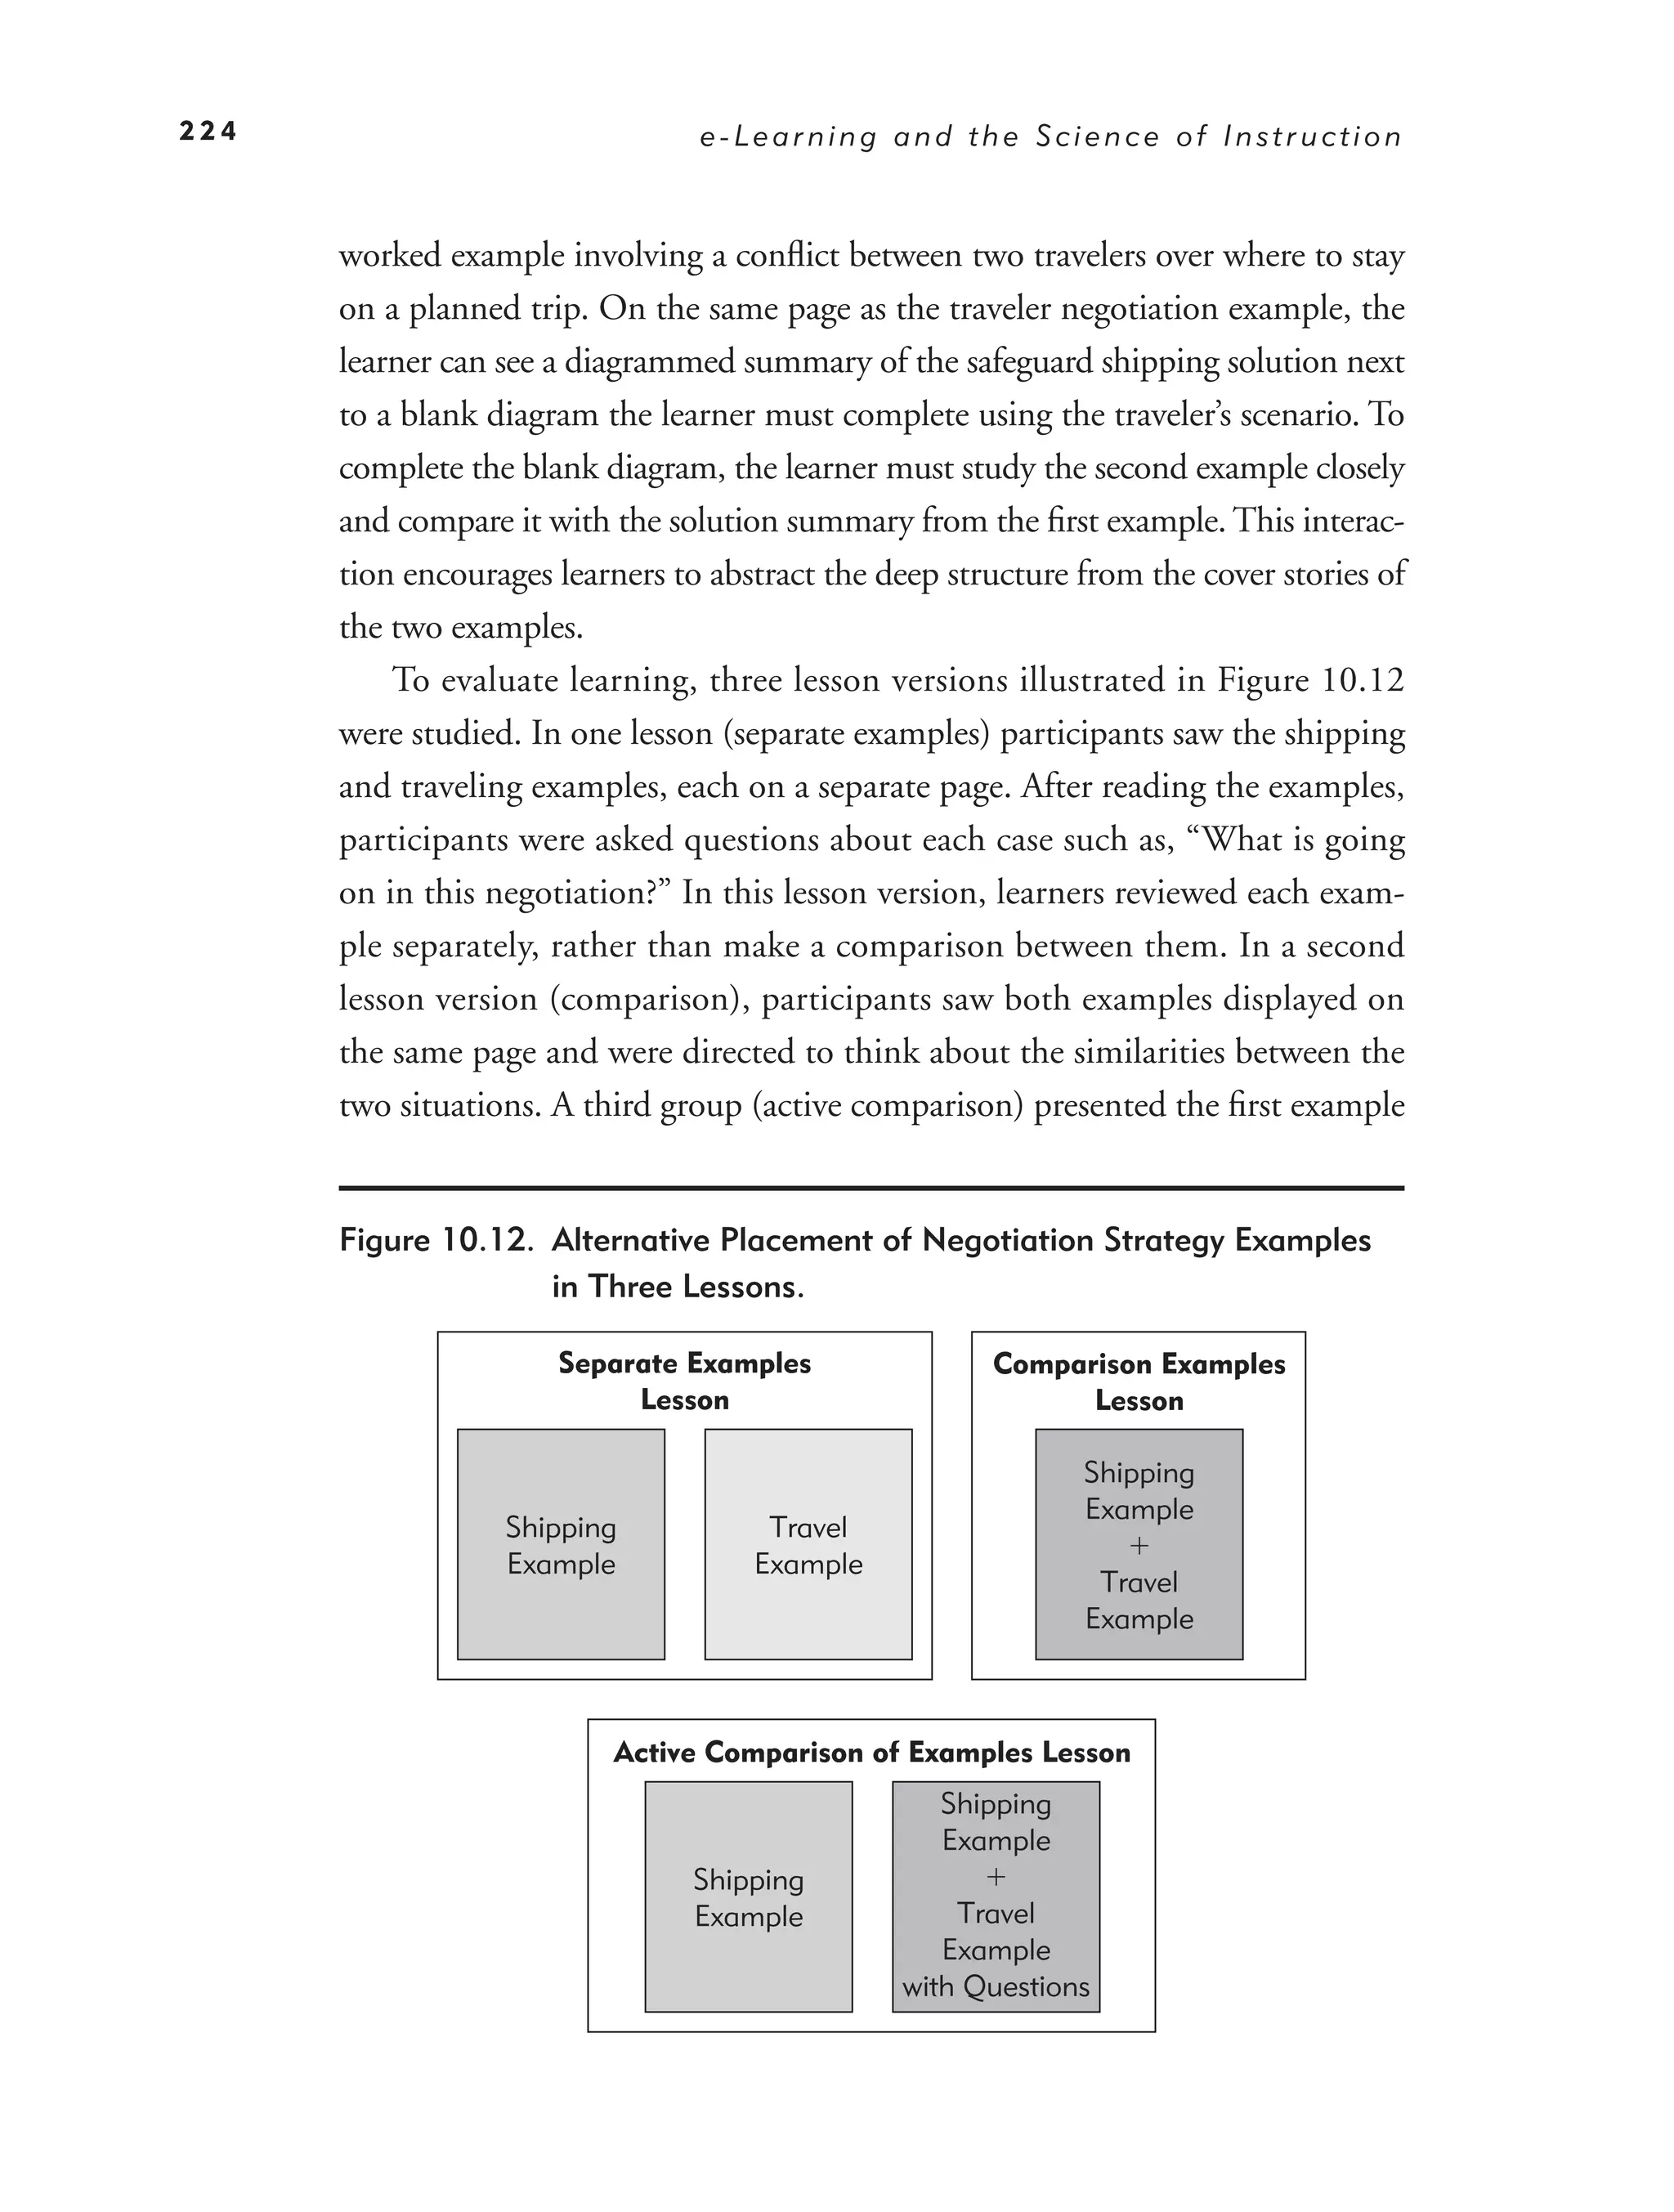
10. Leveraging Examples in e-Learning 201
Worked Examples Fuel for Learning 202
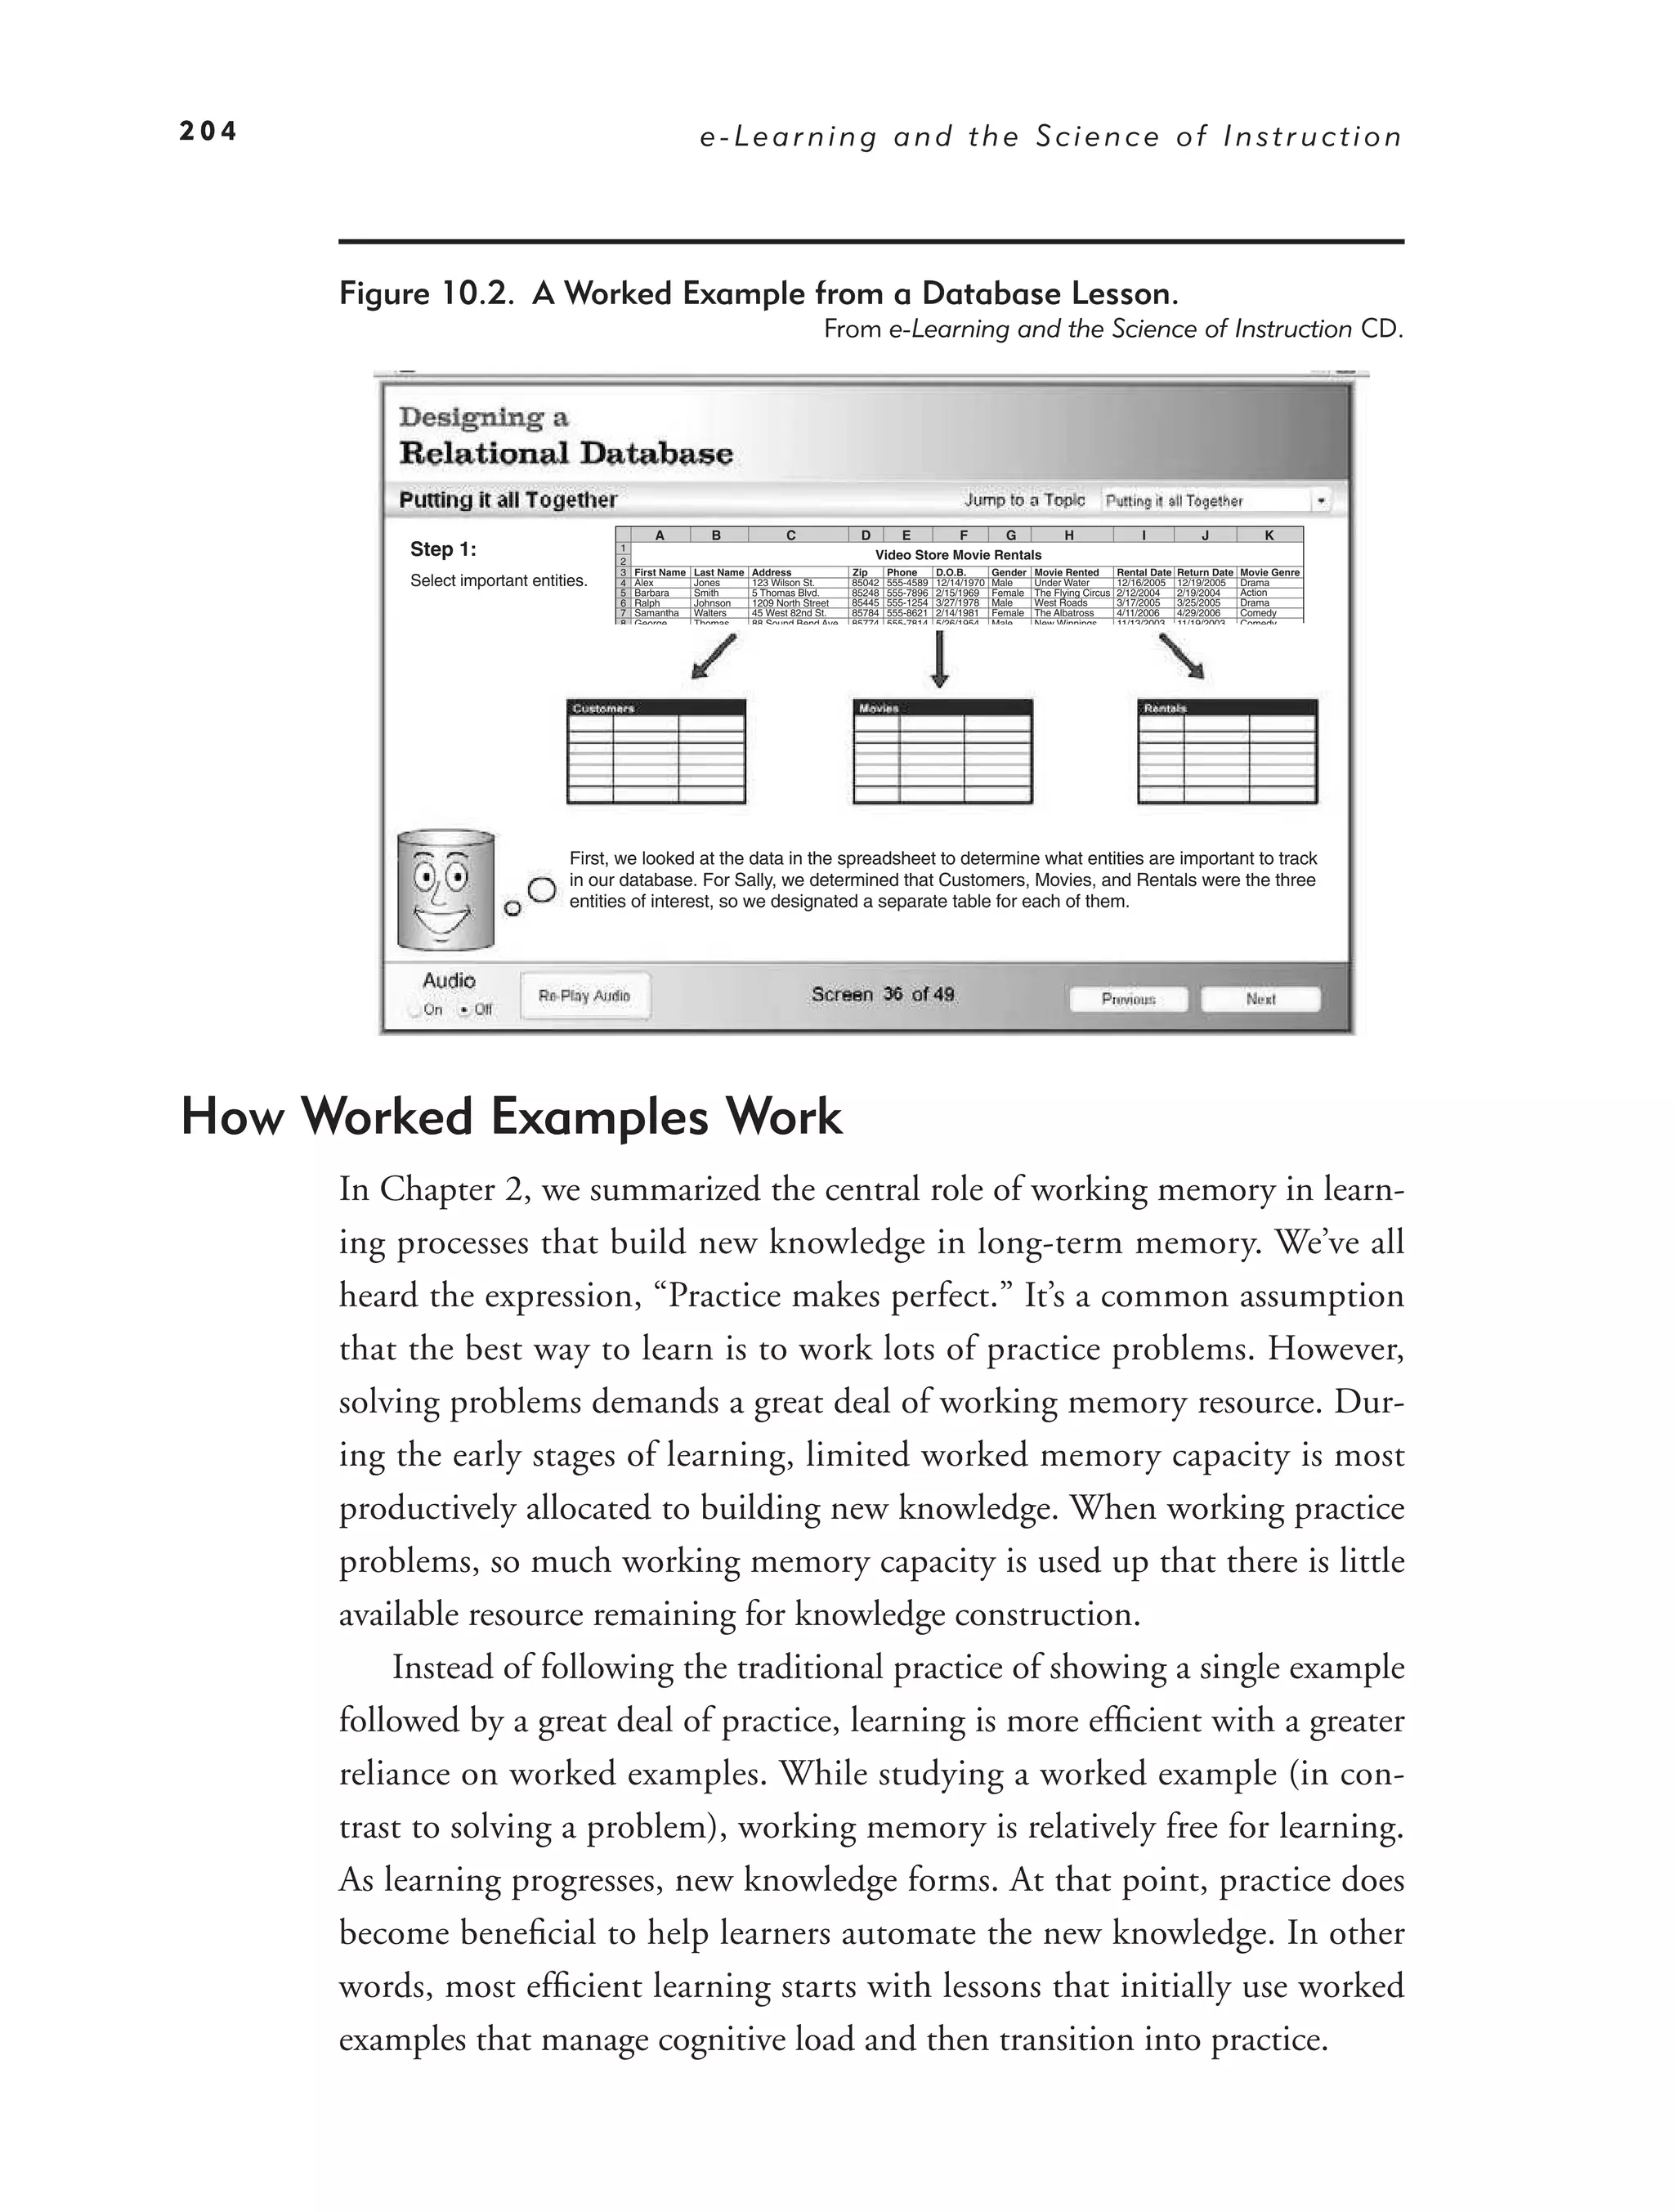
How Worked Examples Work 204
How to Leverage Worked Examples: Overview 206
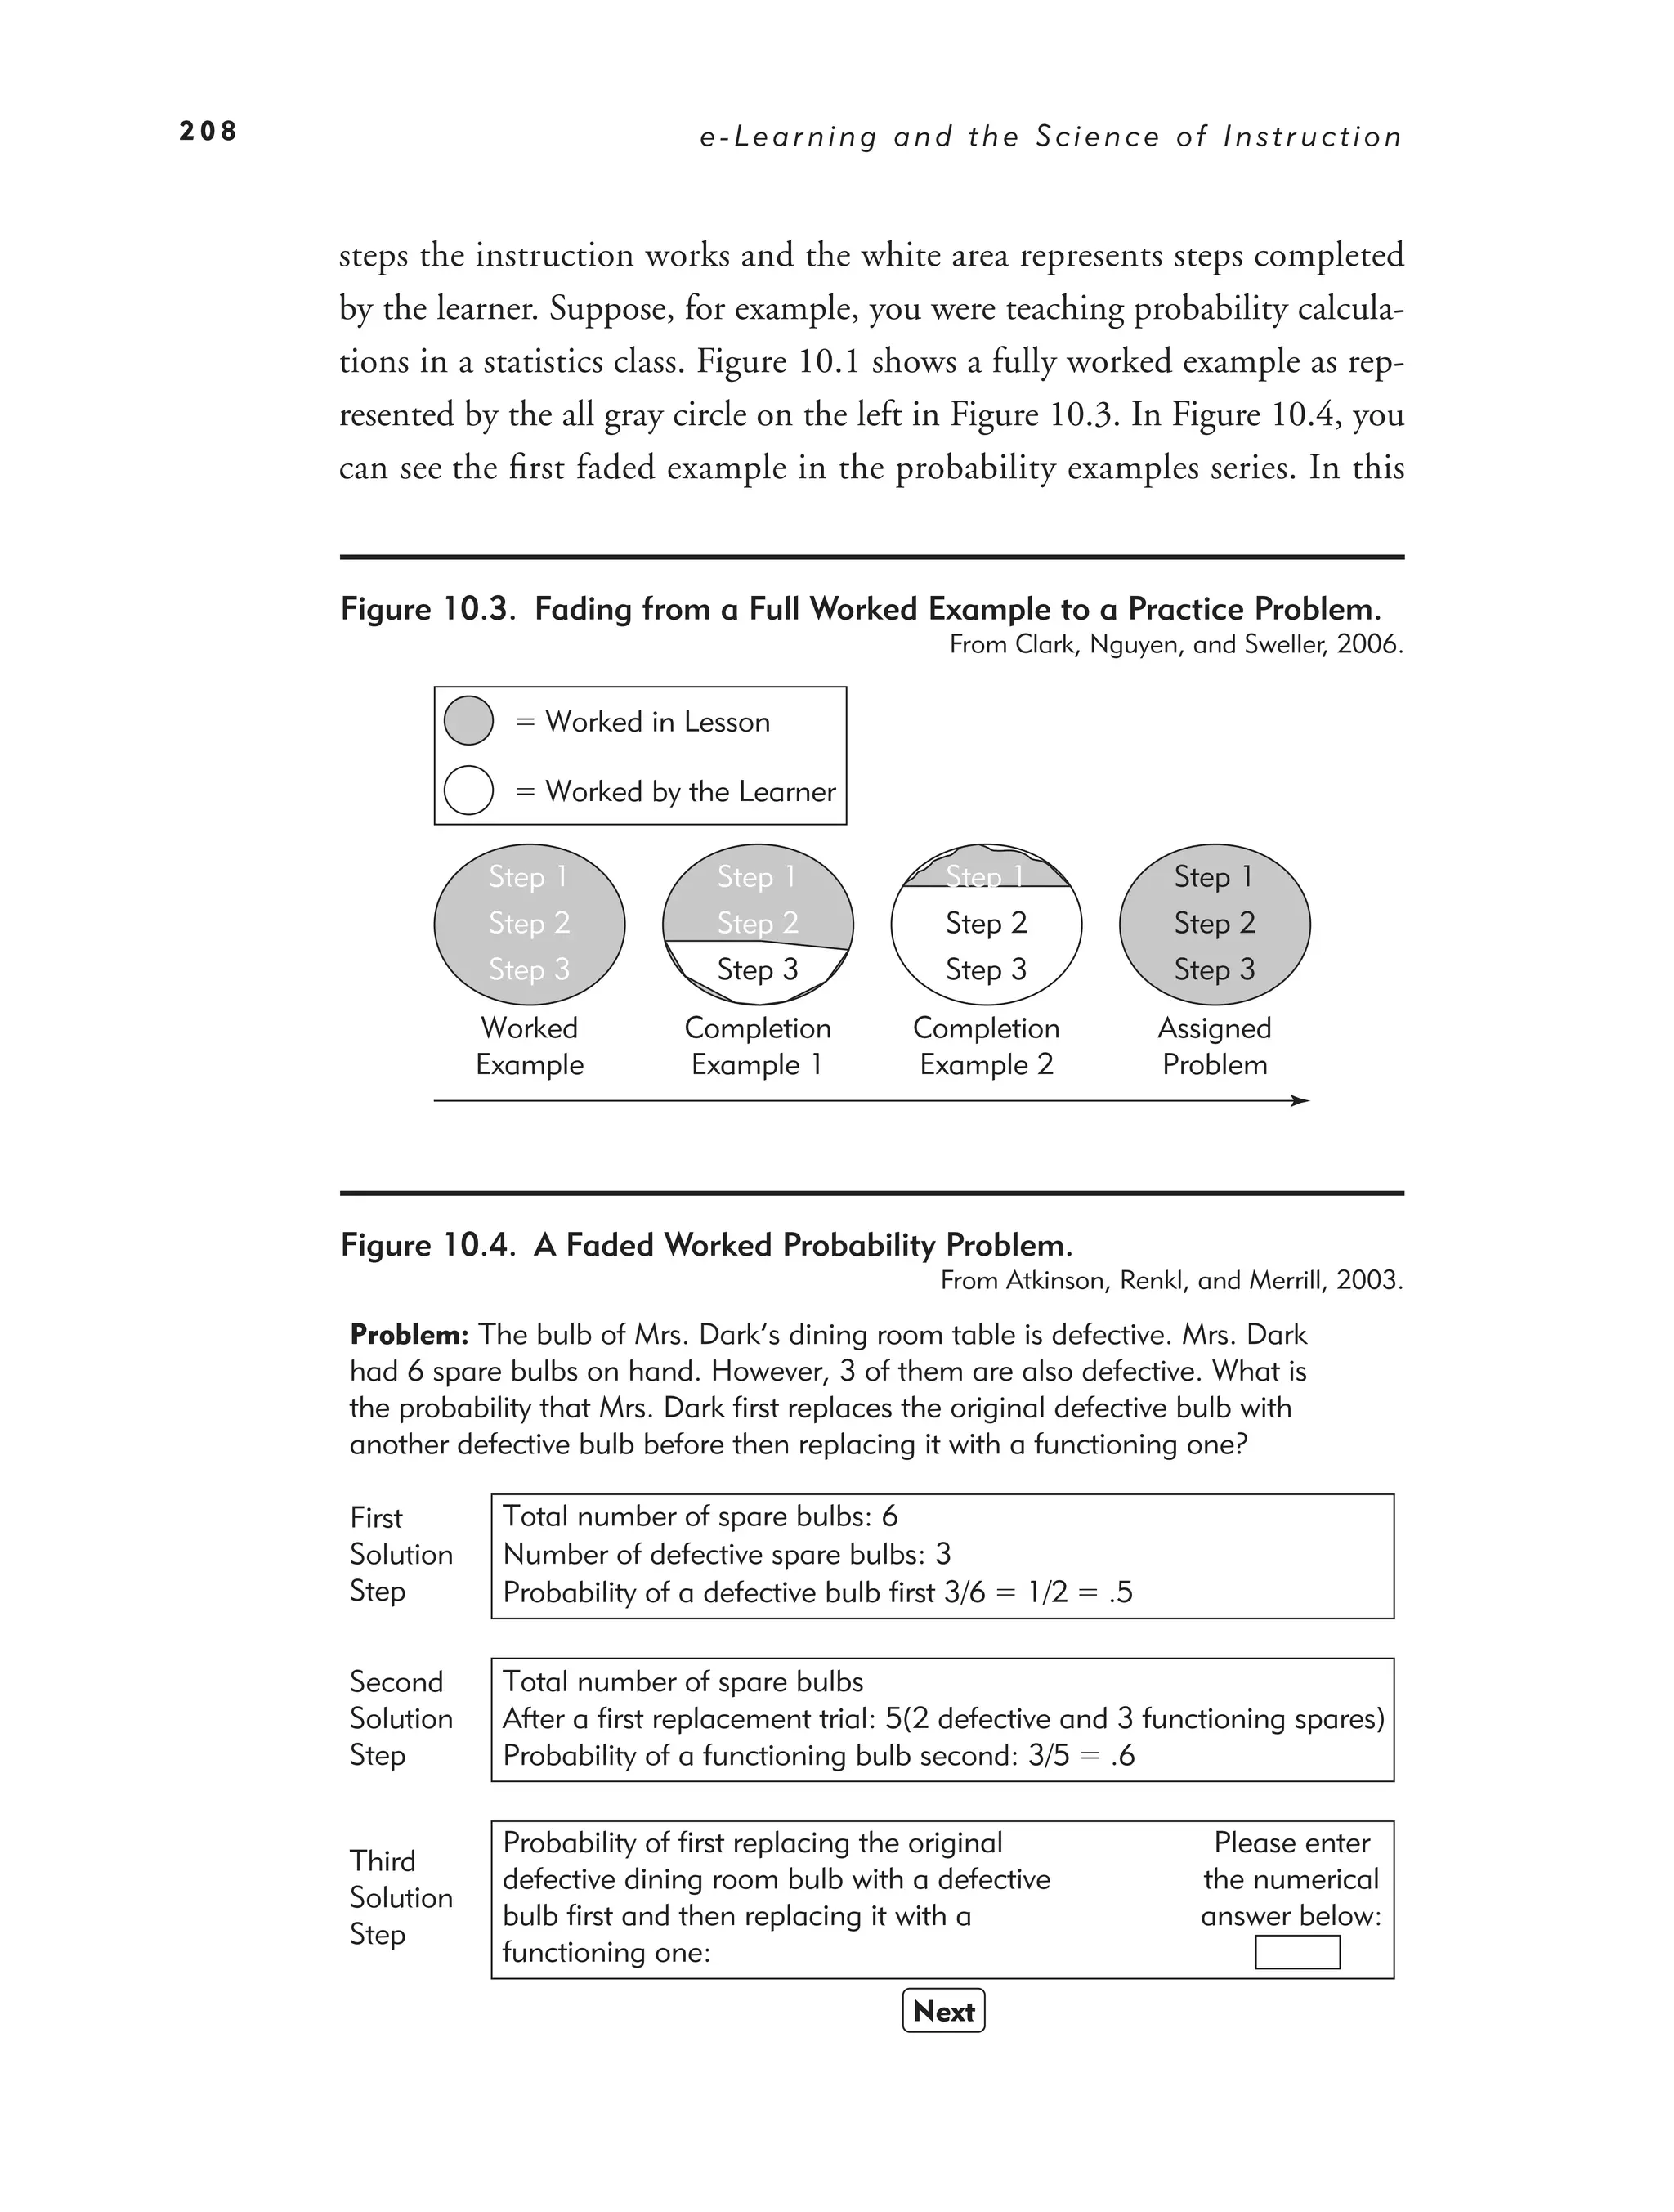
Worked Example Principle 1: Transition from Worked Examples
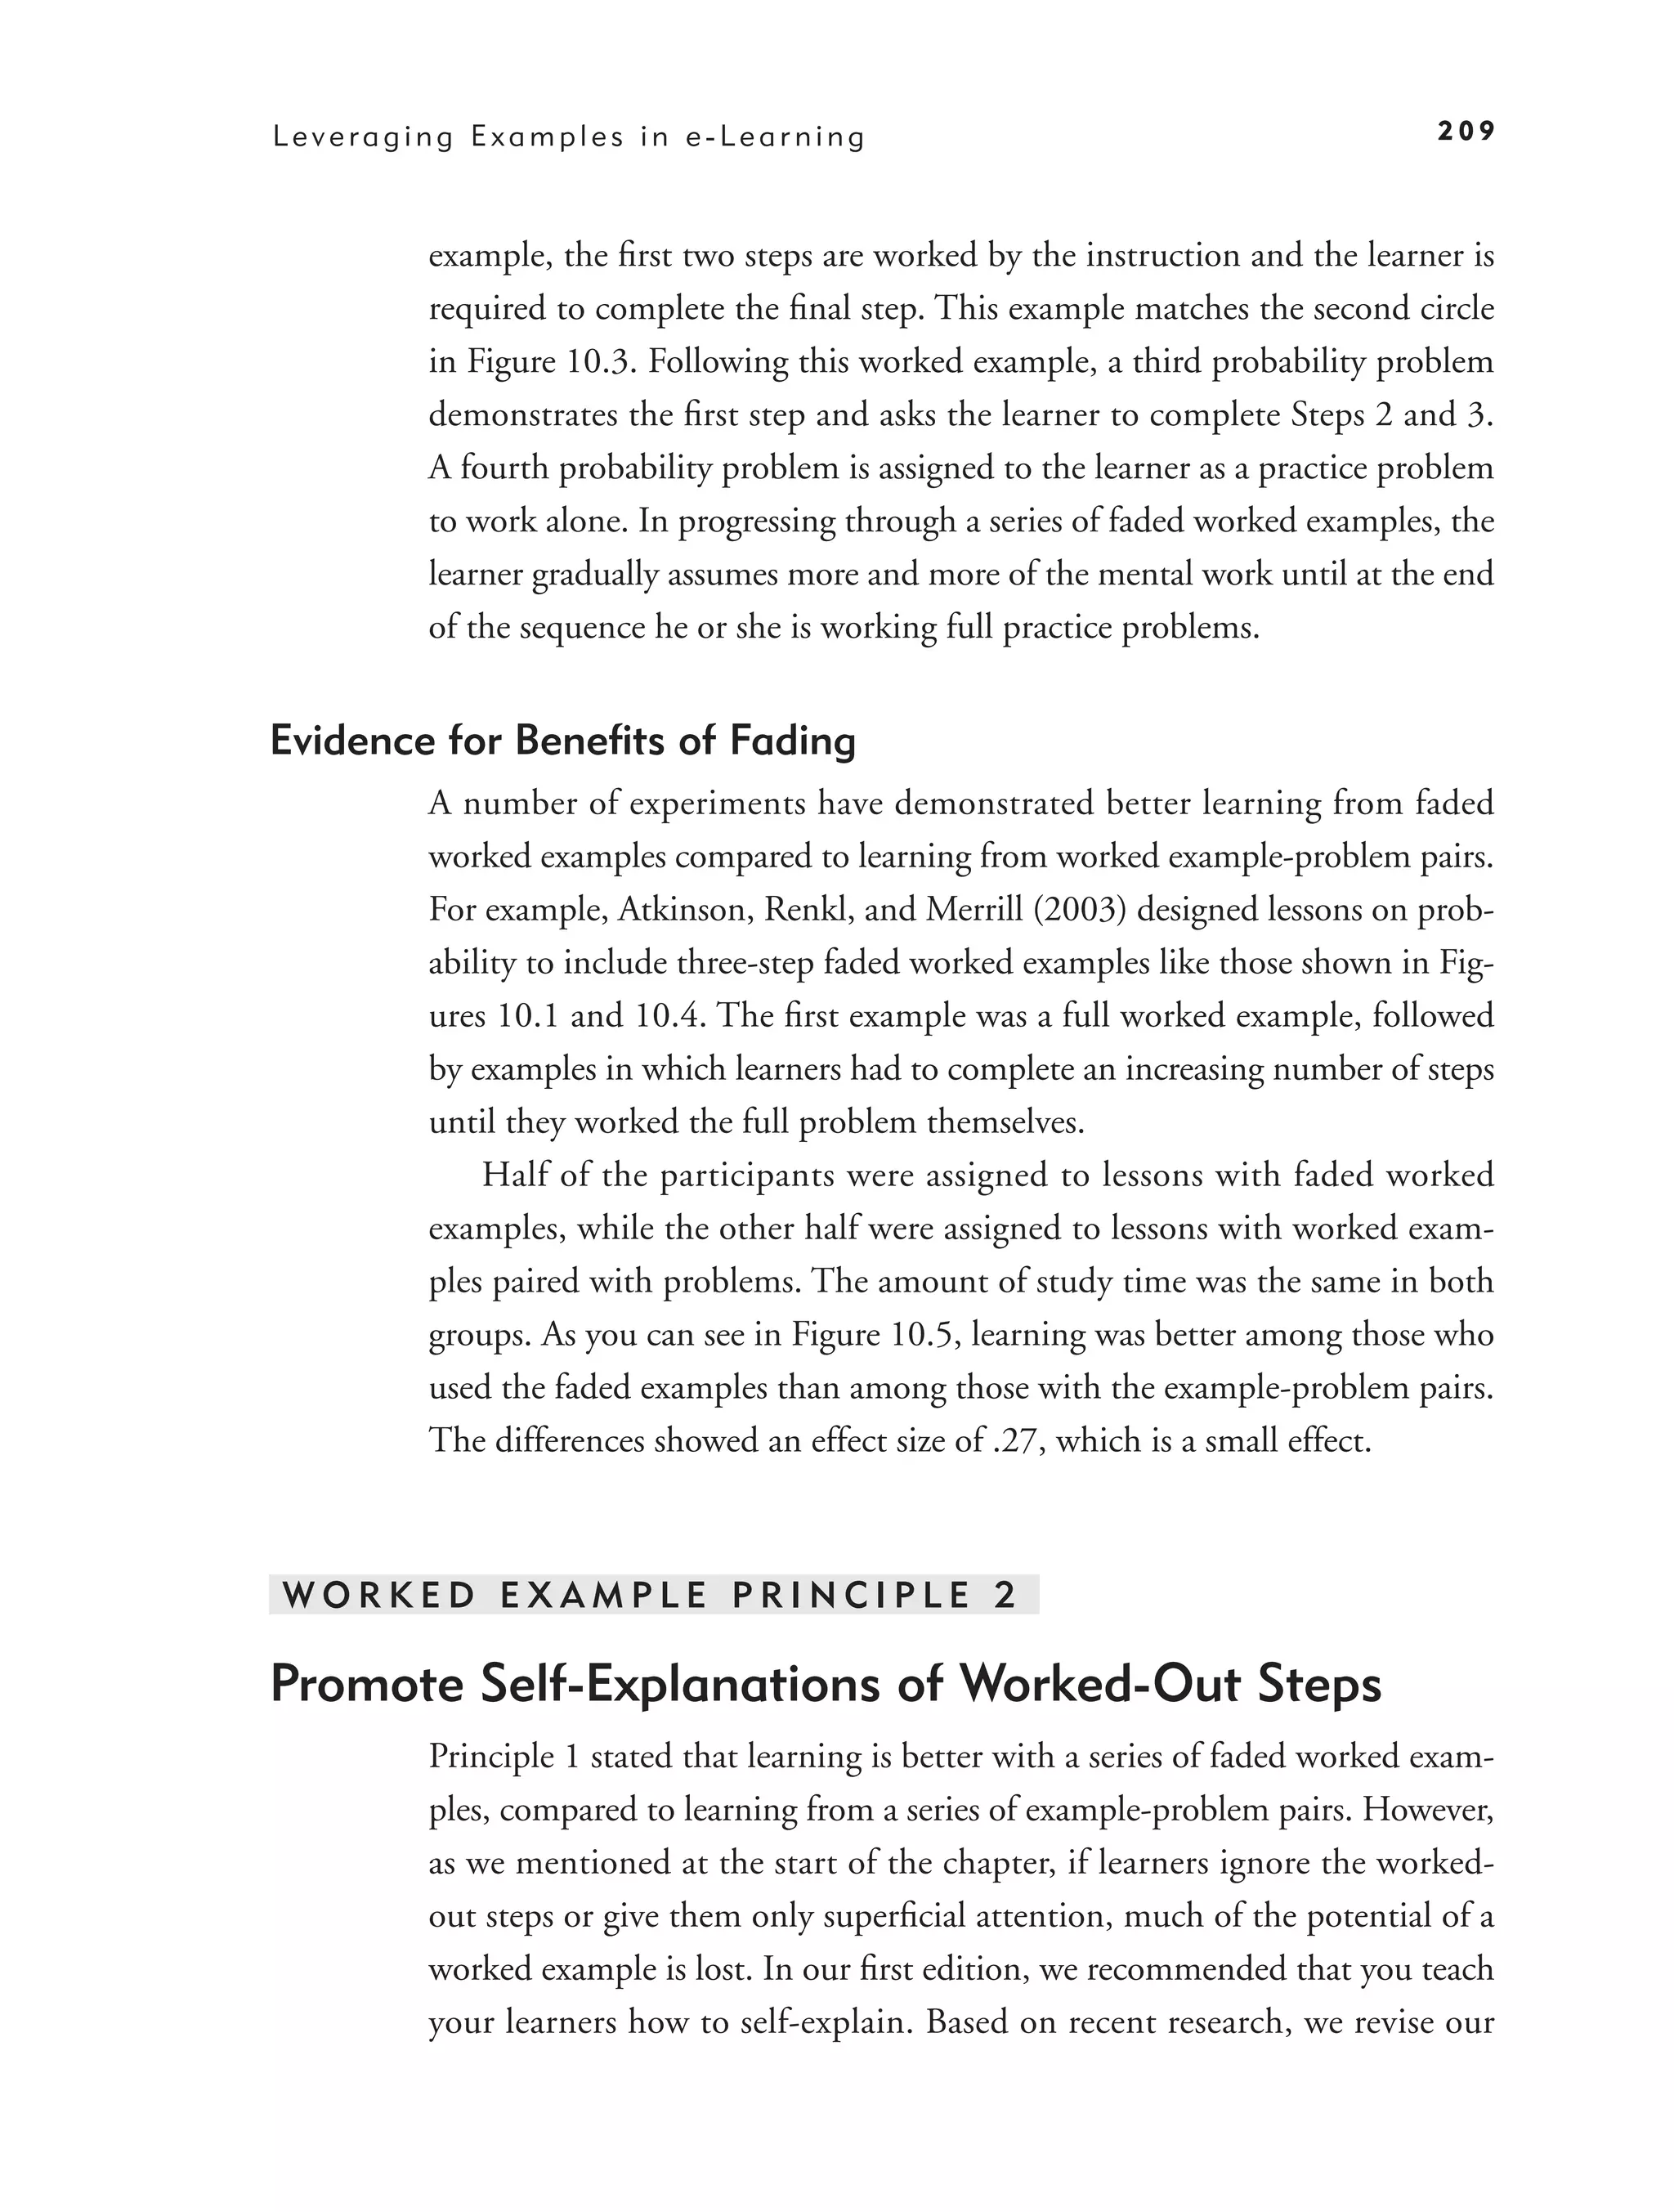
to Problems via Fading 207
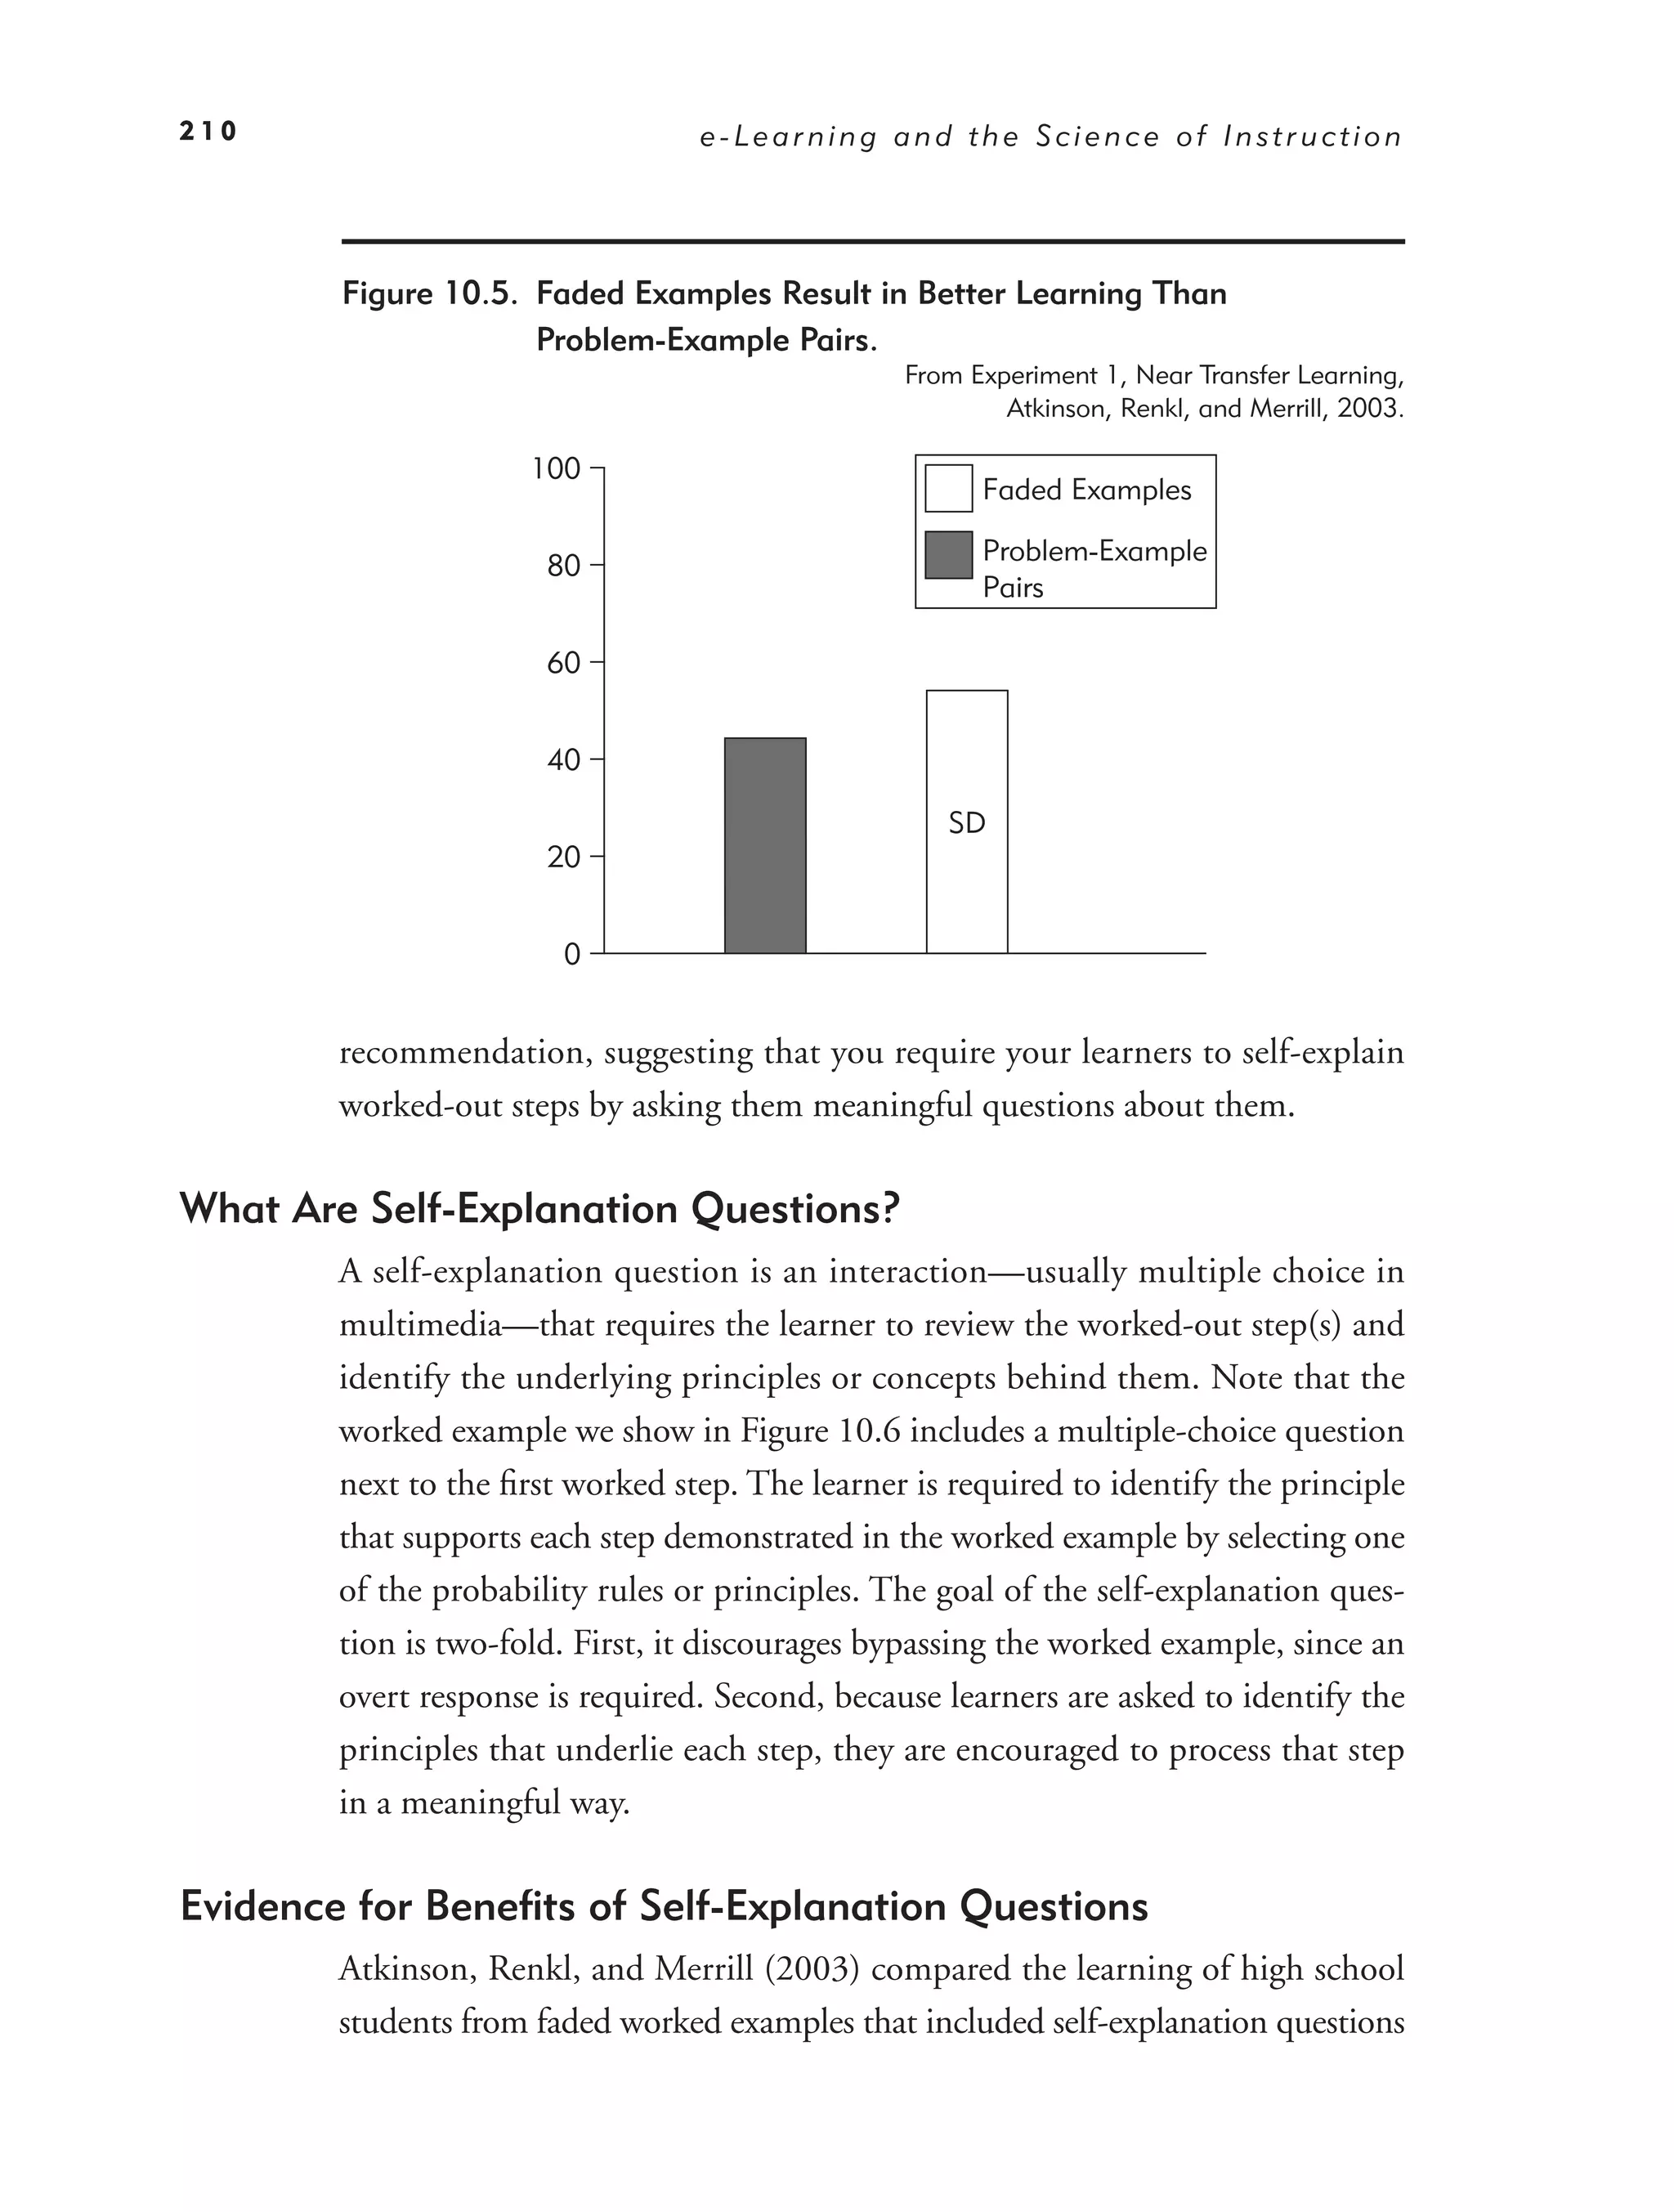
Worked Example Principle 2: Promote Self-Explanations of
Worked-Out Steps 209
Worked Example Principle 3: Supplement Worked Examples with
Explanations 212
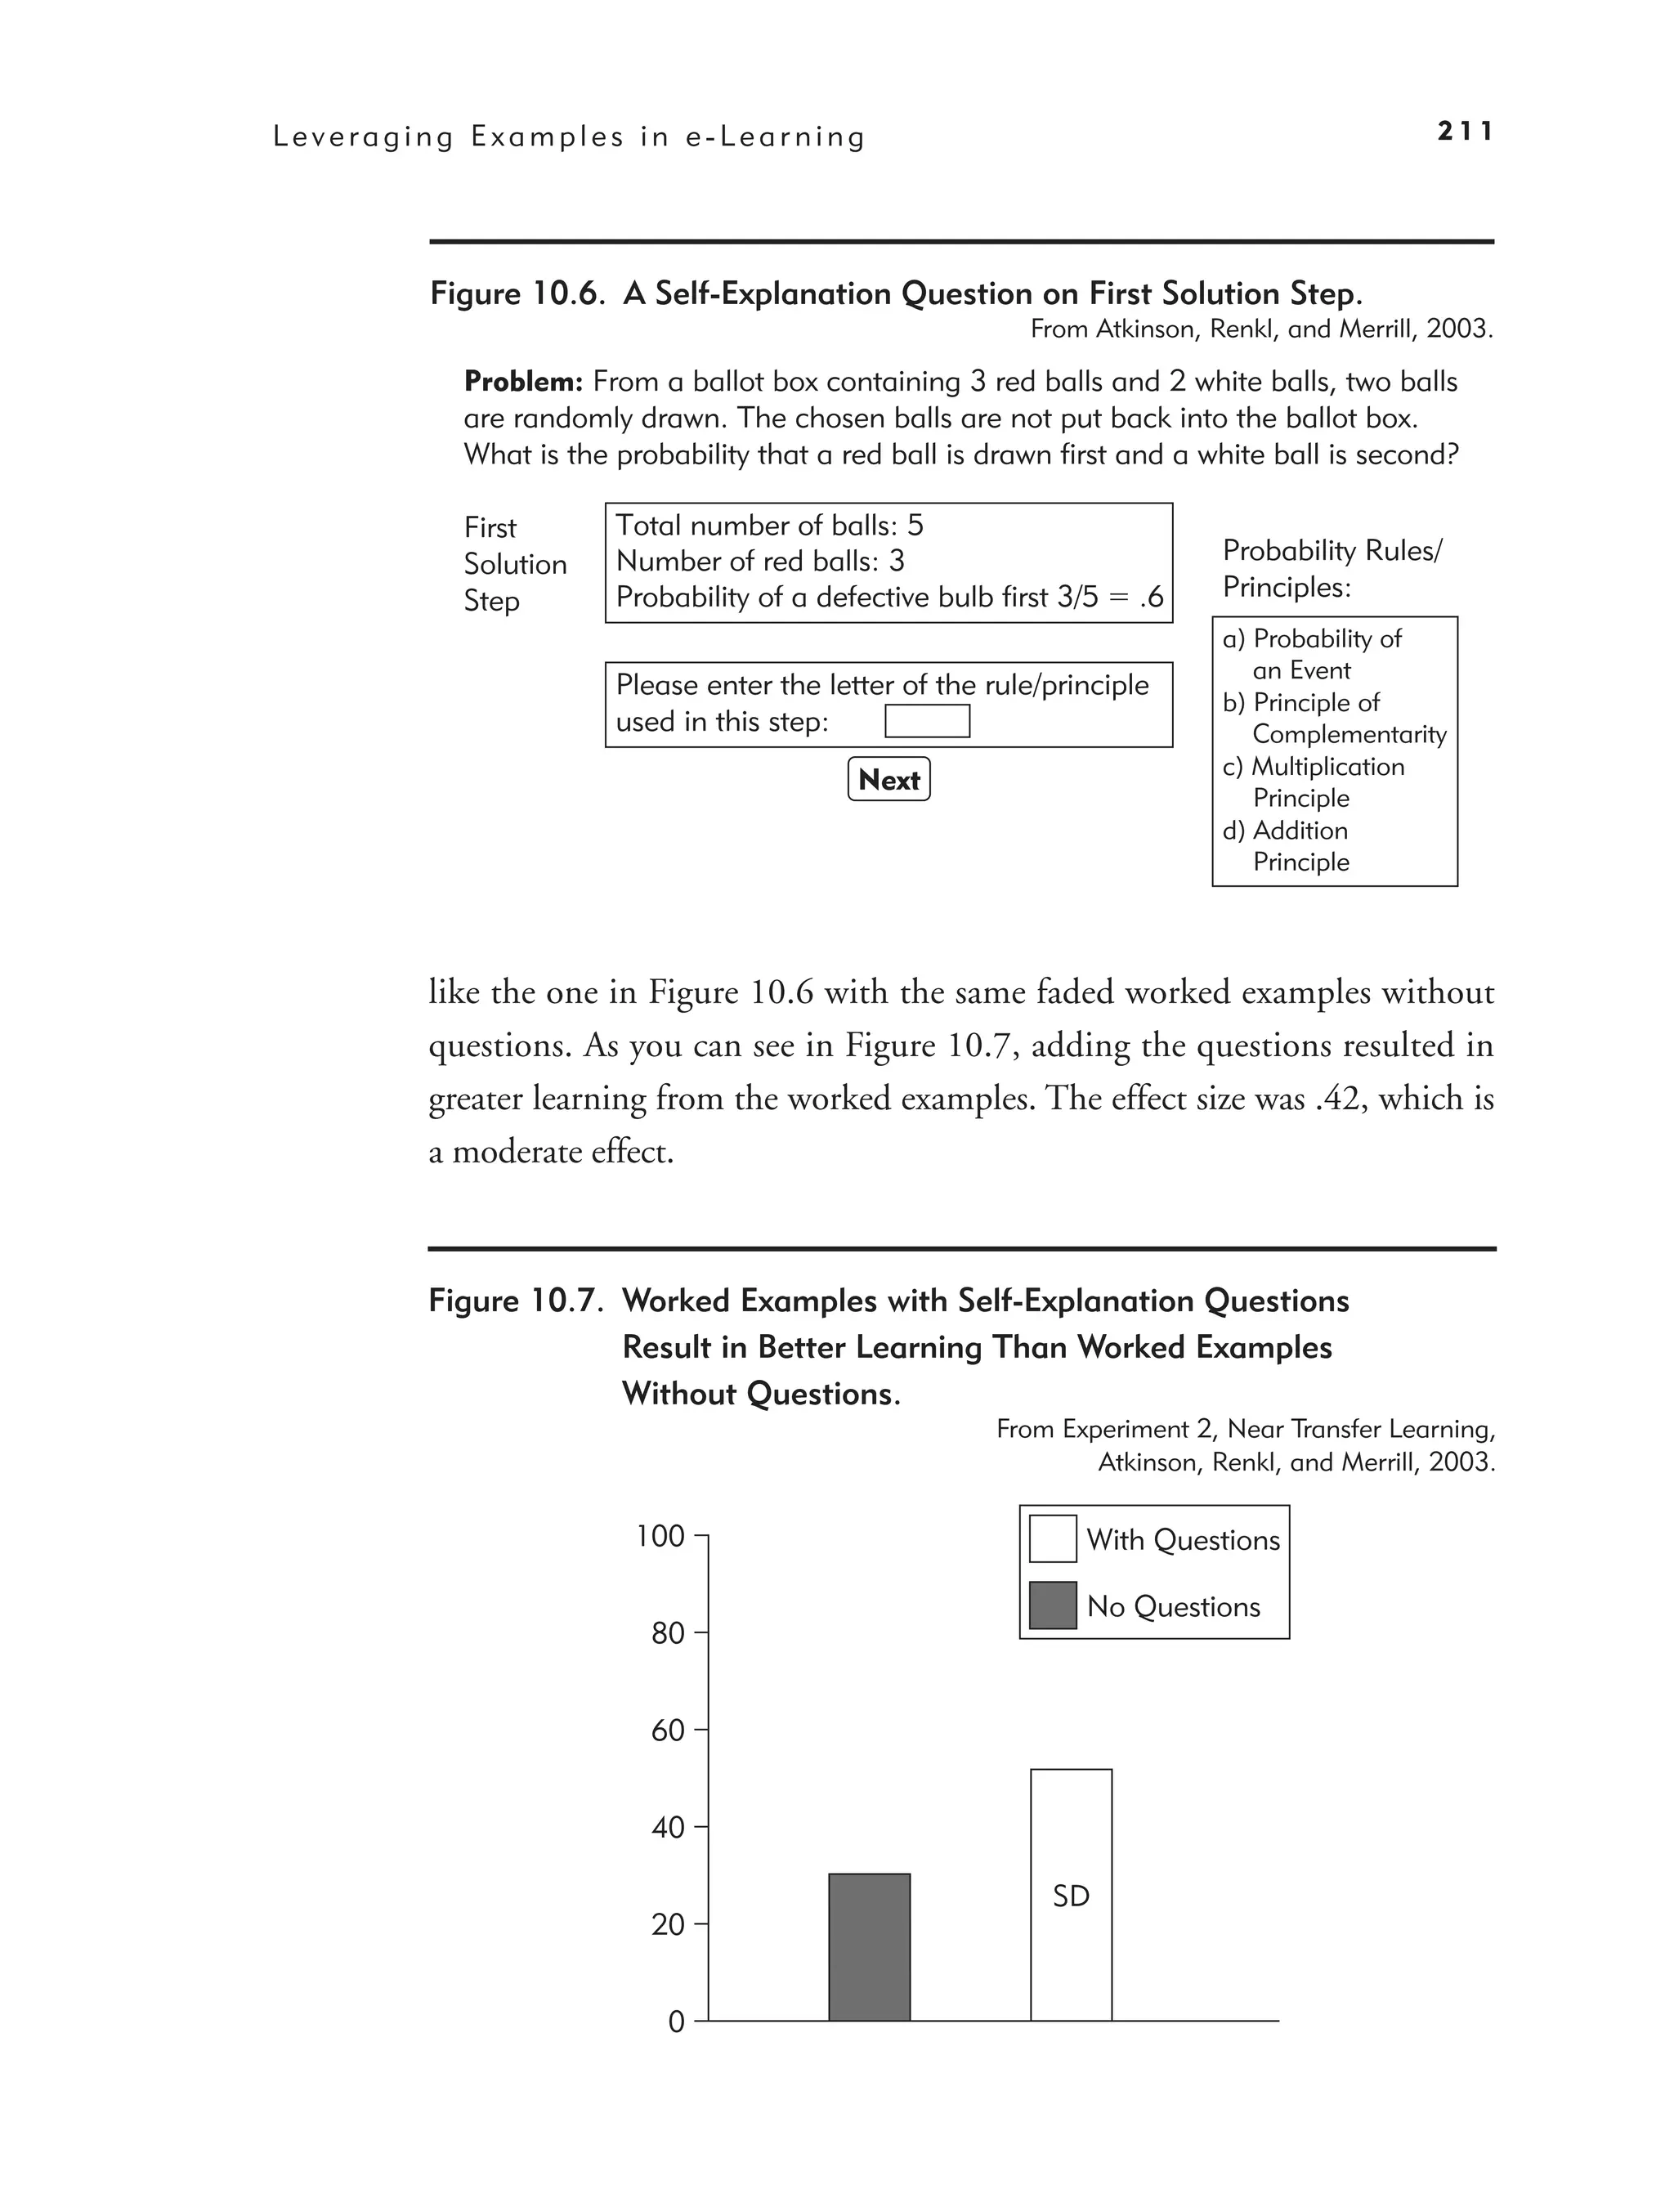
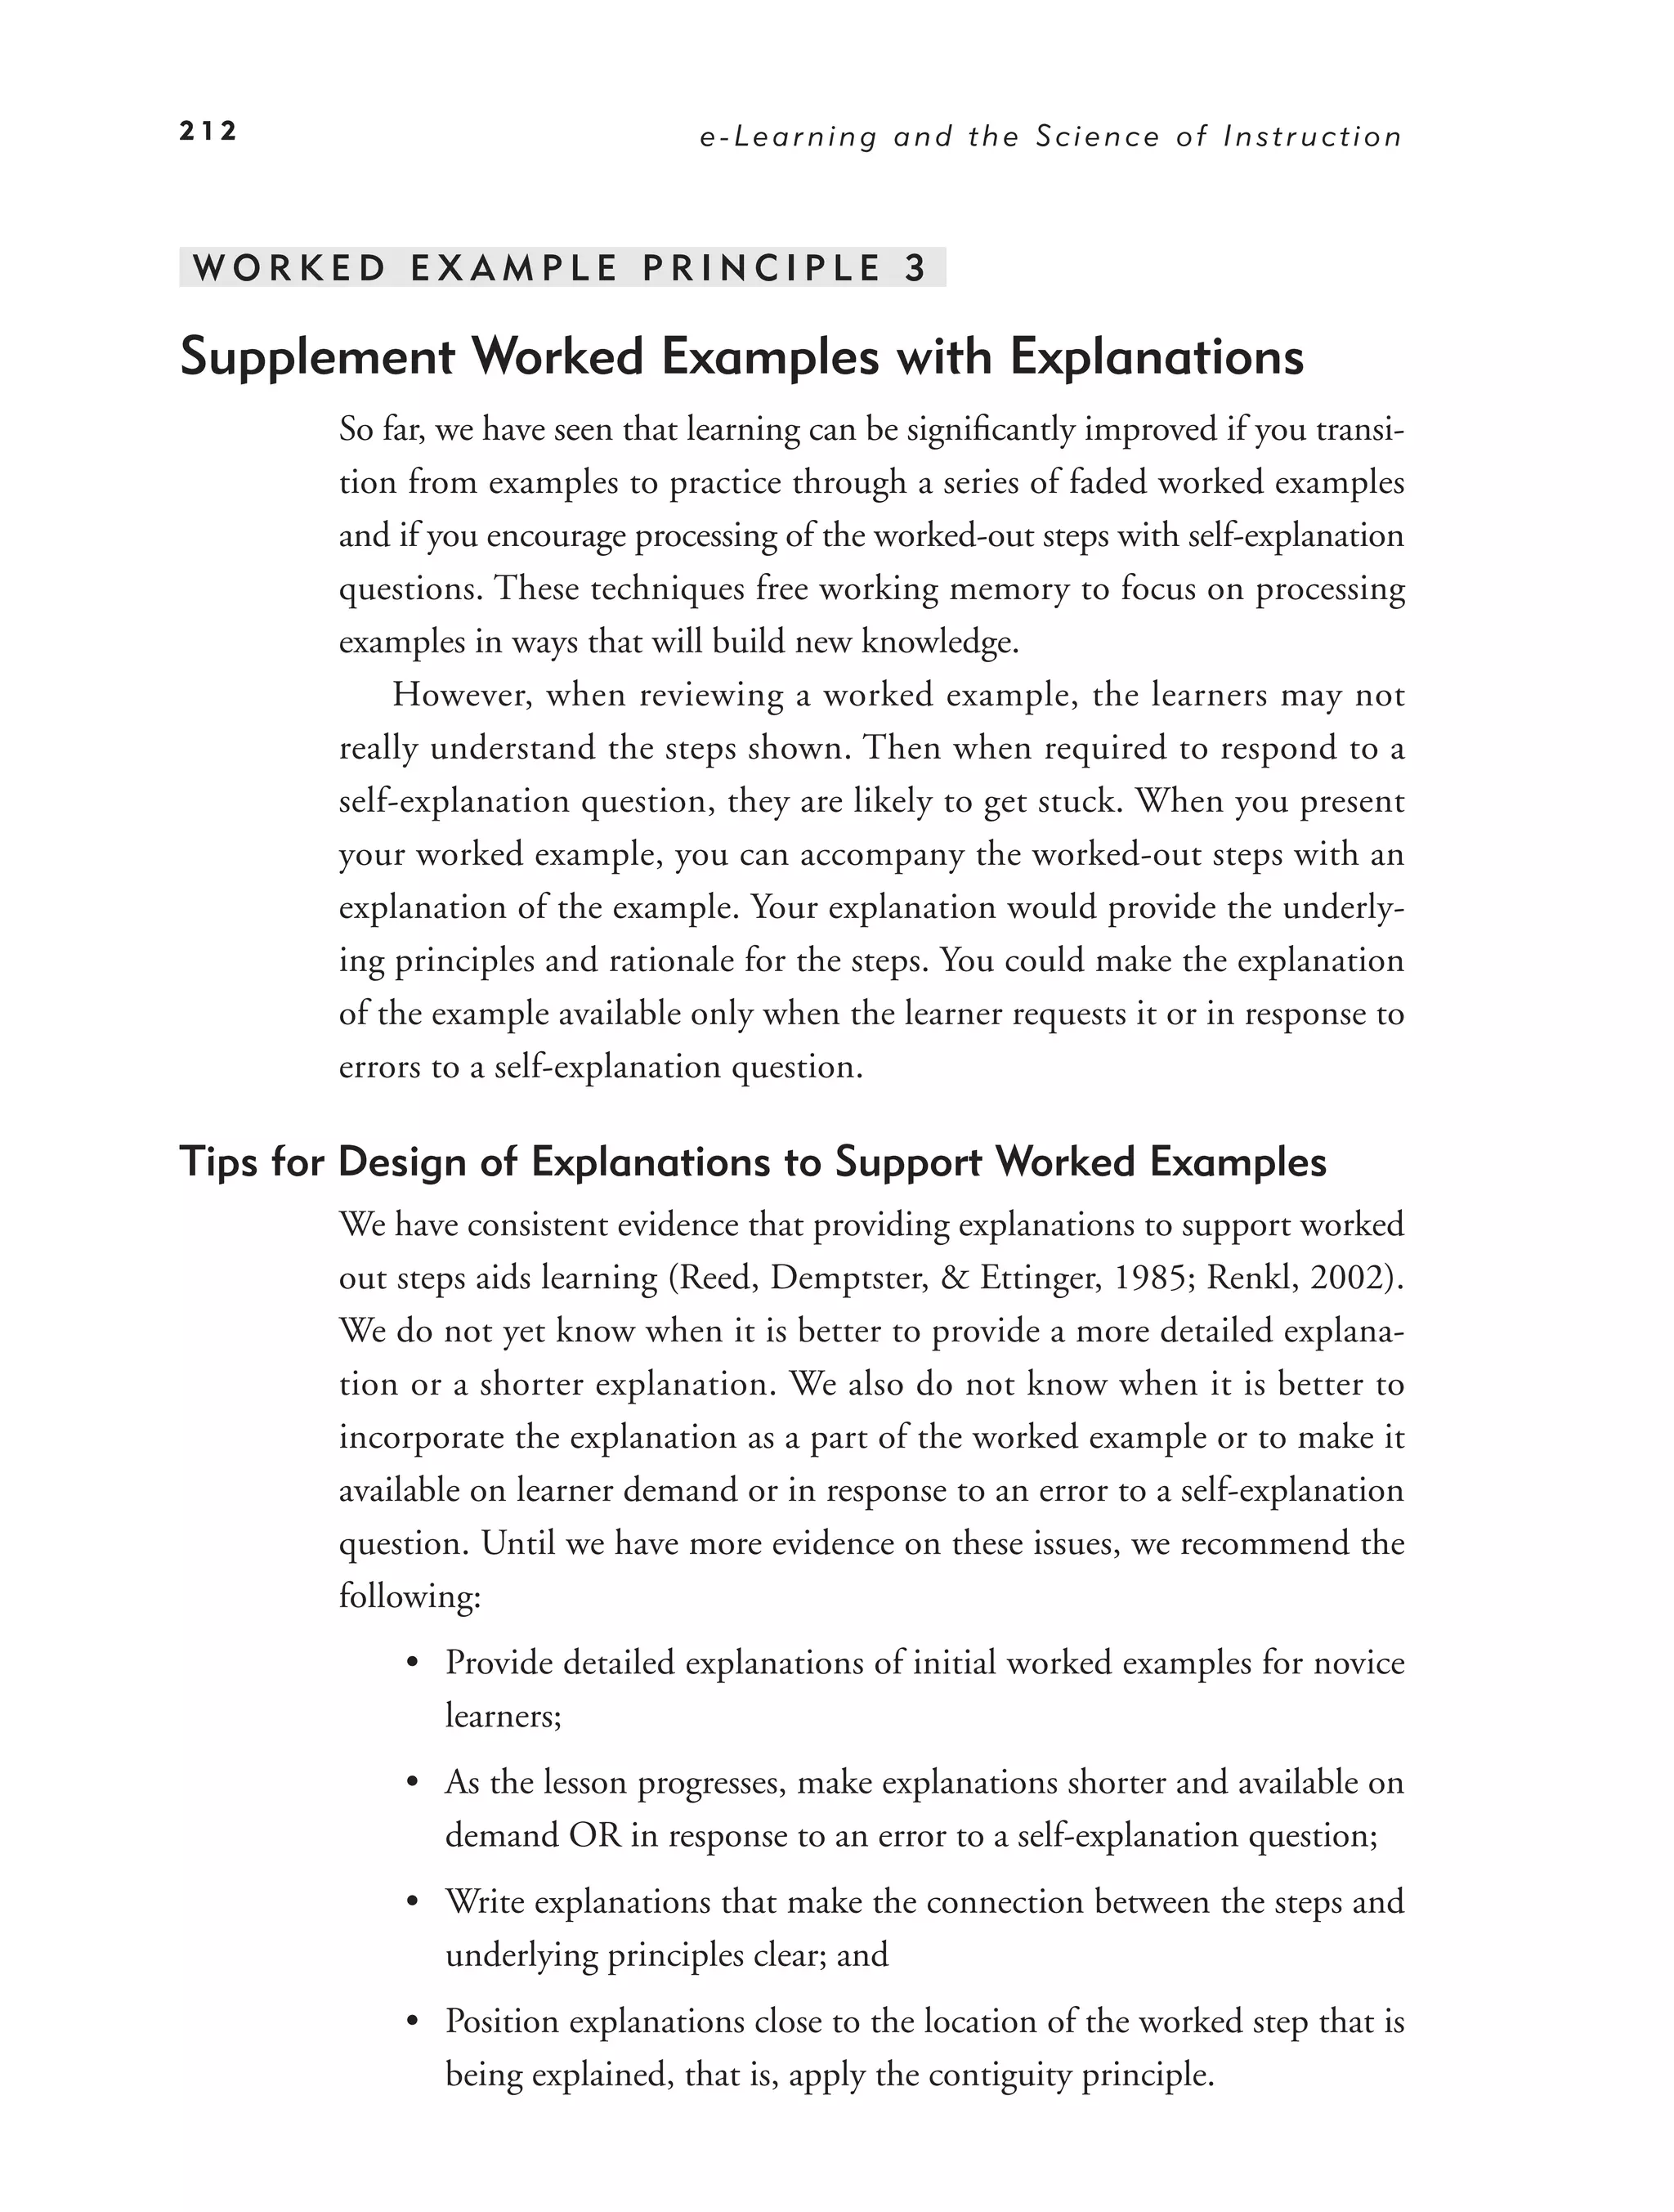
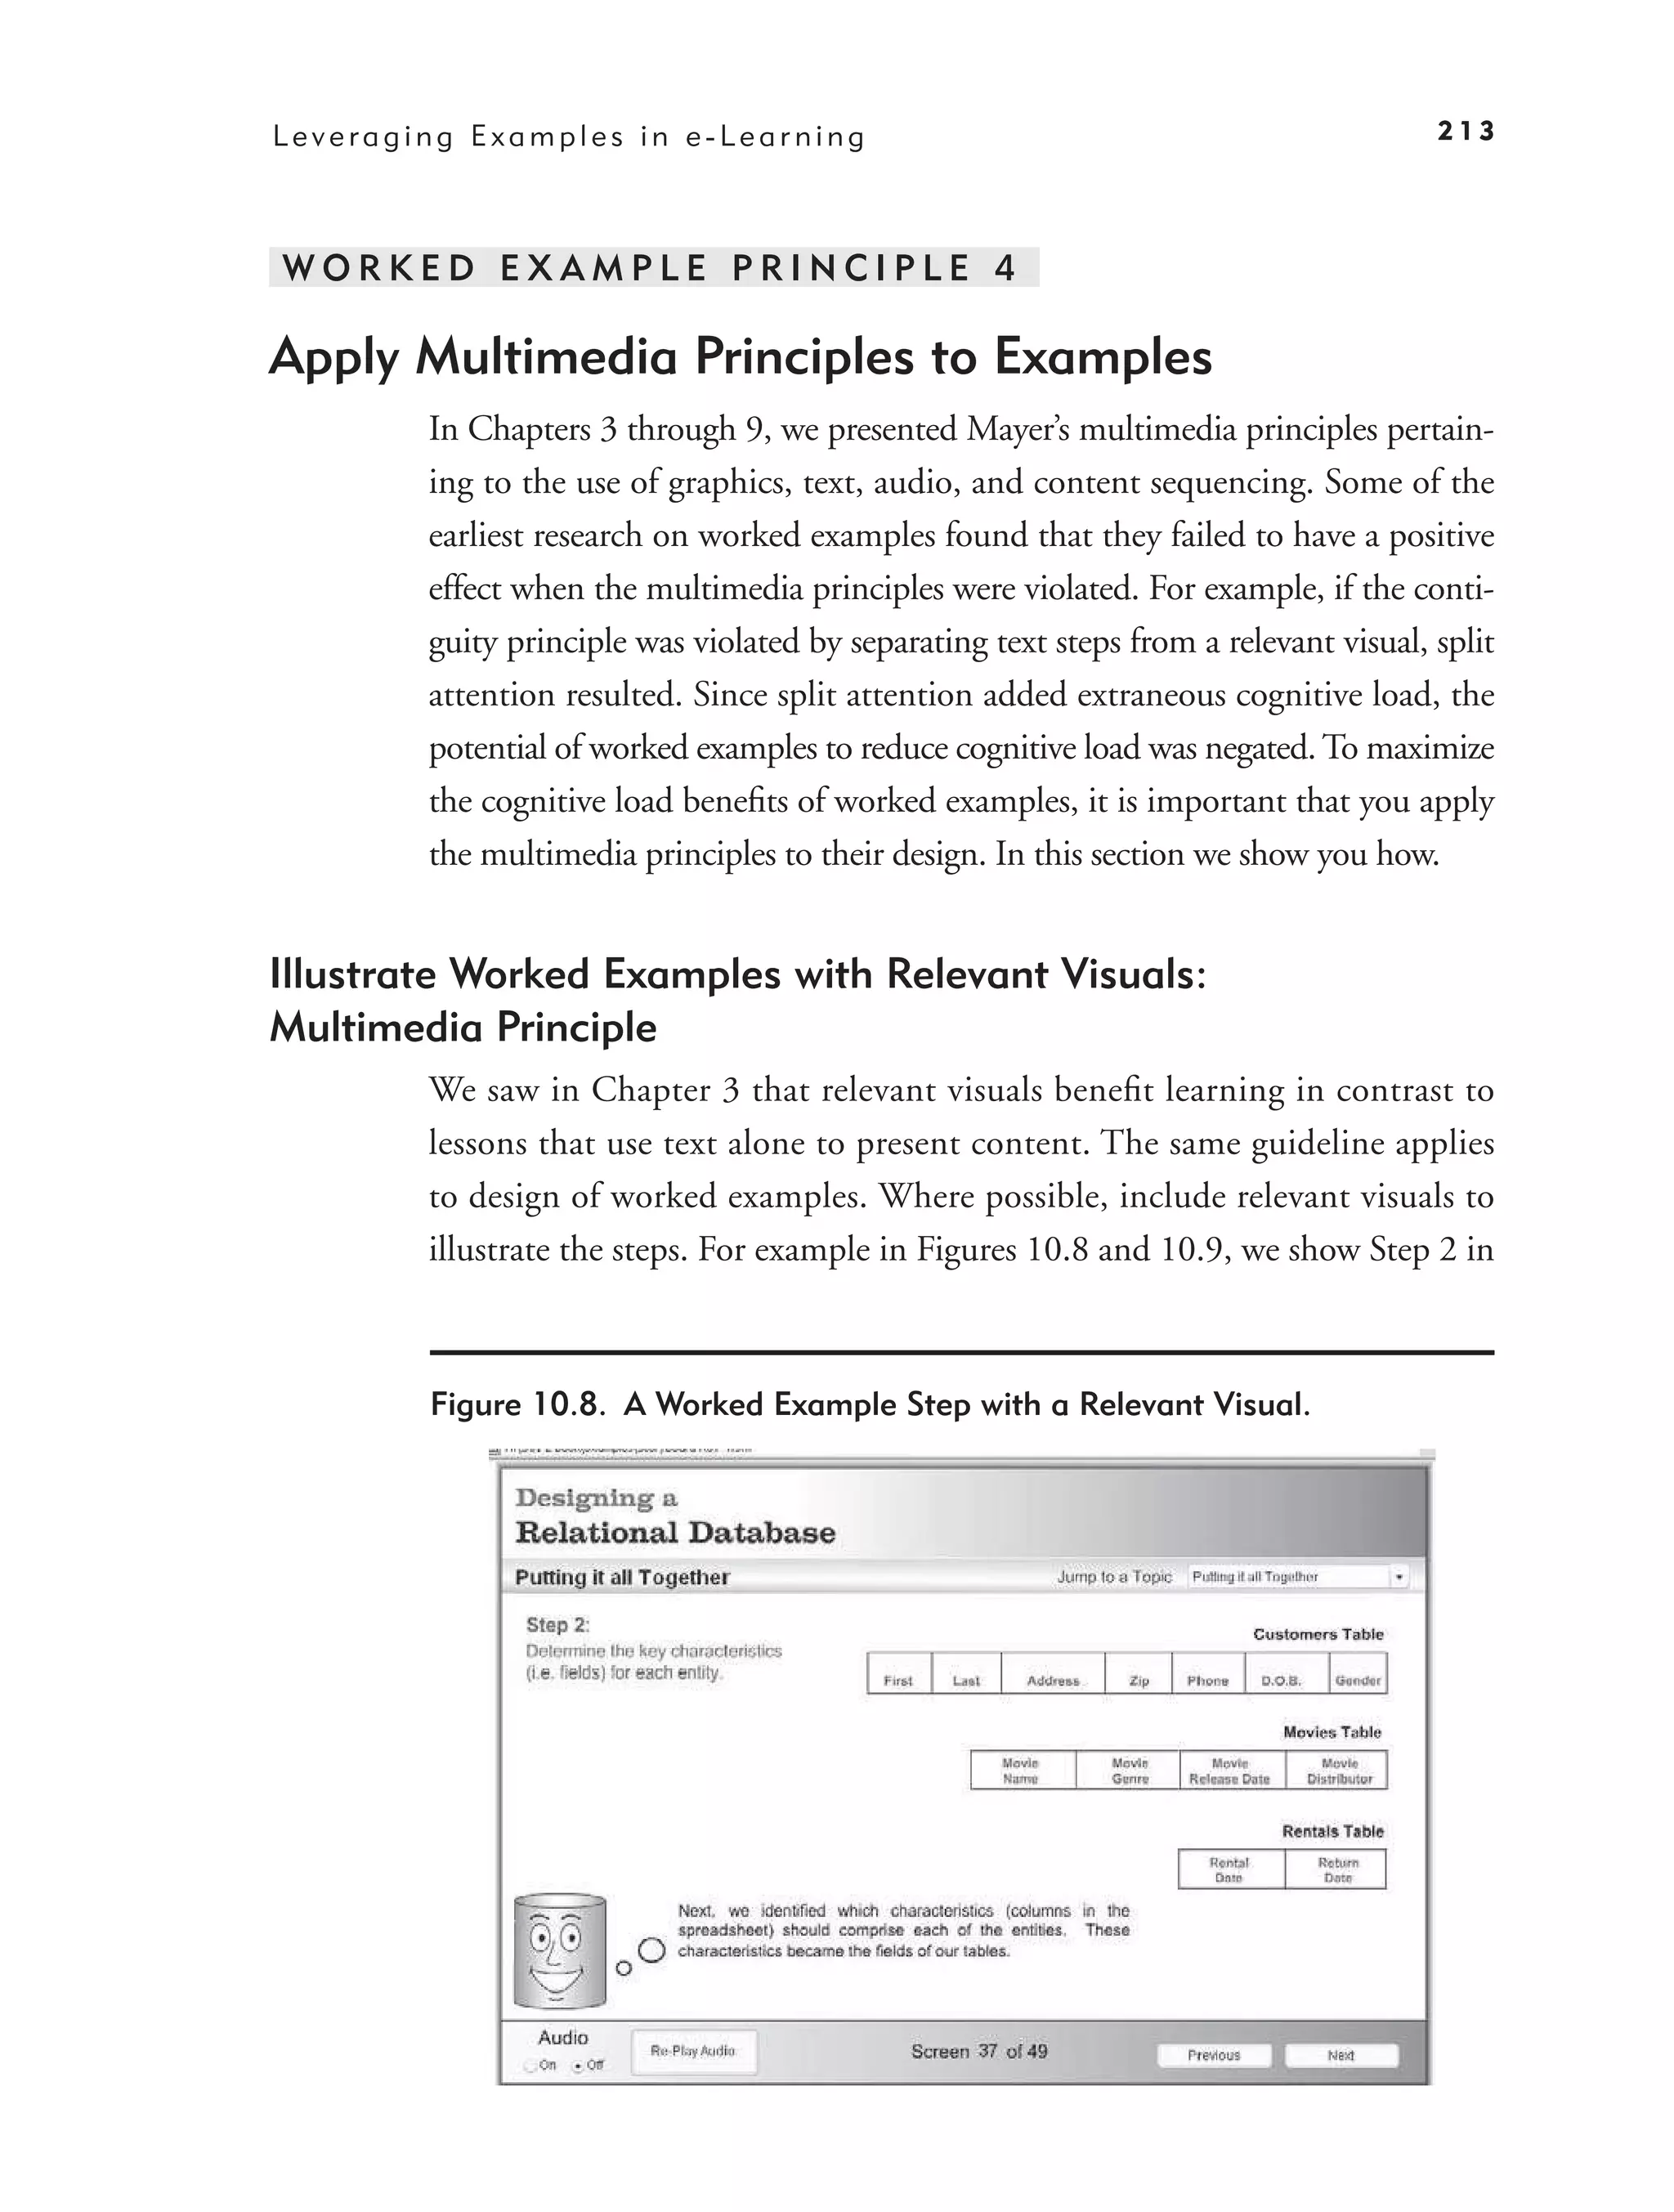
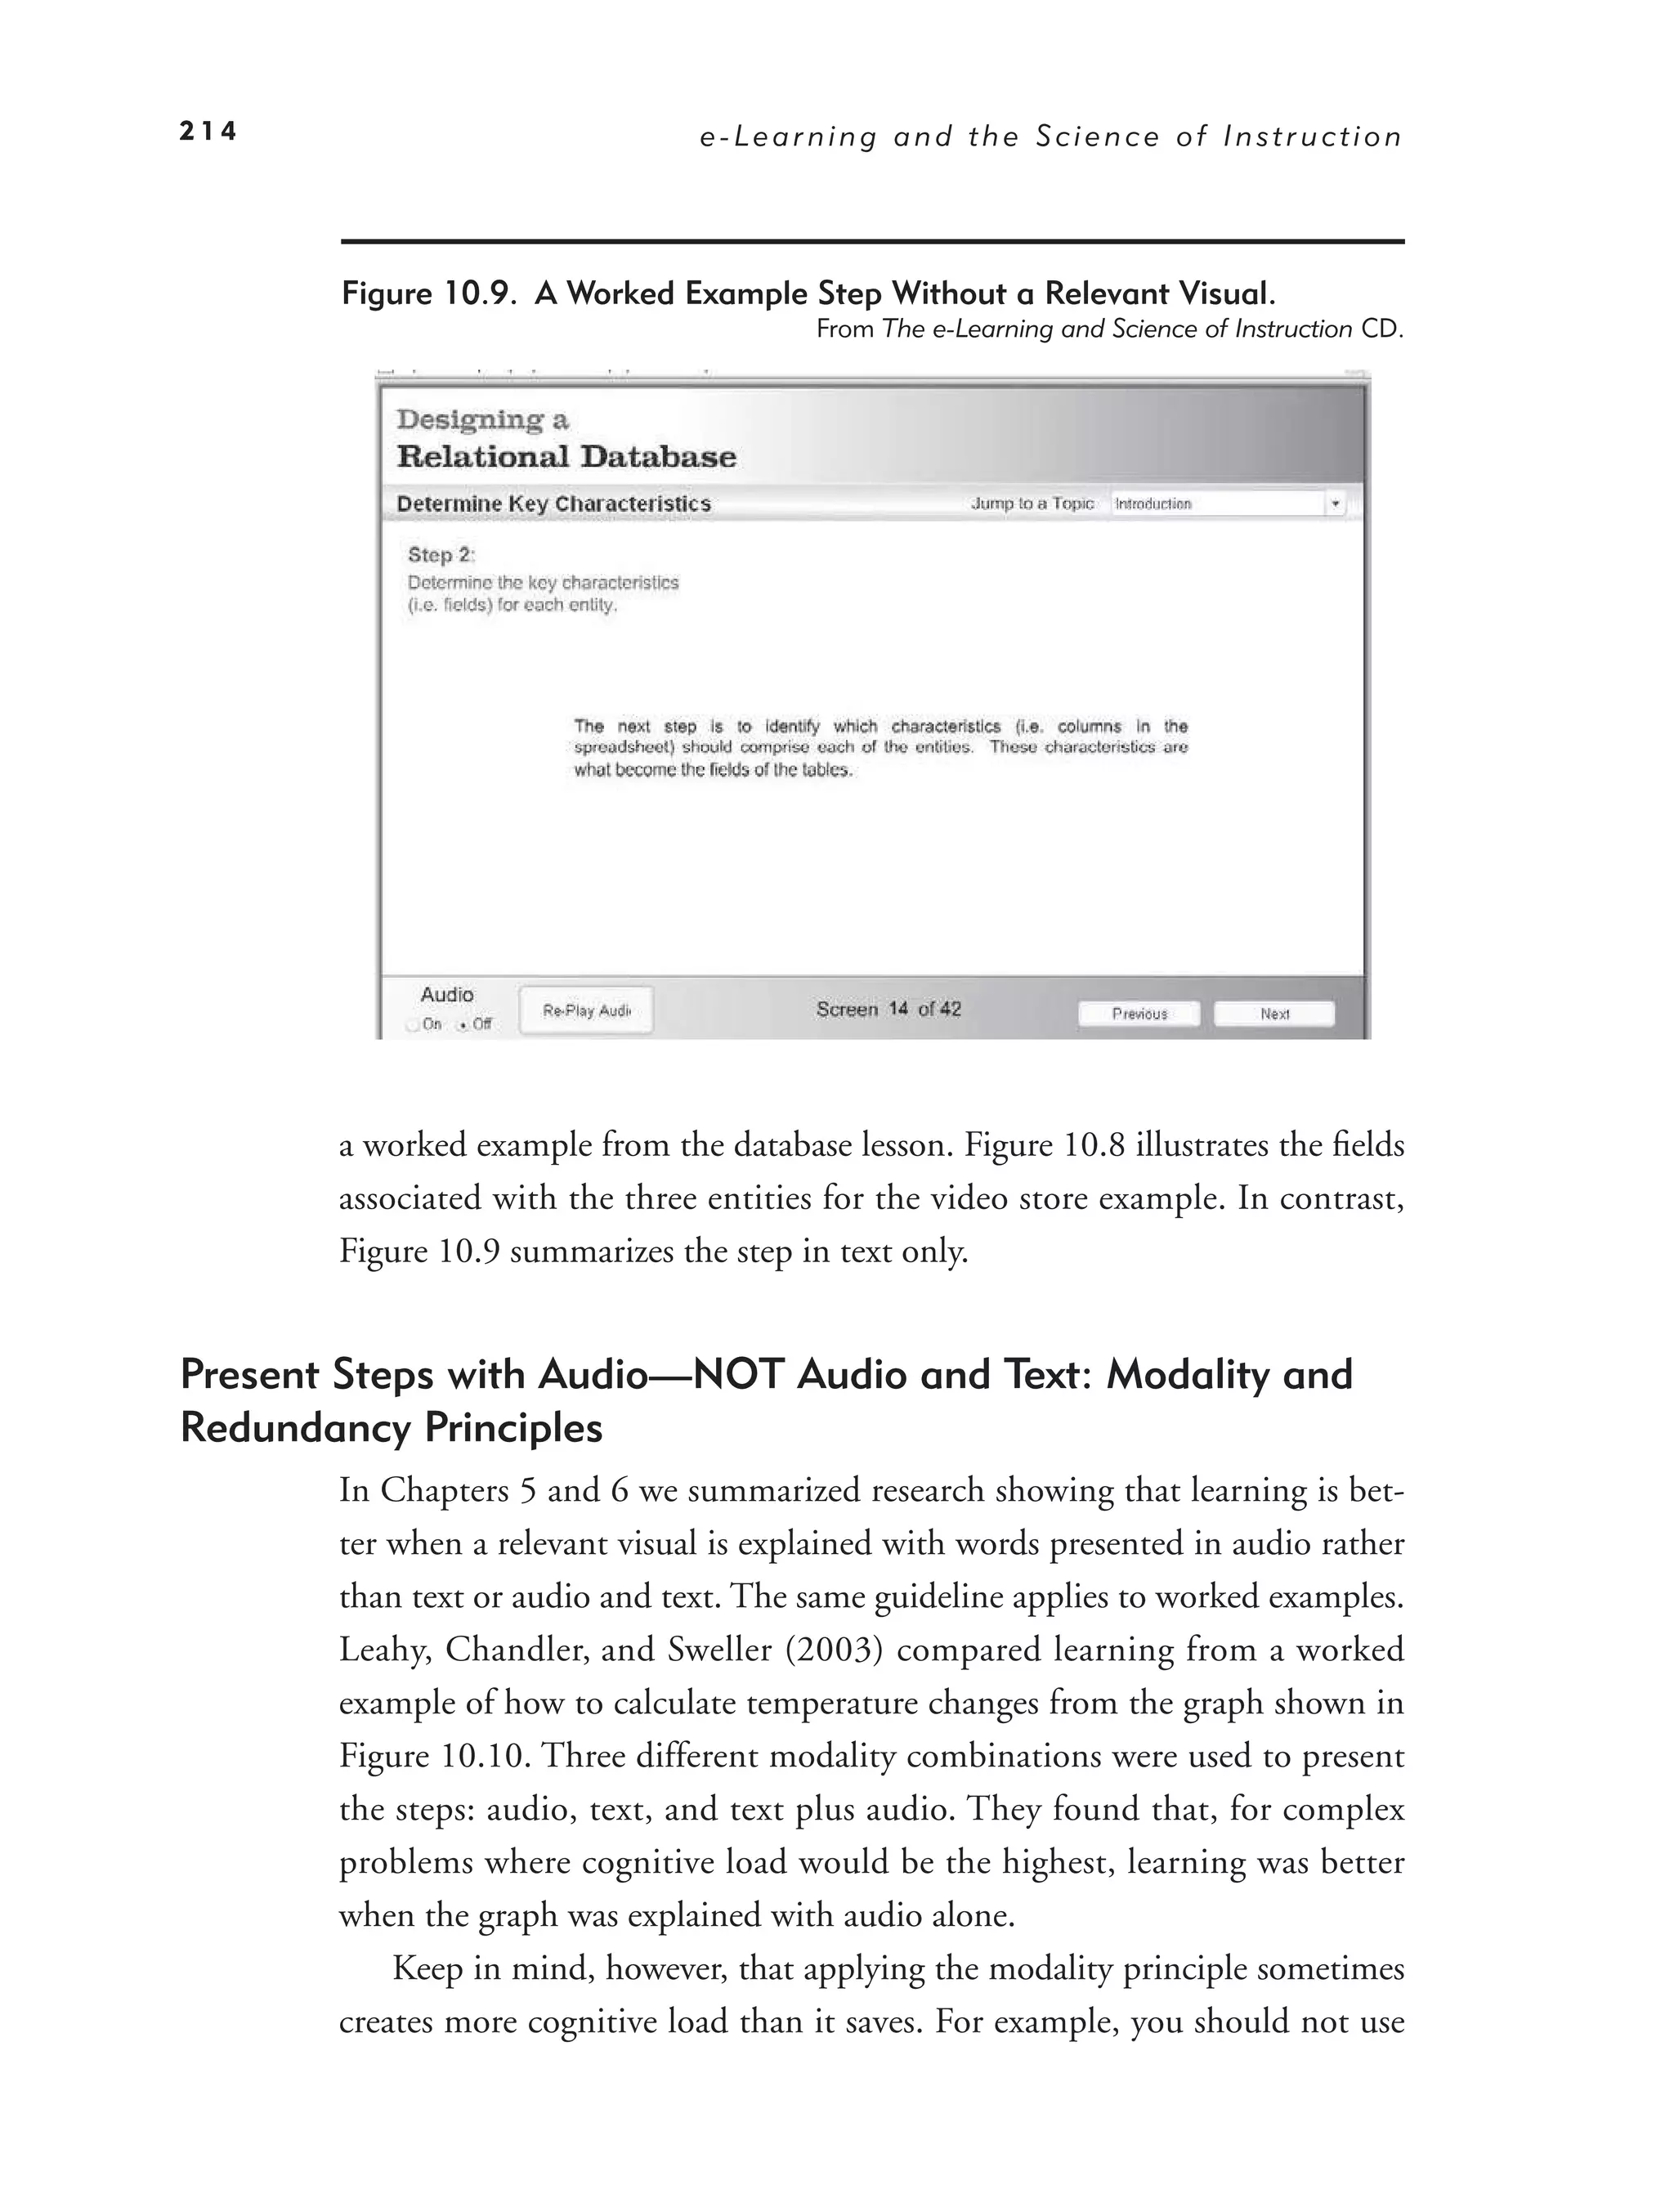
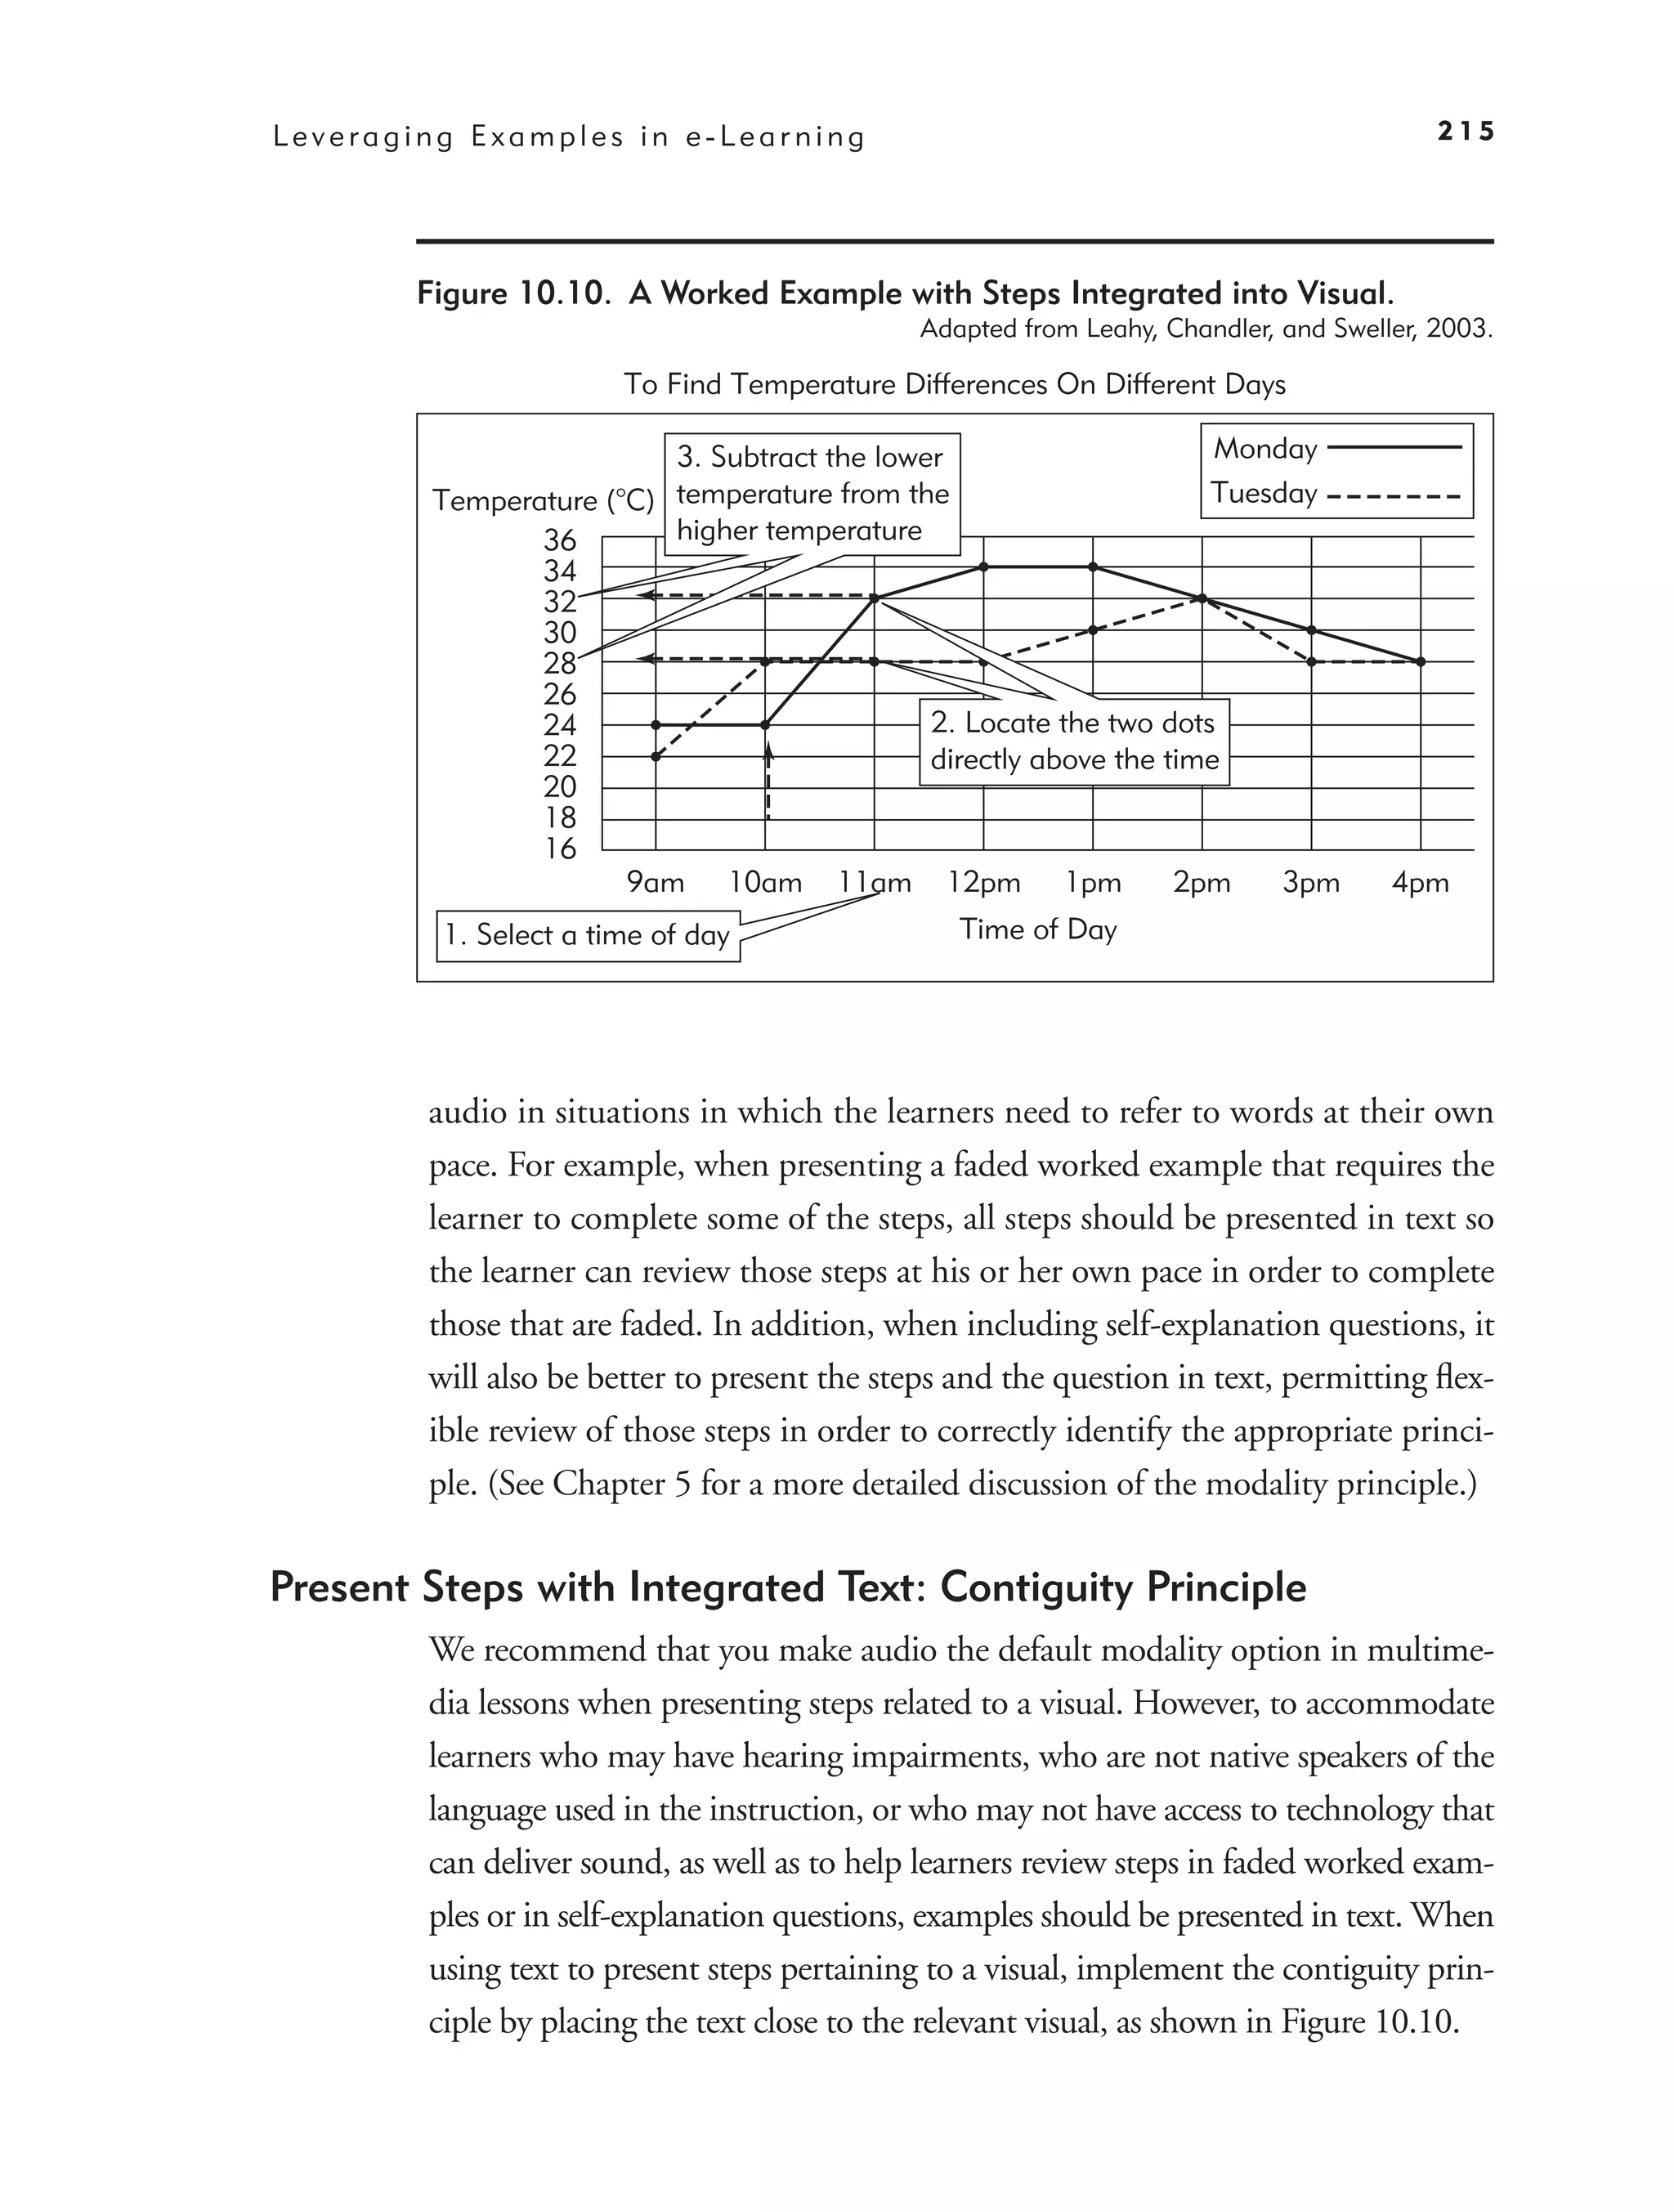
Worked Example Principle 4: Apply Multimedia Principles
to Examples 213
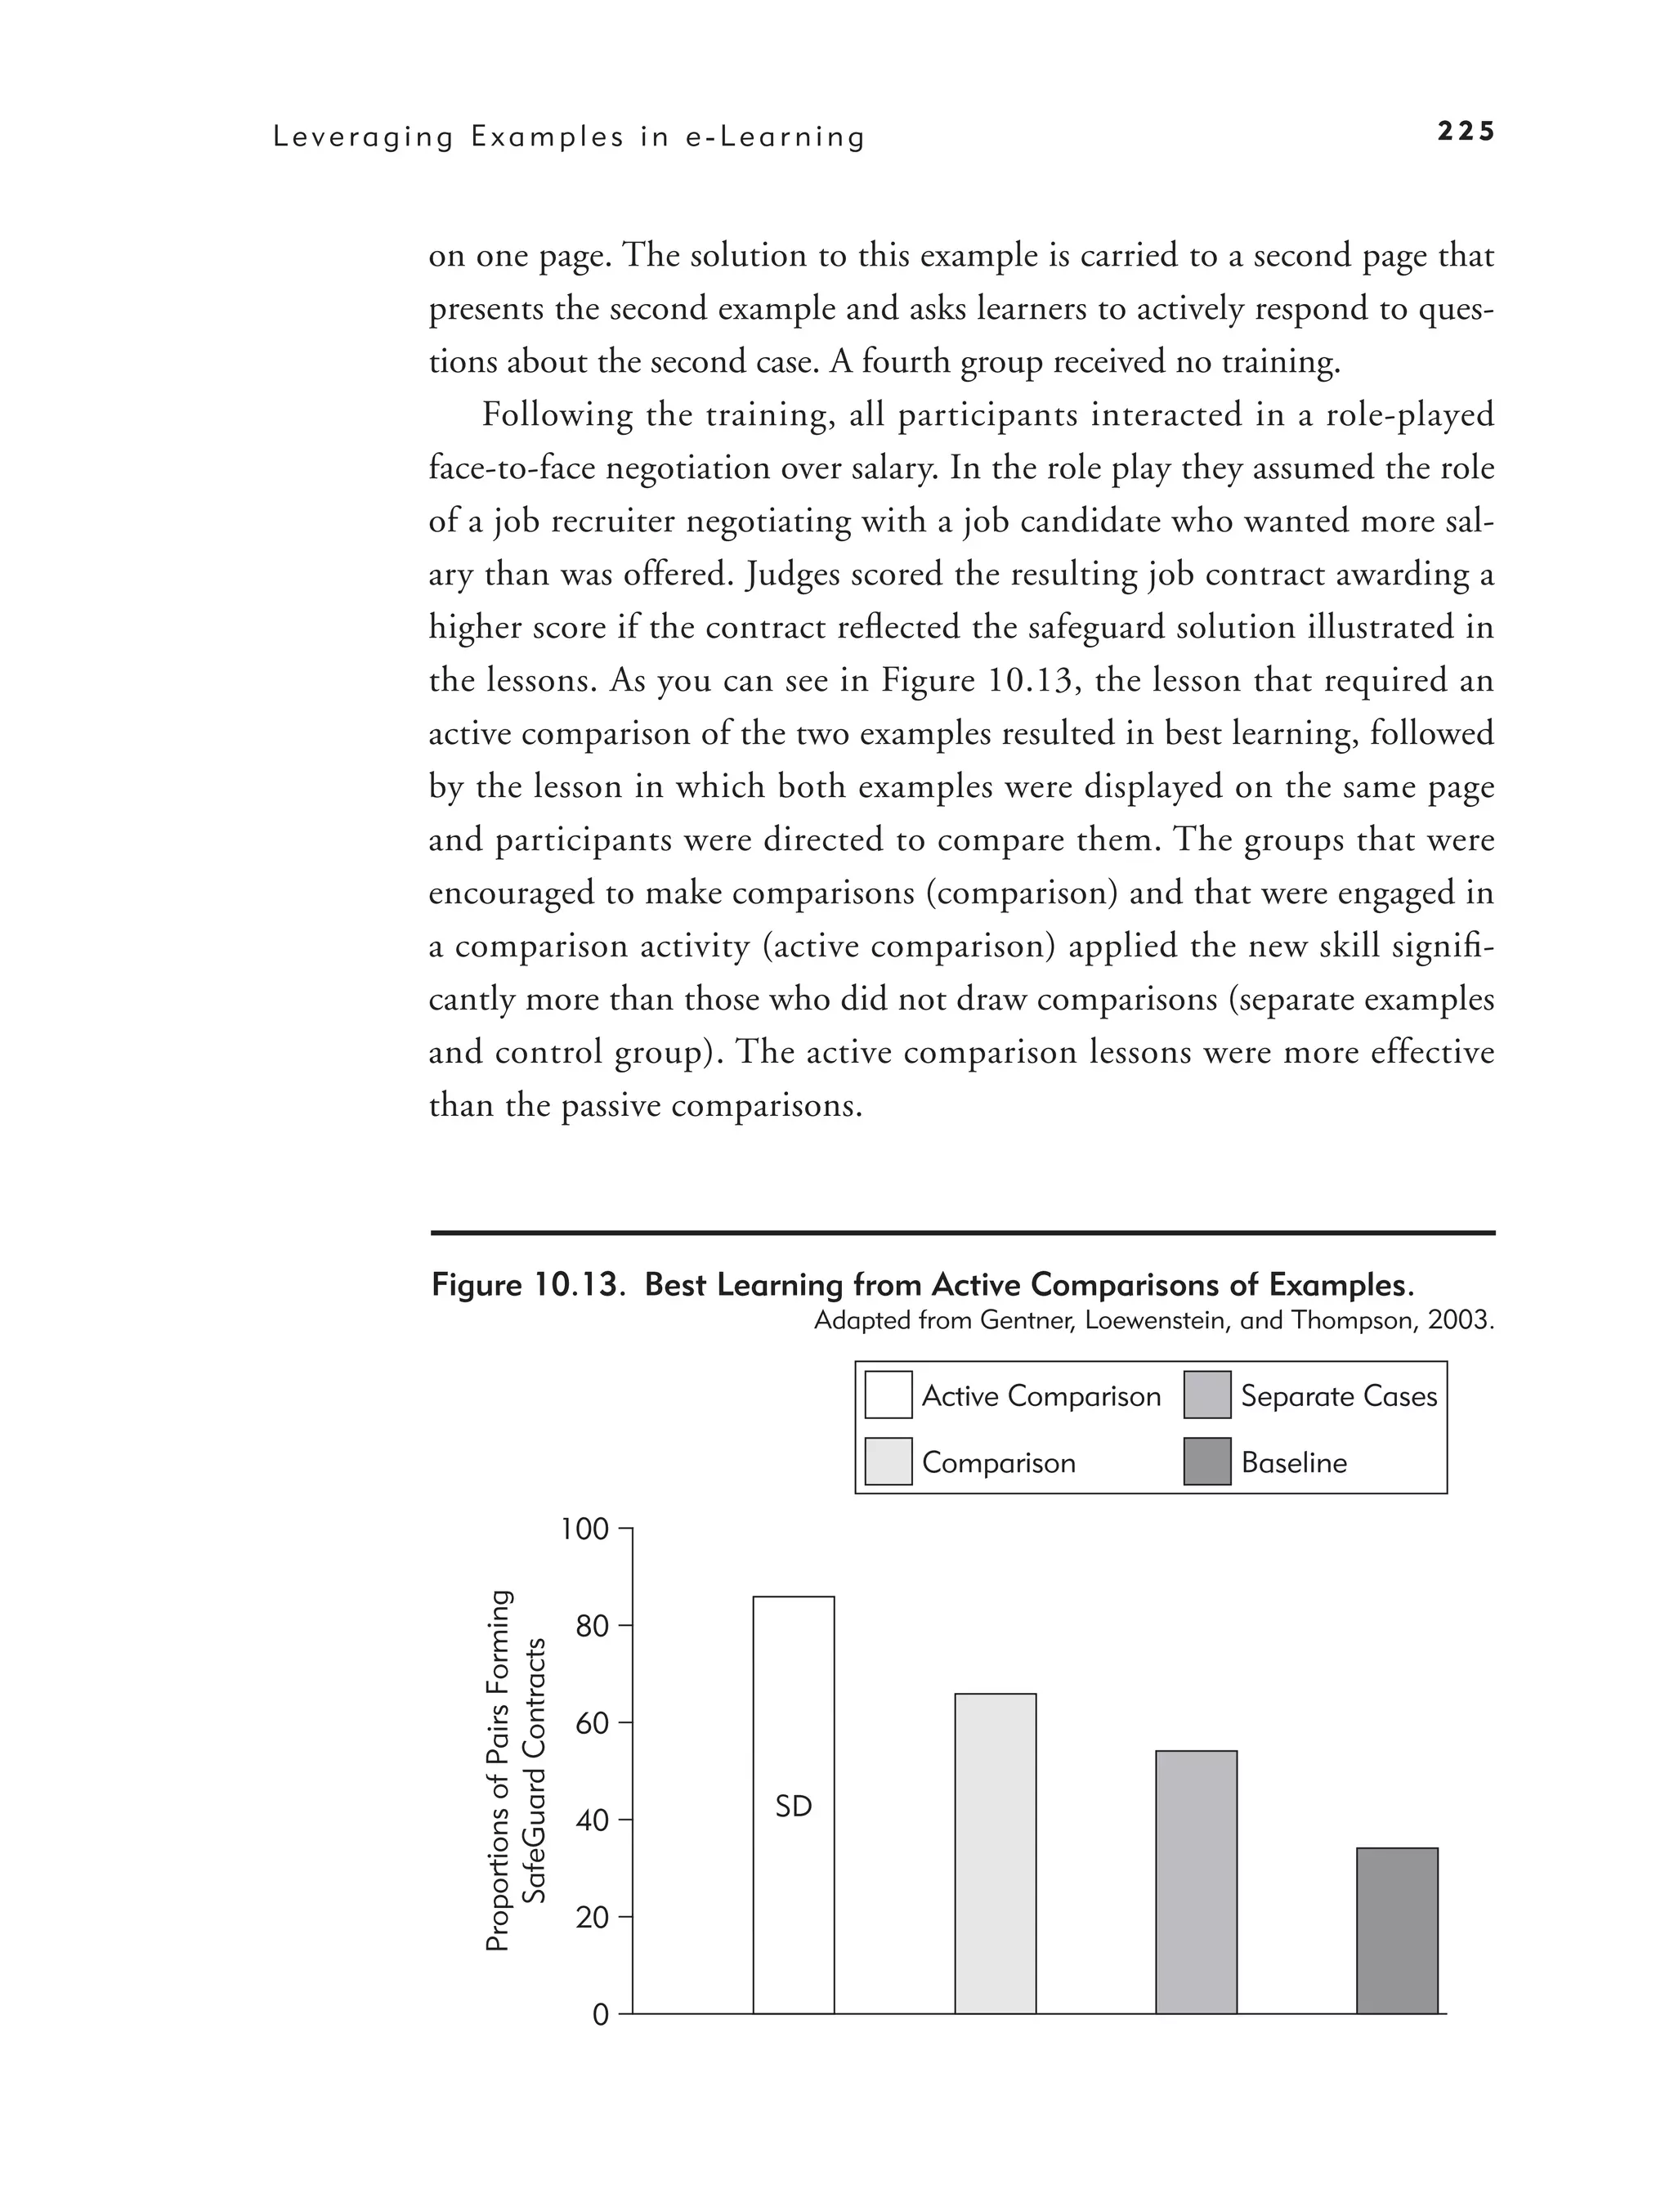
Worked Example Principle 5: Support Learning Transfer 217
Design Guidelines for Near-Transfer Learning 218
Design Guidelines for Far-Transfer Learning 219
What We Don’t Know About Worked Examples 226
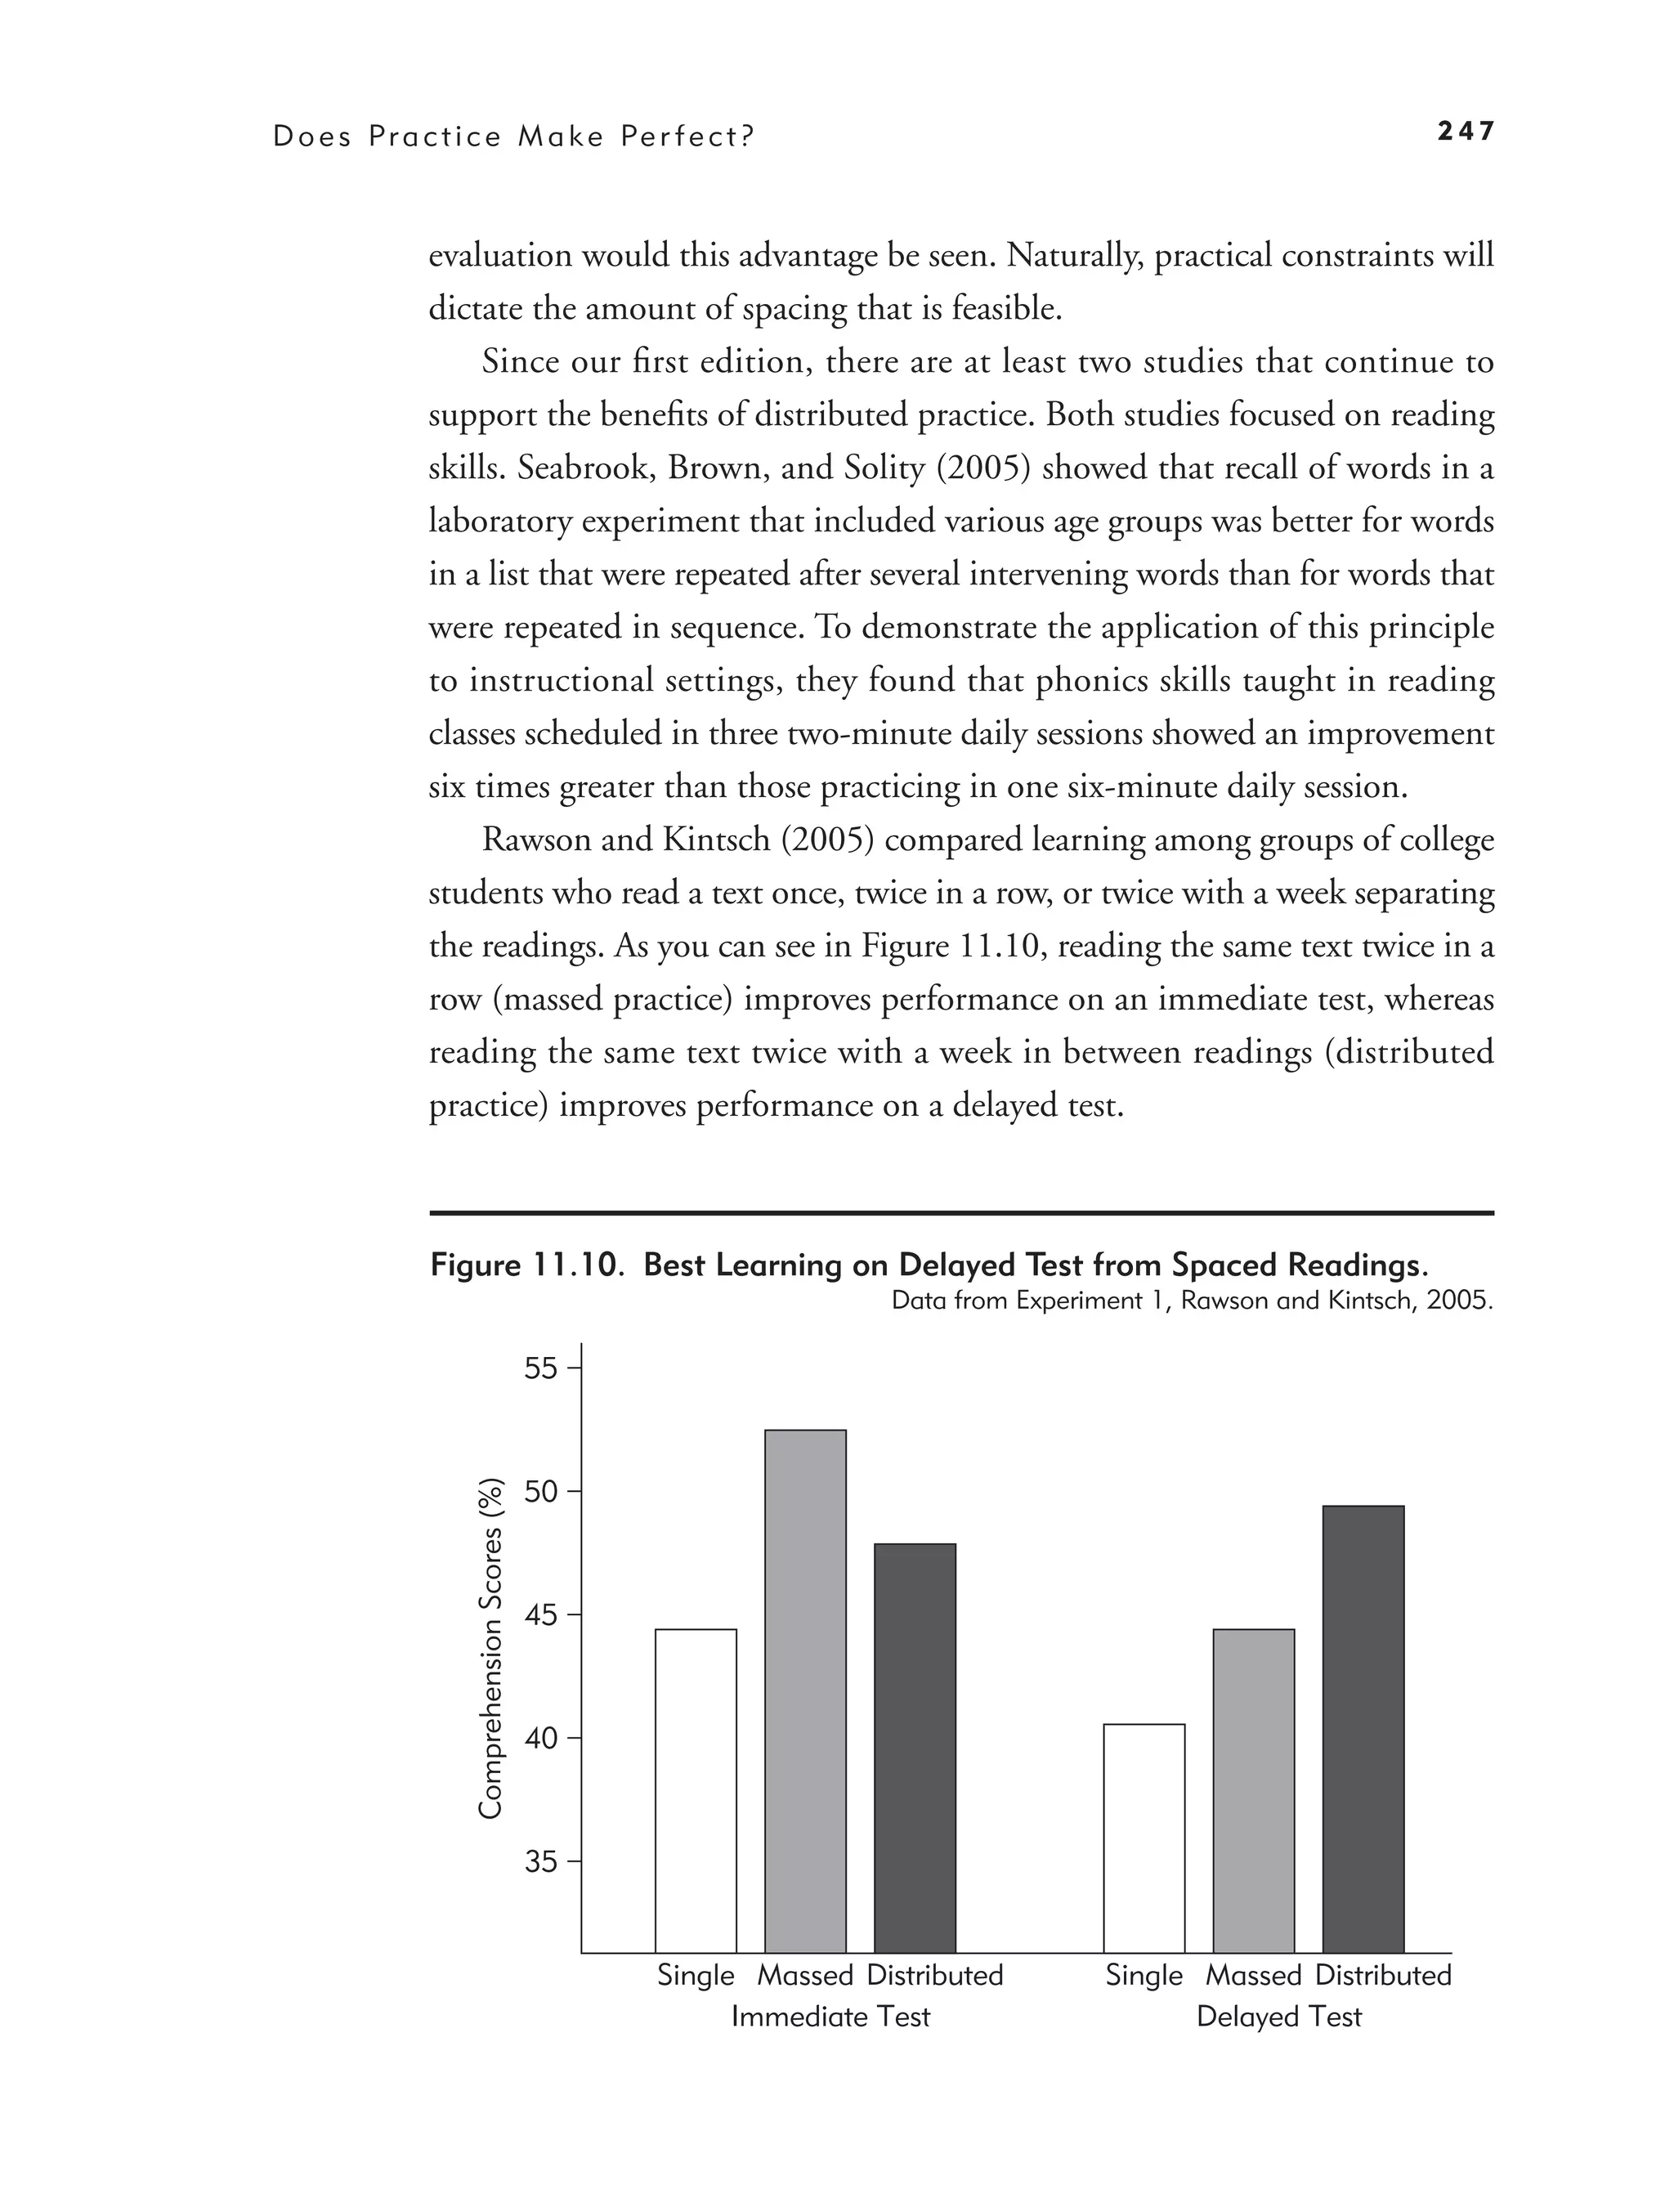
11. Does Practice Make Perfect? 231
What Is Practice in e-Learning? 233
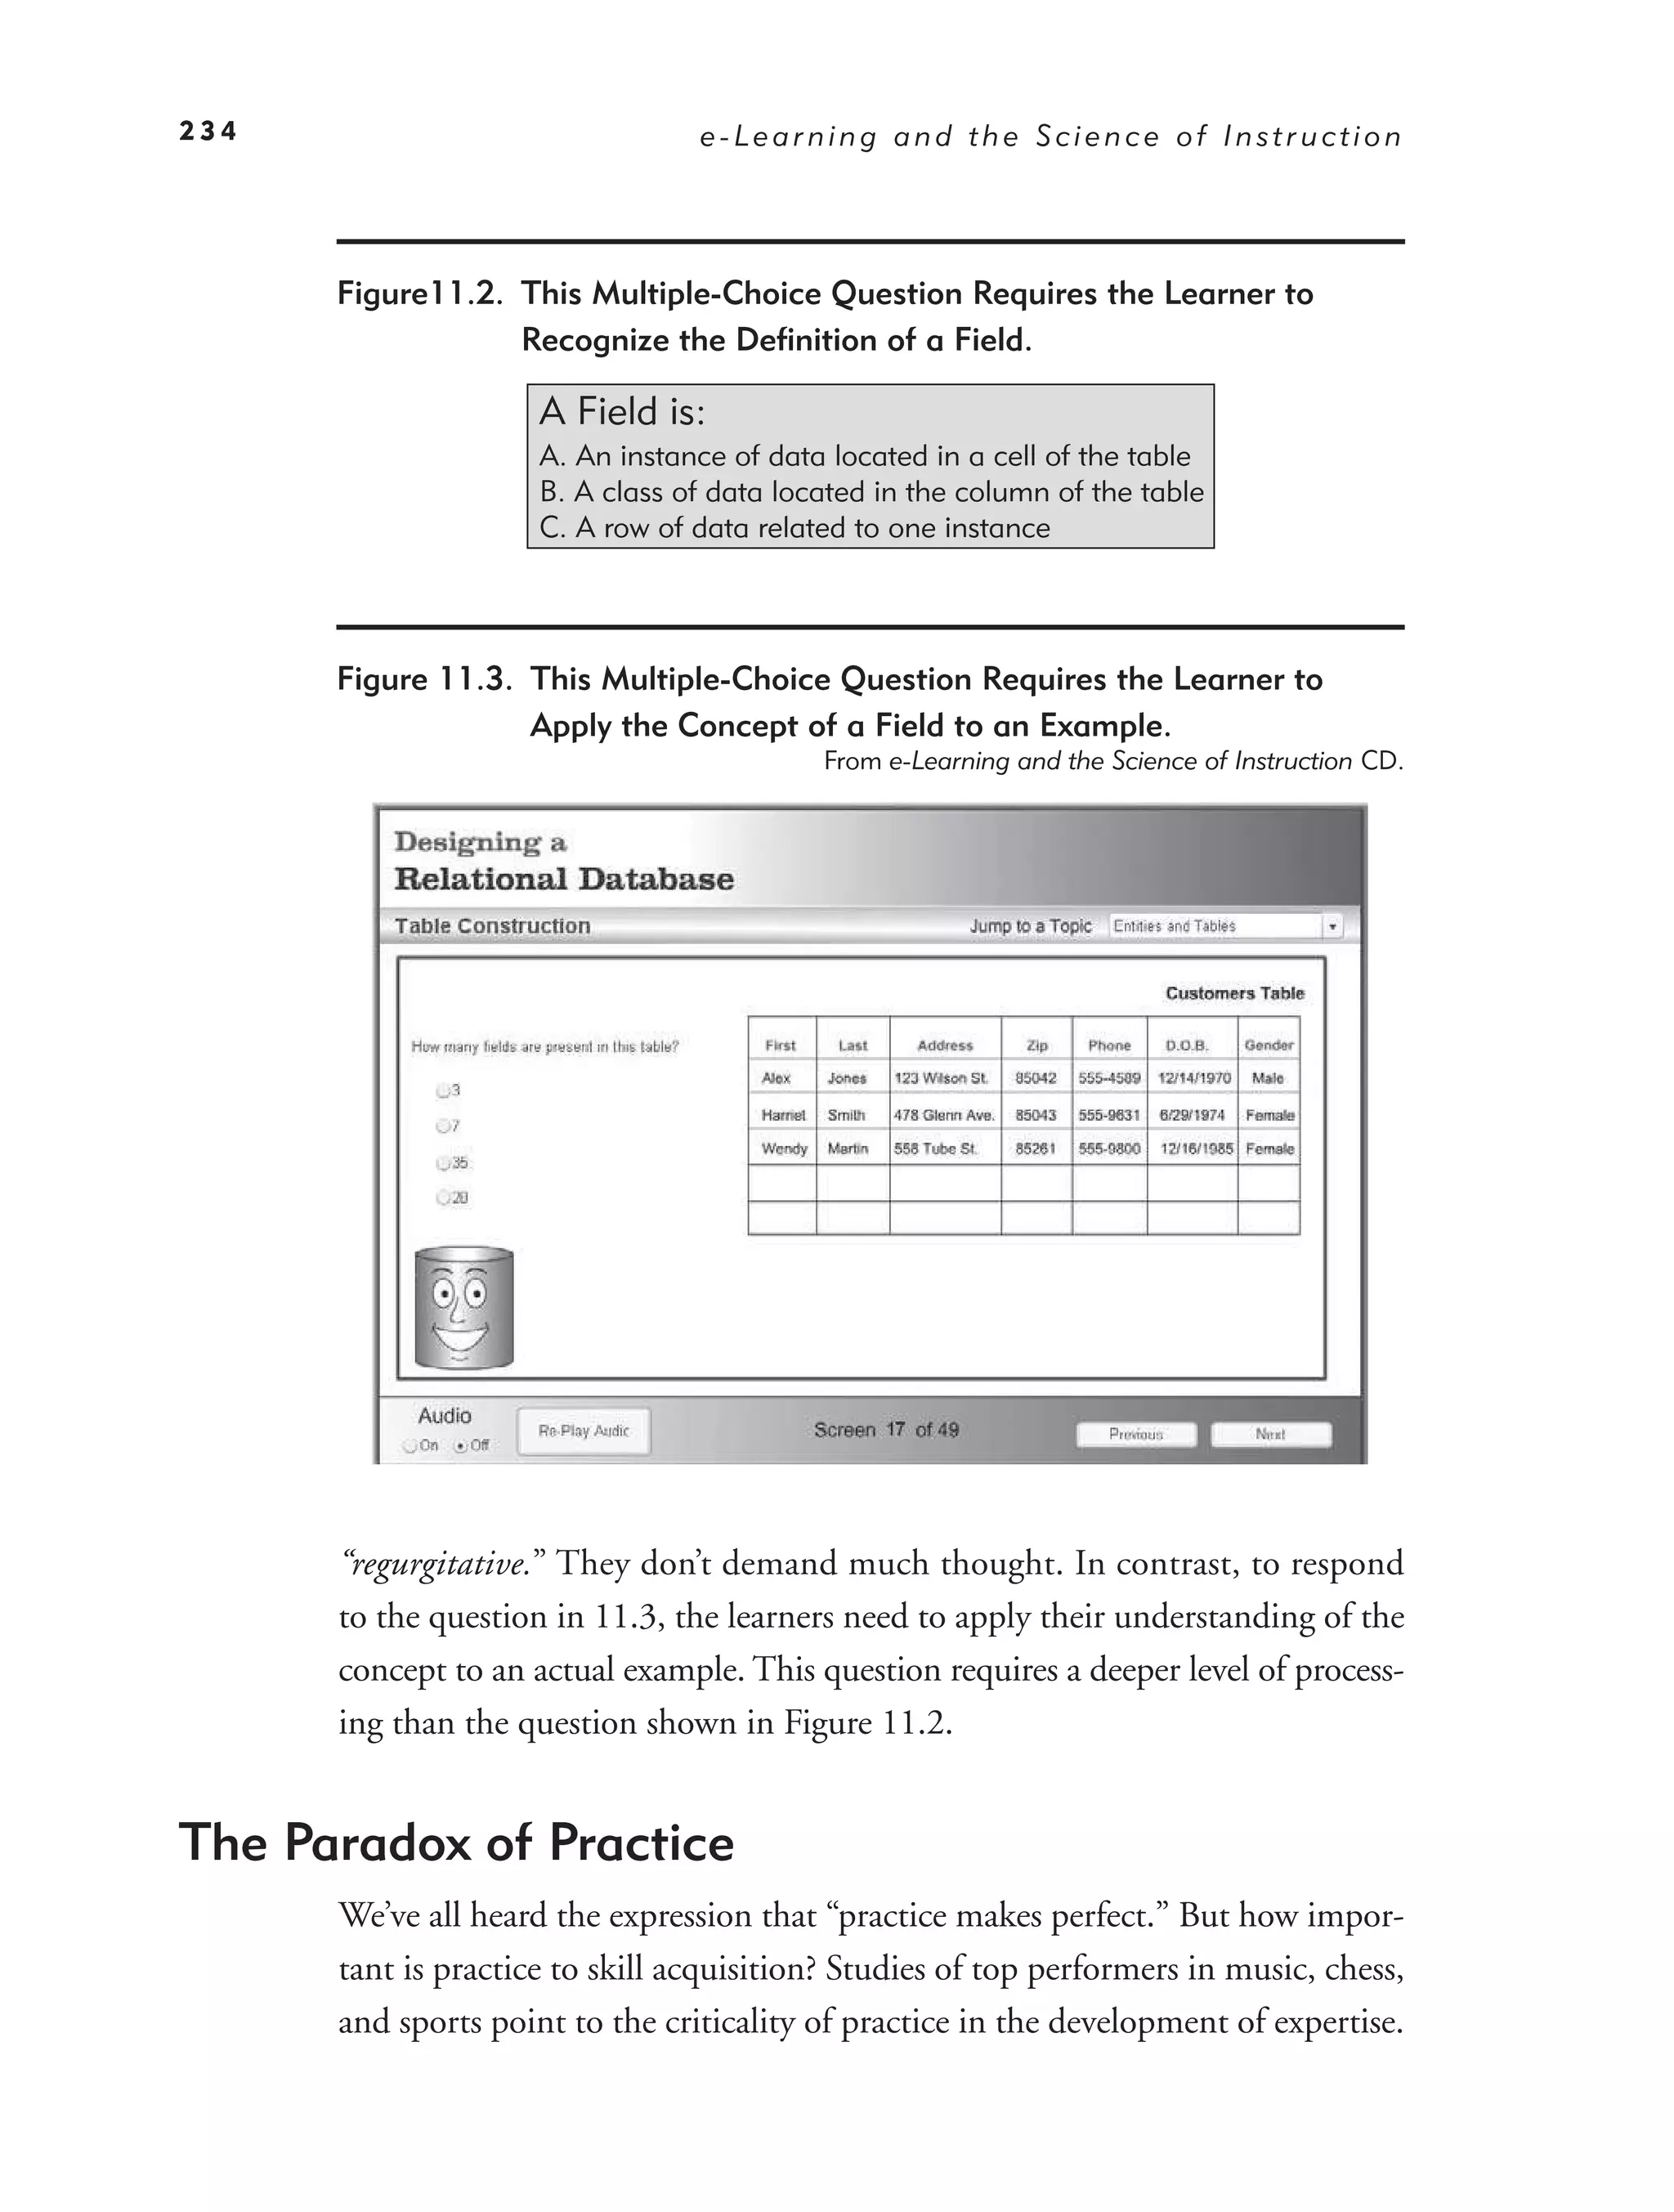
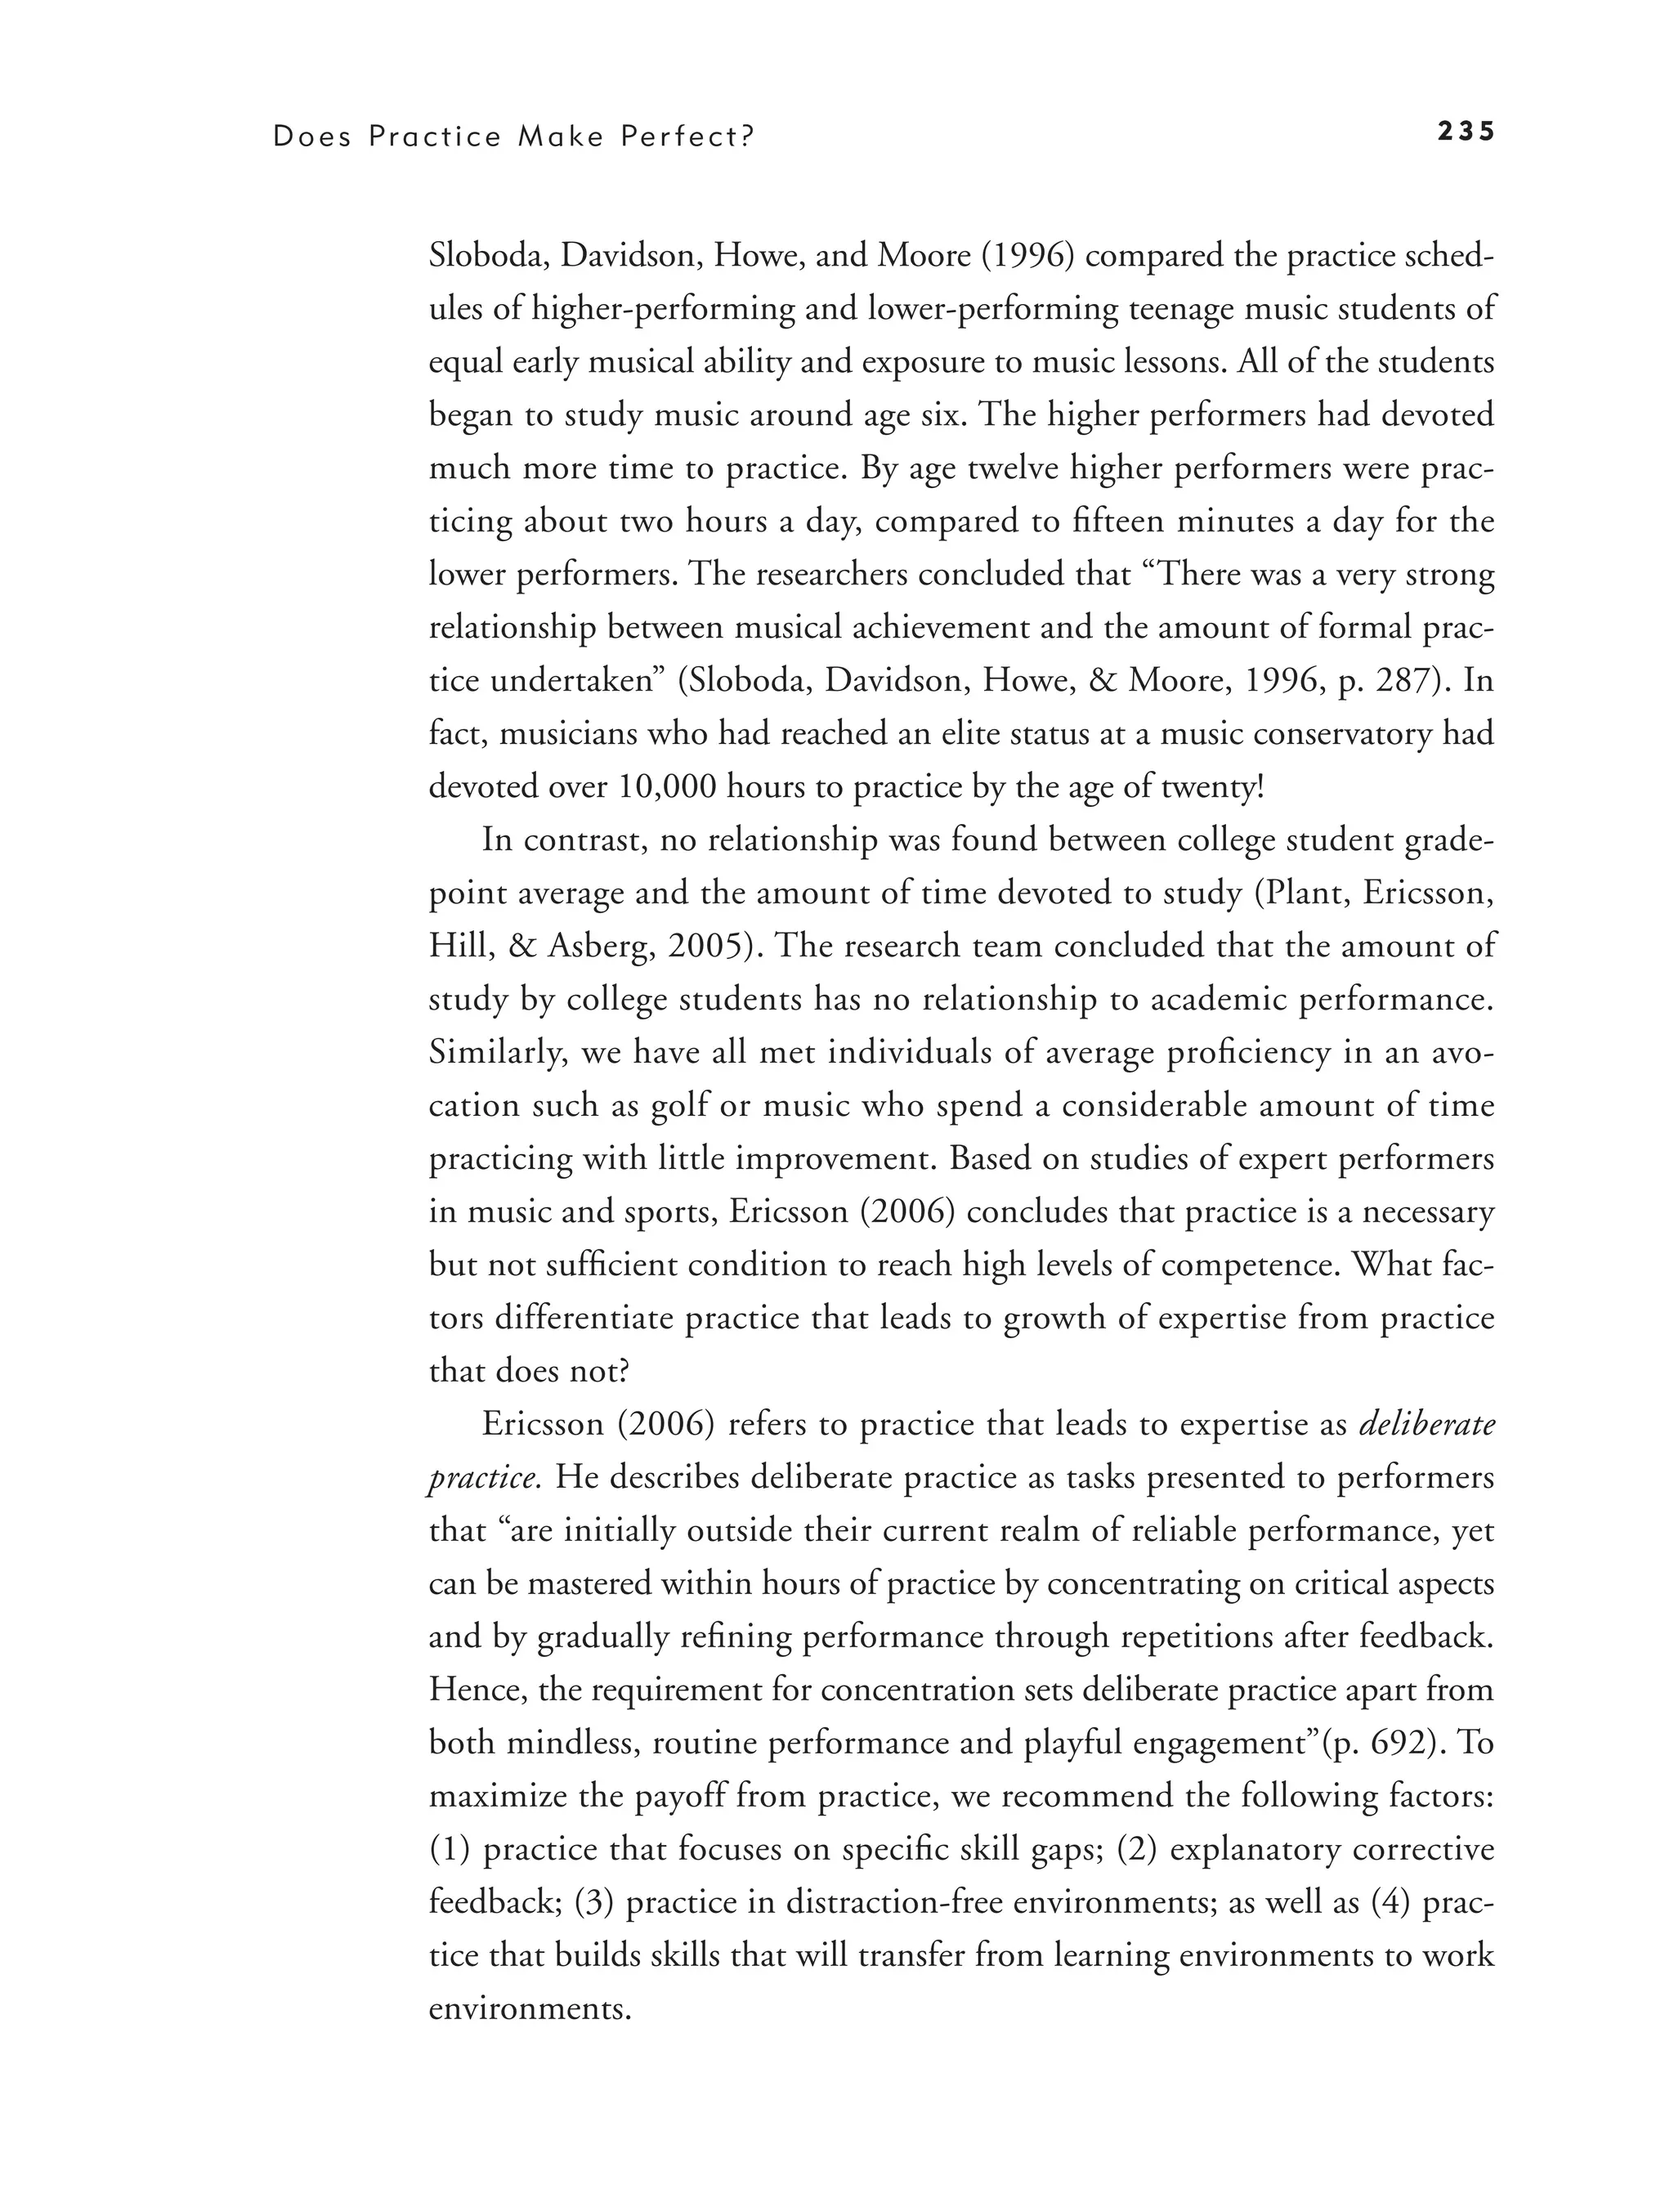
The Paradox of Practice 234
How to Leverage Practice: Overview 236
Practice Principle 1: Mirror the Job 236
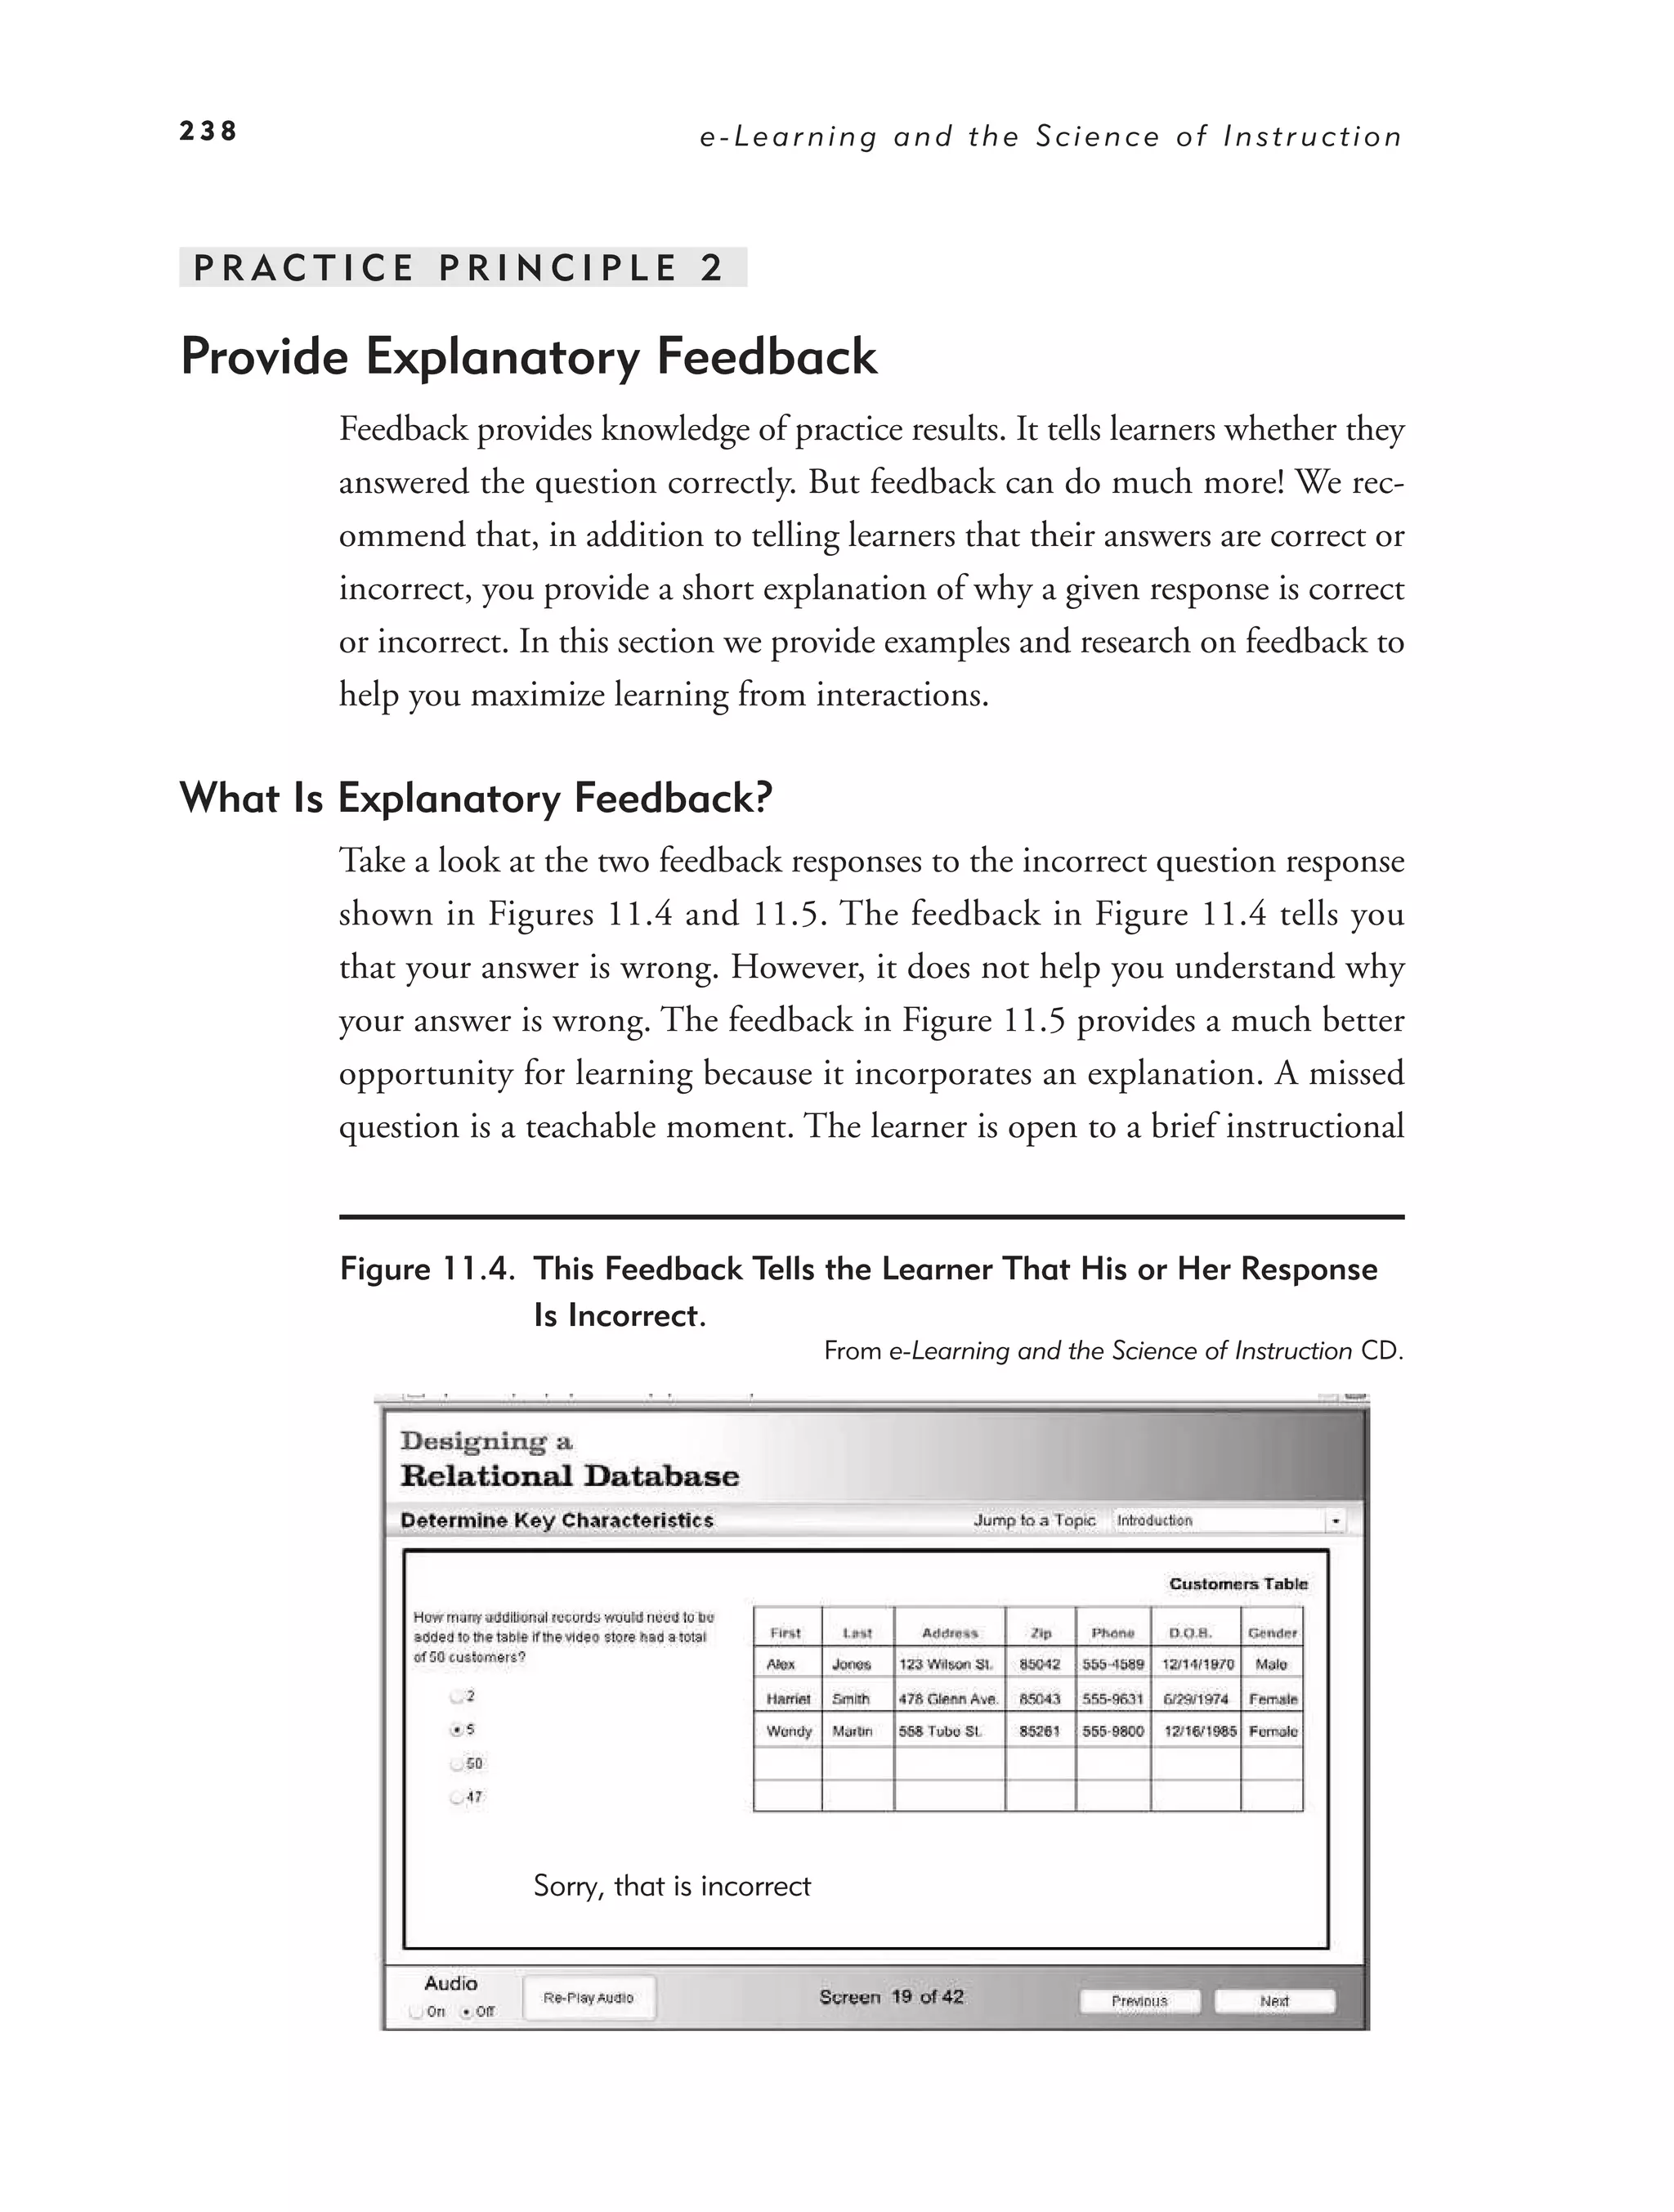
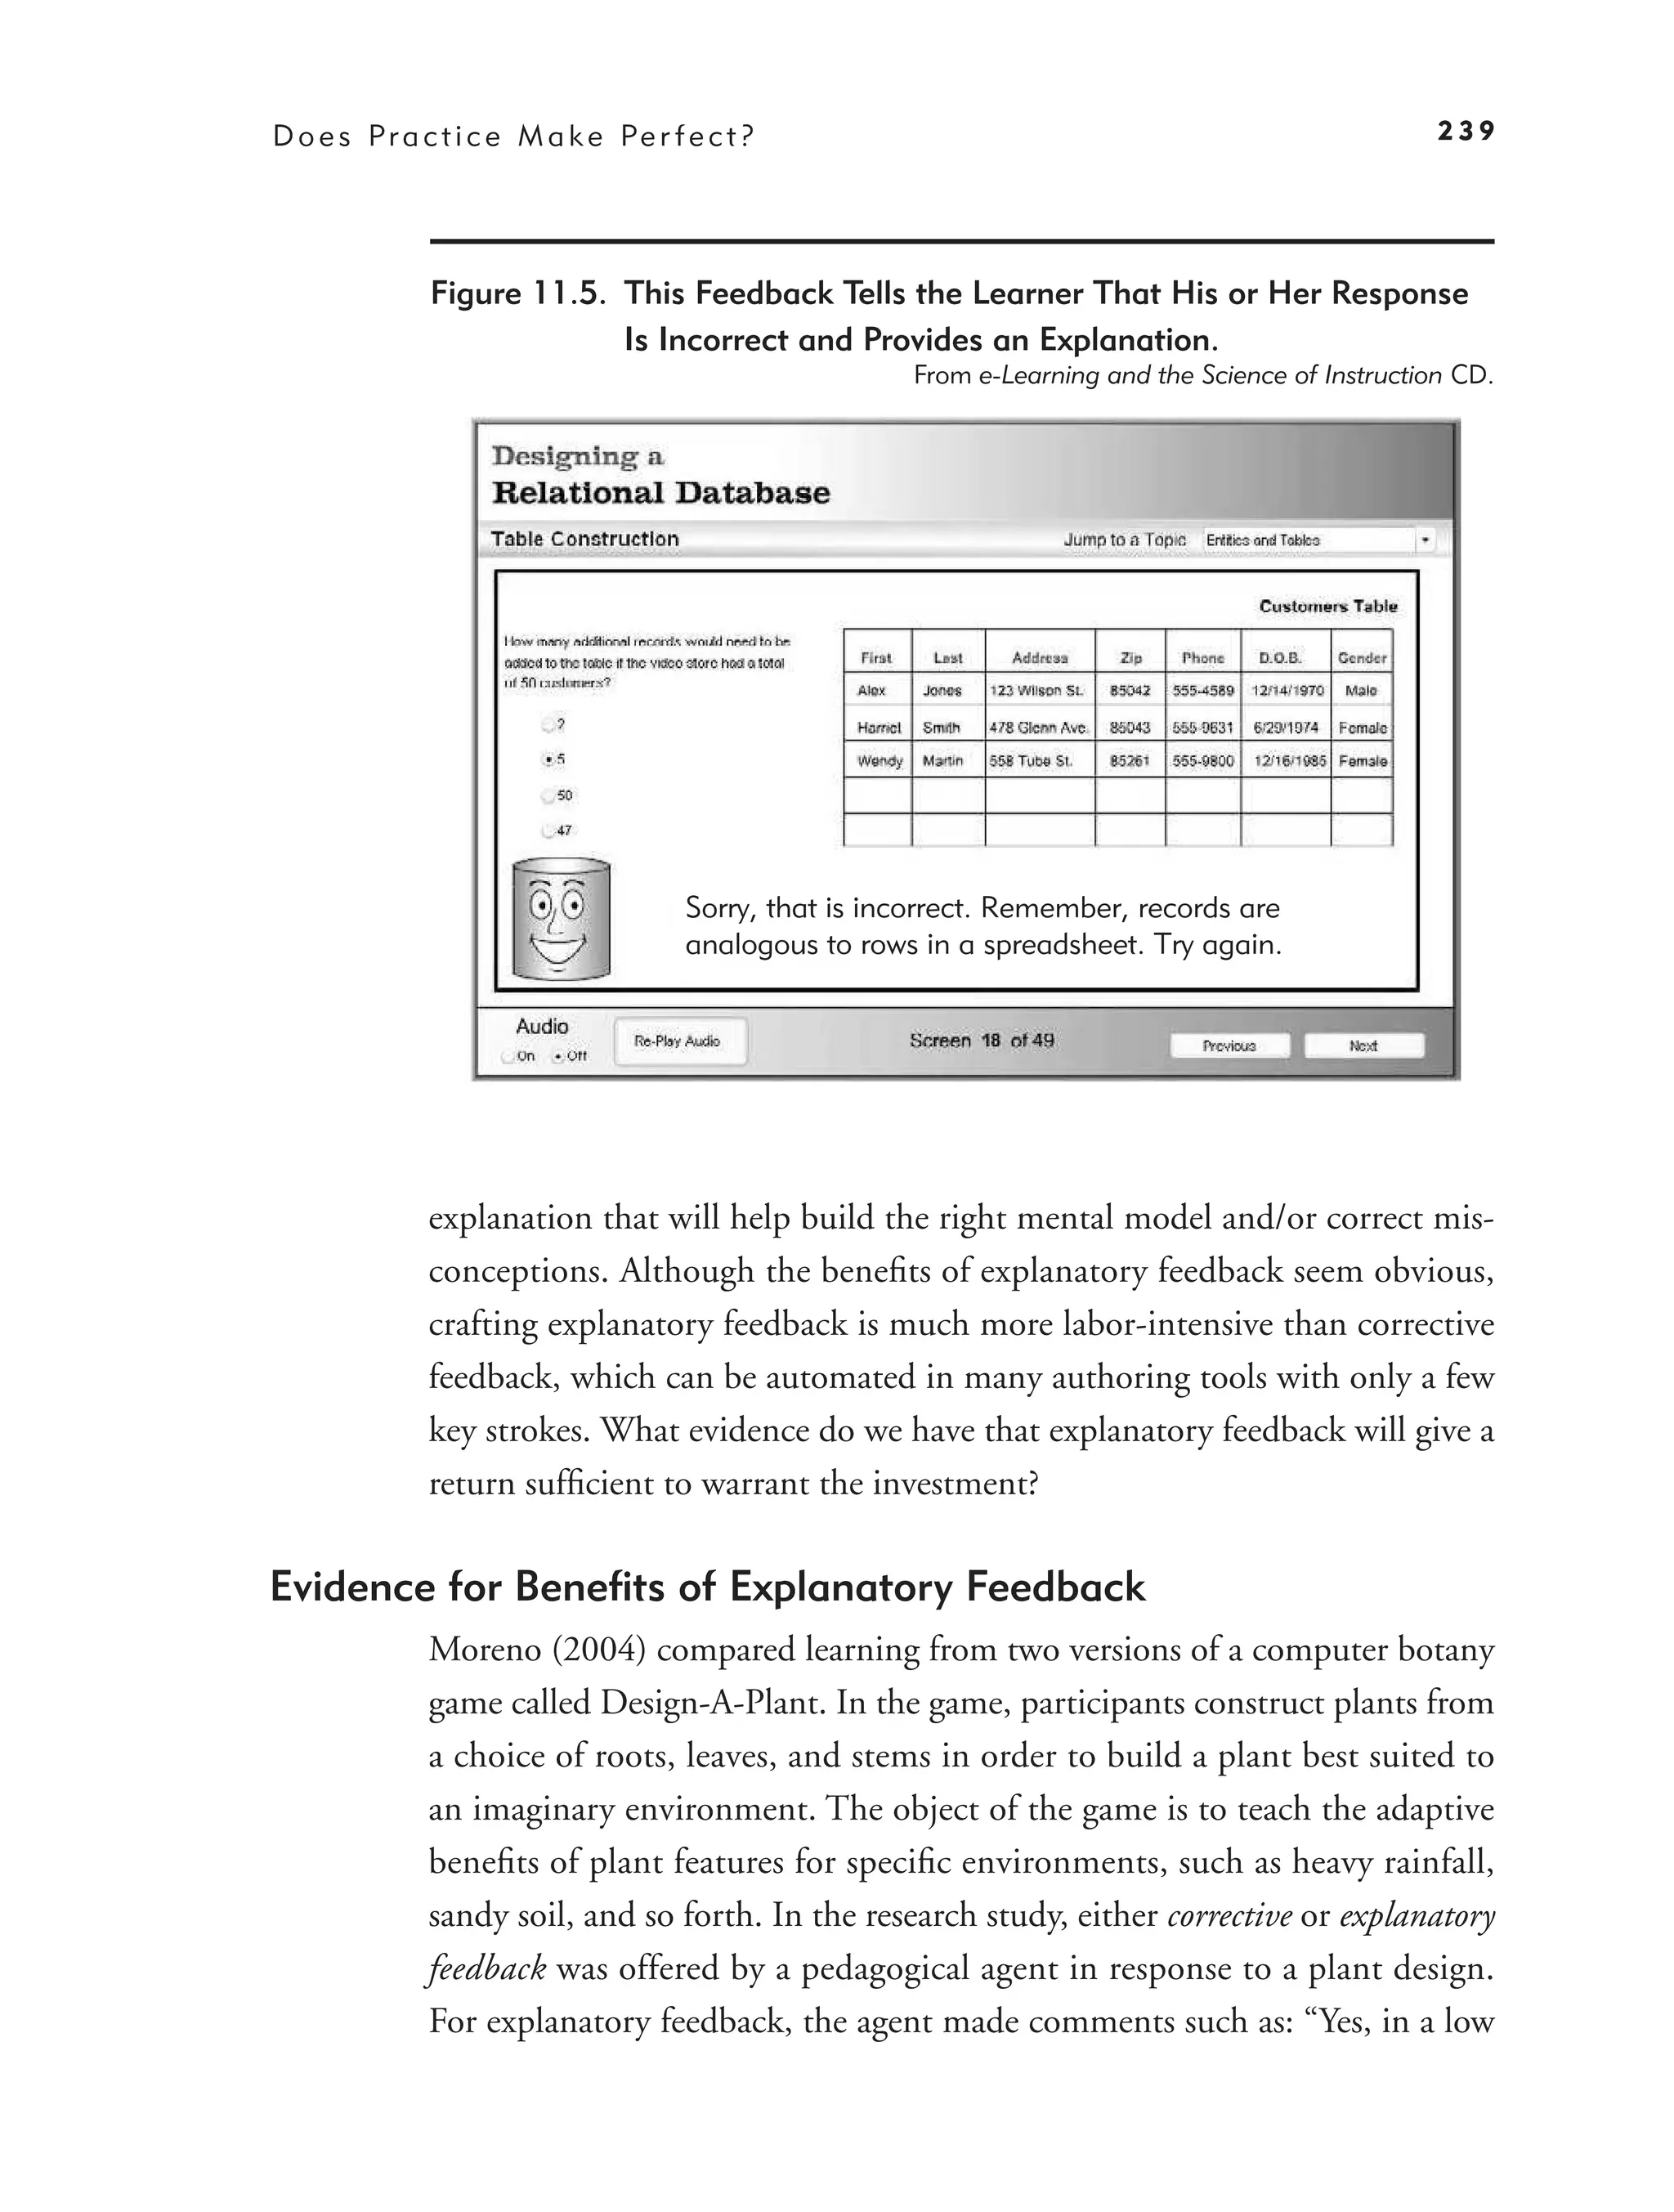
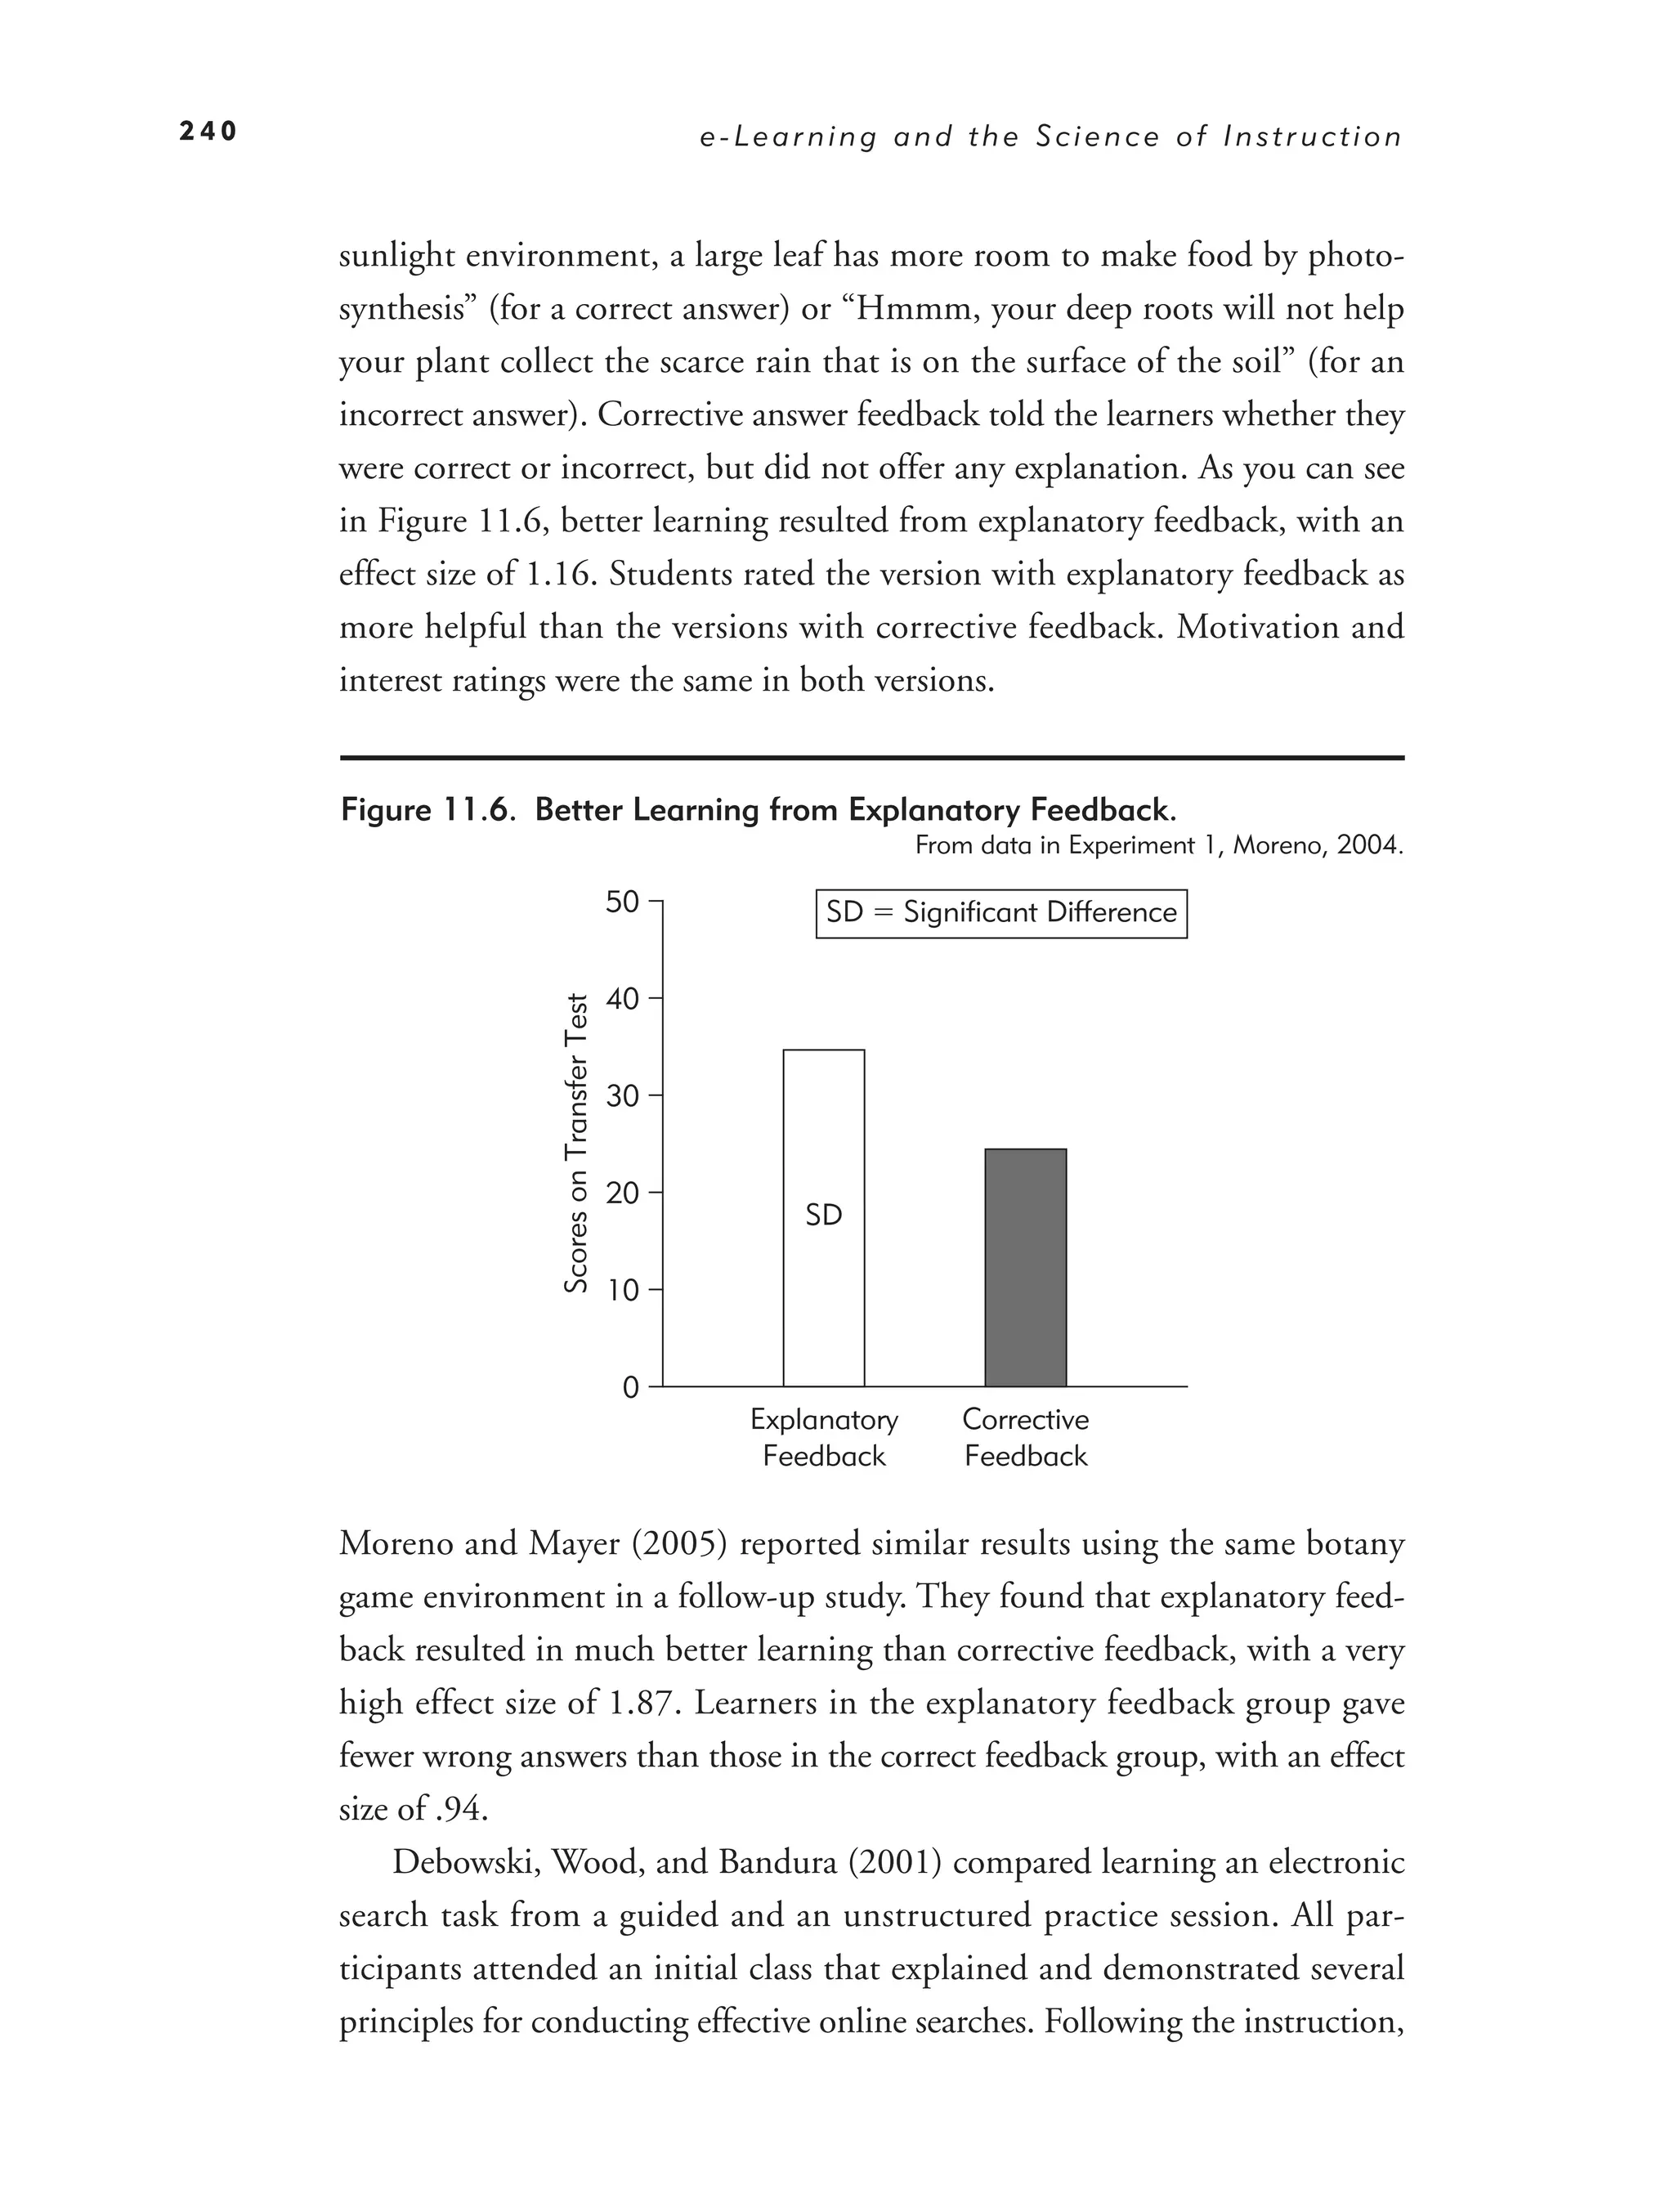
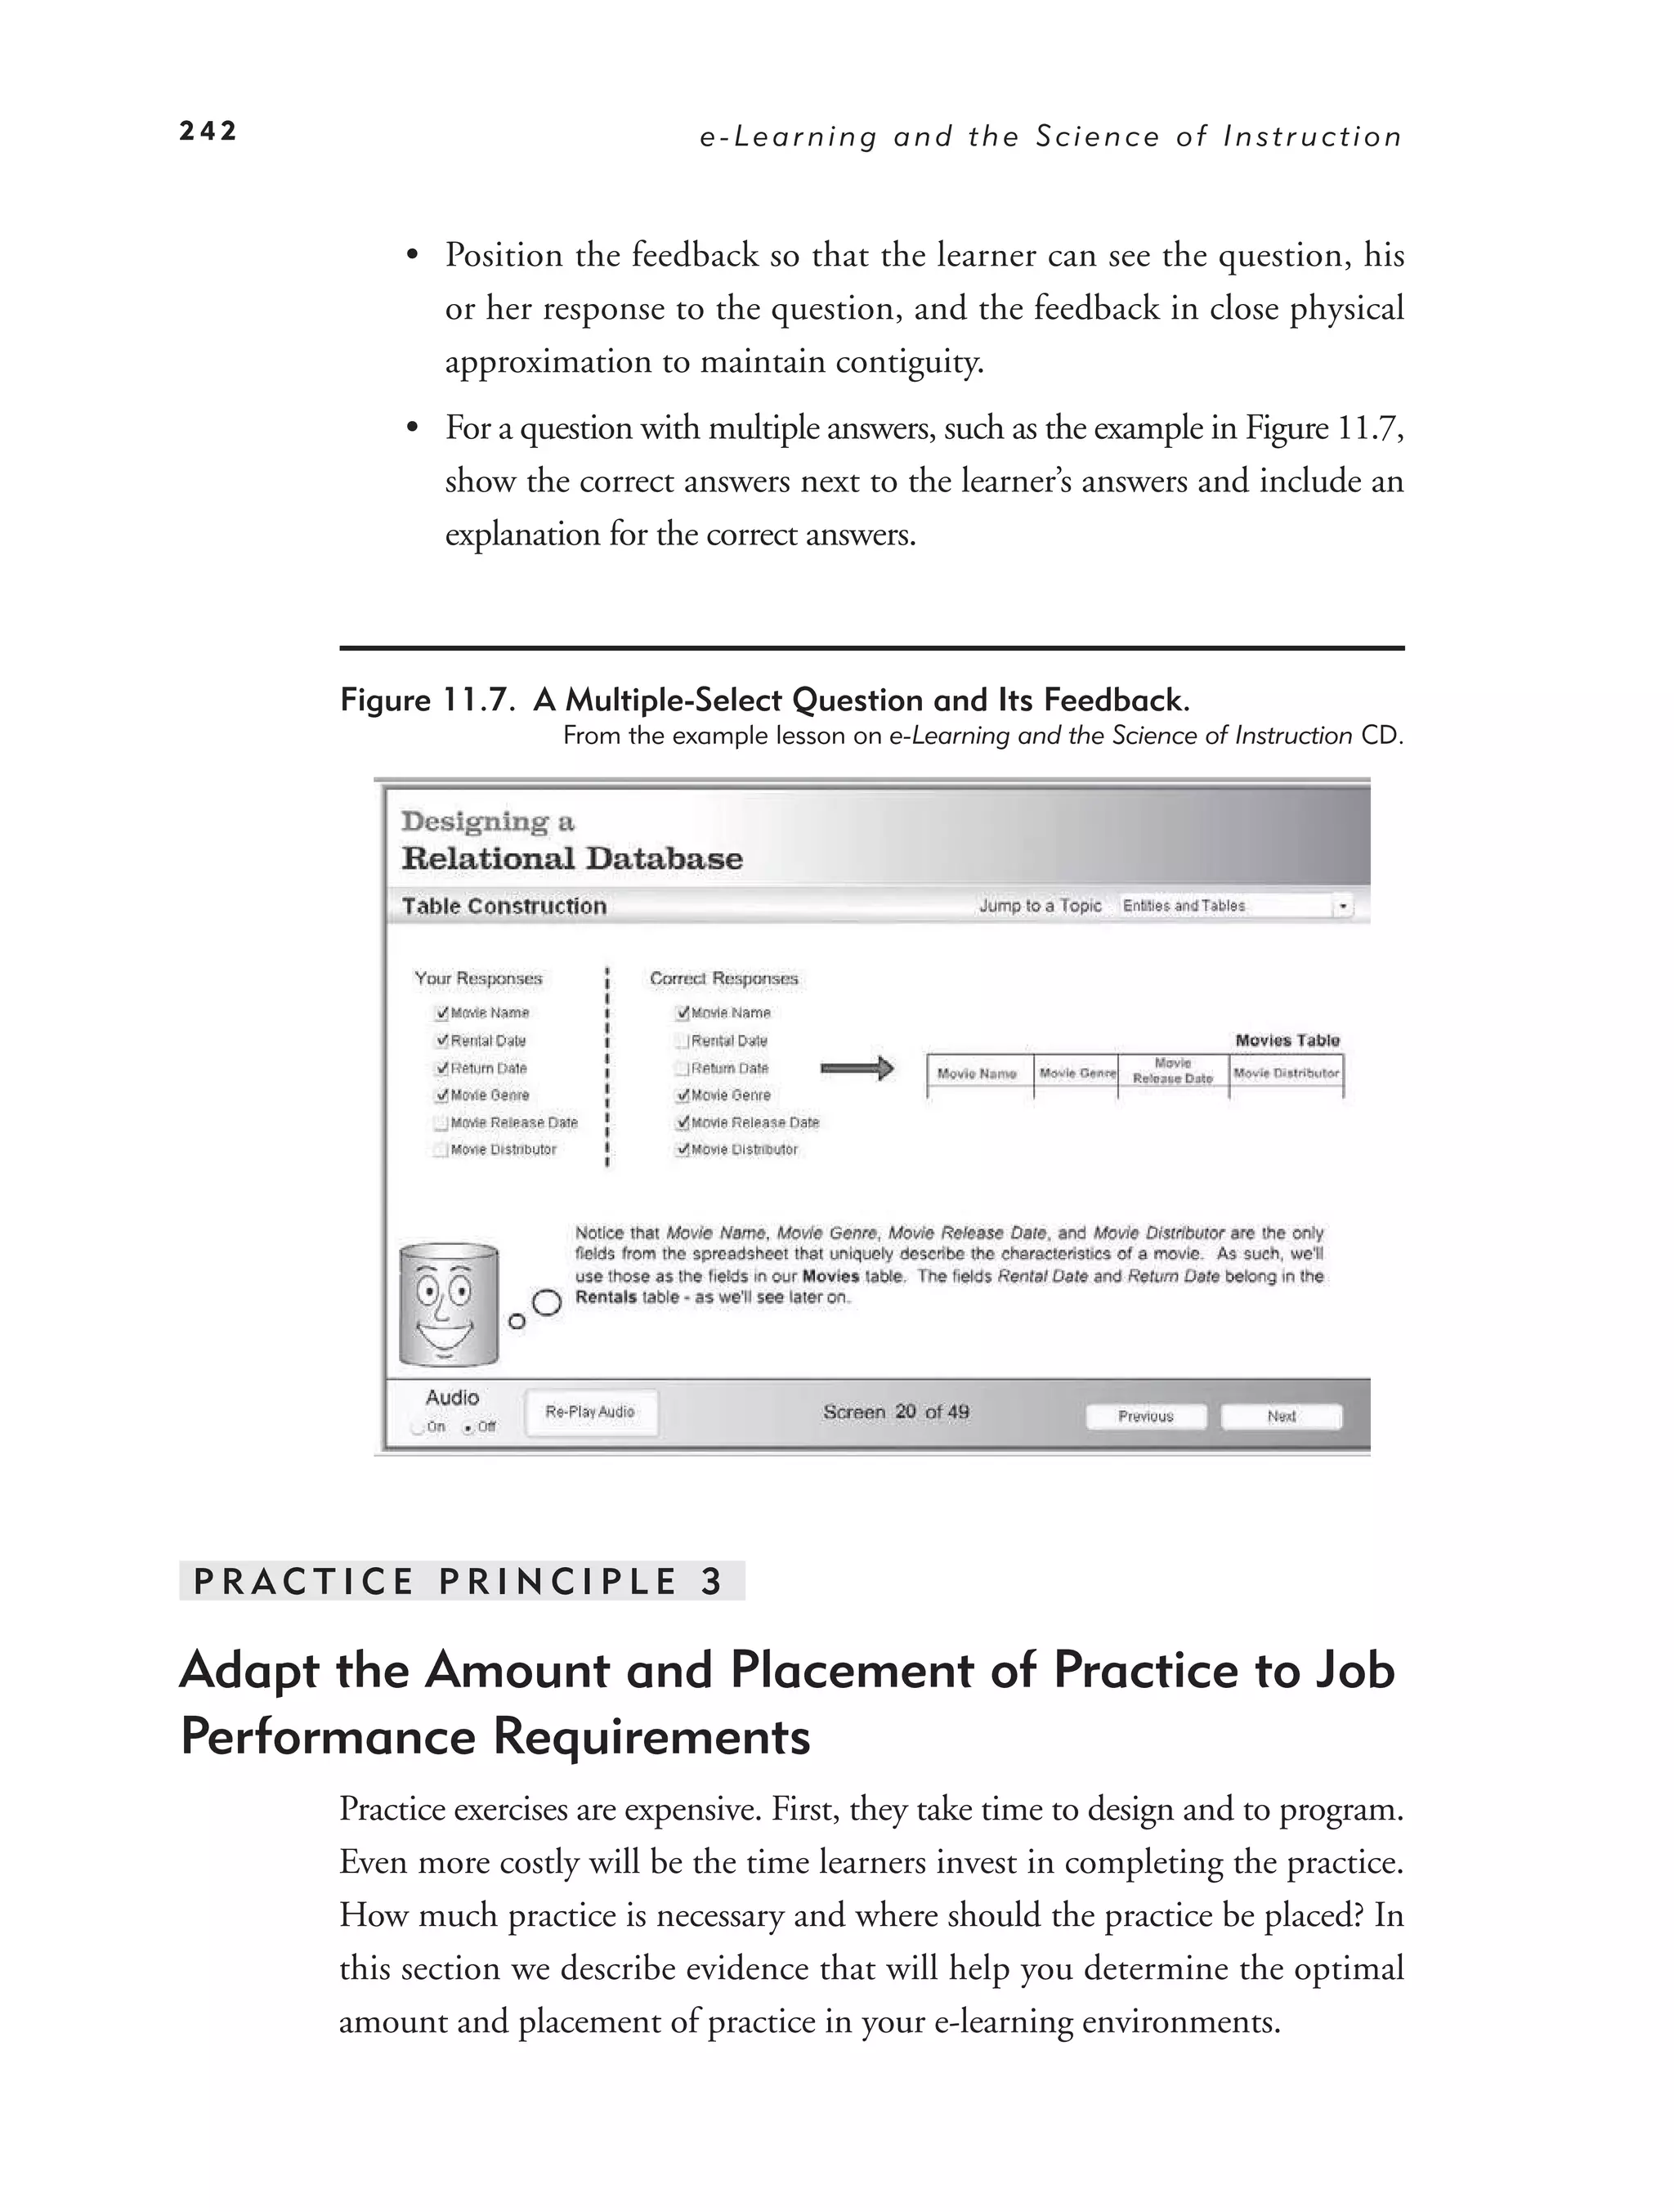
Practice Principle 2: Provide Explanatory Feedback 238
Practice Principle 3: Adapt the Amount and Placement of Practice to
Job Performance Requirements 242
Practice Principle 4: Apply Multimedia Principles 249
13.
xii Contents
Practice Principle 5: Transition from Examples to Practice
Gradually 251
What We Don’t Know About Practice 251
12. Learning Together Virtually 257
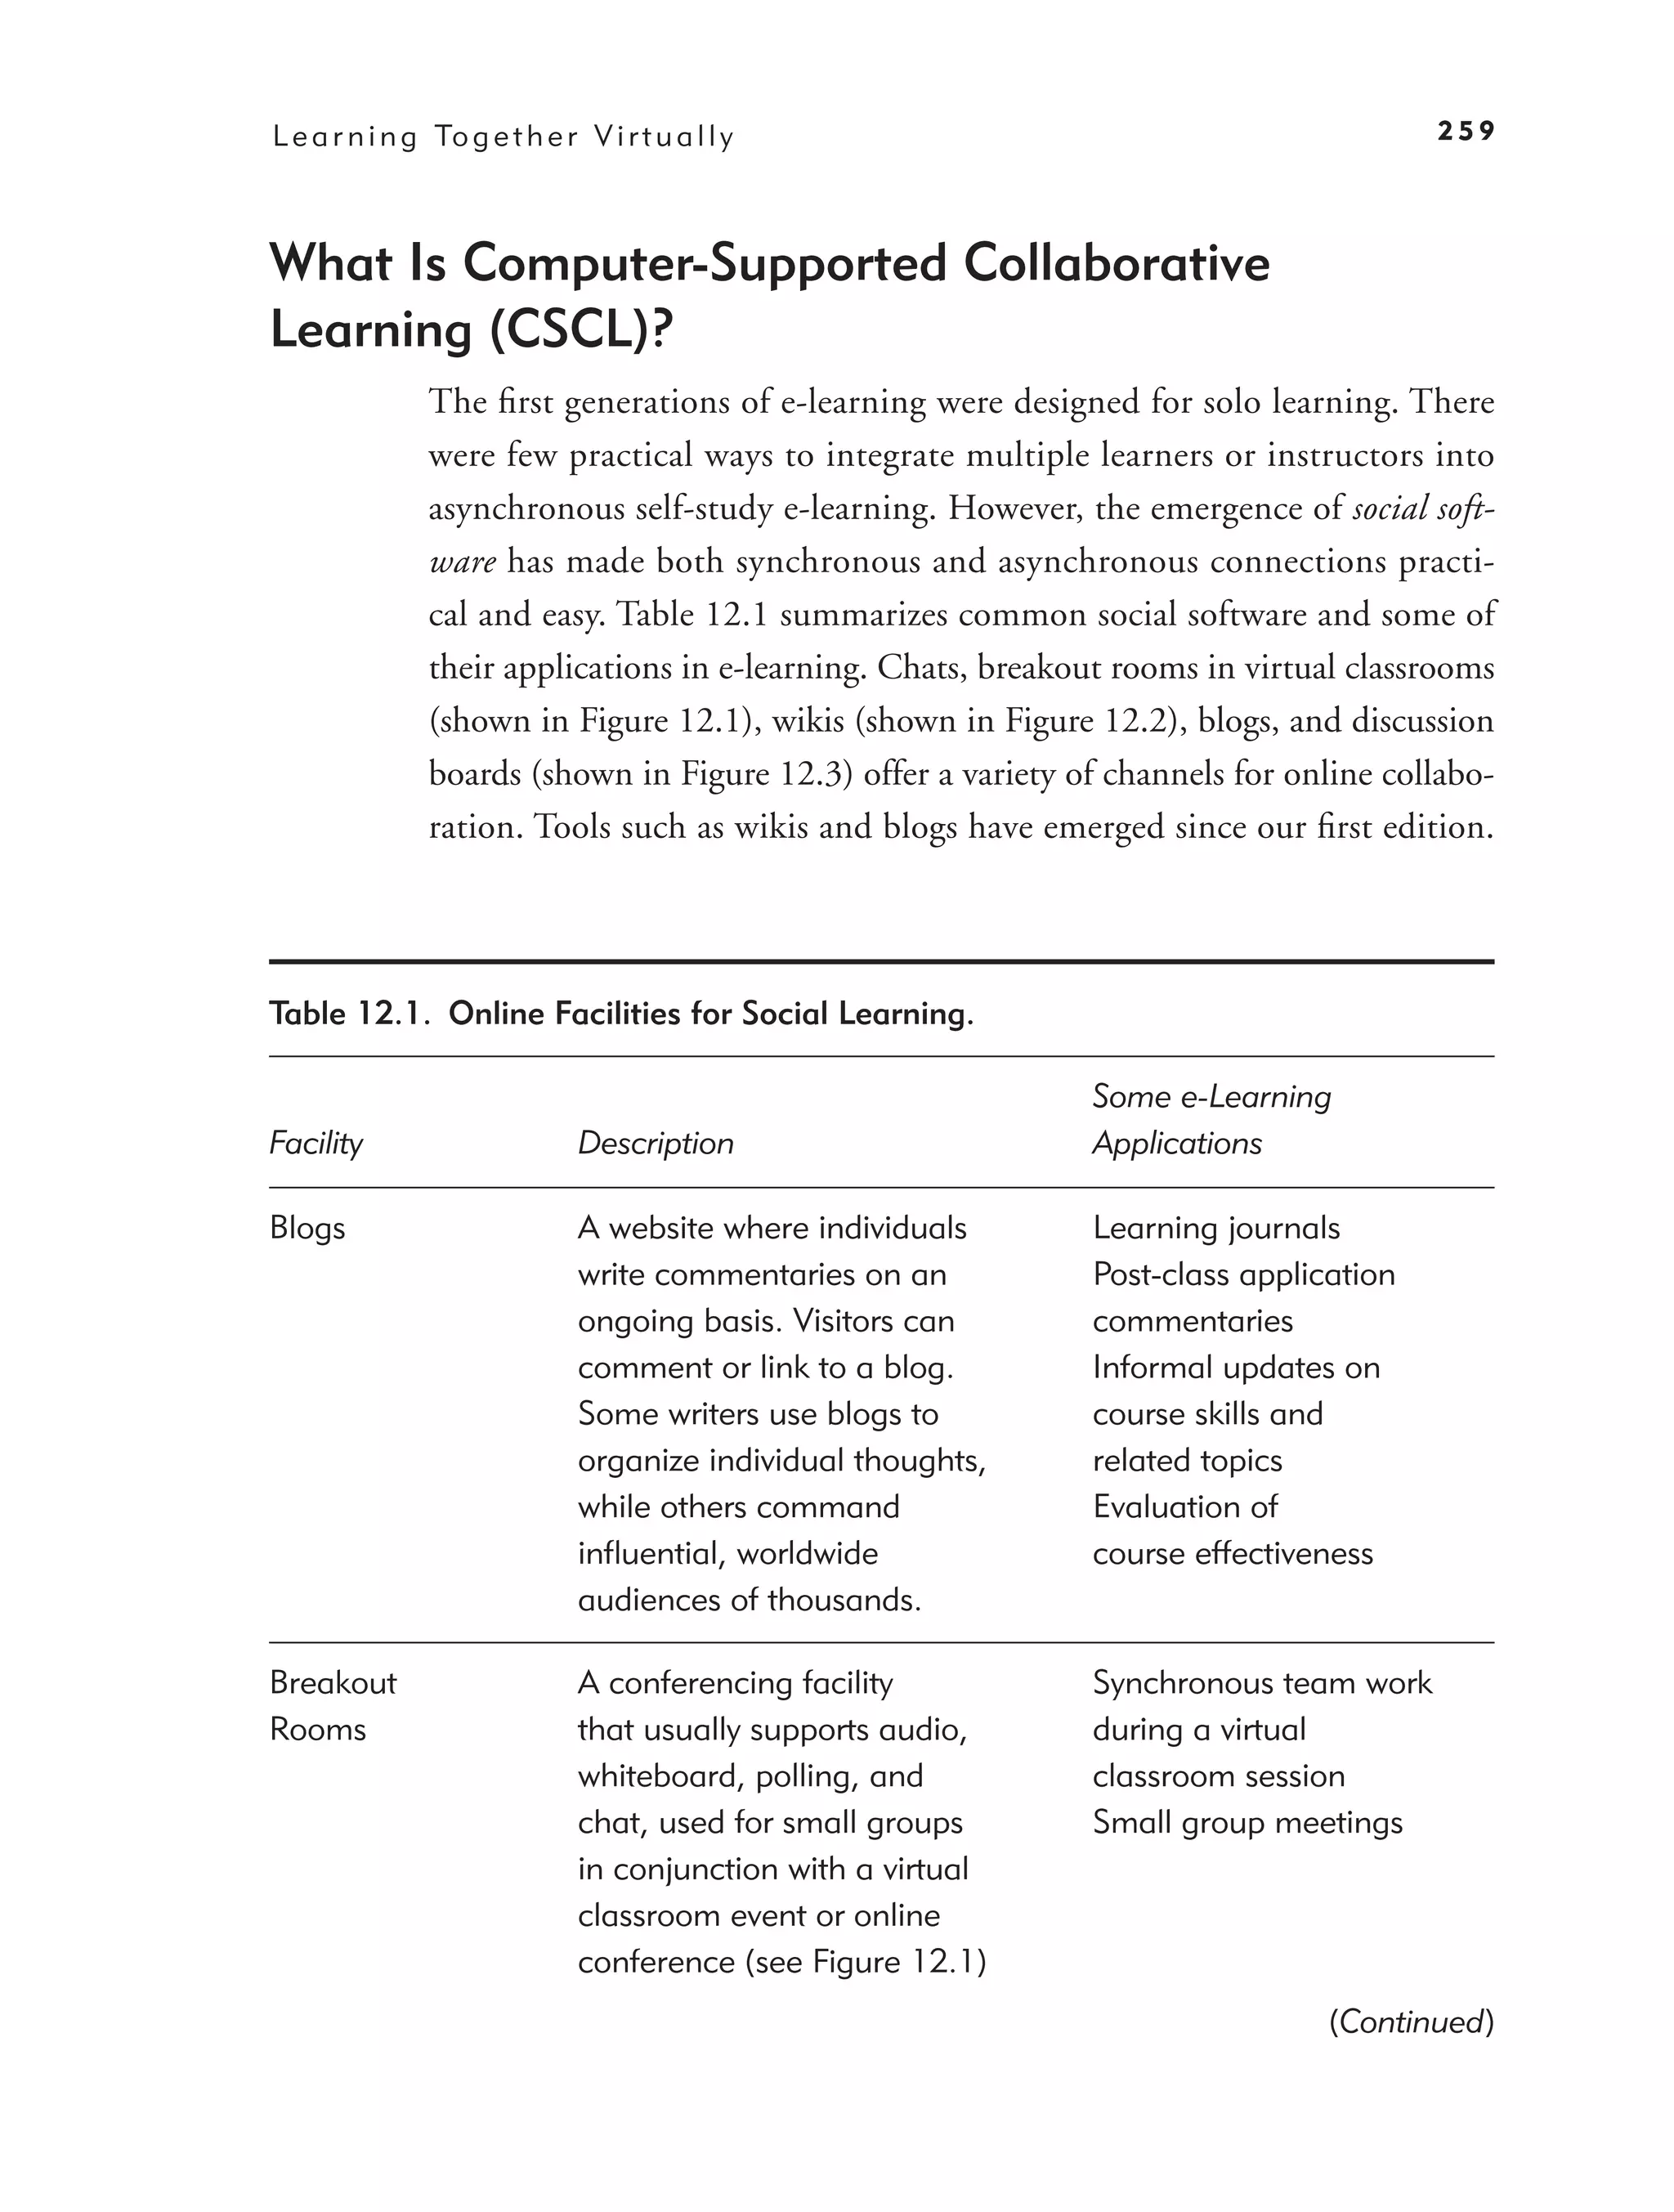
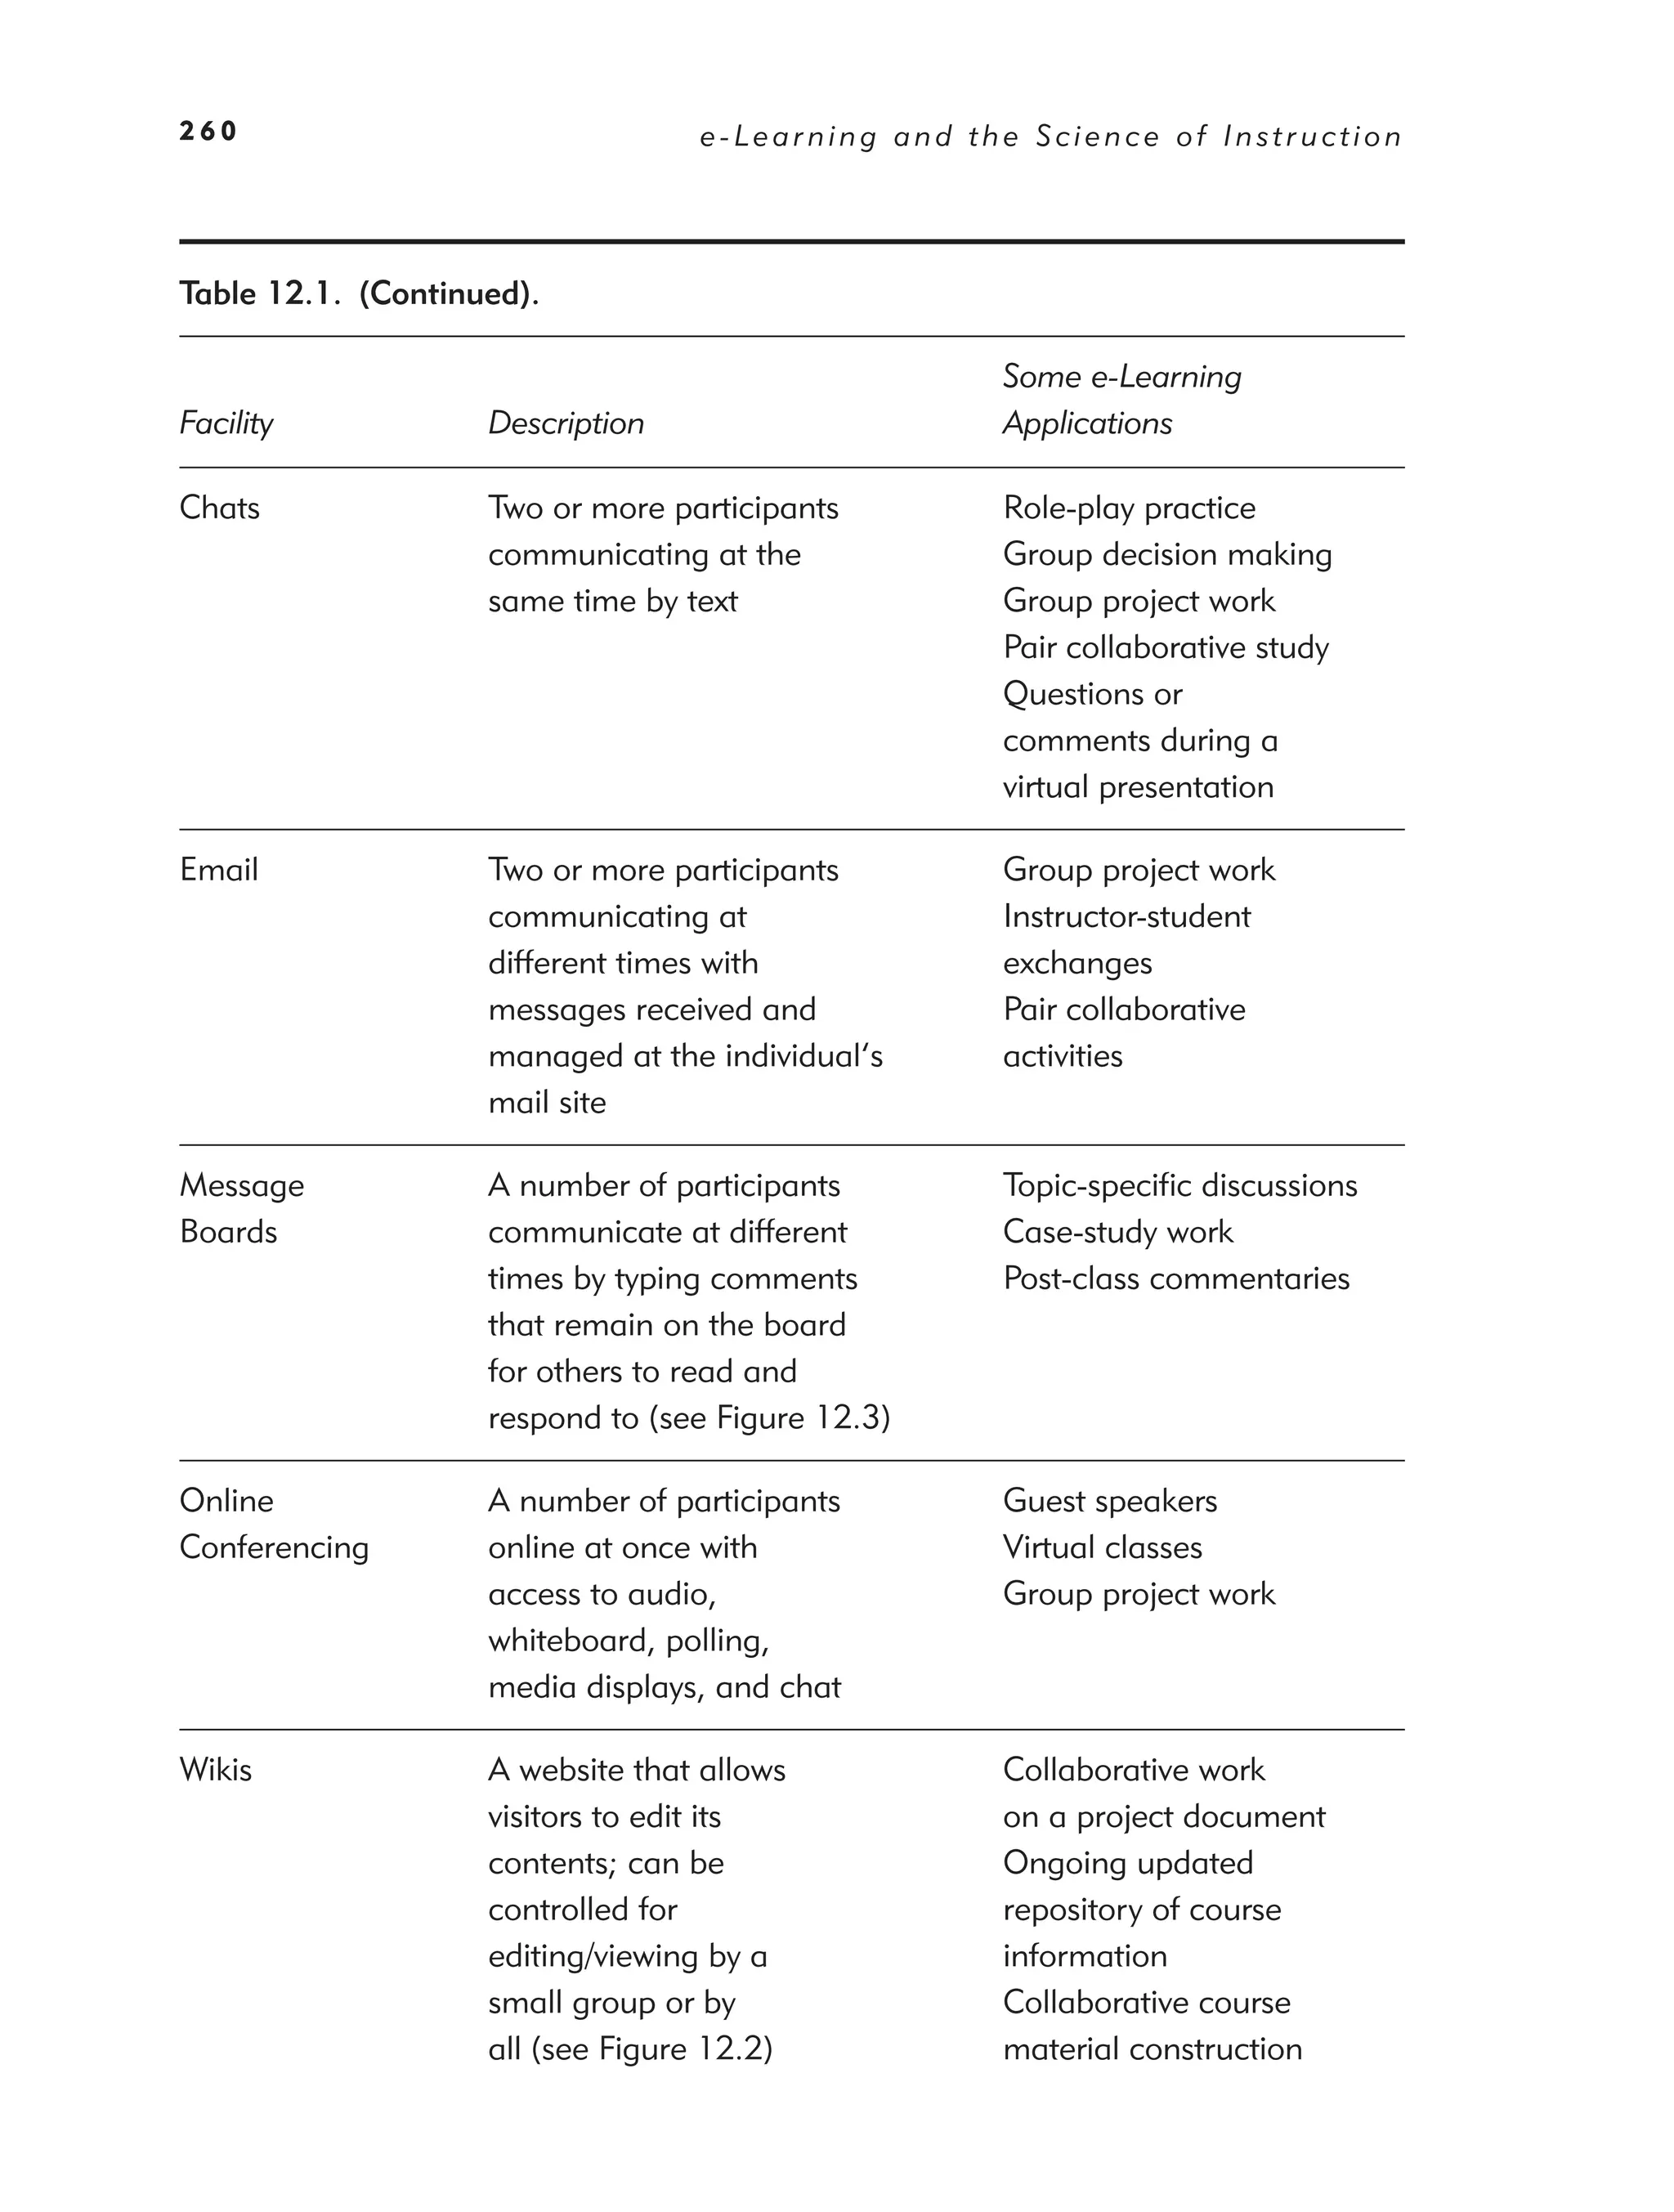
What Is Computer-Supported Collaborative Learning (CSCL)? 259
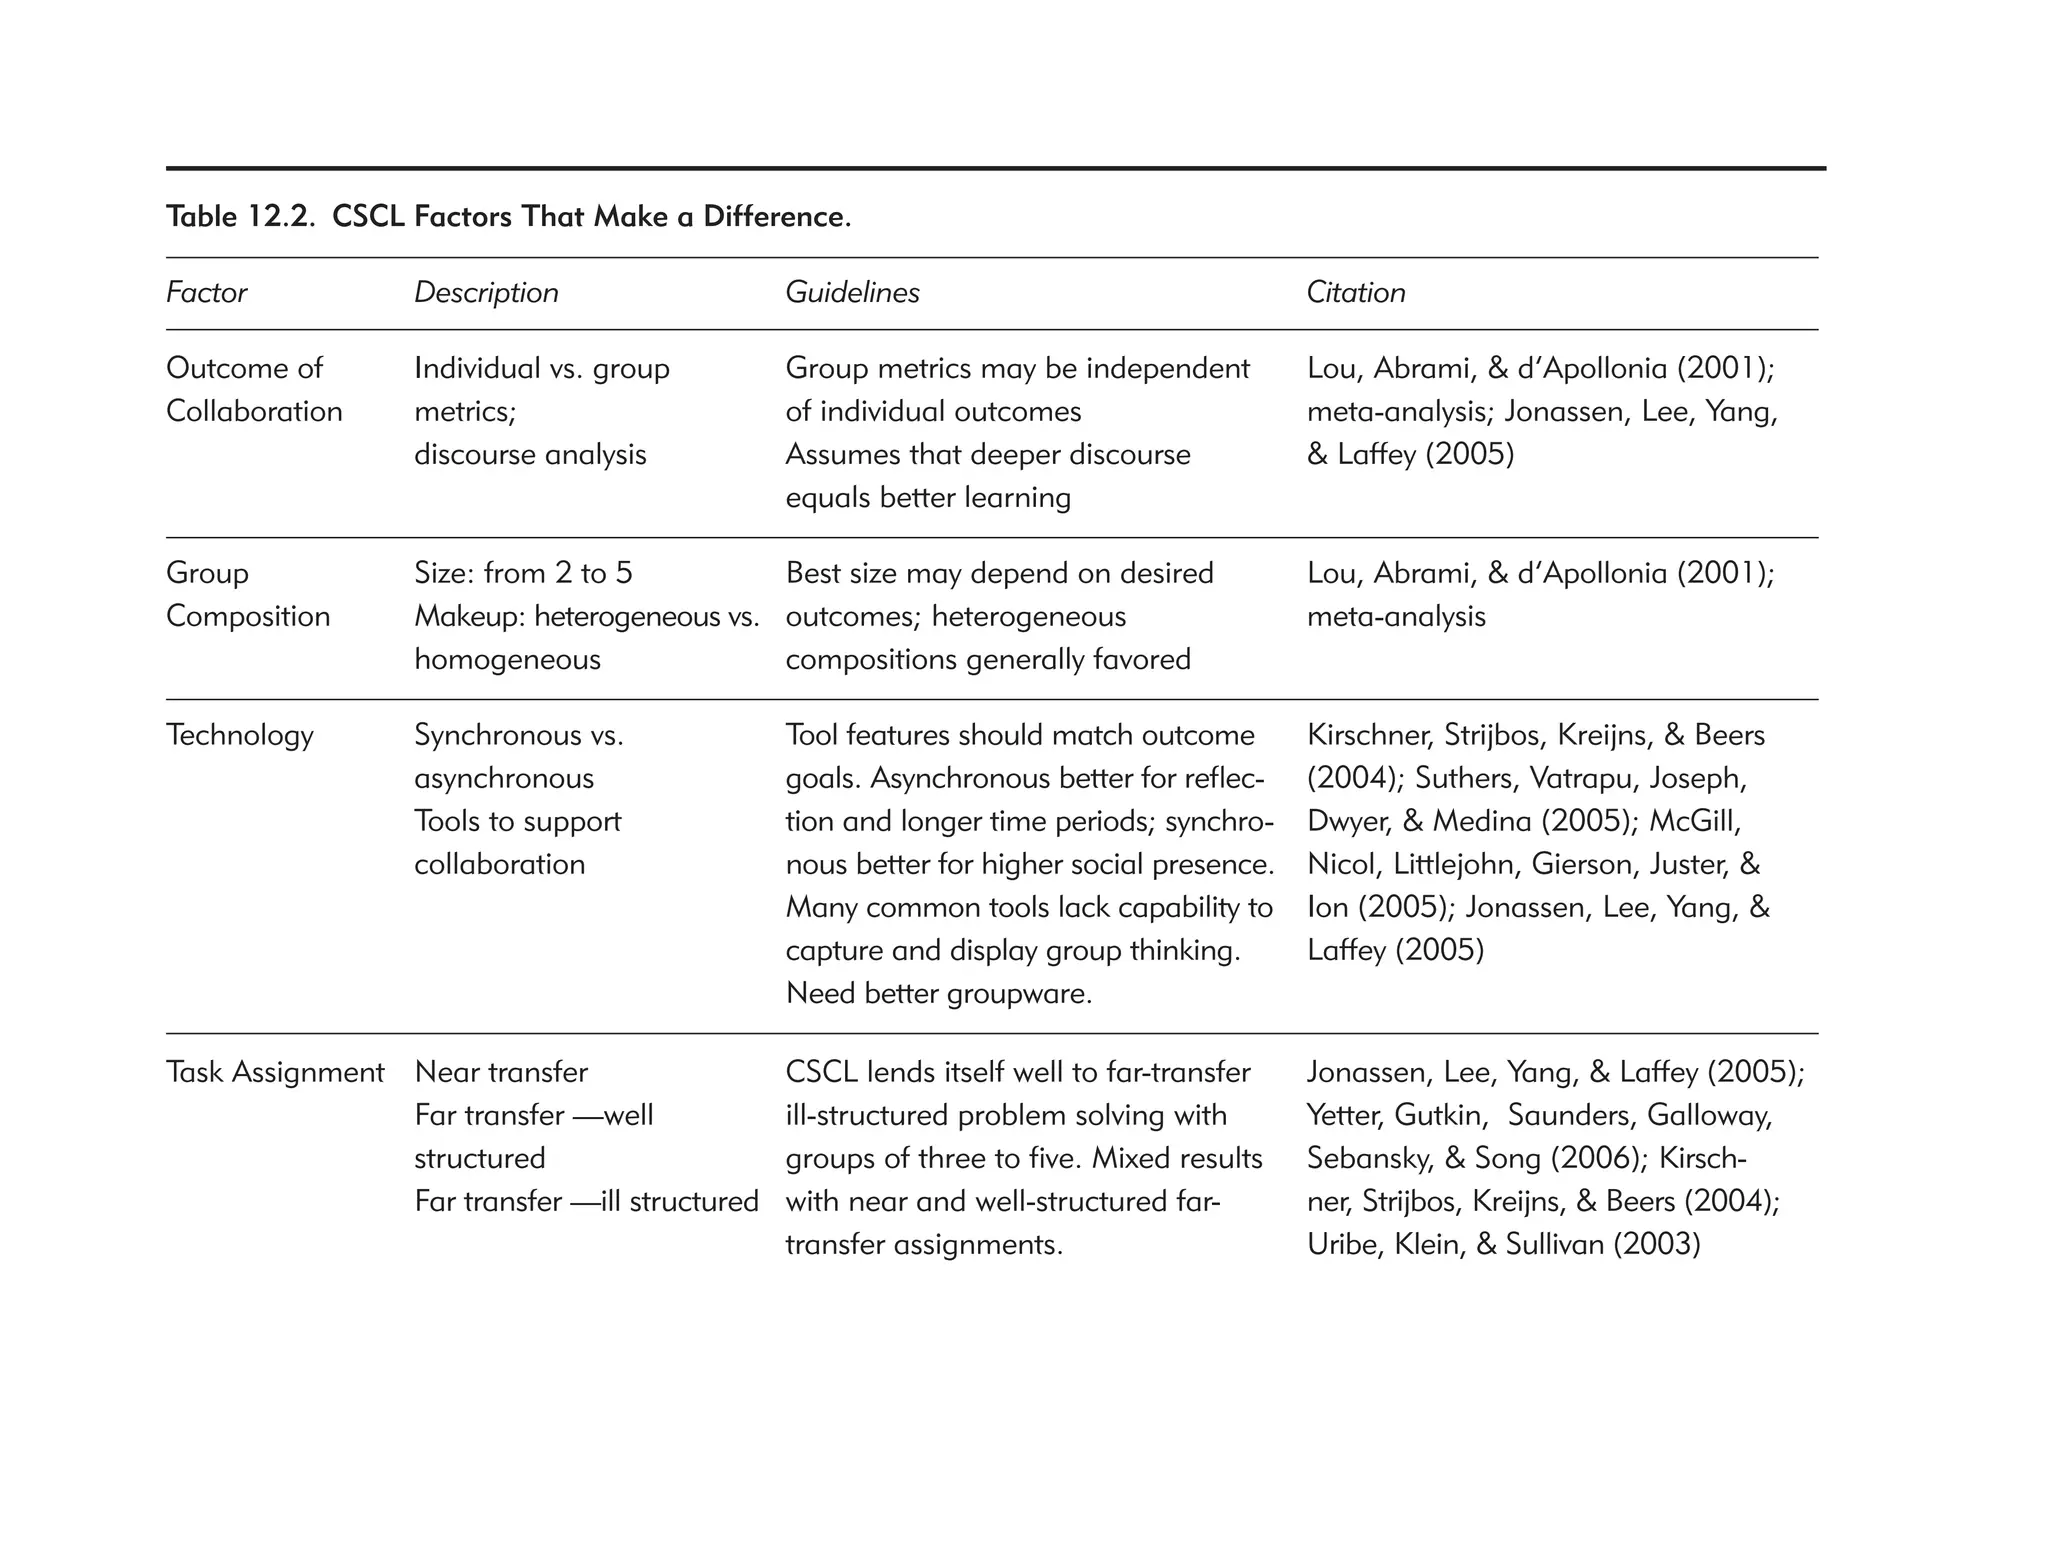
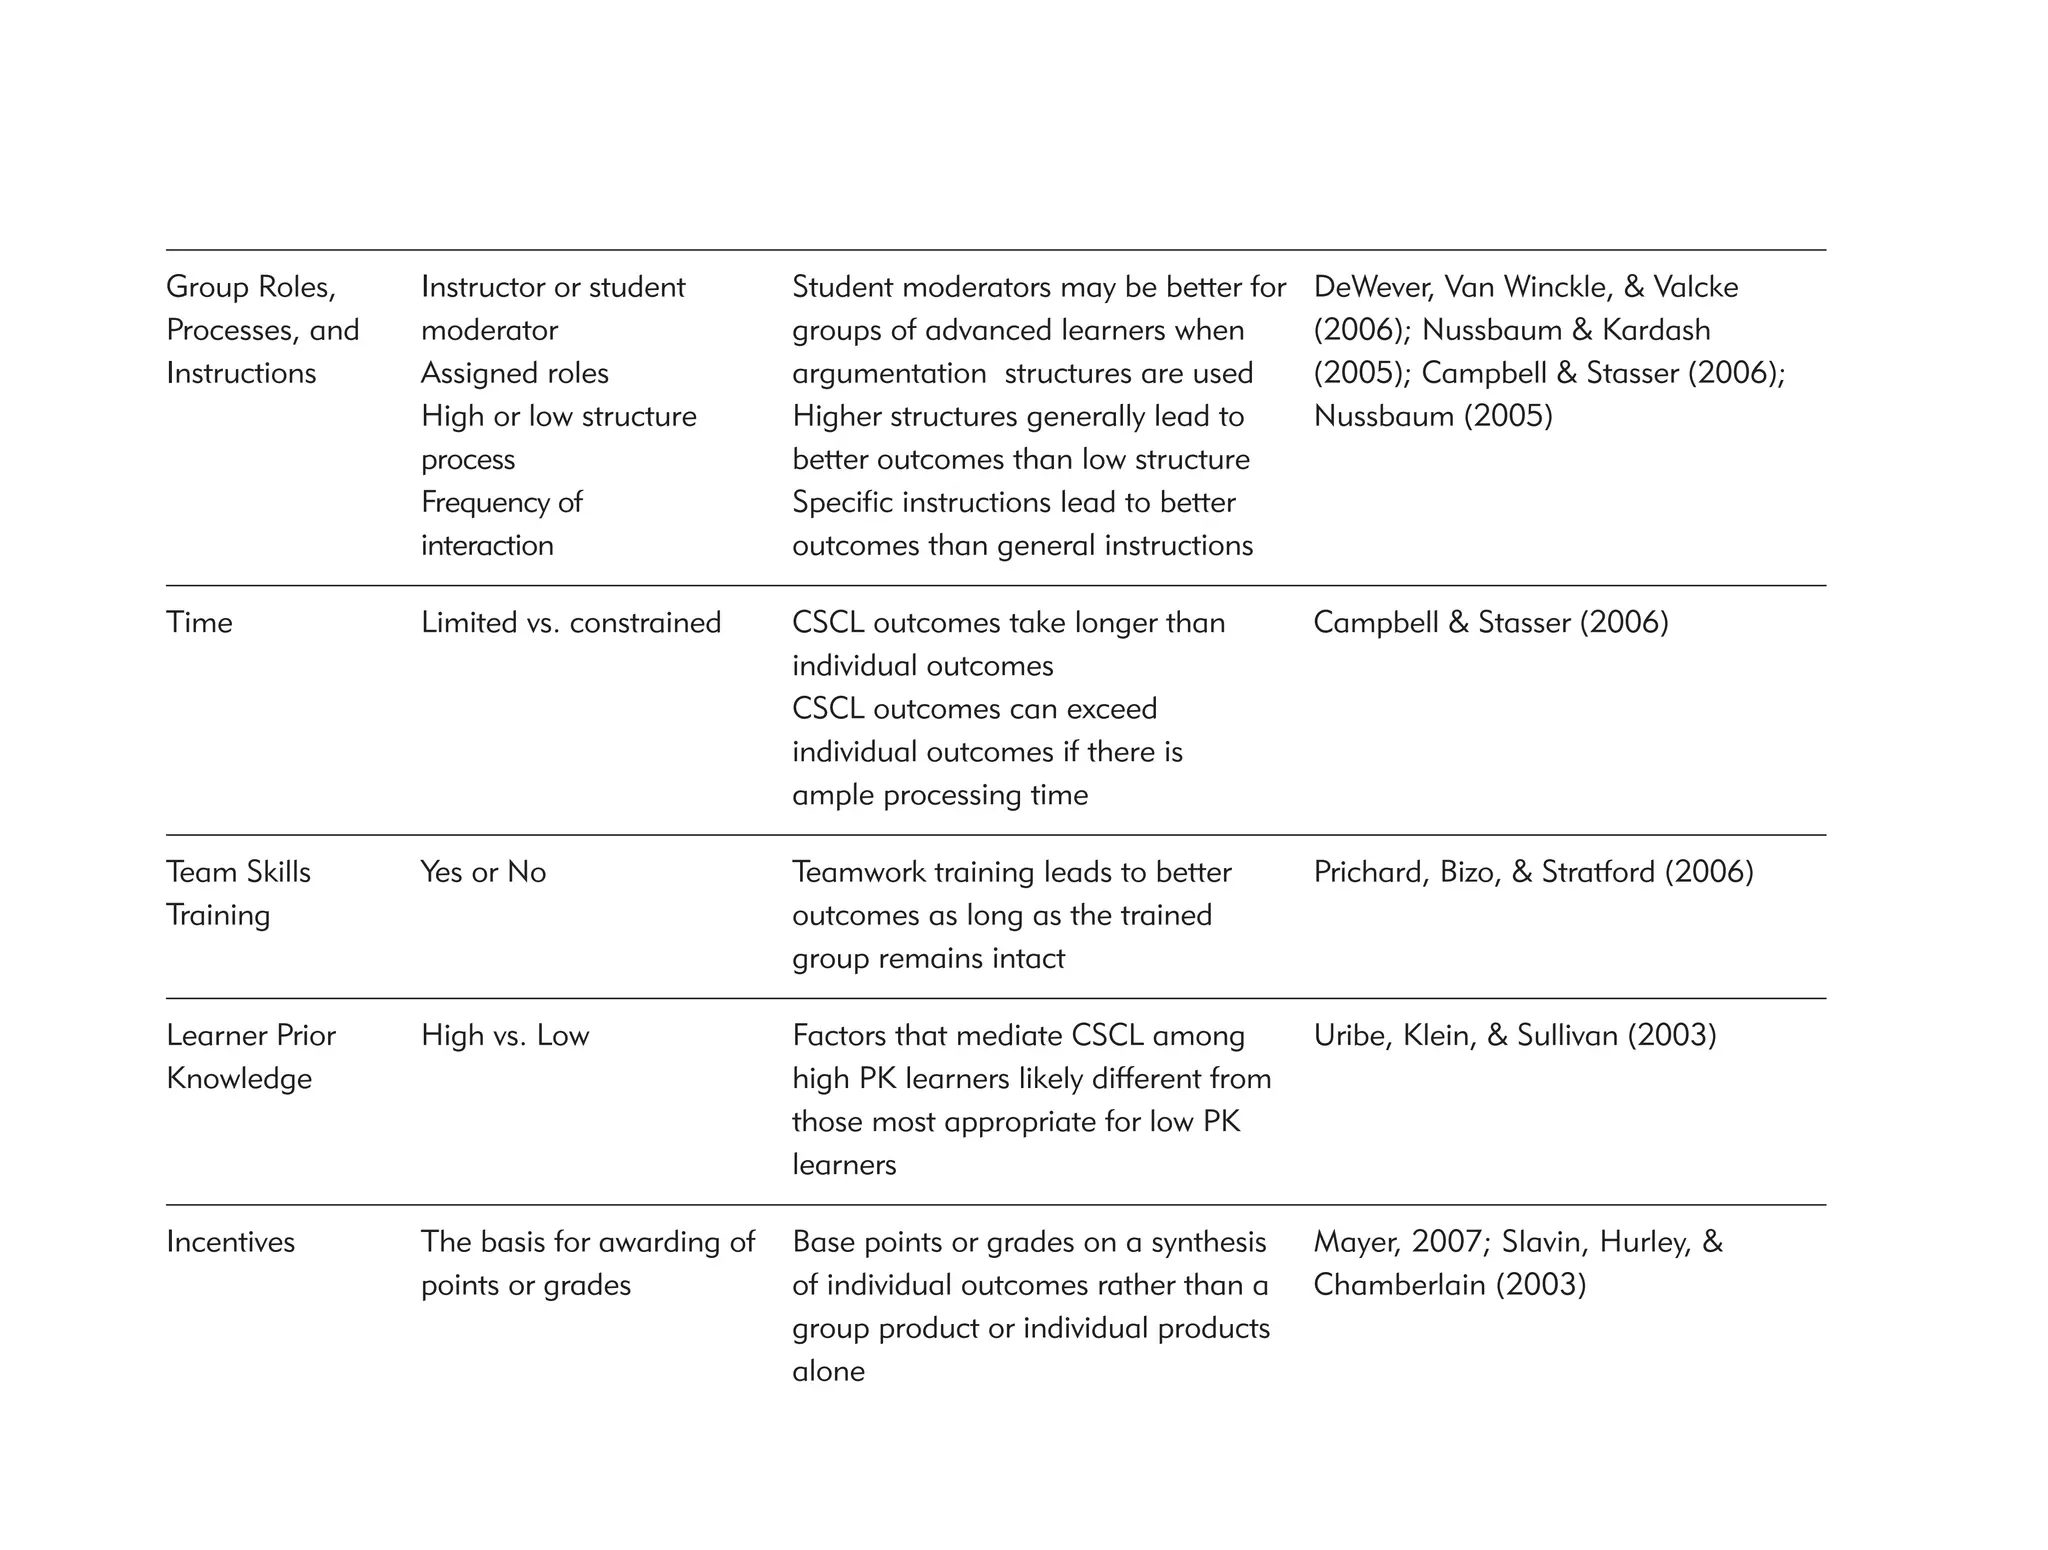
Factors That Make a Difference: Overview 264
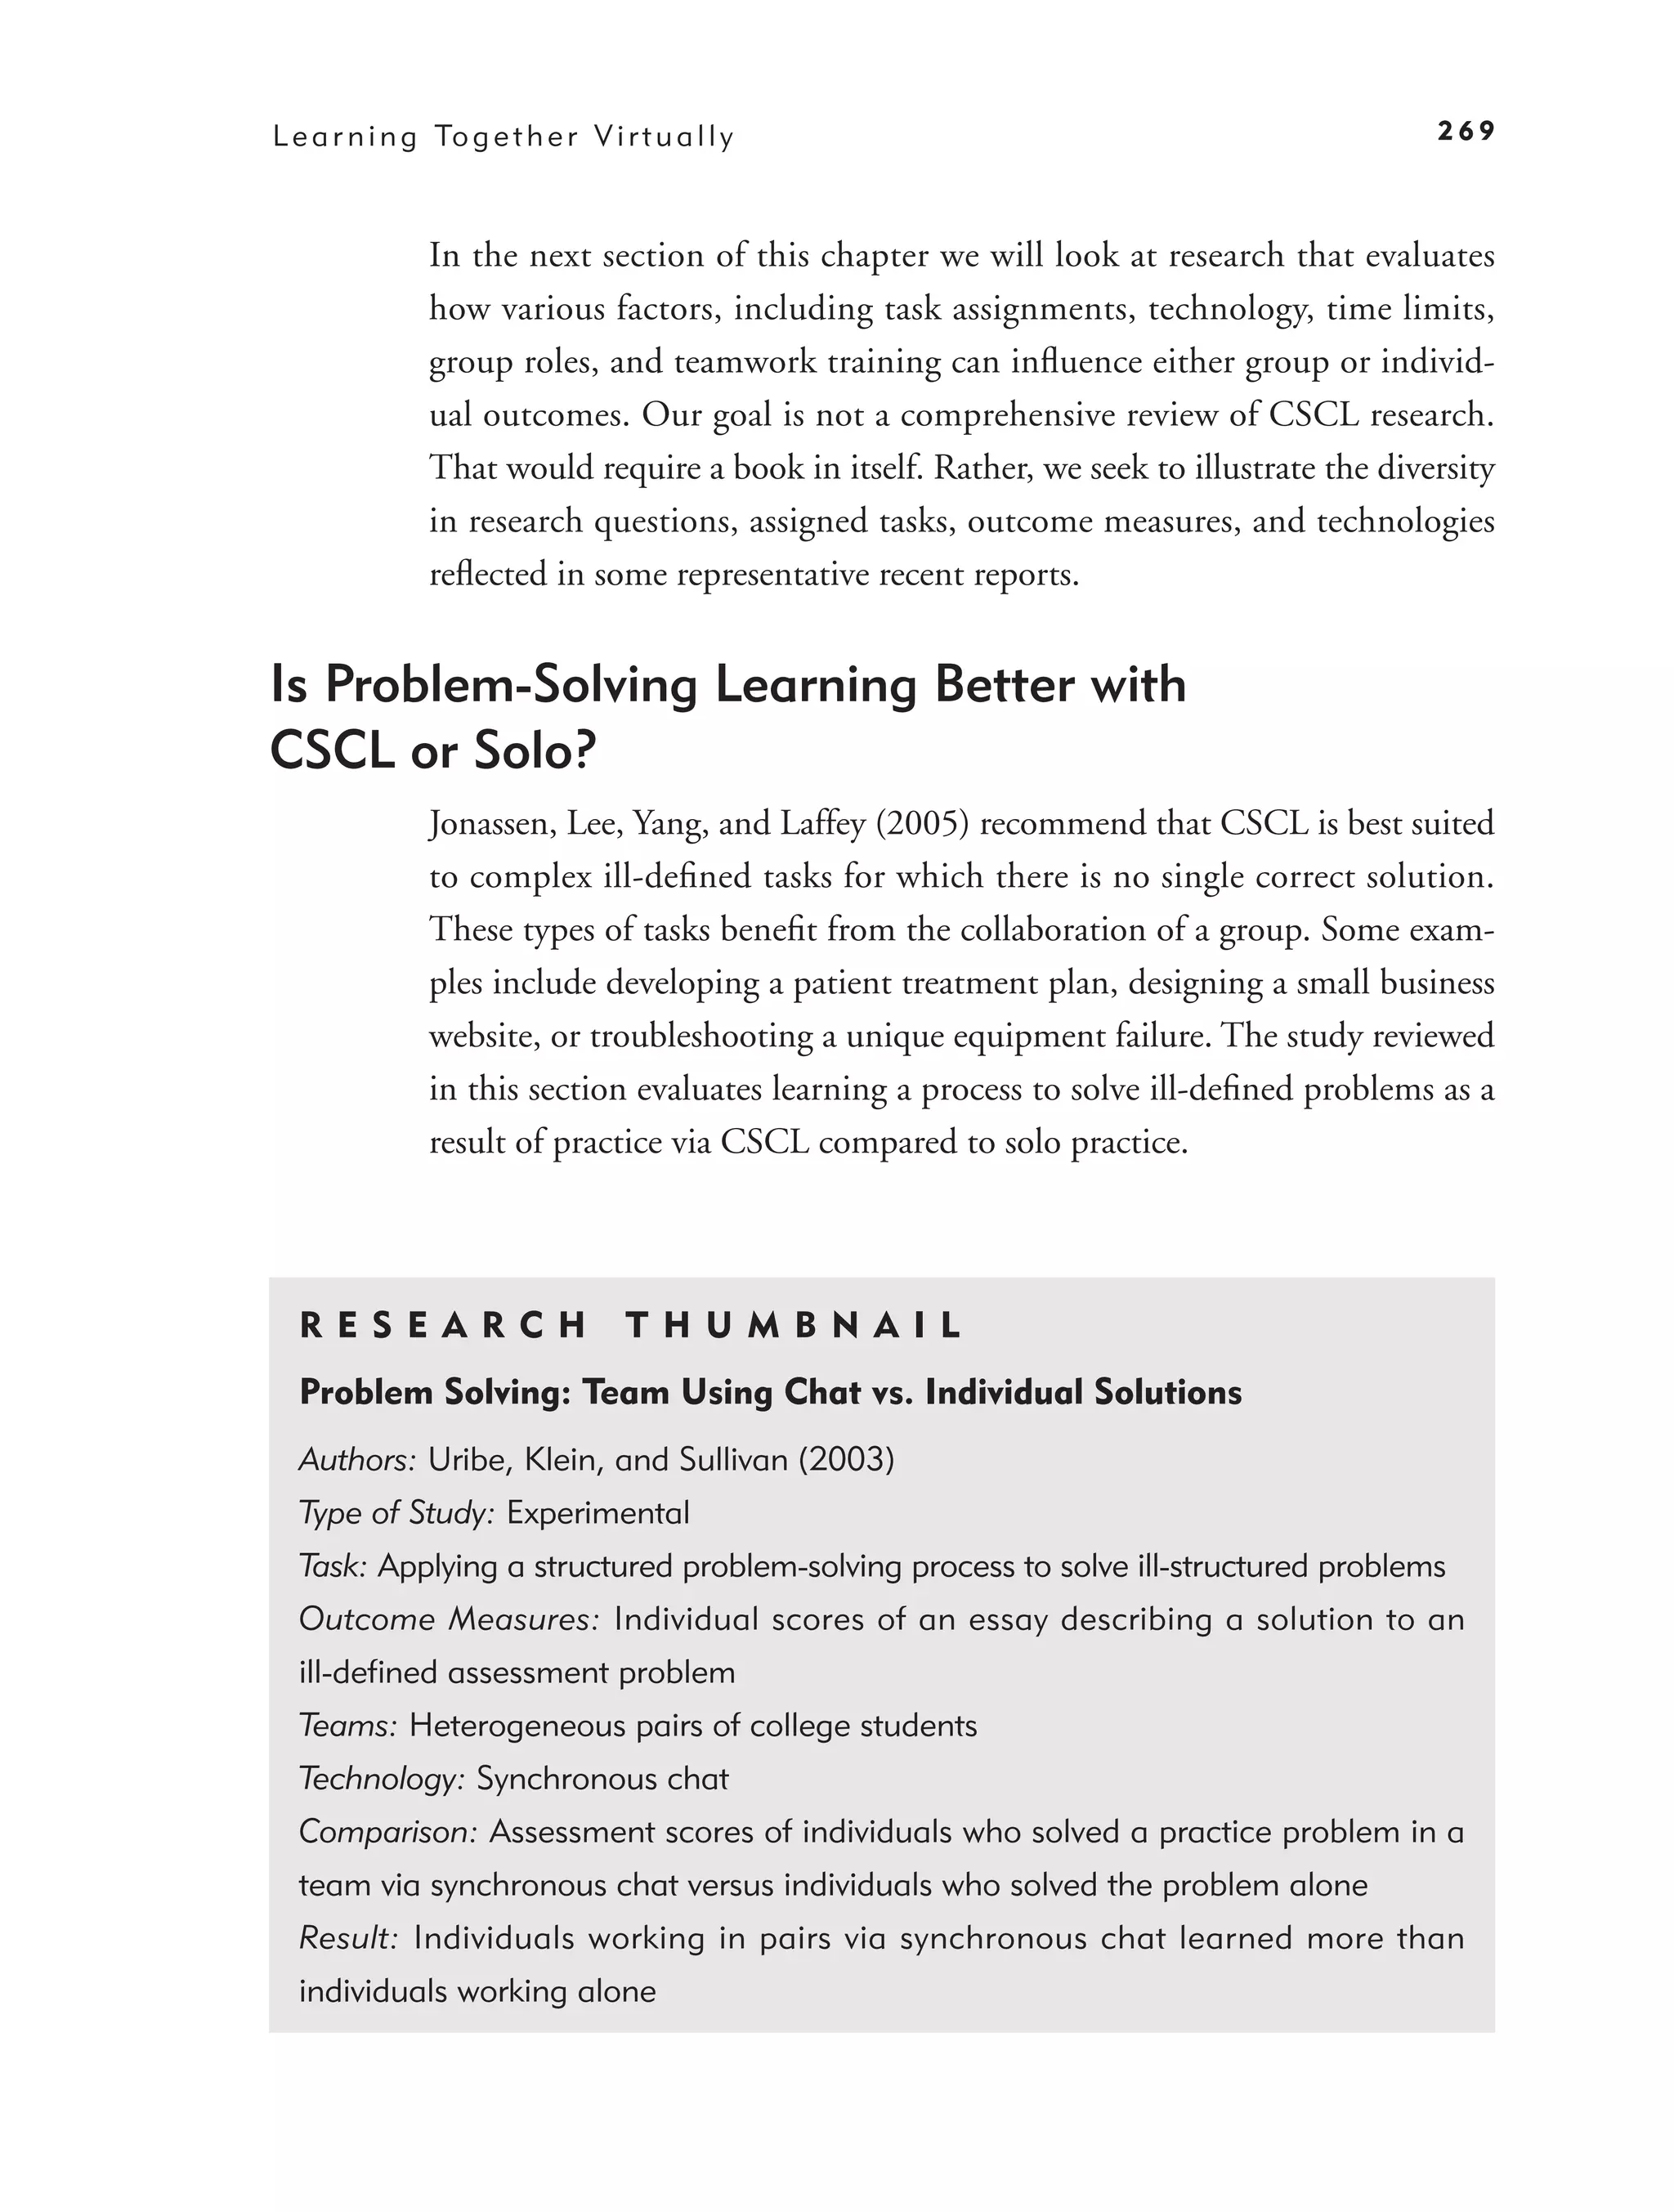
Is Problem-Solving Learning Better with CSCL or Solo? 269
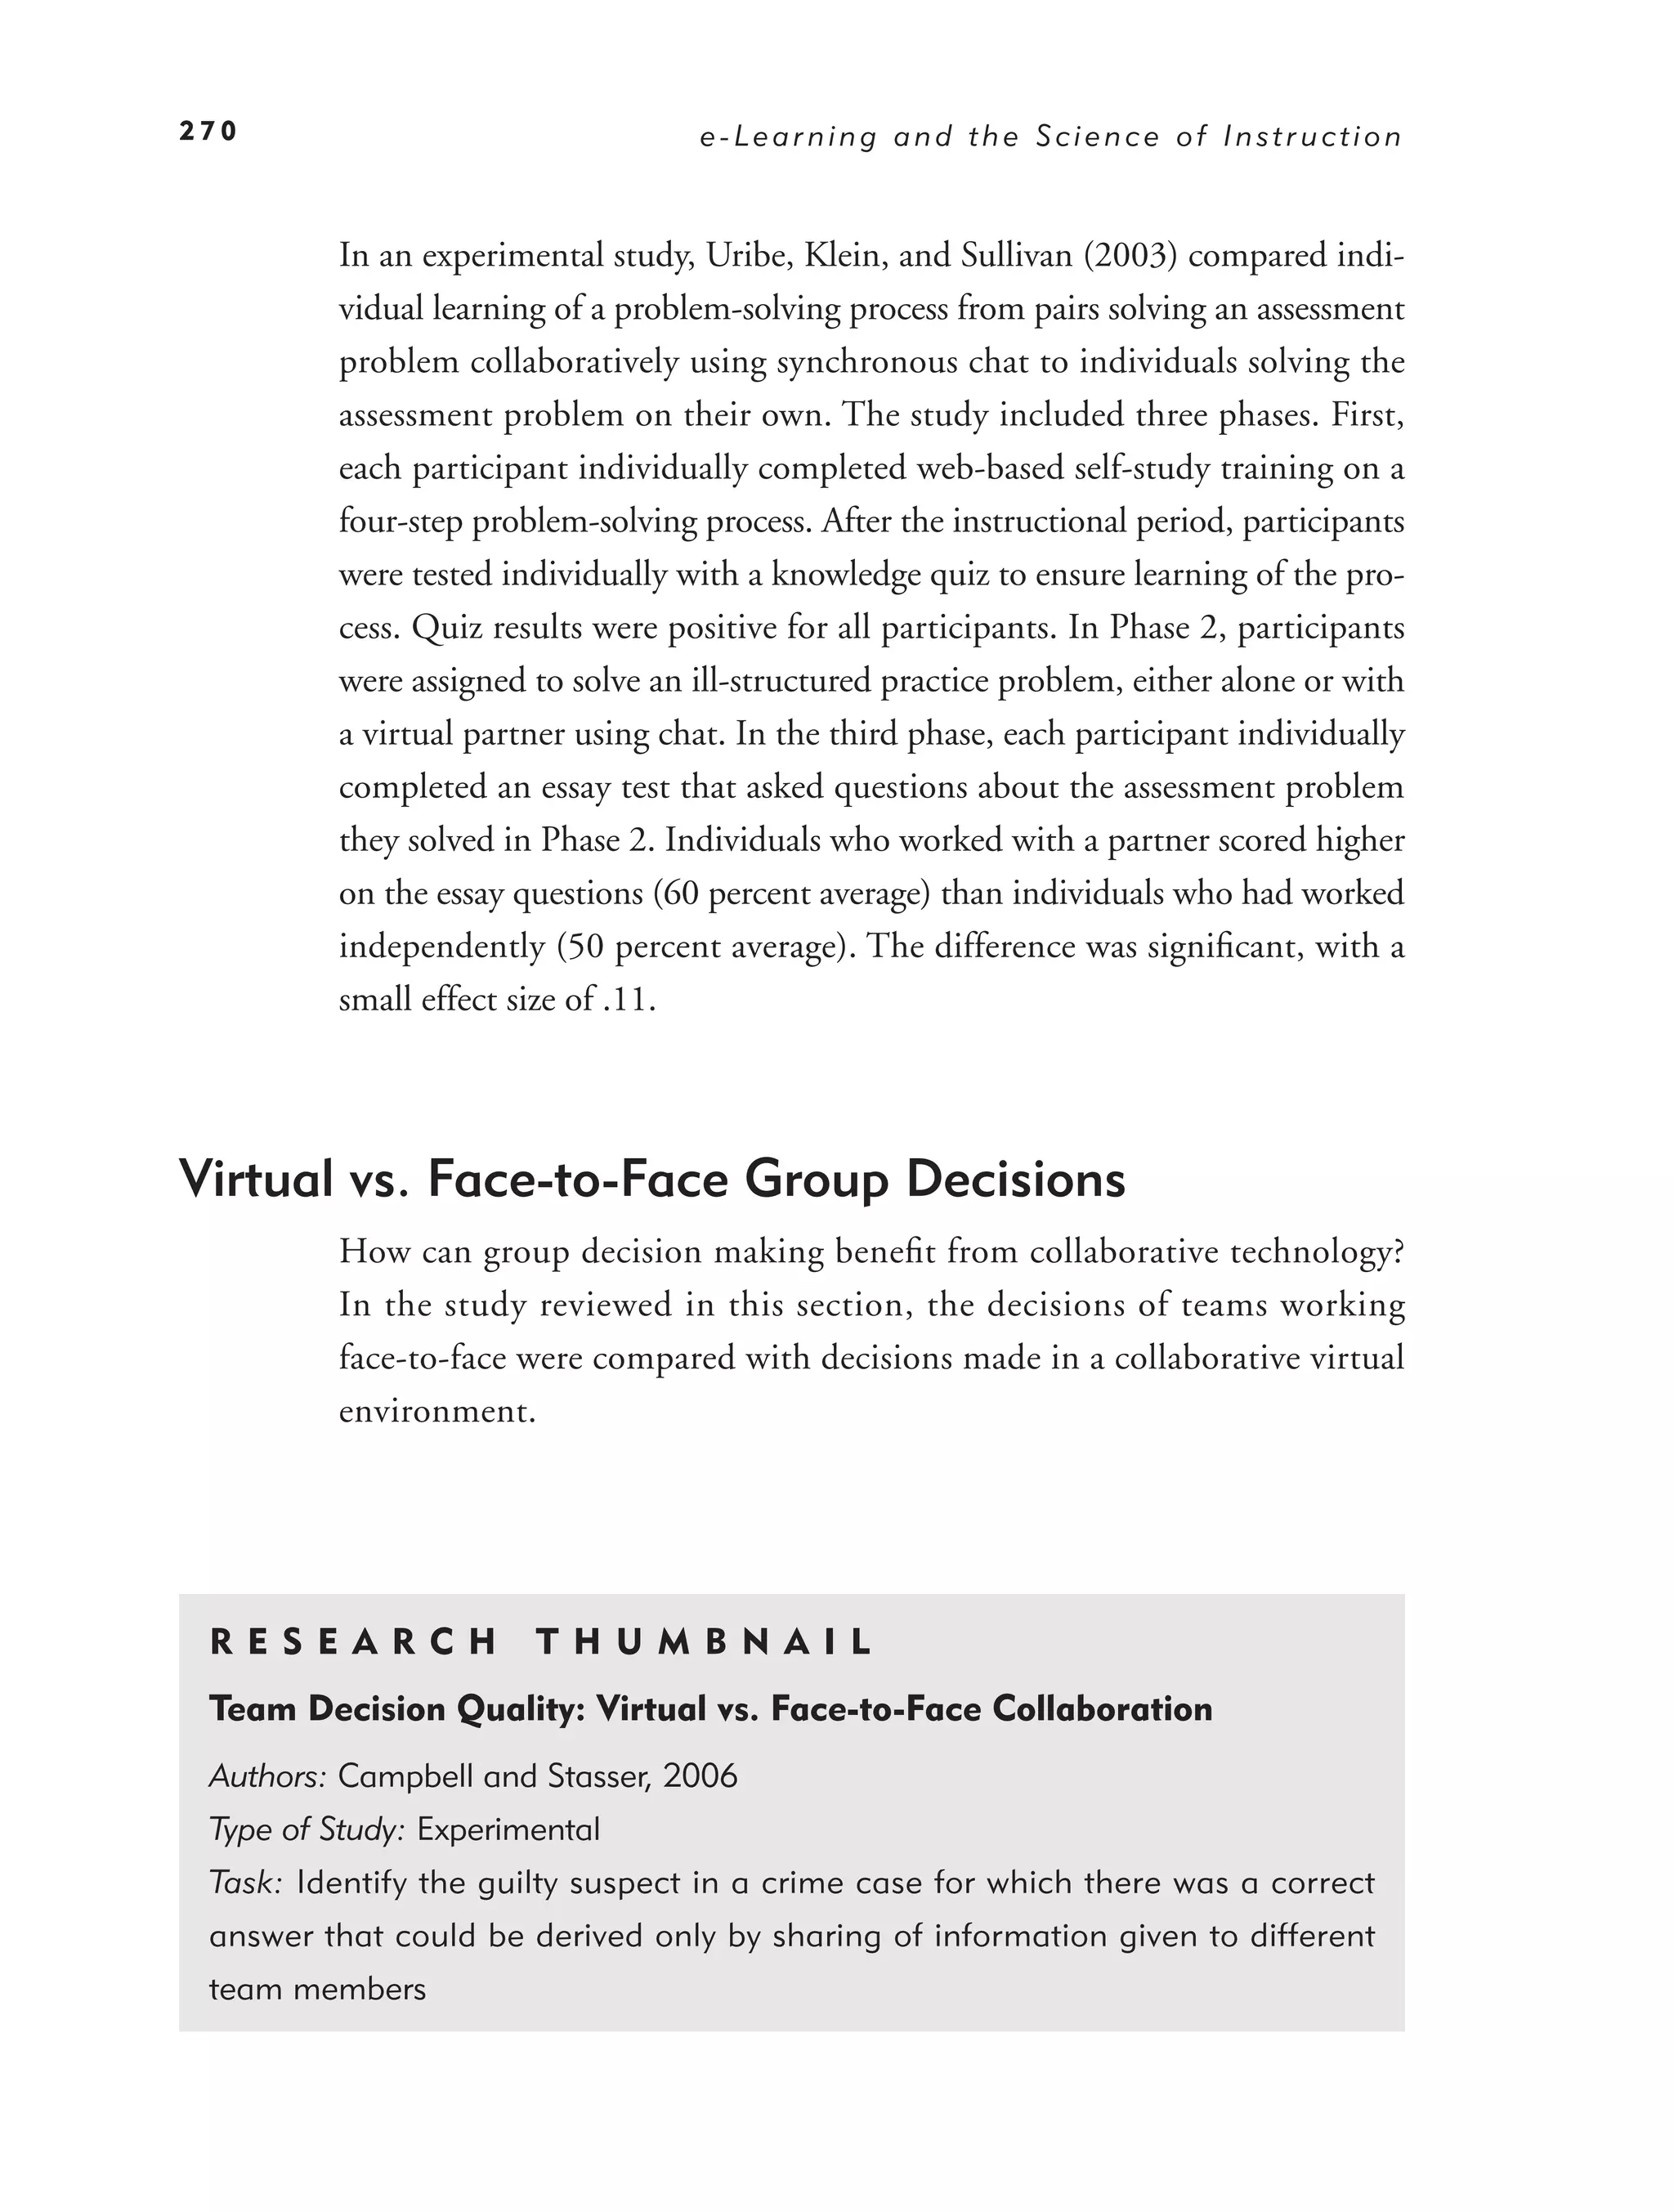
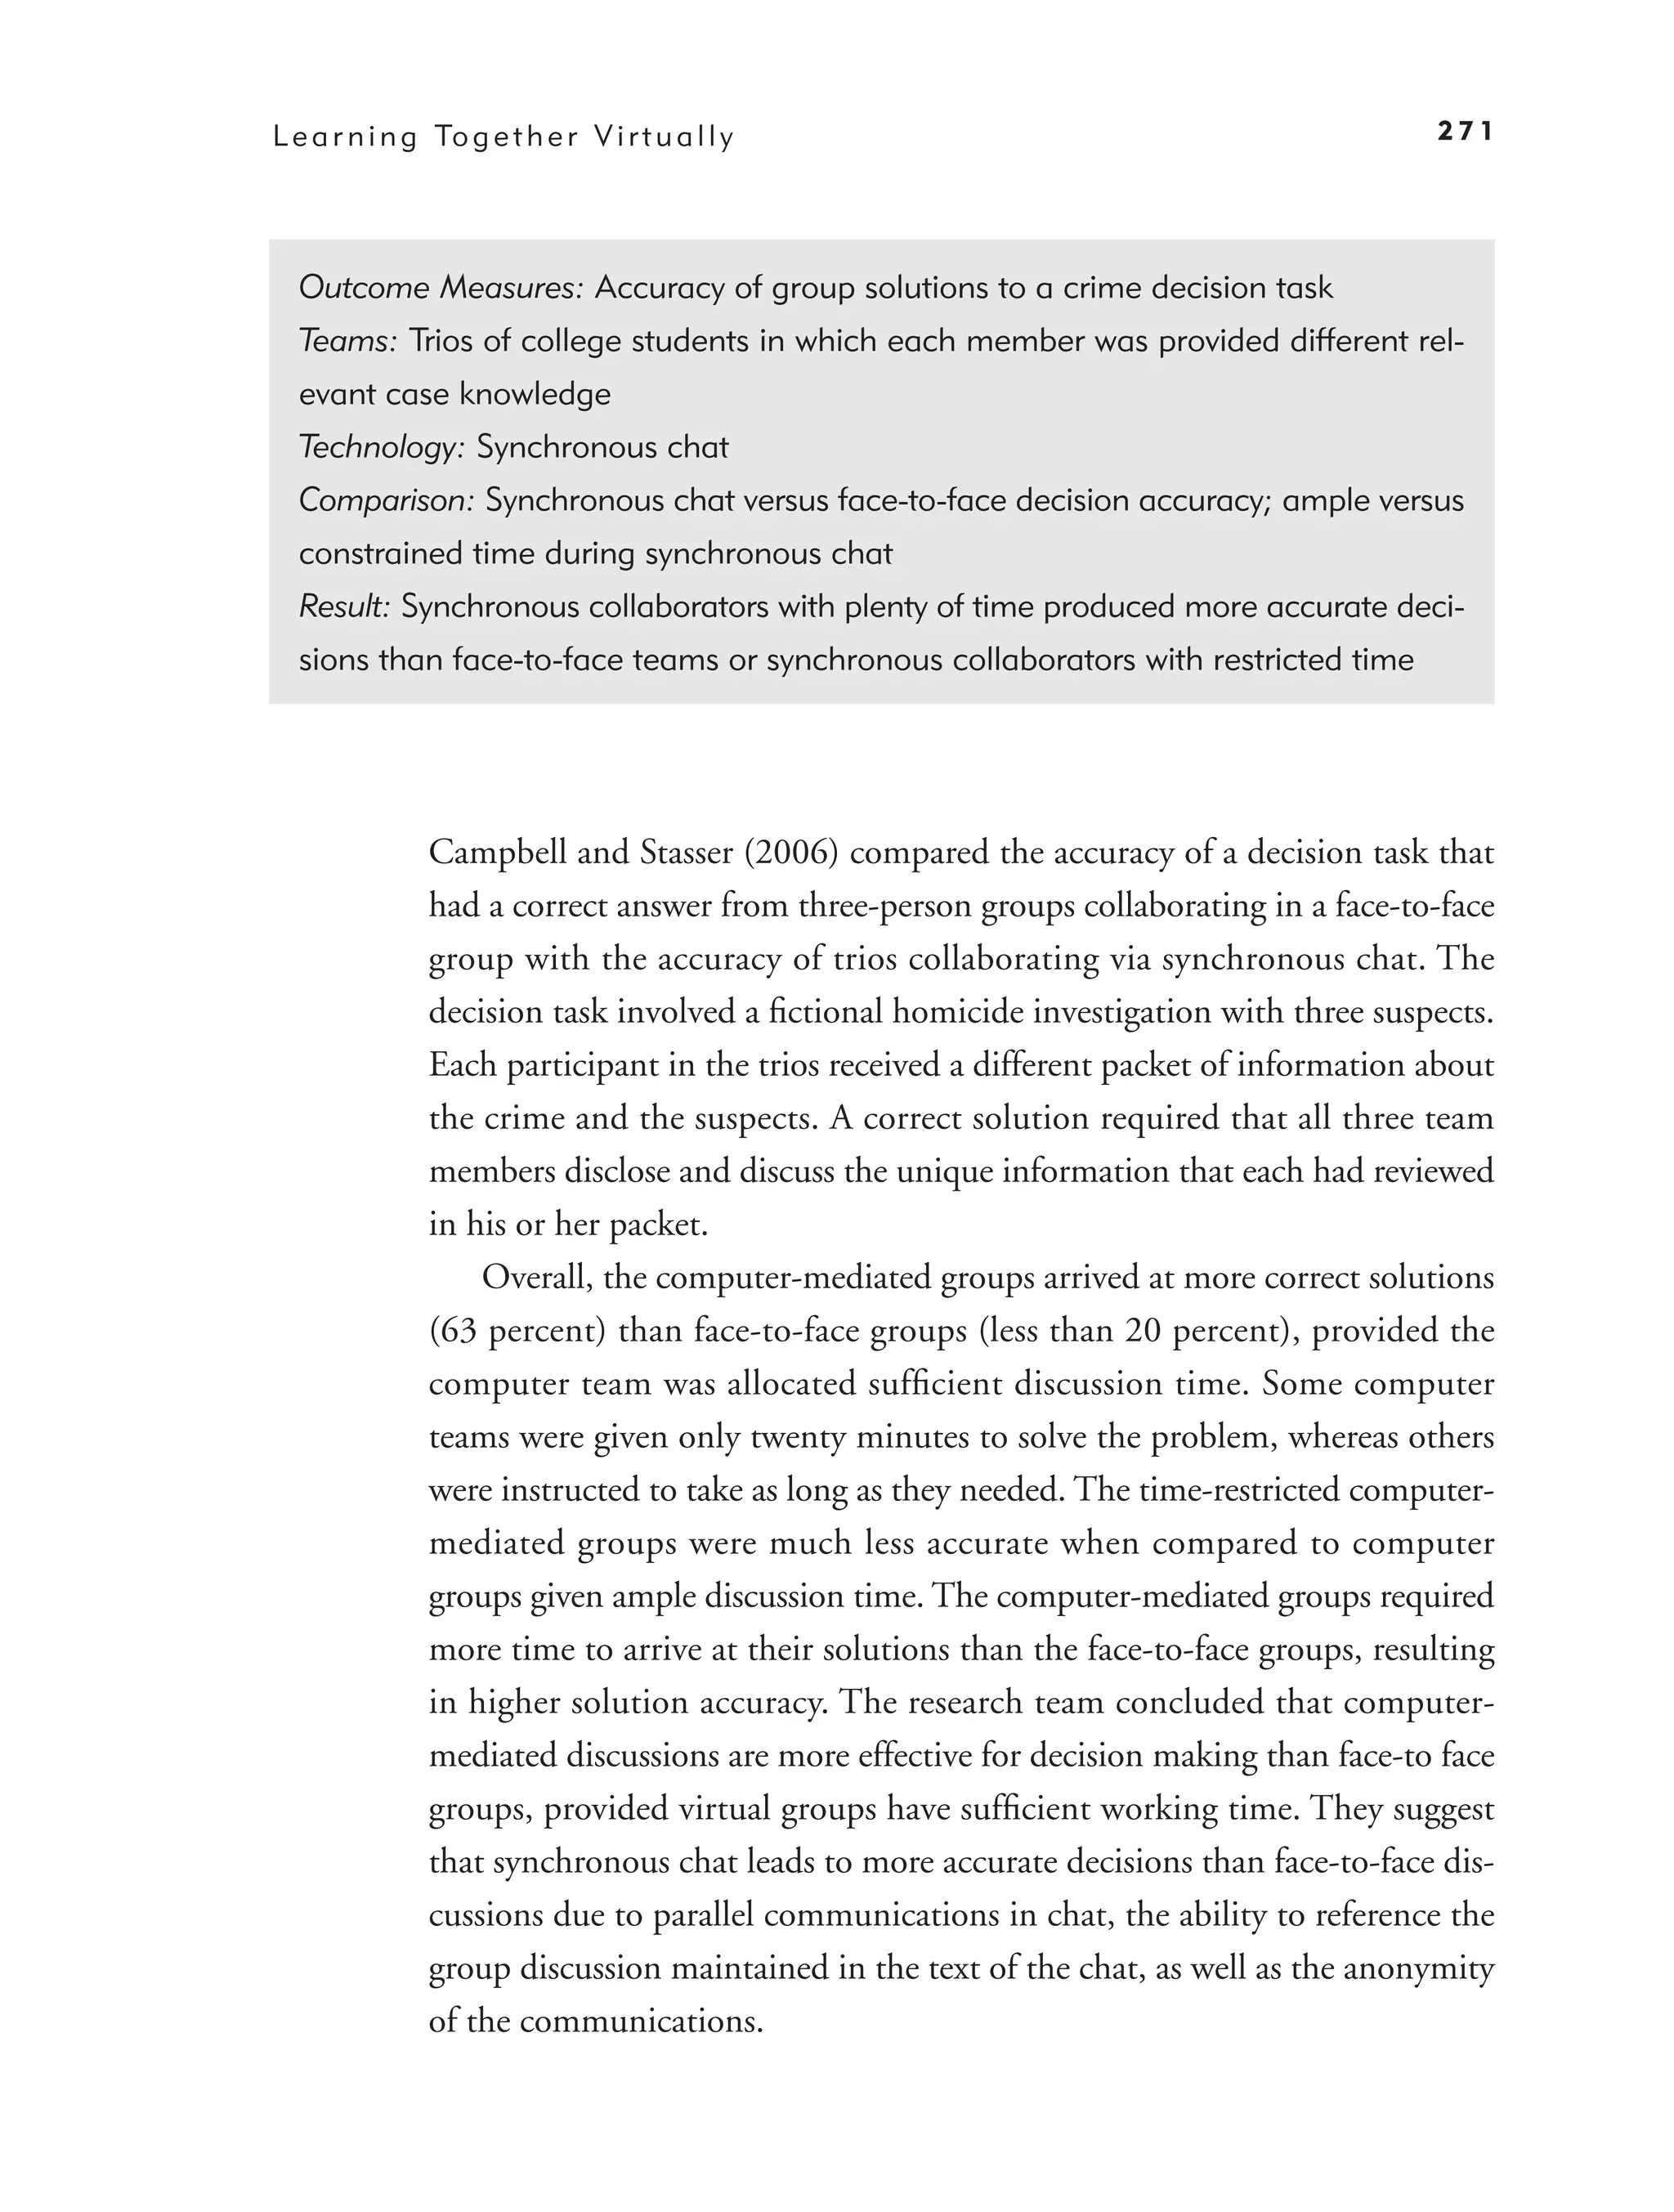
Virtual vs. Face-to-Face Group Decisions 270
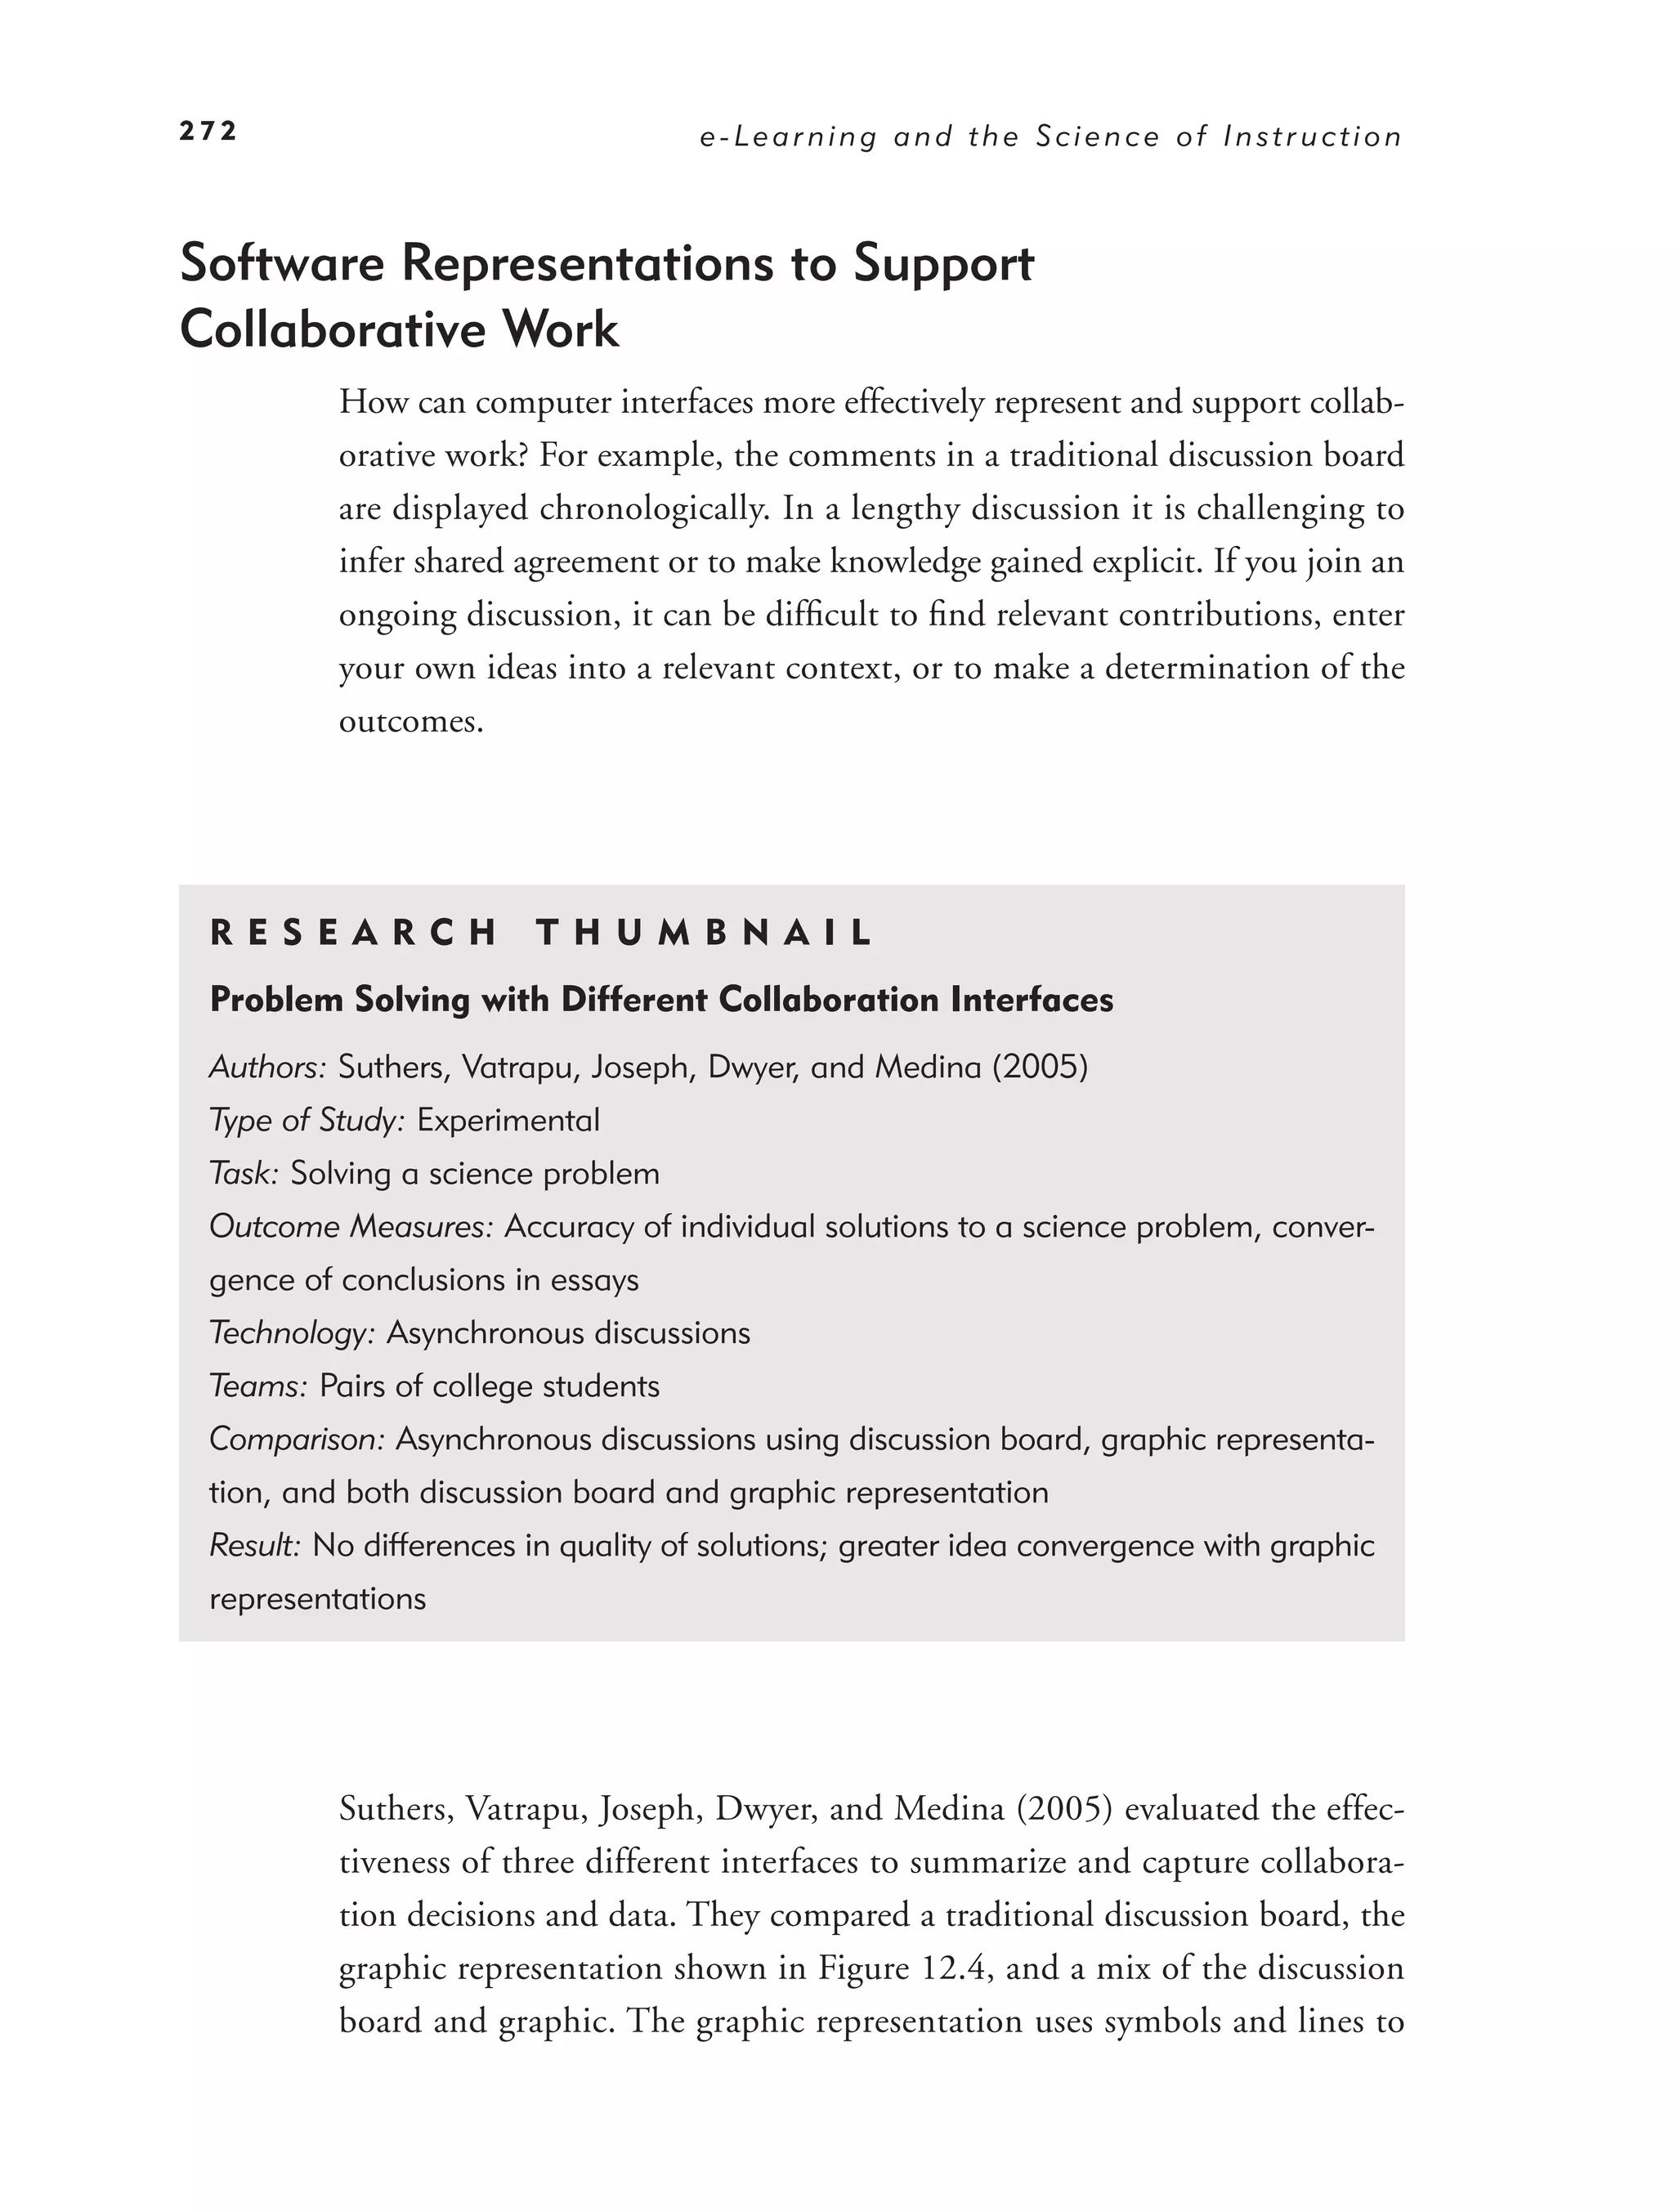
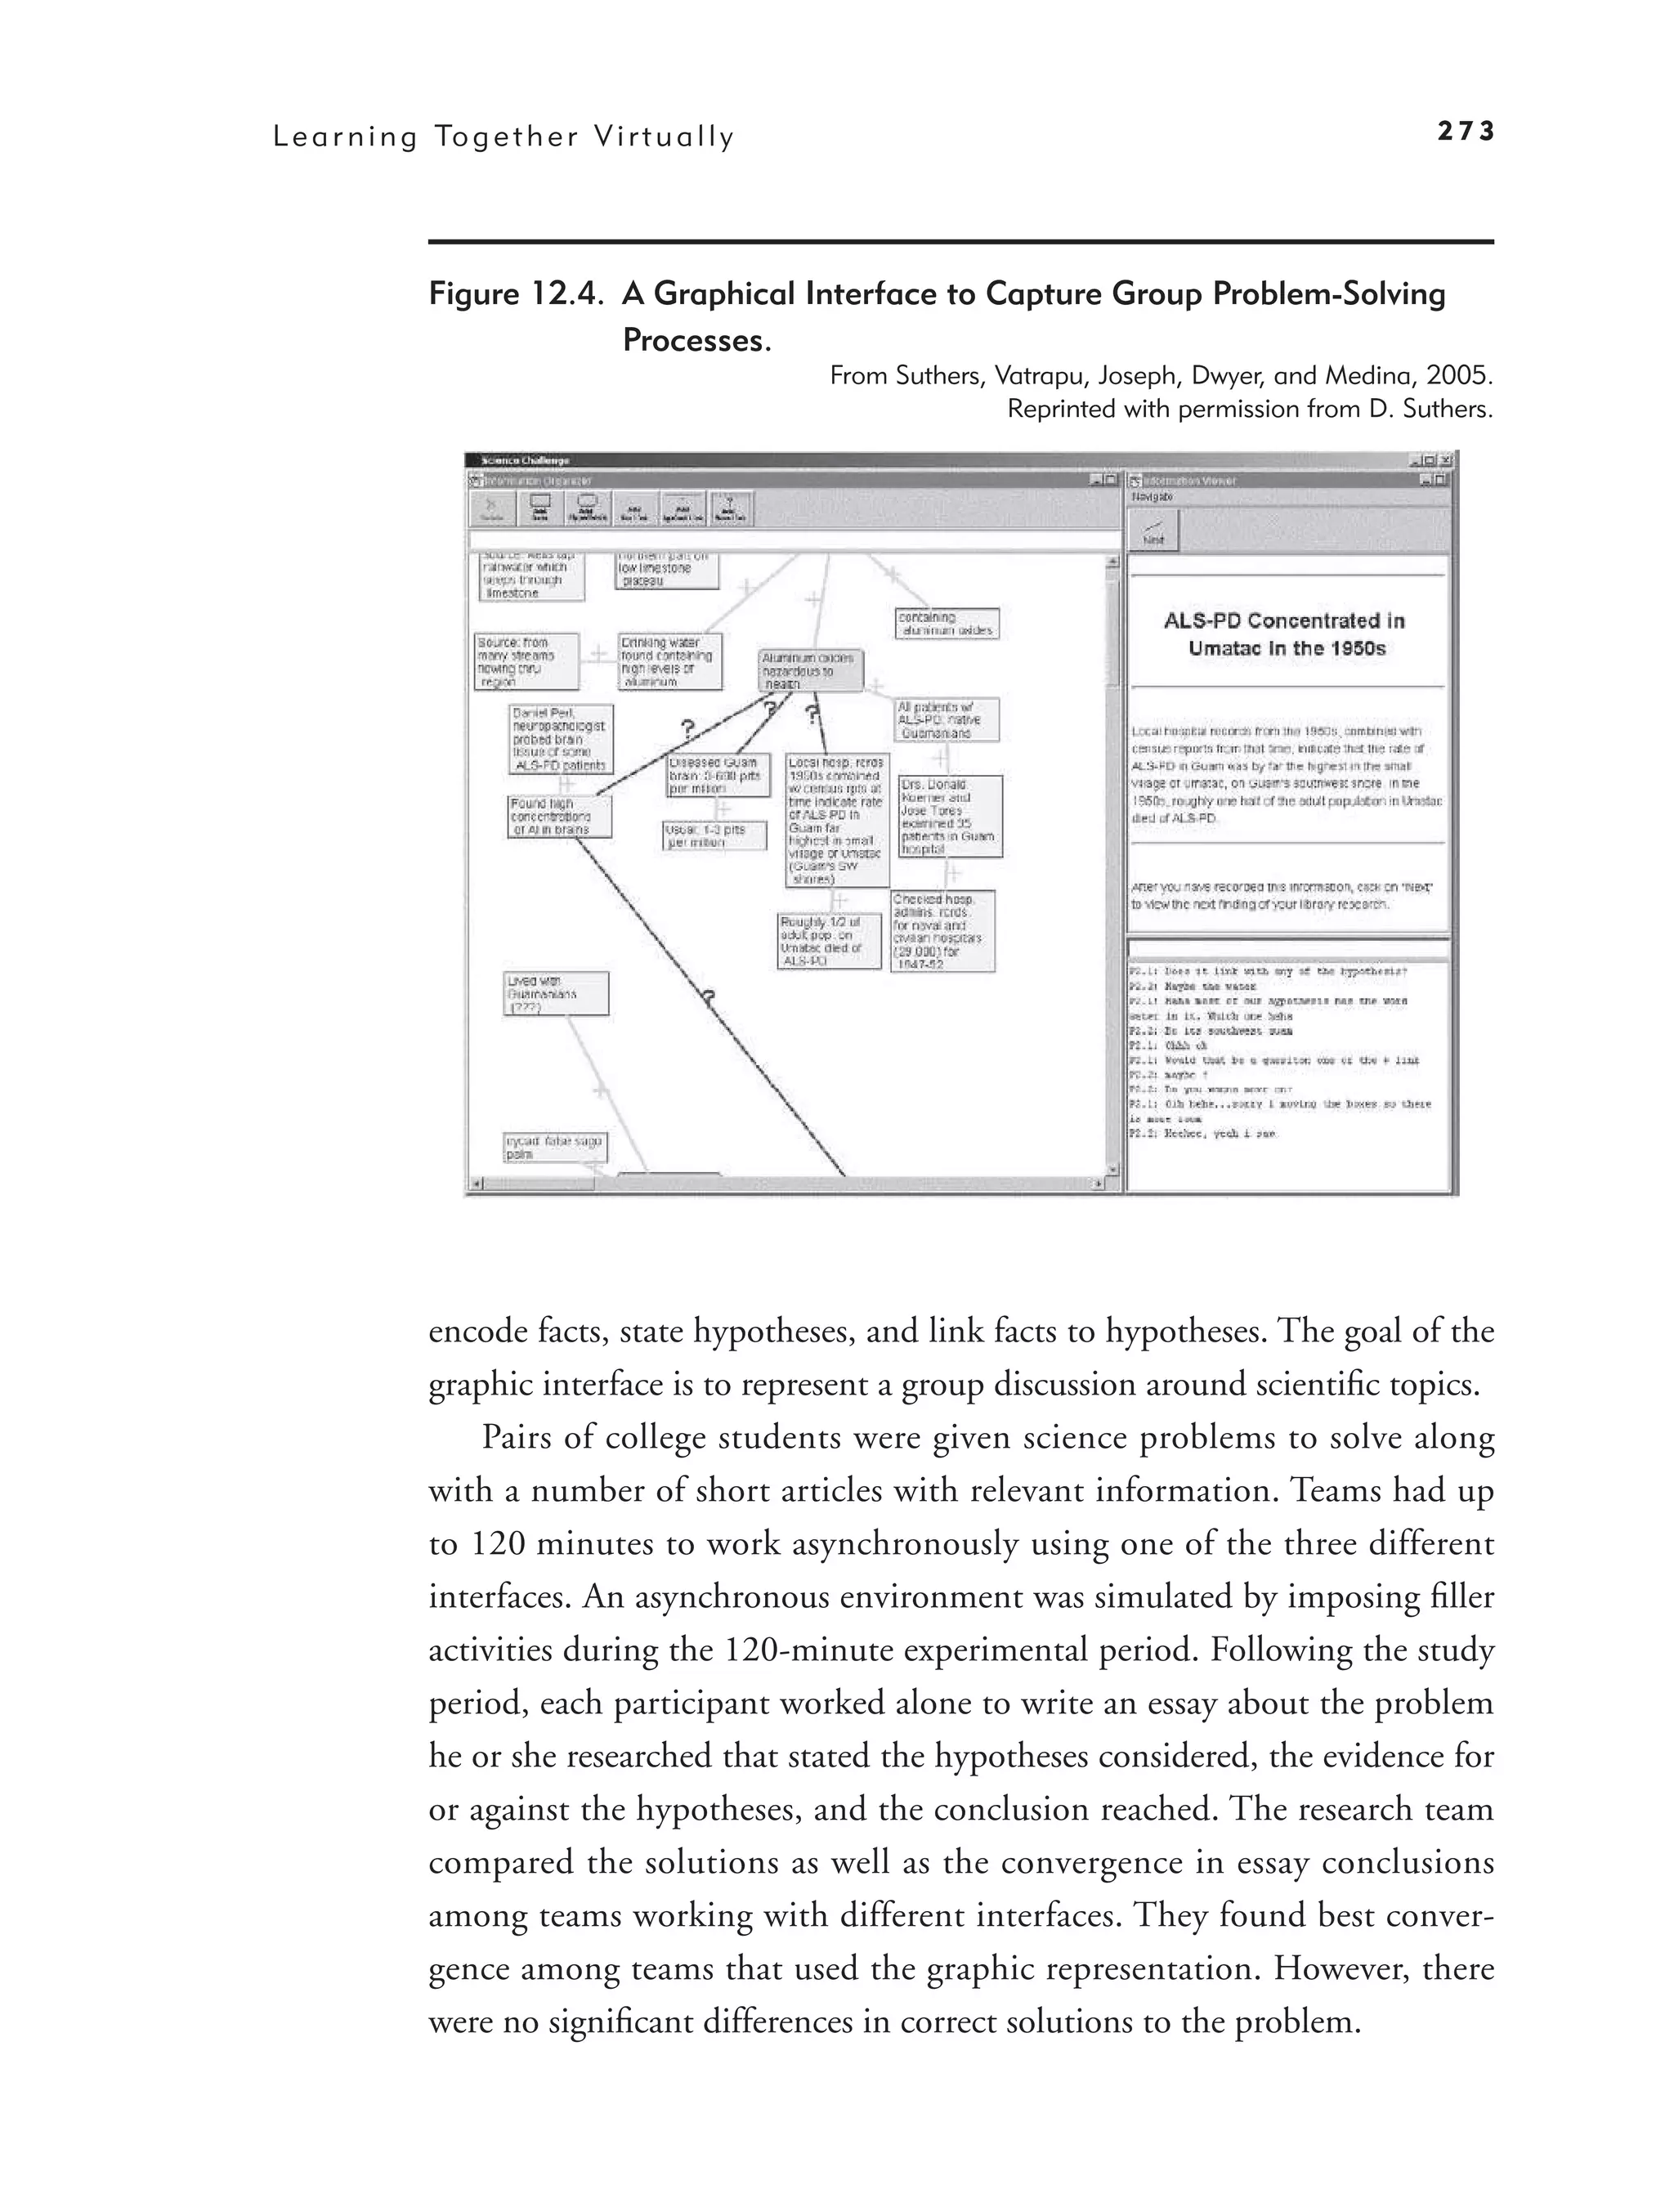
Software Representations to Support Collaborative Work 272
Group Roles and Assignments in CSCL 274
Team-Building Skills and CSCL Outcomes 276
Collaborative Structures and CSCL Outcomes 278
Collaborative Group Techniques 278
CSCL: The Bottom Line 283
13. Who’s in Control? Guidelines for e-Learning
Navigation 289
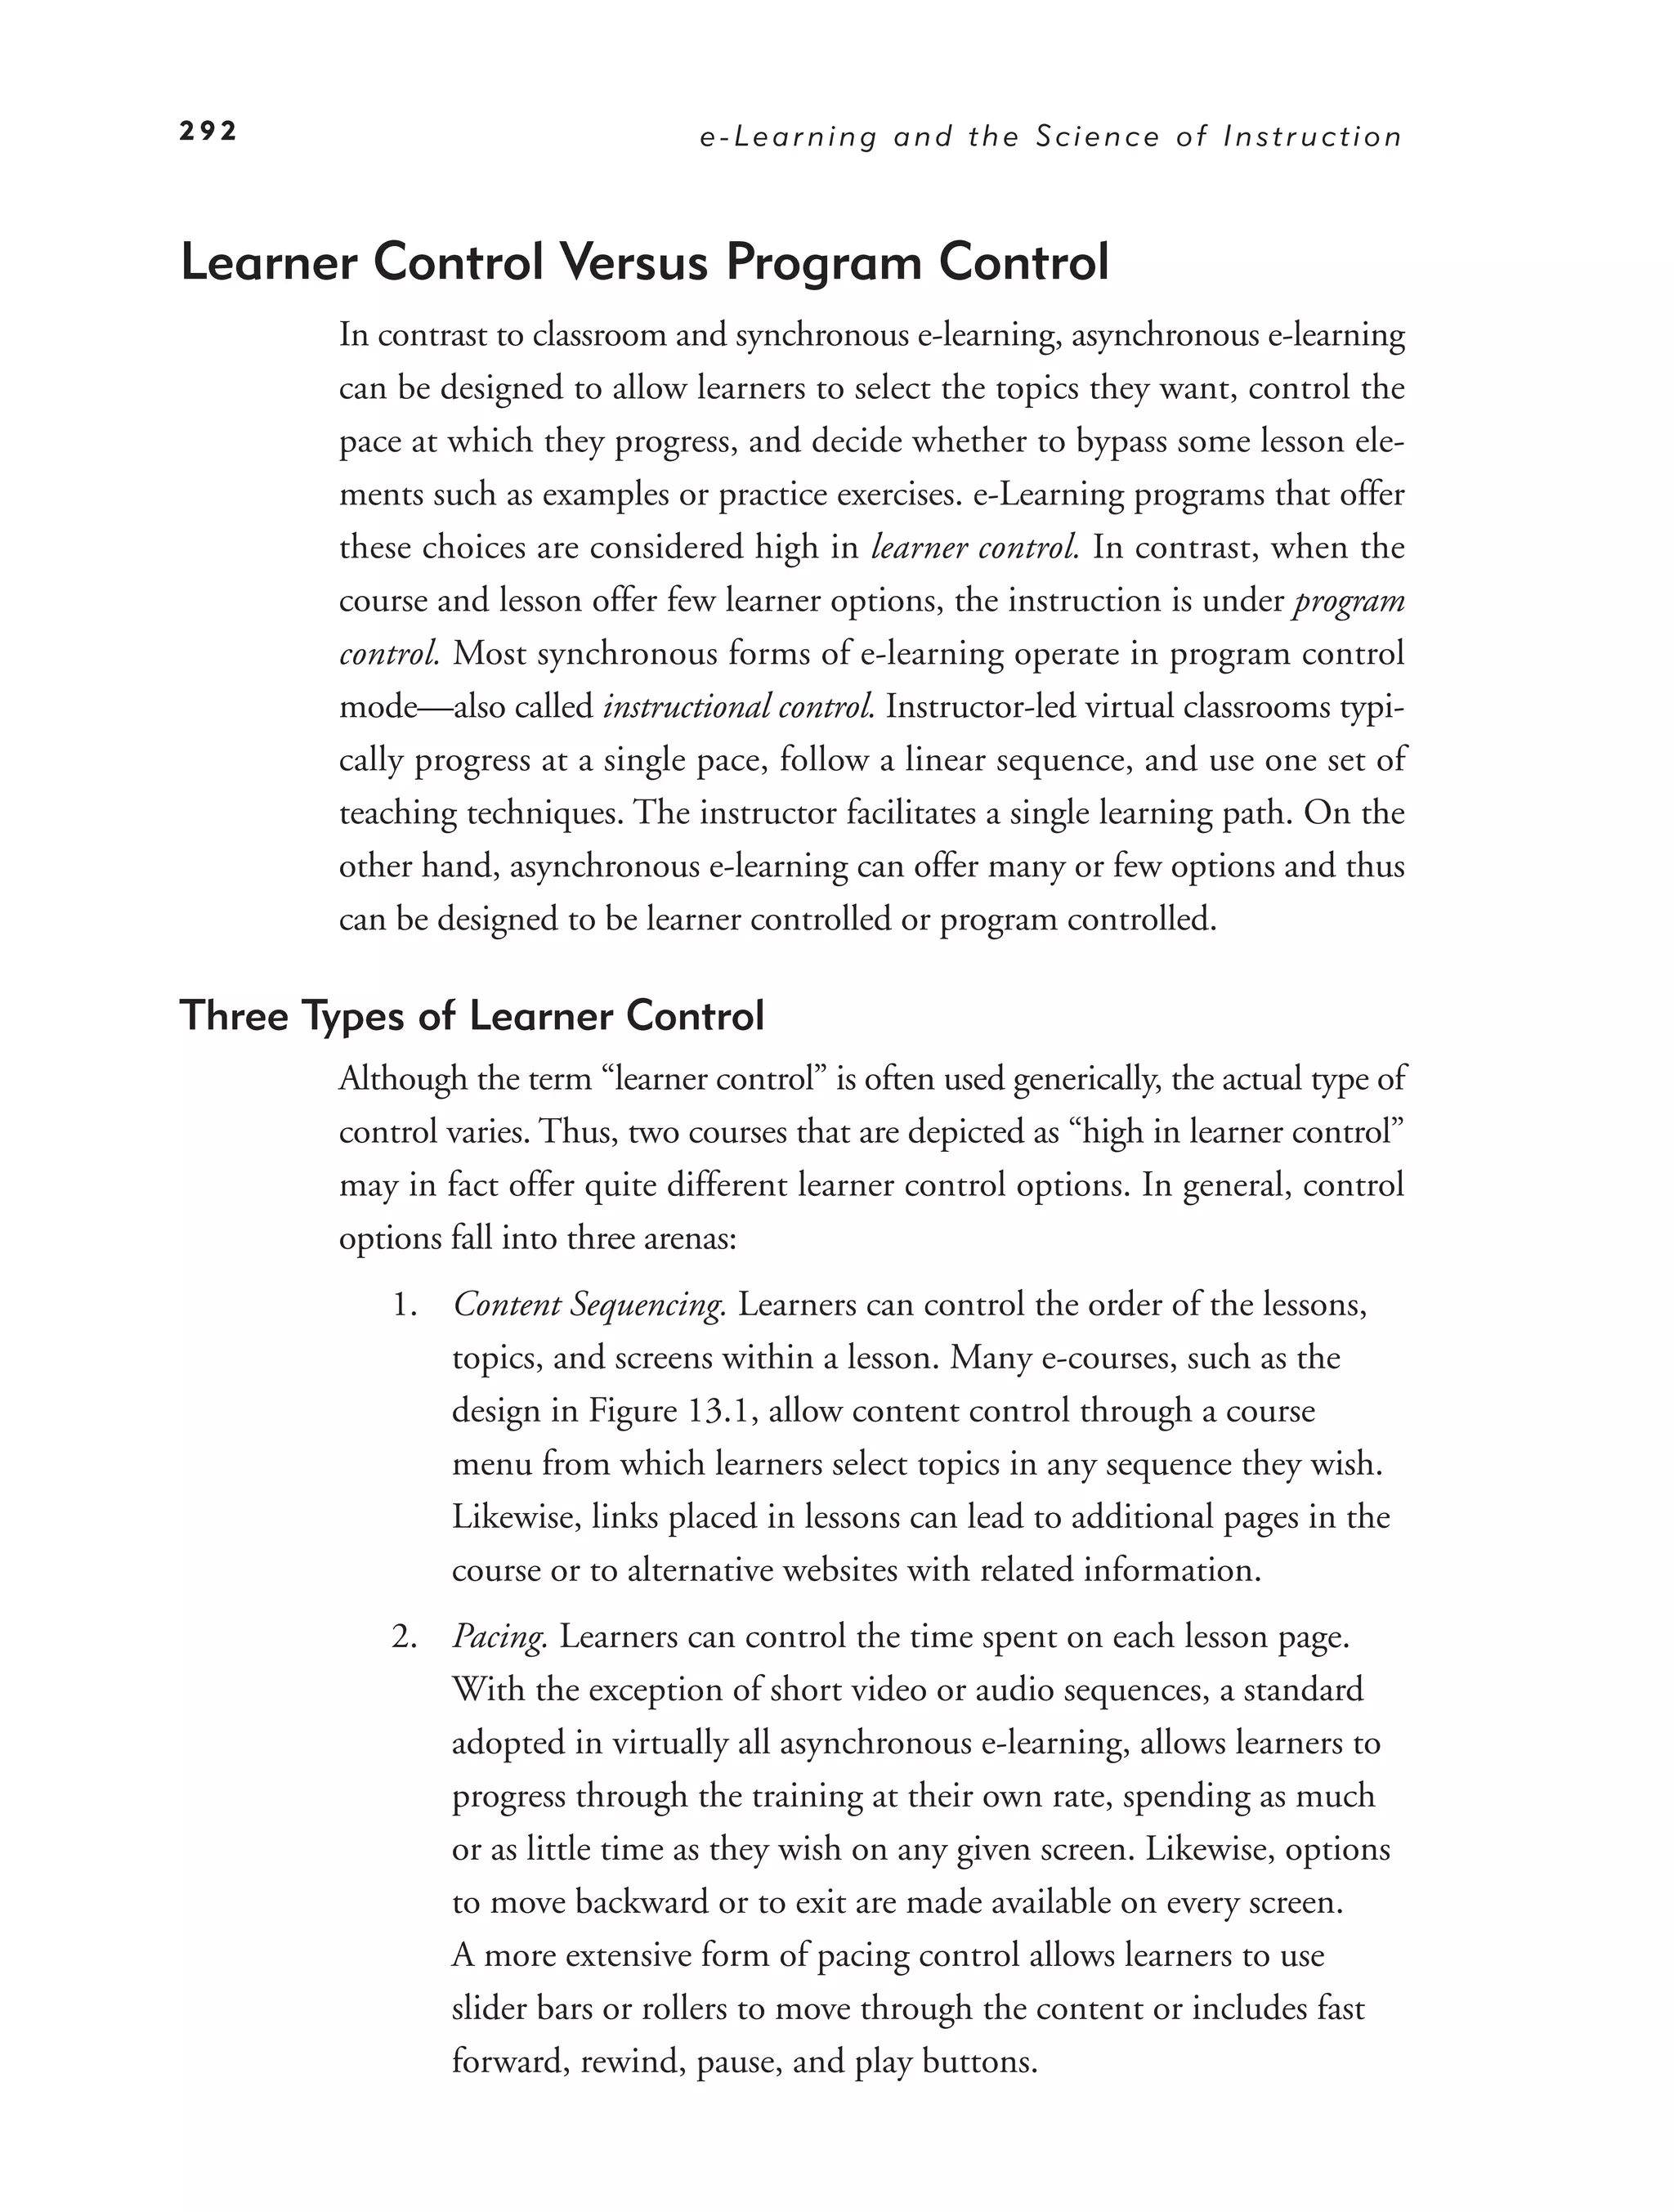
Learner Control Versus Program Control 292
Do Learners Make Good Instructional Decisions? 295
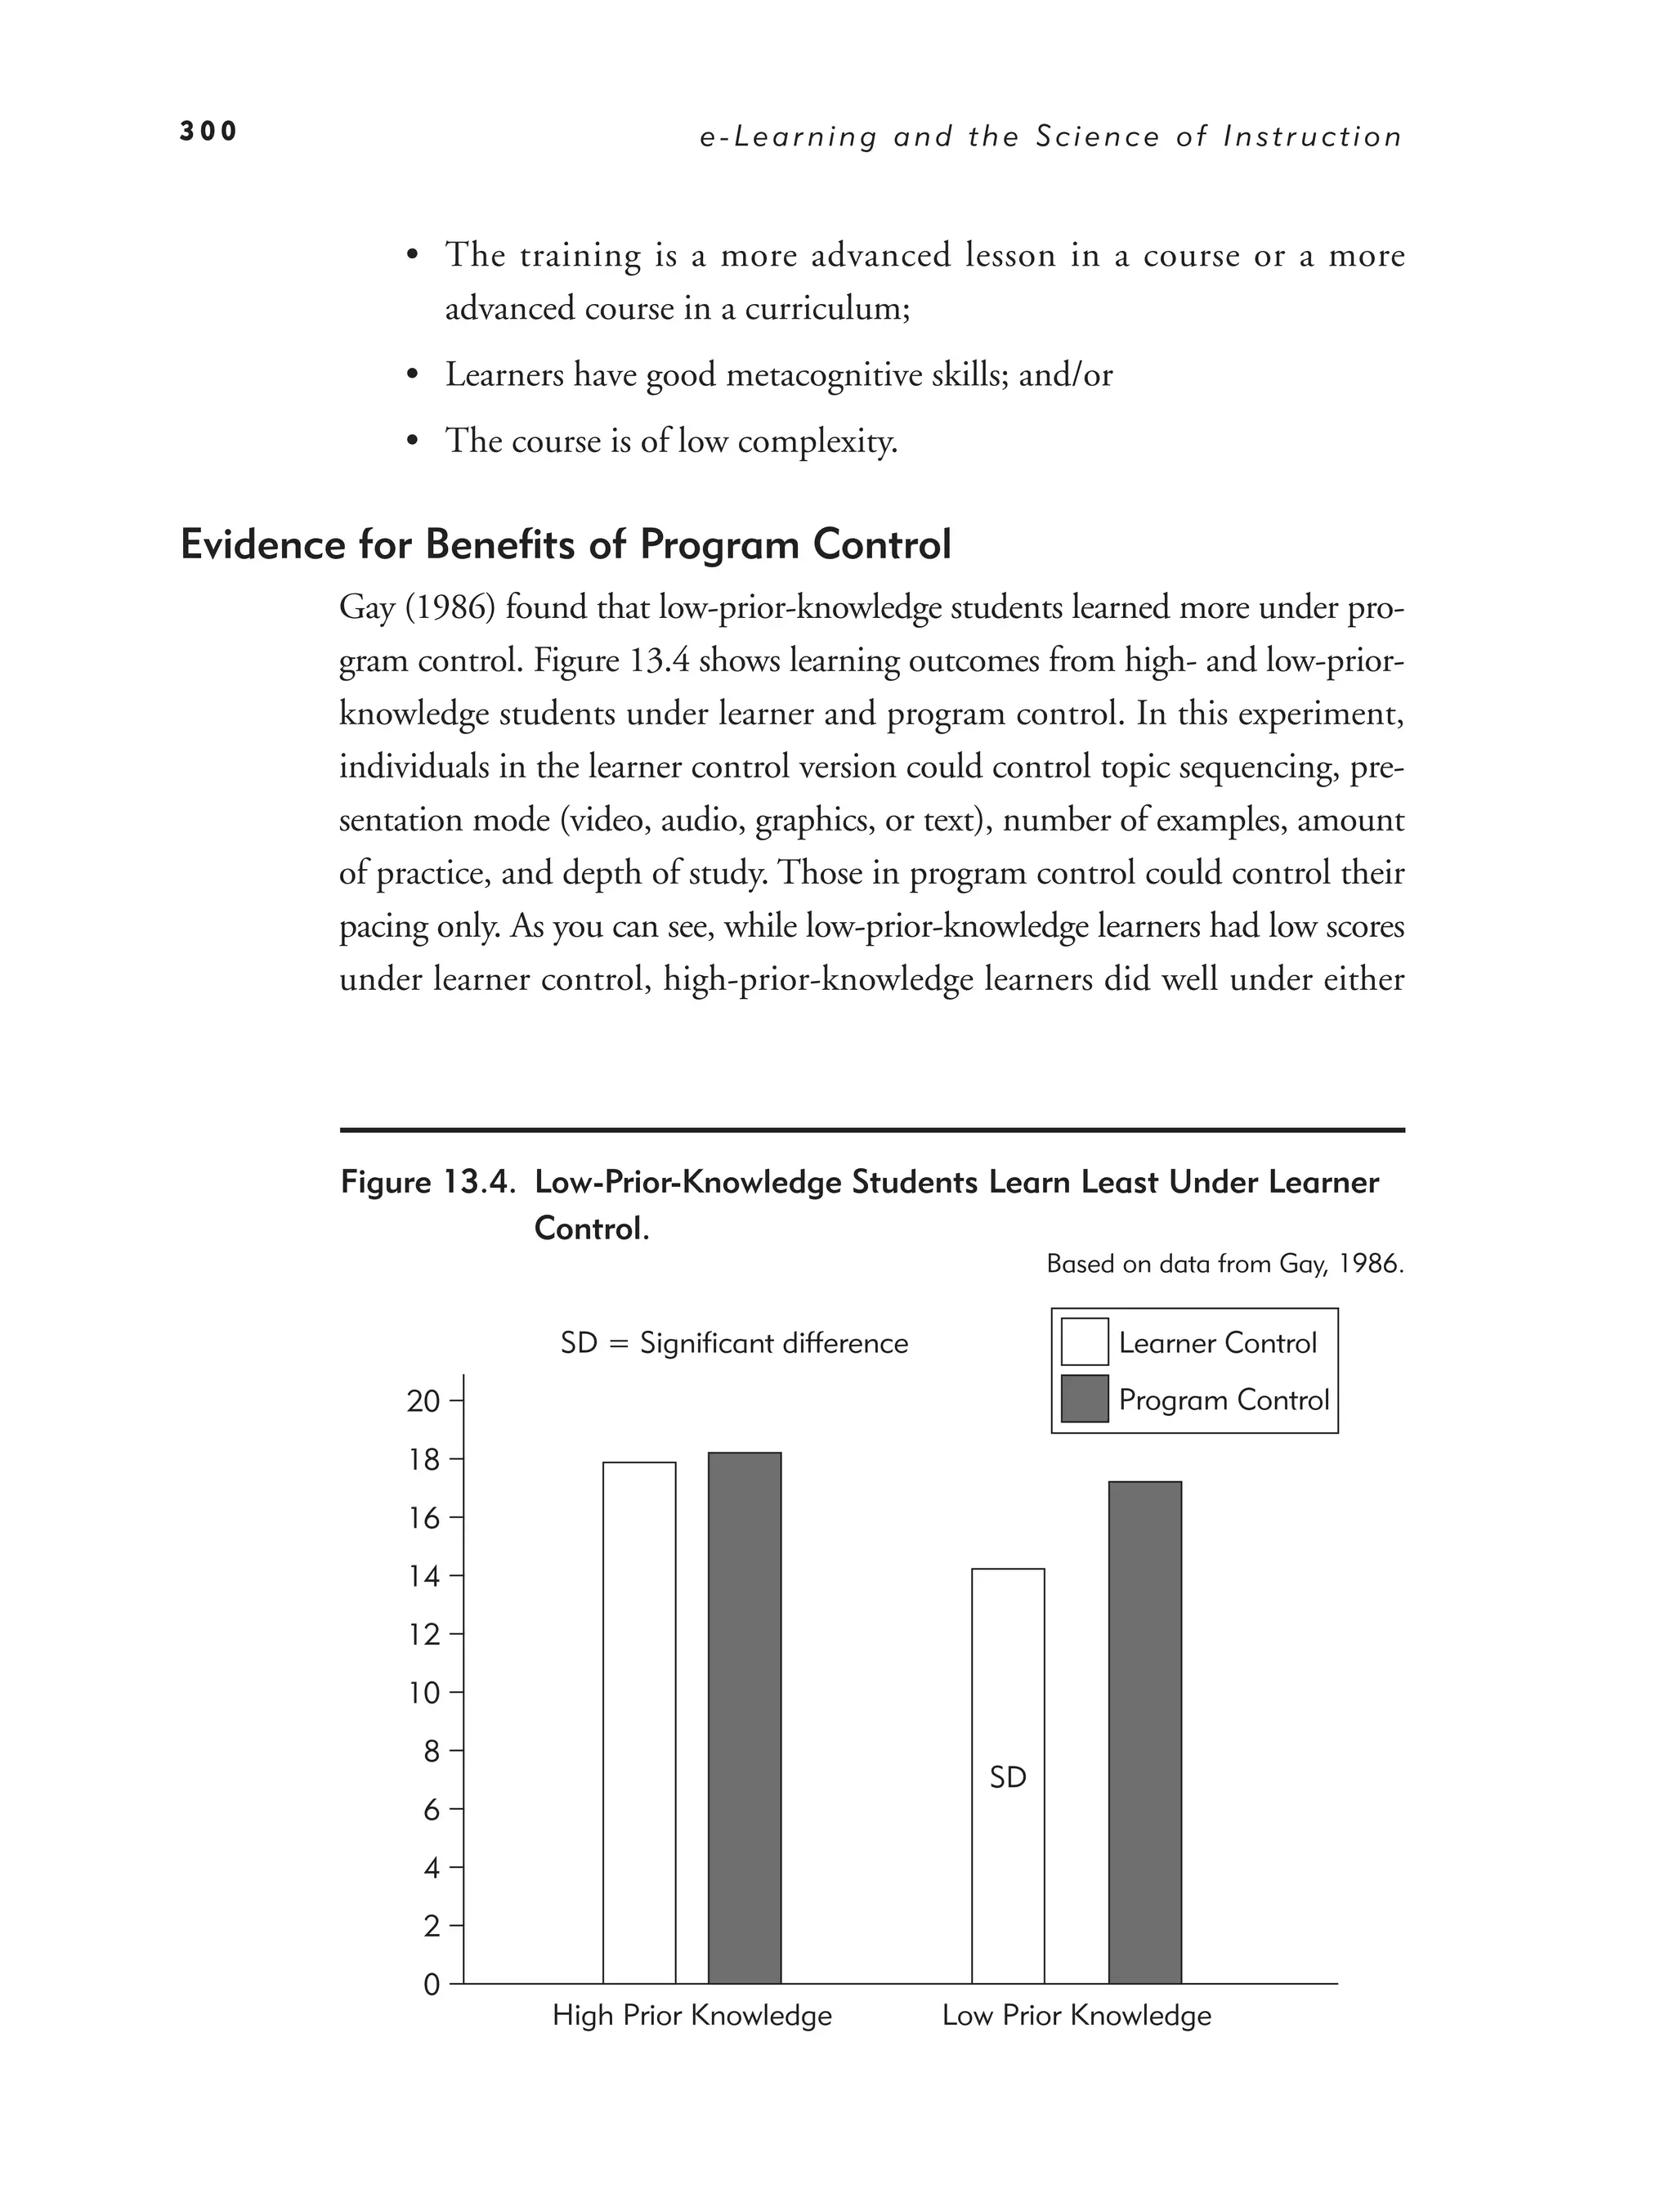
Four Principles for Learner Control: Overview 299
Learner Control Principle 1: Give Experienced Learners Control 299
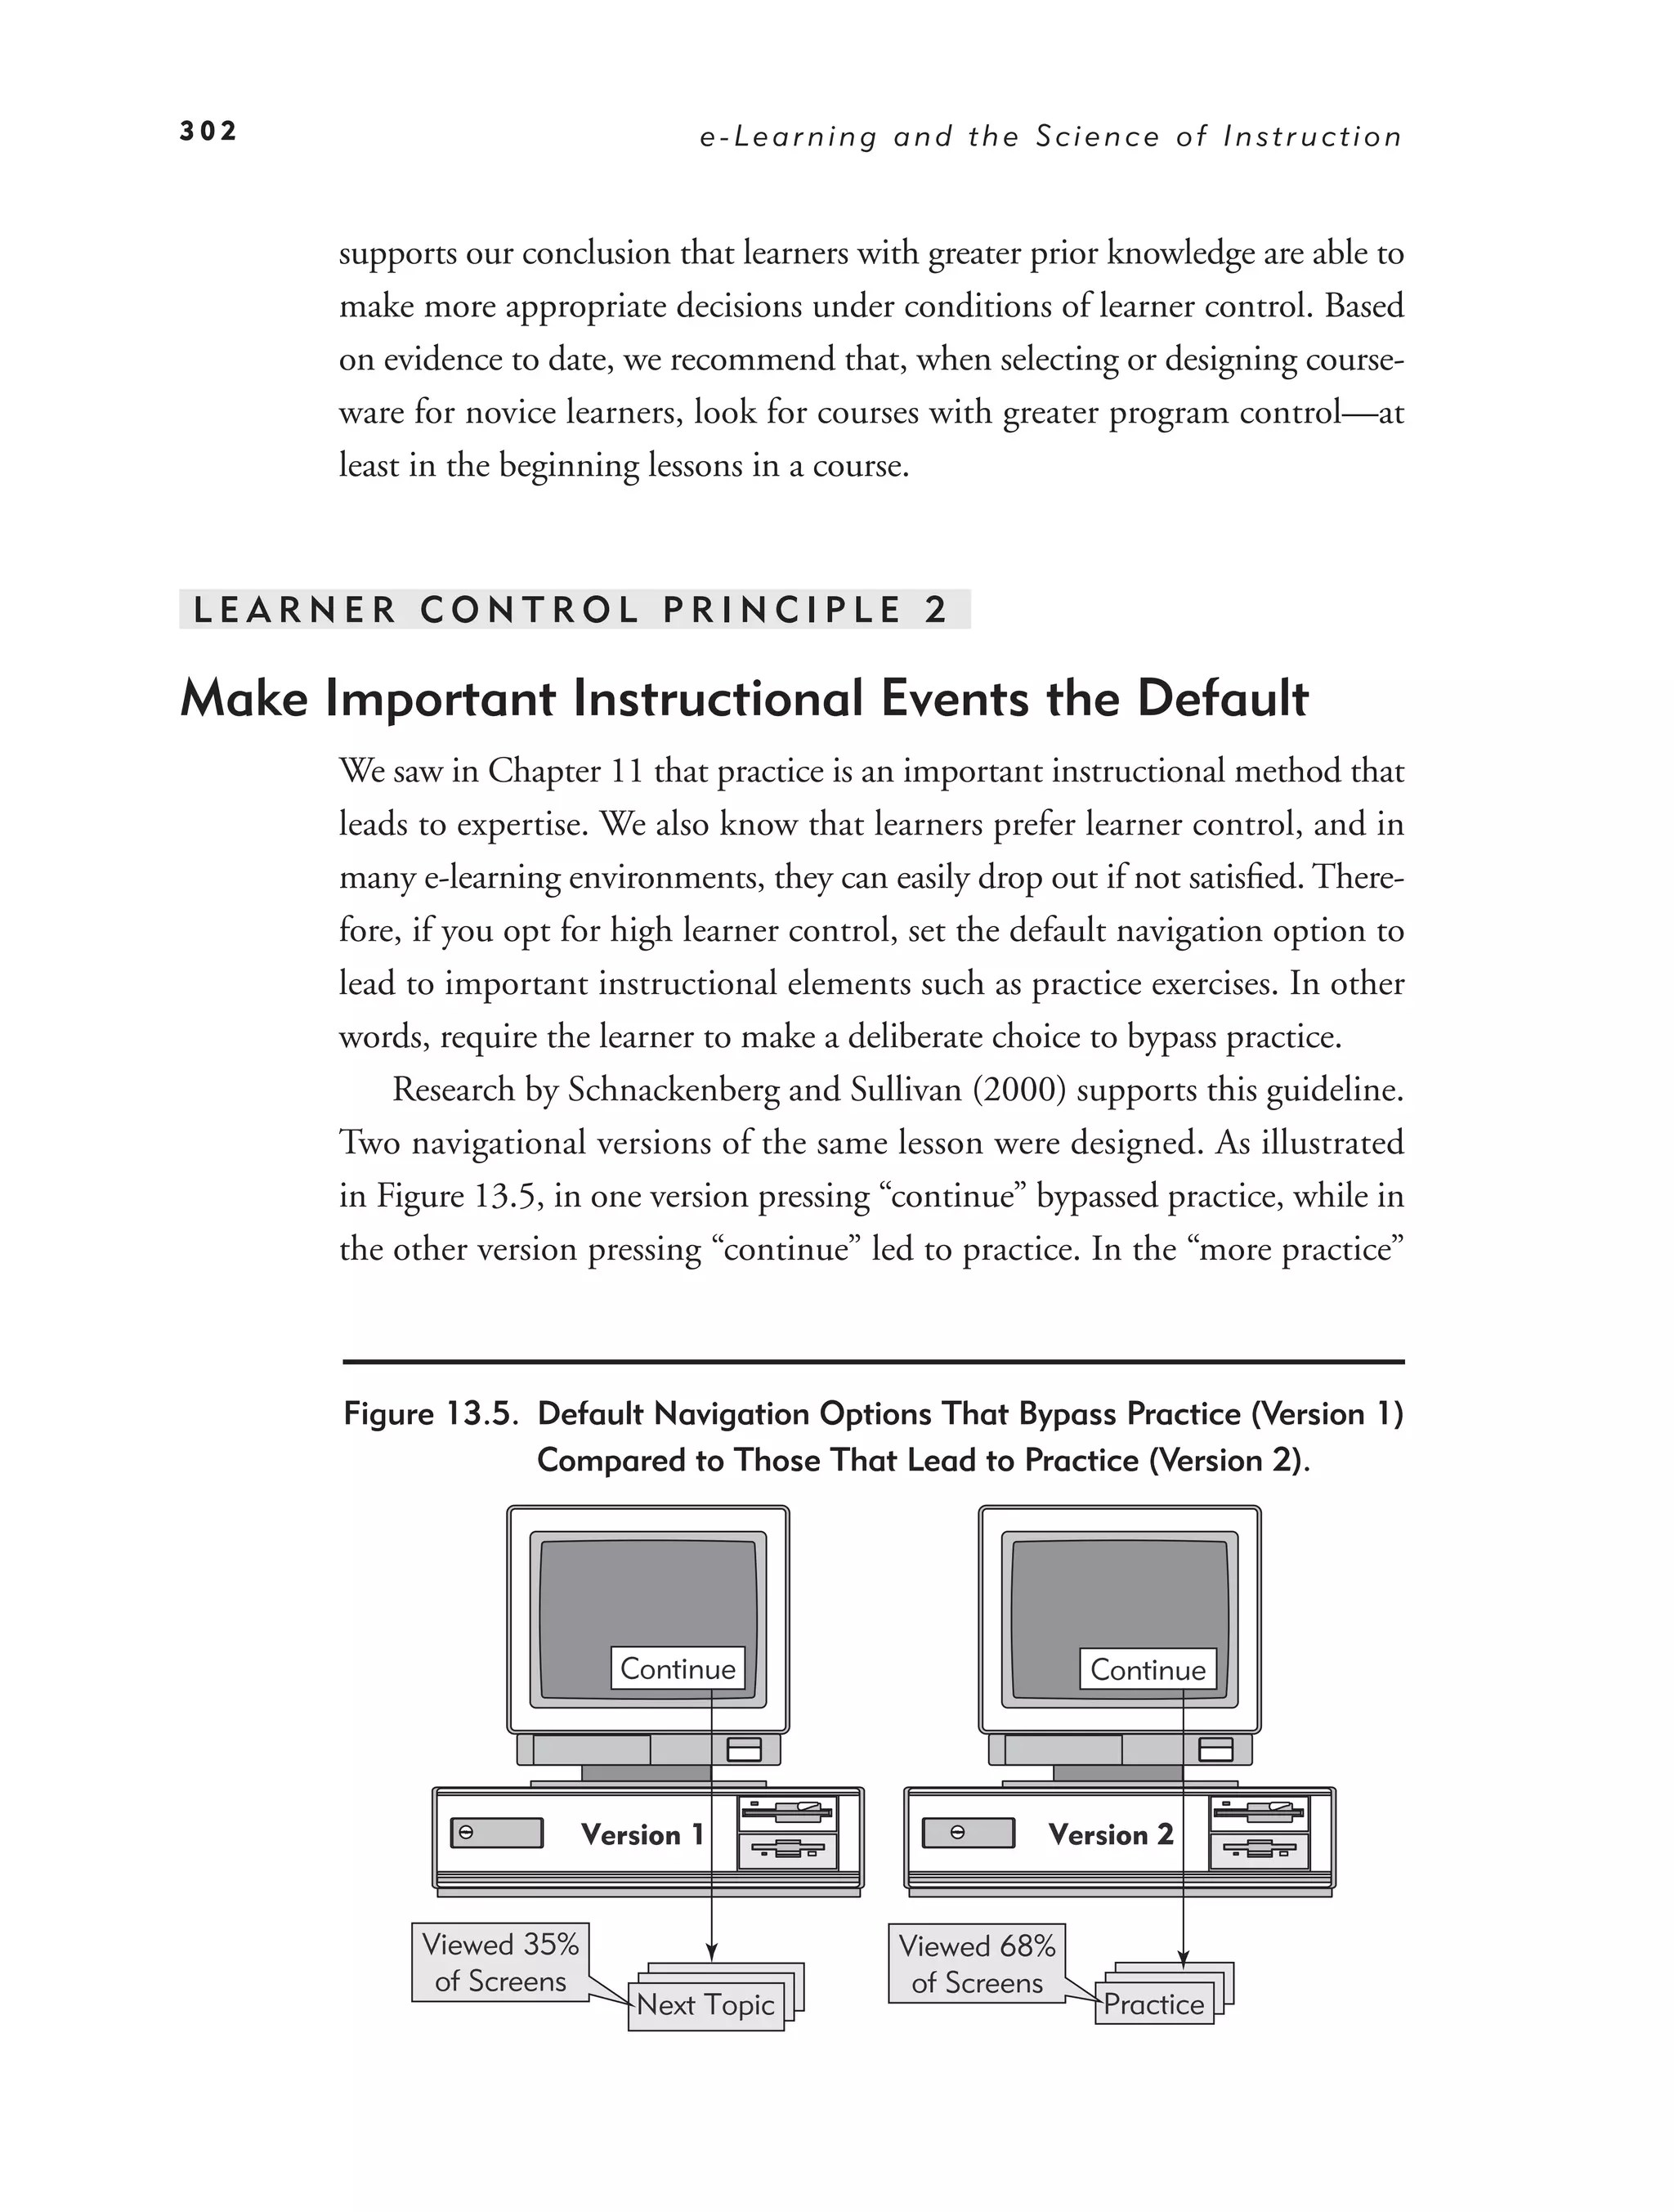
Learner Control Principle 2: Make Important Instructional Events the
Default 302
Learner Control Principle 3: Consider Adaptive Control 303
Learner Control Principle 4: Give Pacing Control 307
Navigational Guidelines for Learner Control 307
What We Don’t Know About Learner Control 311
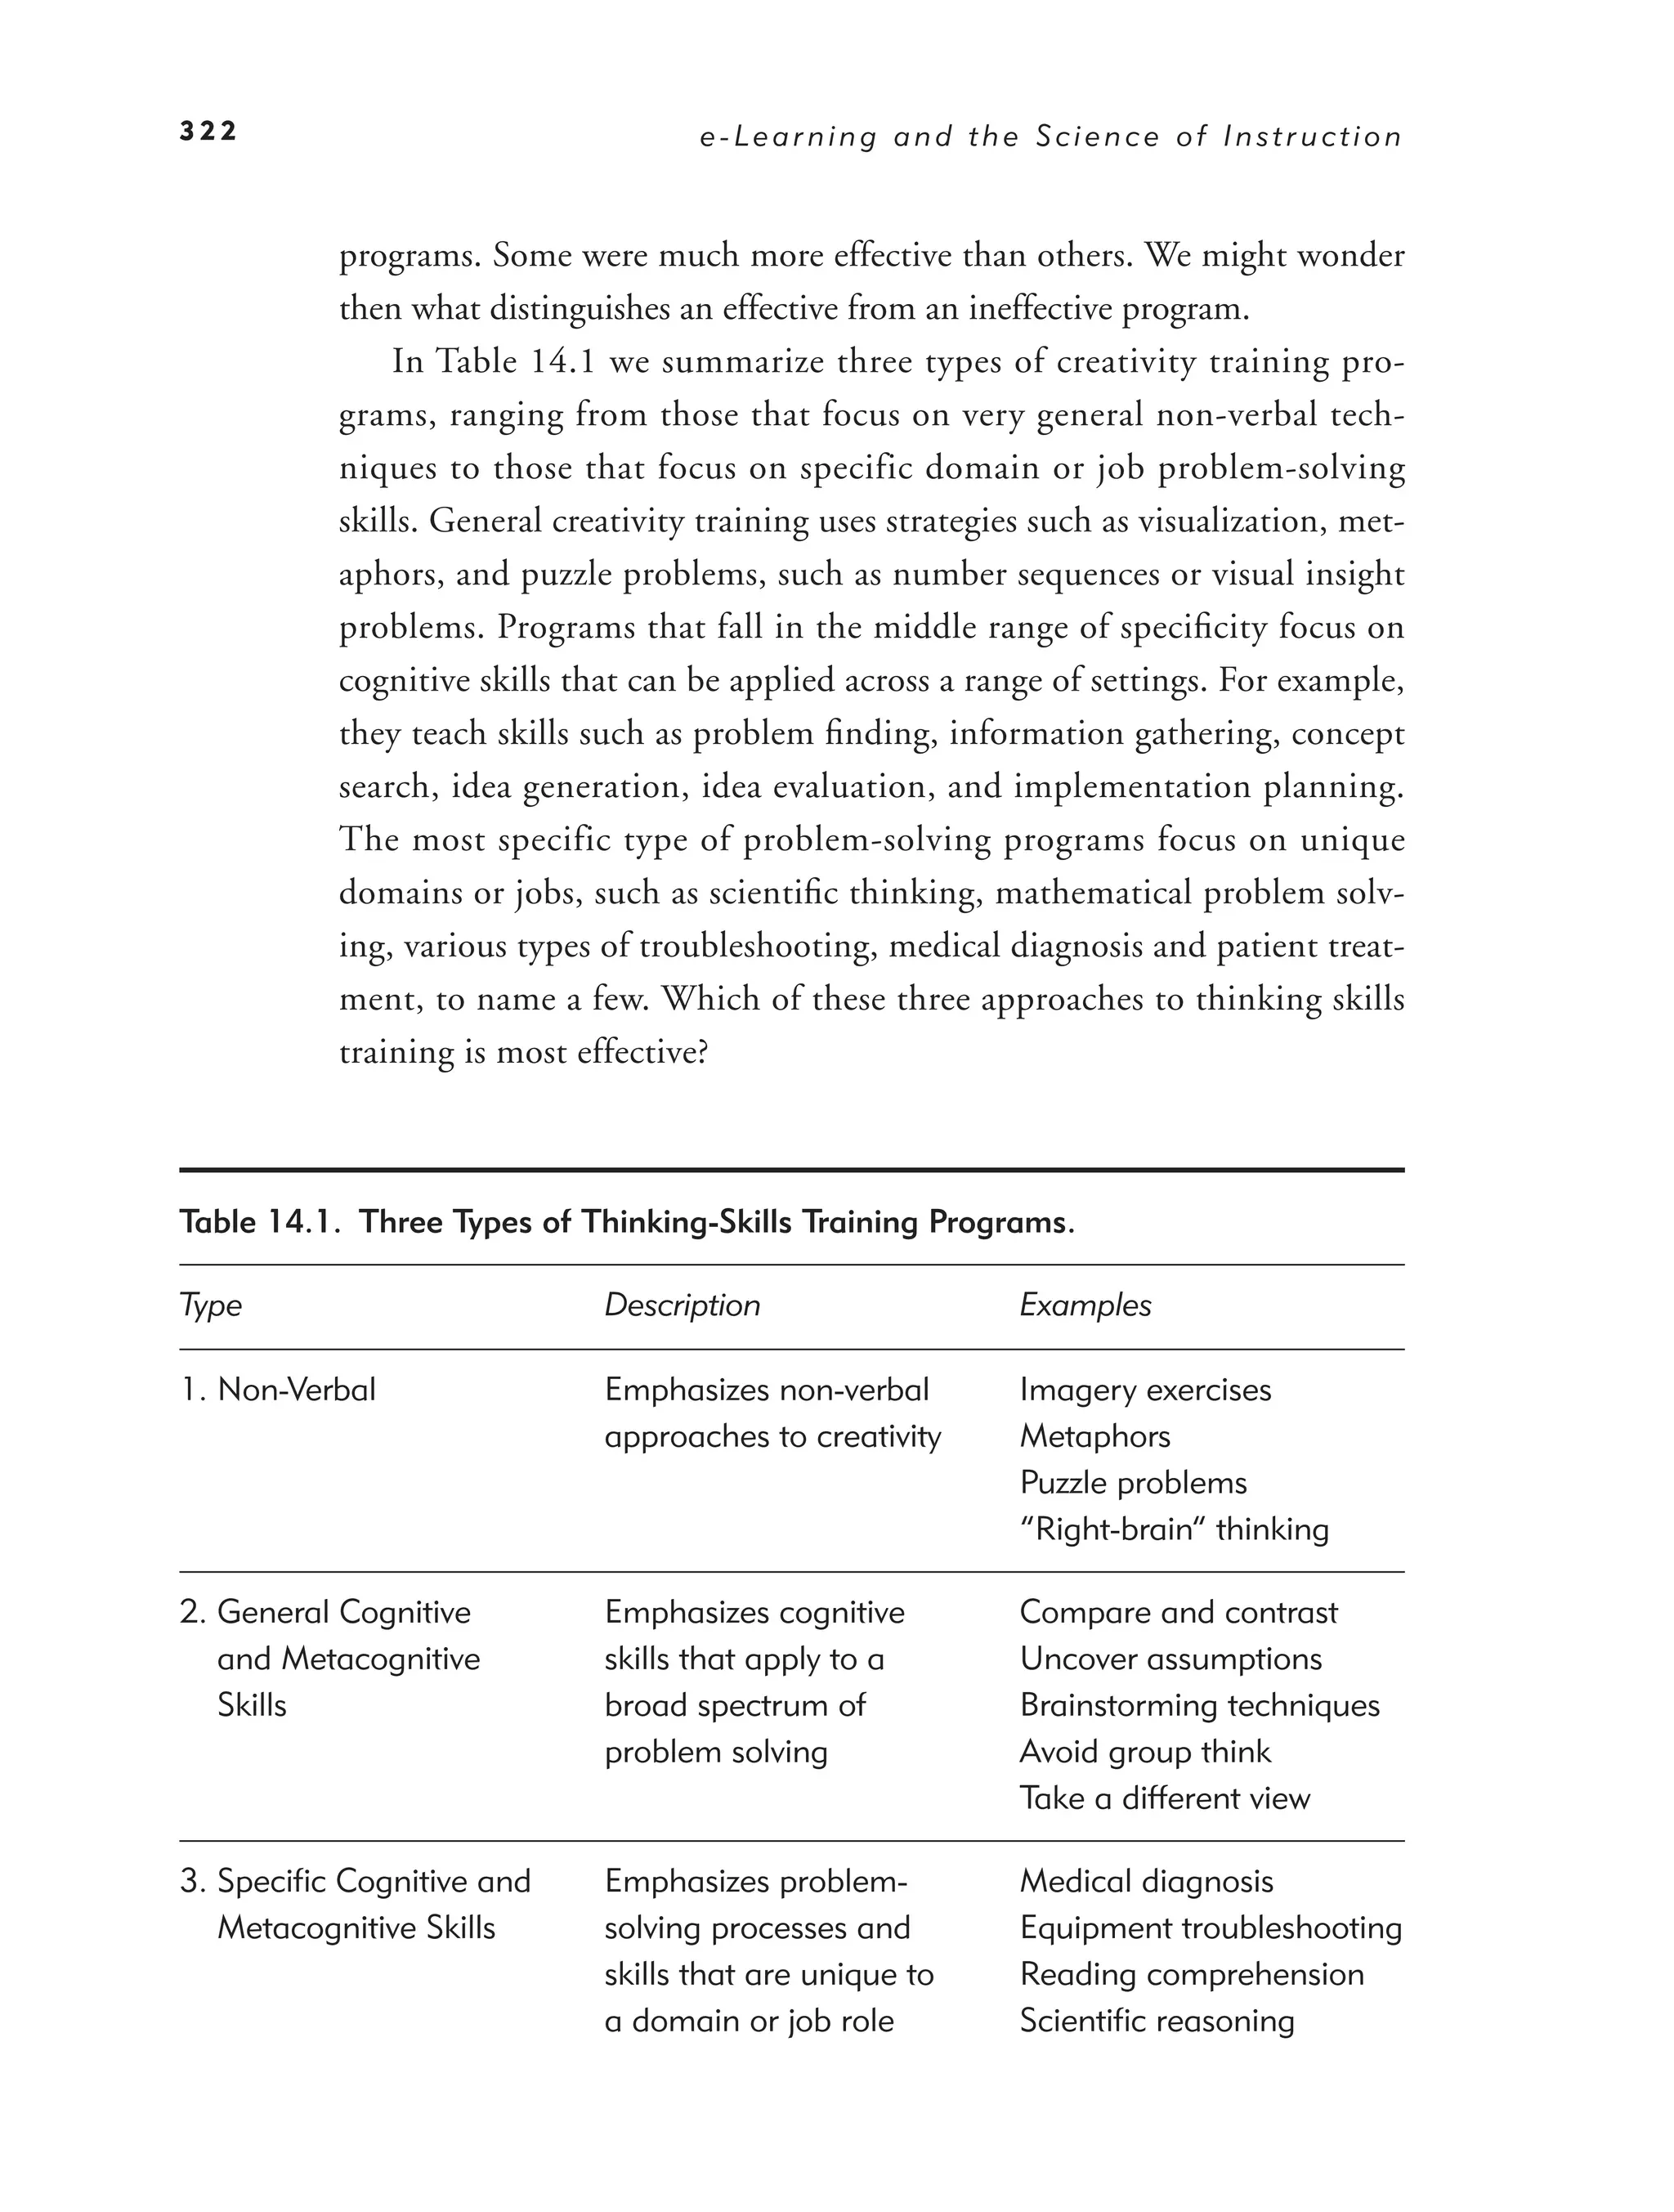
14. e-Learning to Build Thinking Skills 317
What Are Thinking Skills? 320
Can Creativity Be Trained? 321
14.
Contents xiii
Building Critical Thinking Skills in the Workforce:
Overview 323
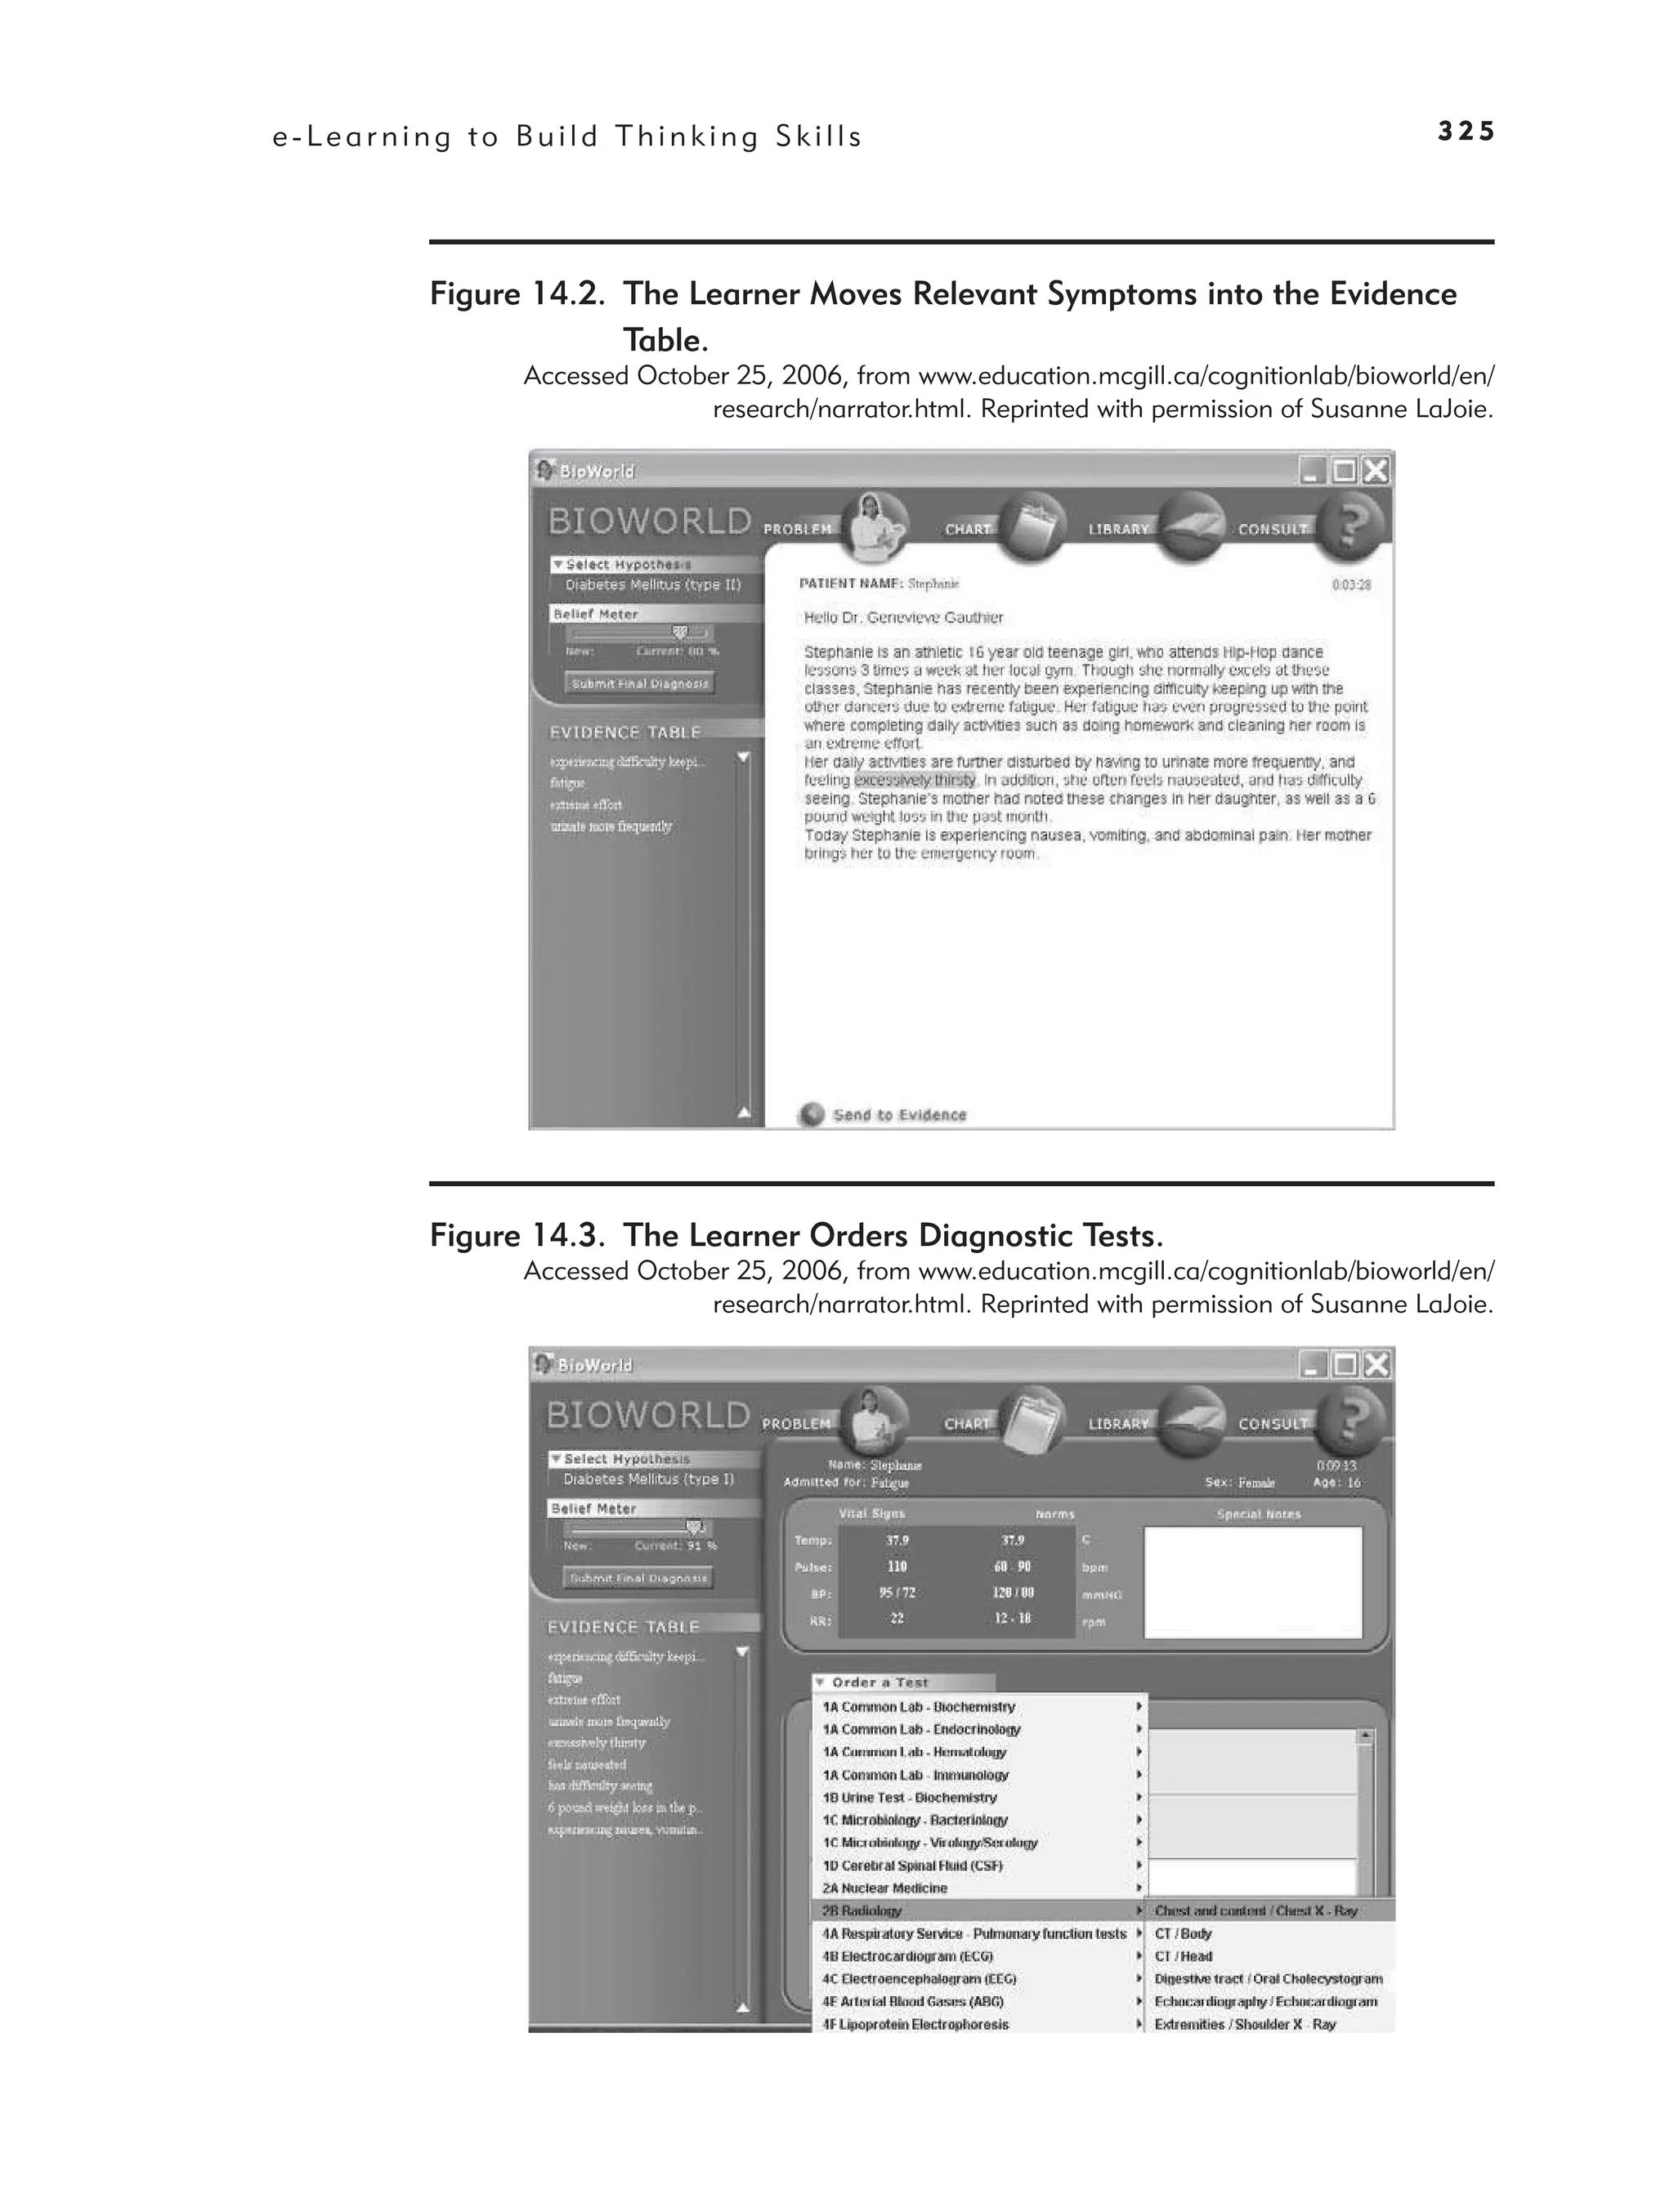
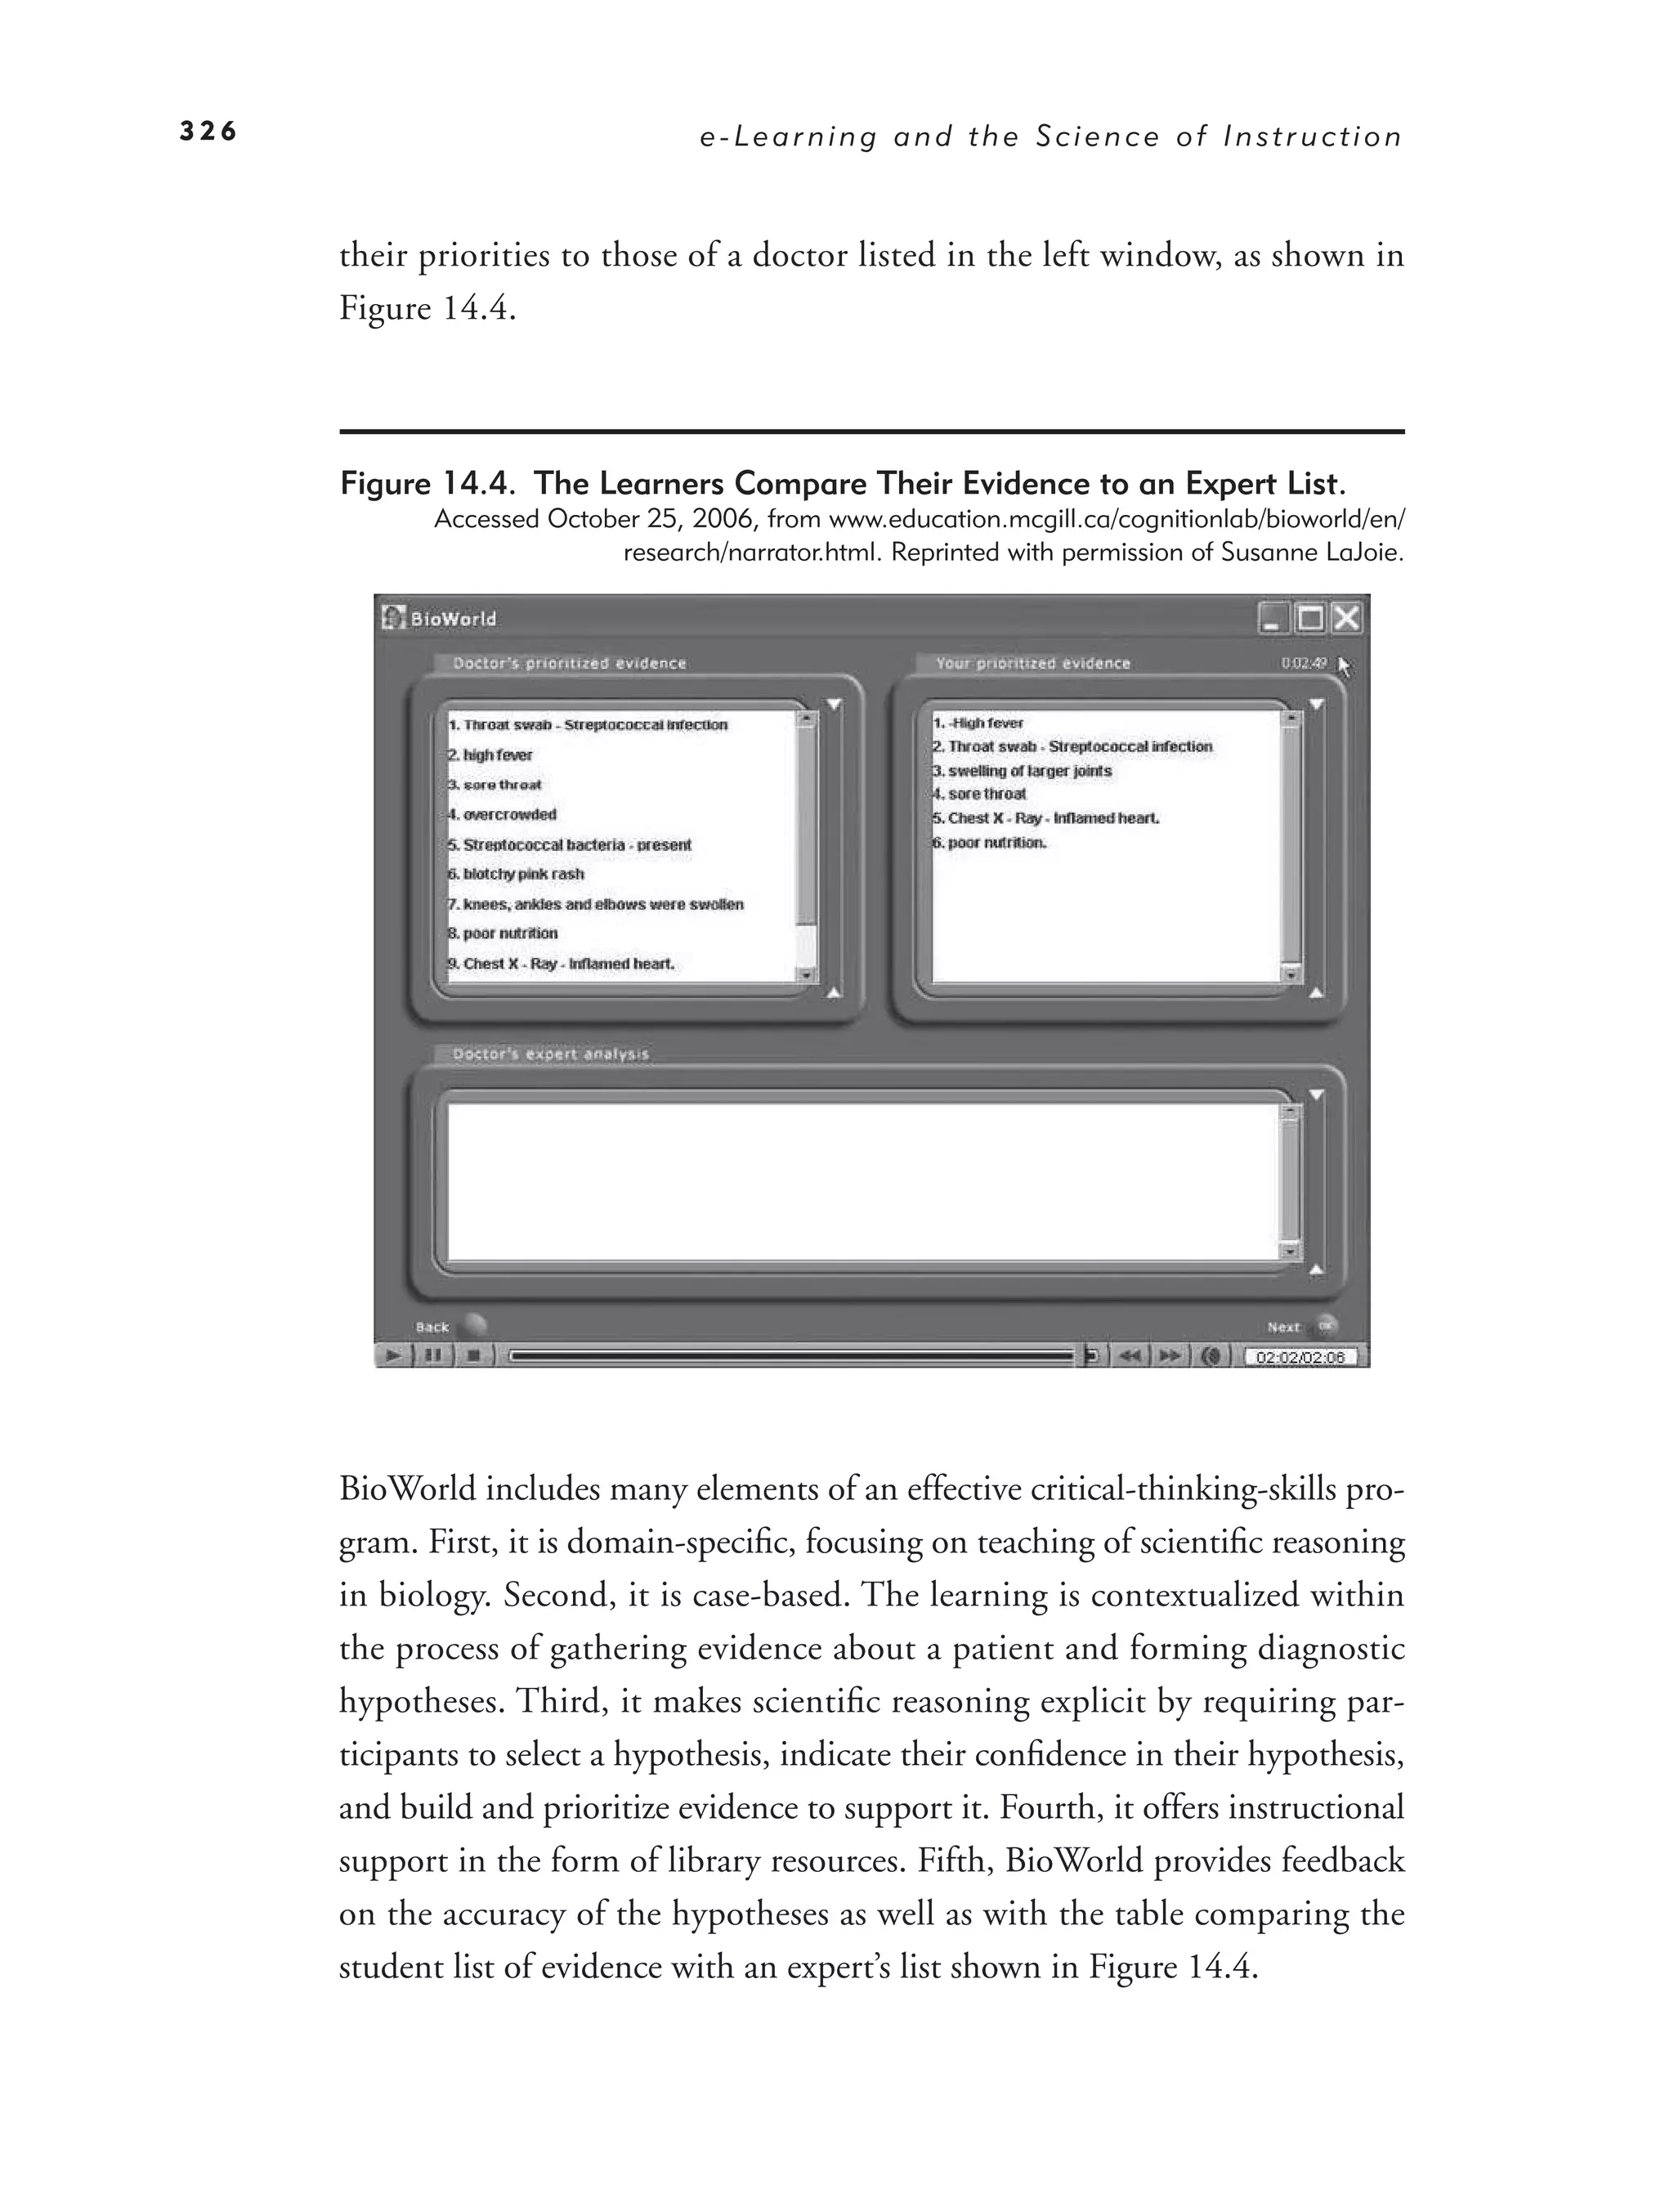
Thinking Skills Principle 1: Use Job–Specific Cases 324
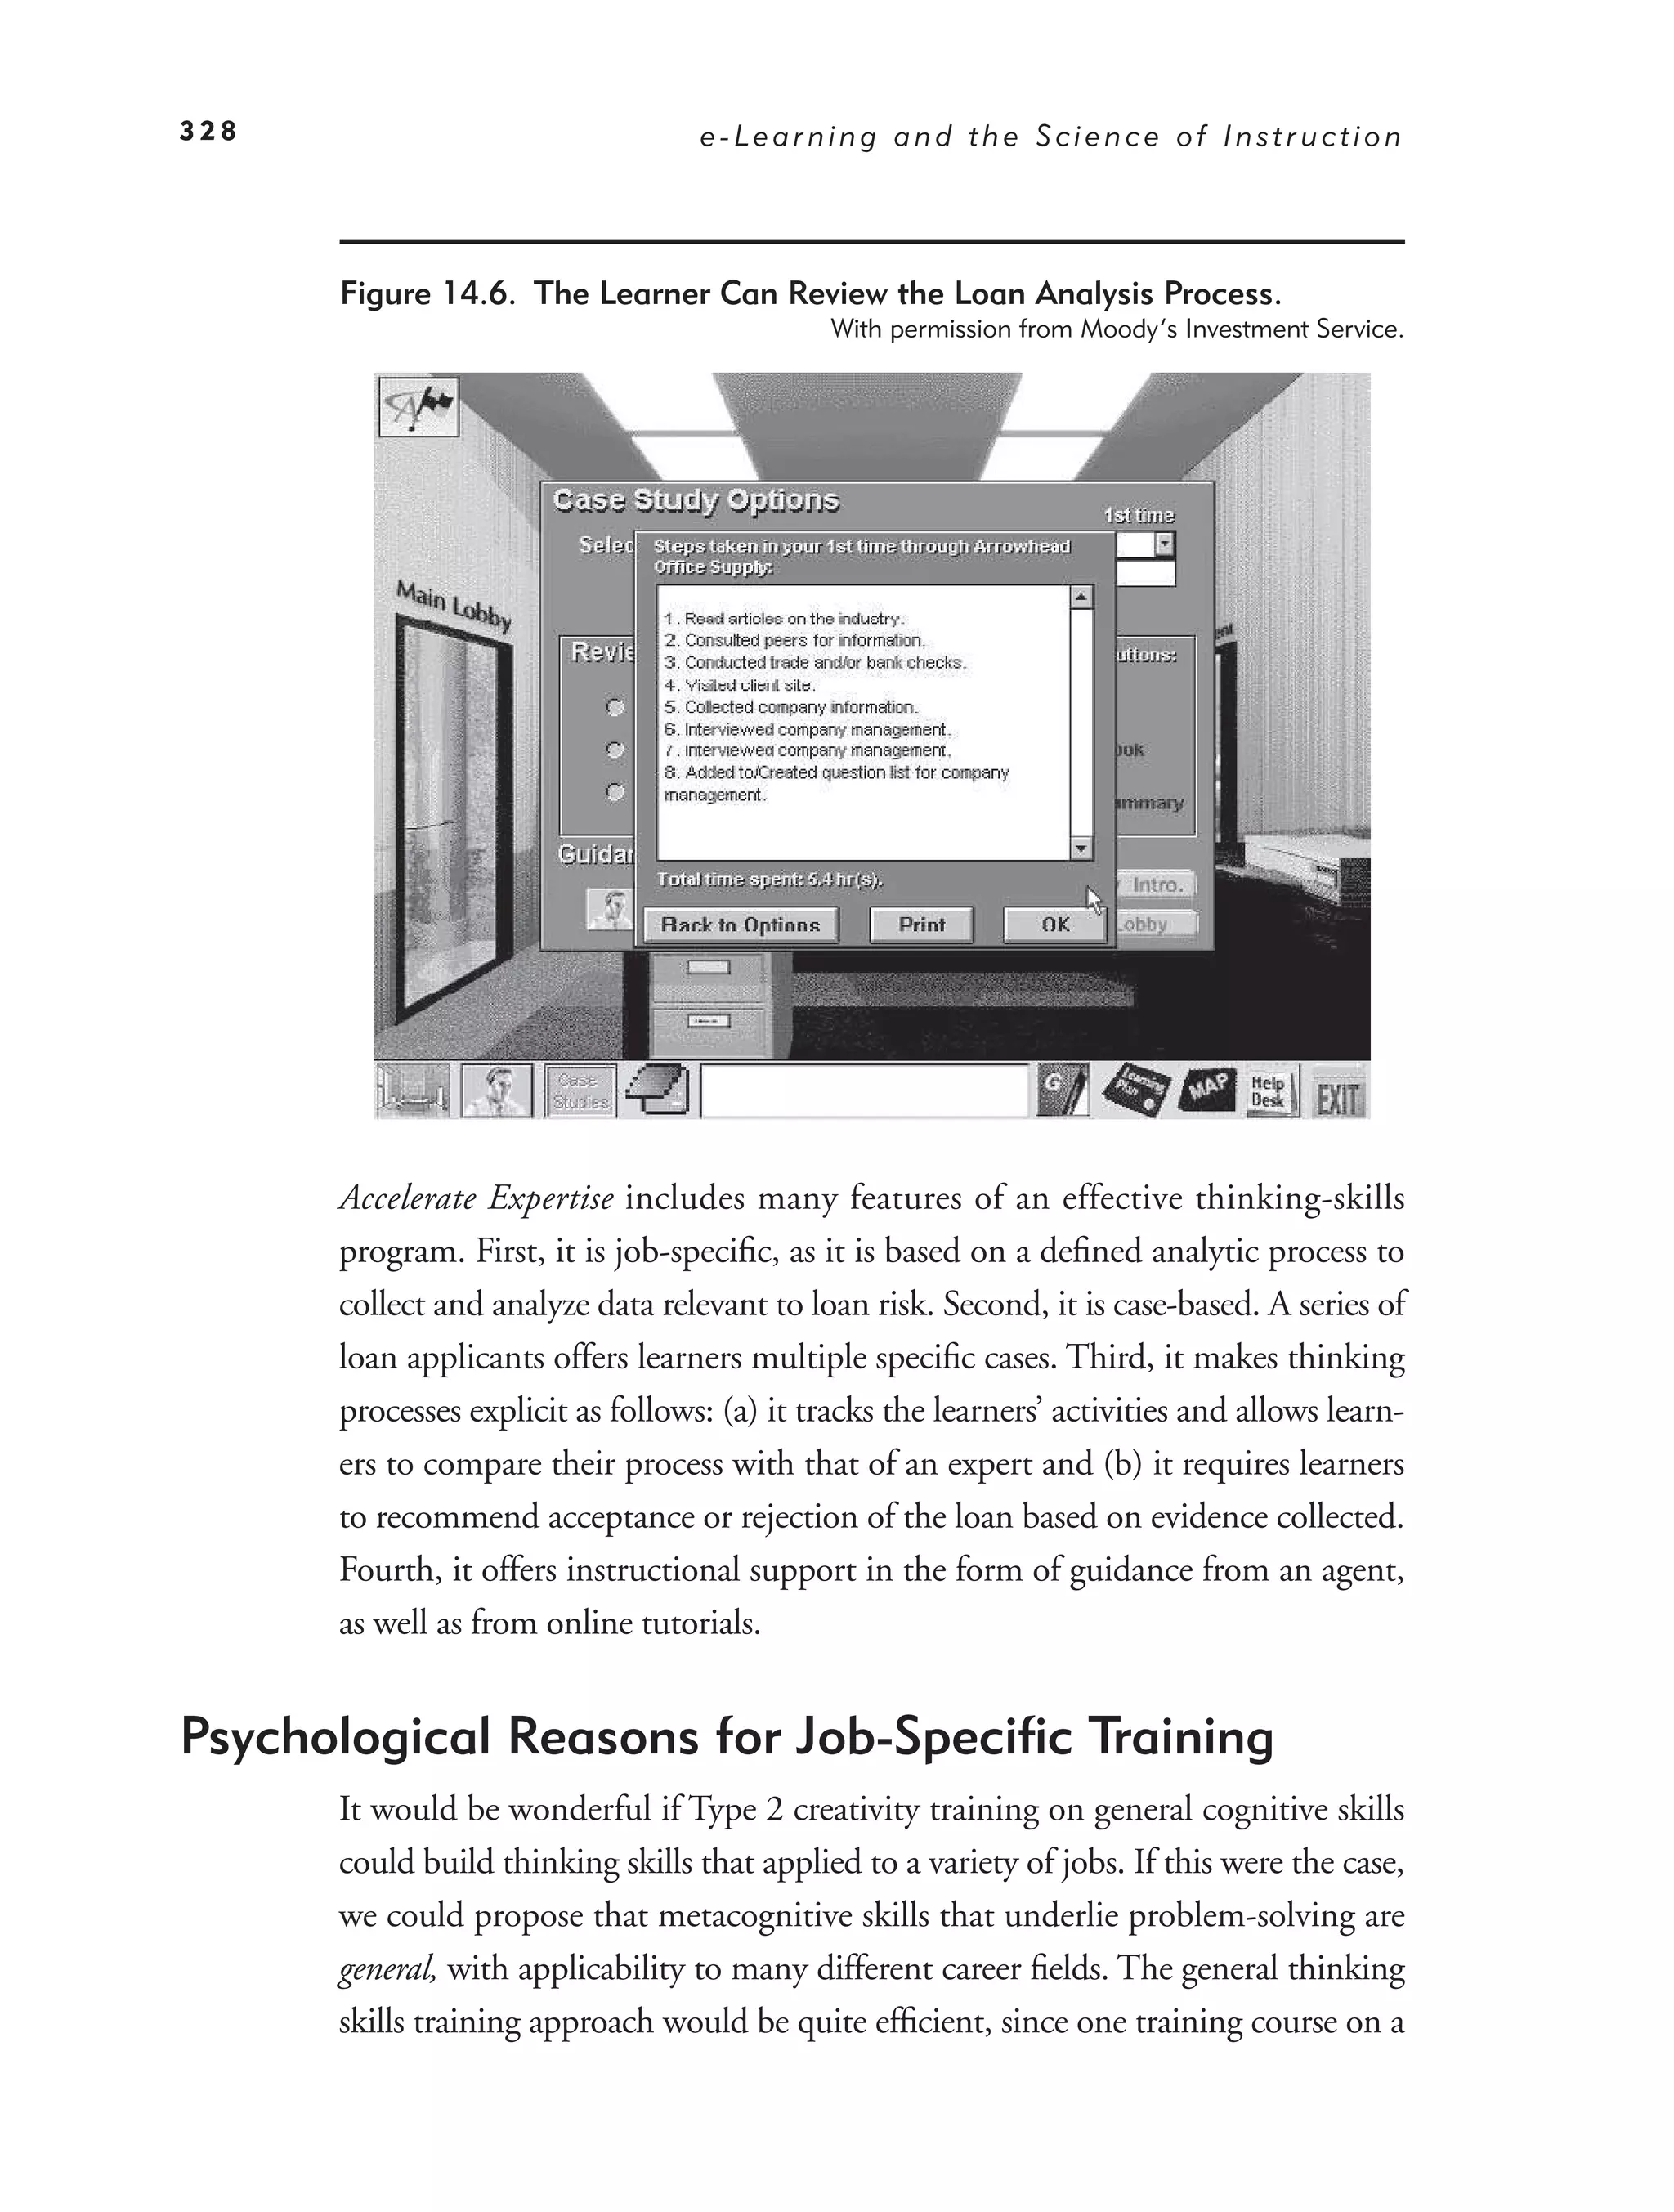
Psychological Reasons for Job-Specific Training 328
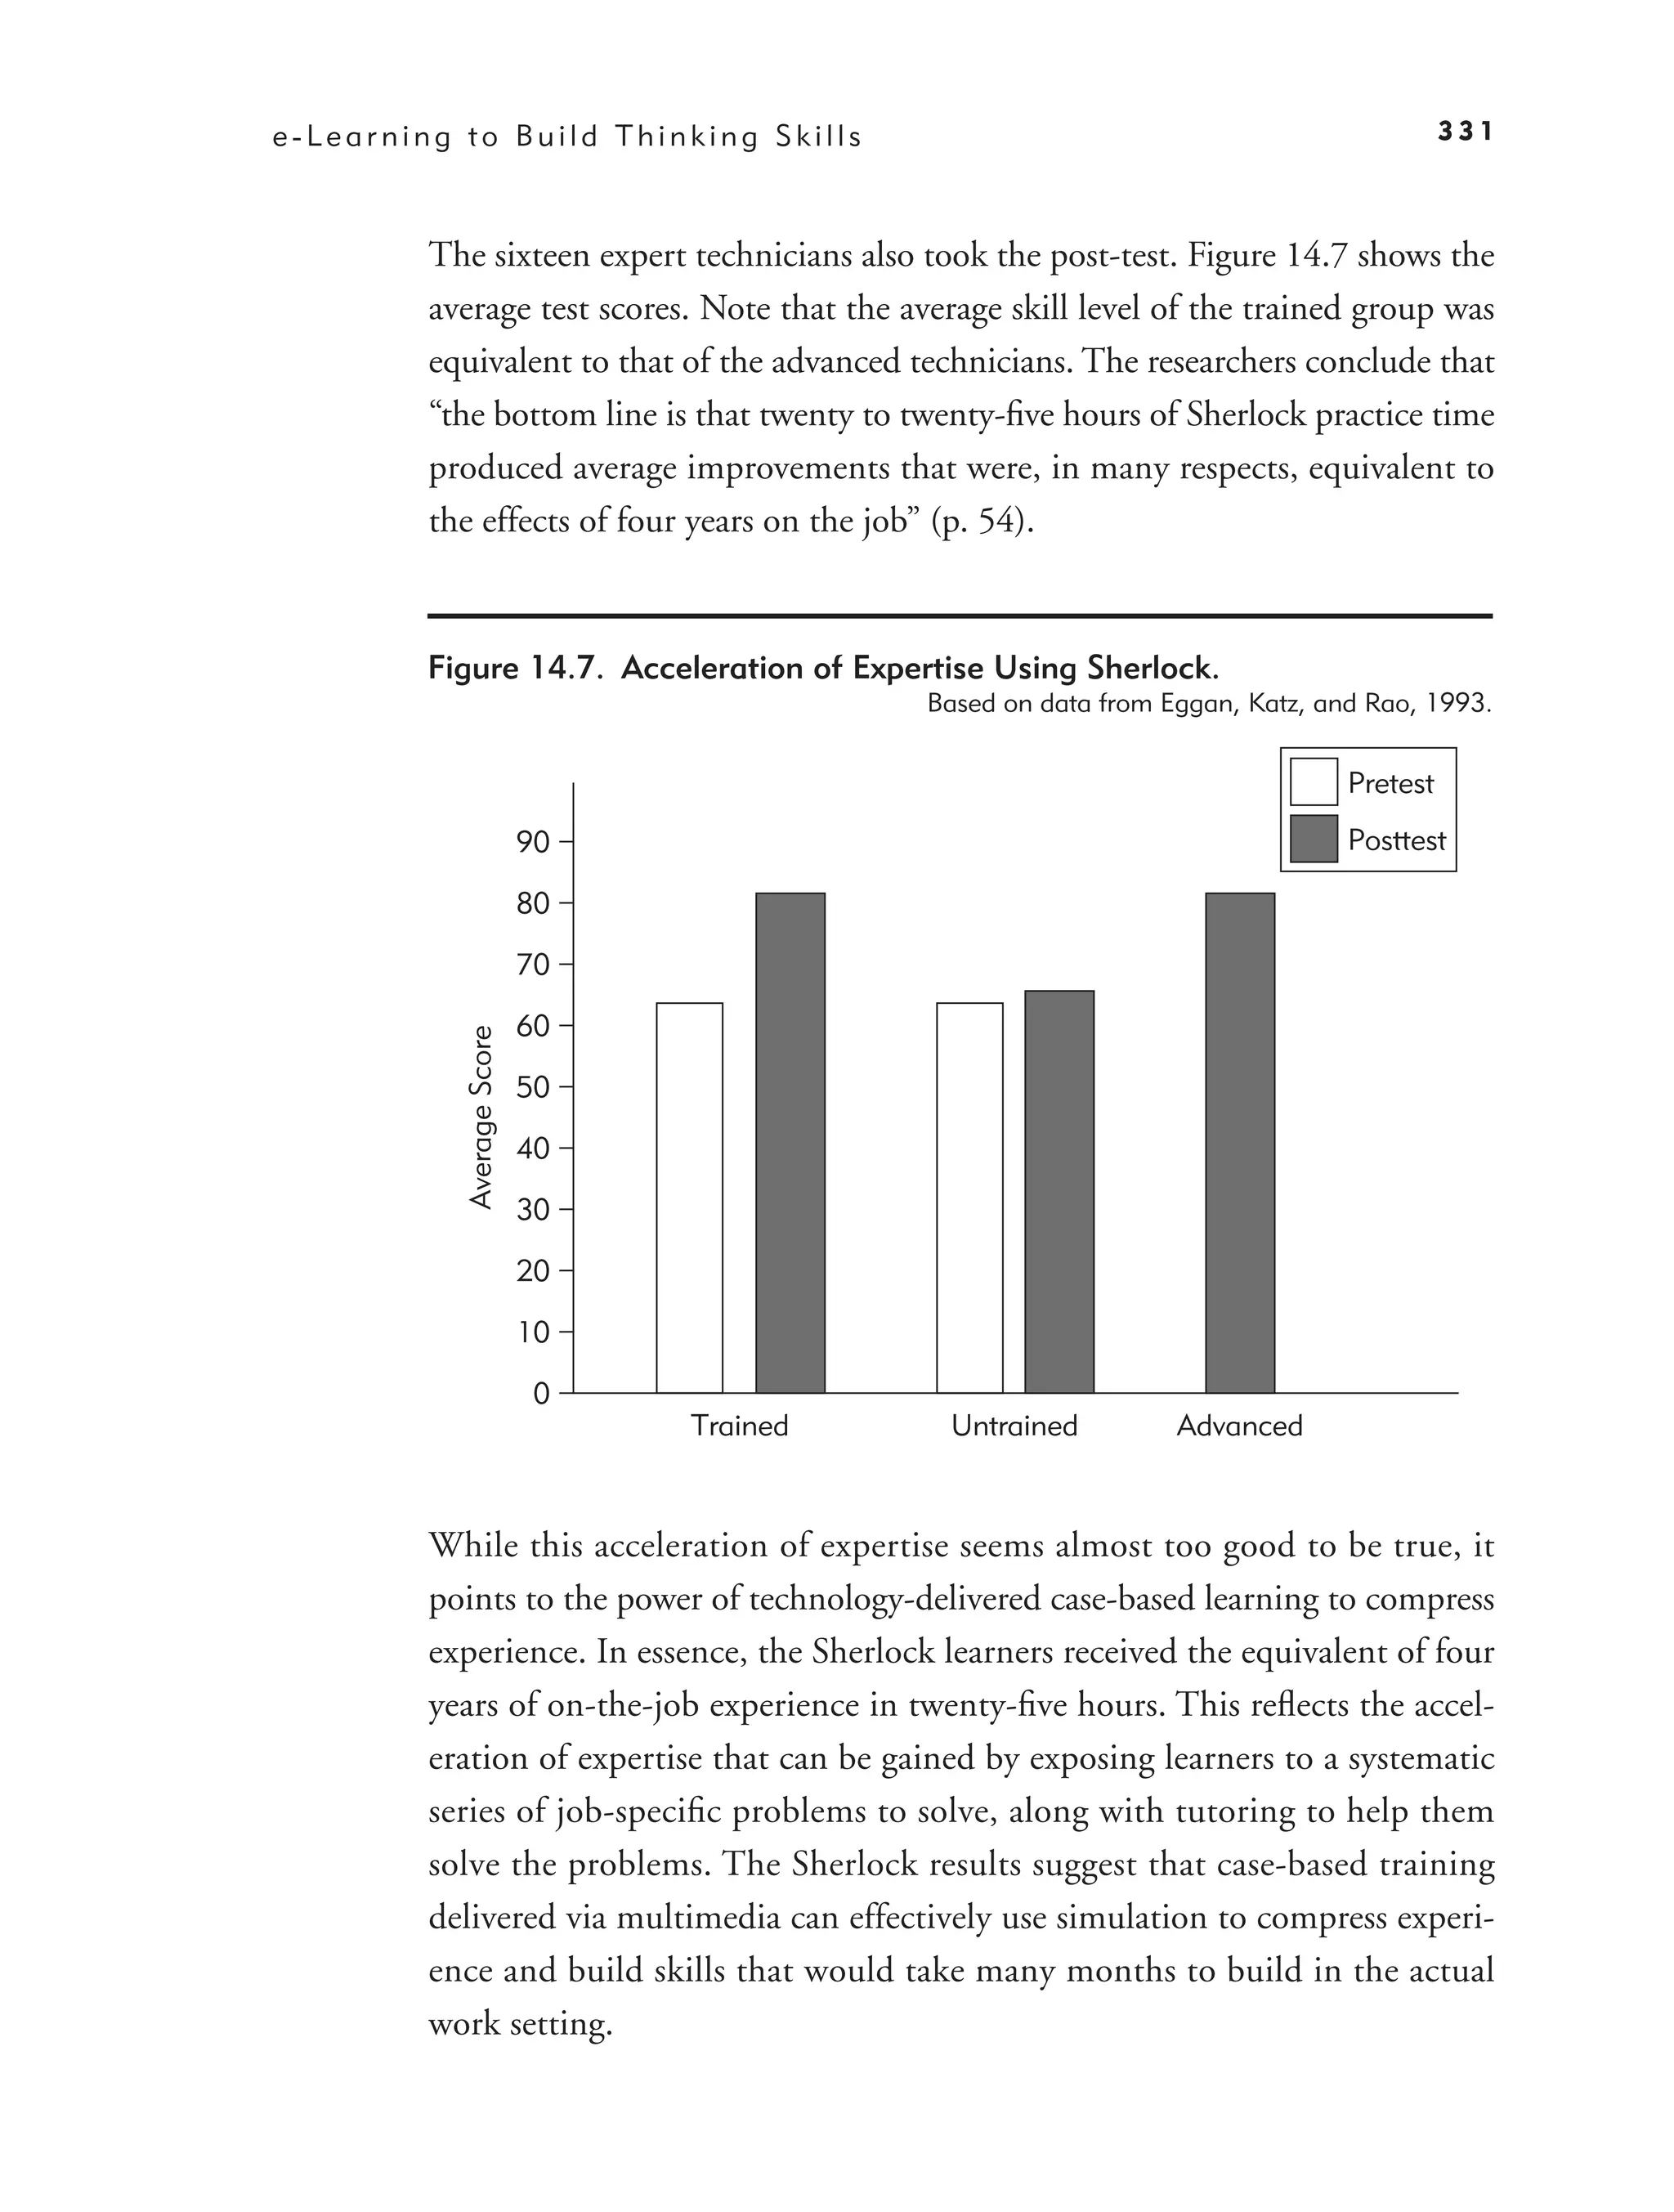
Evidence for Job-Specific Problem-Solving Training 329
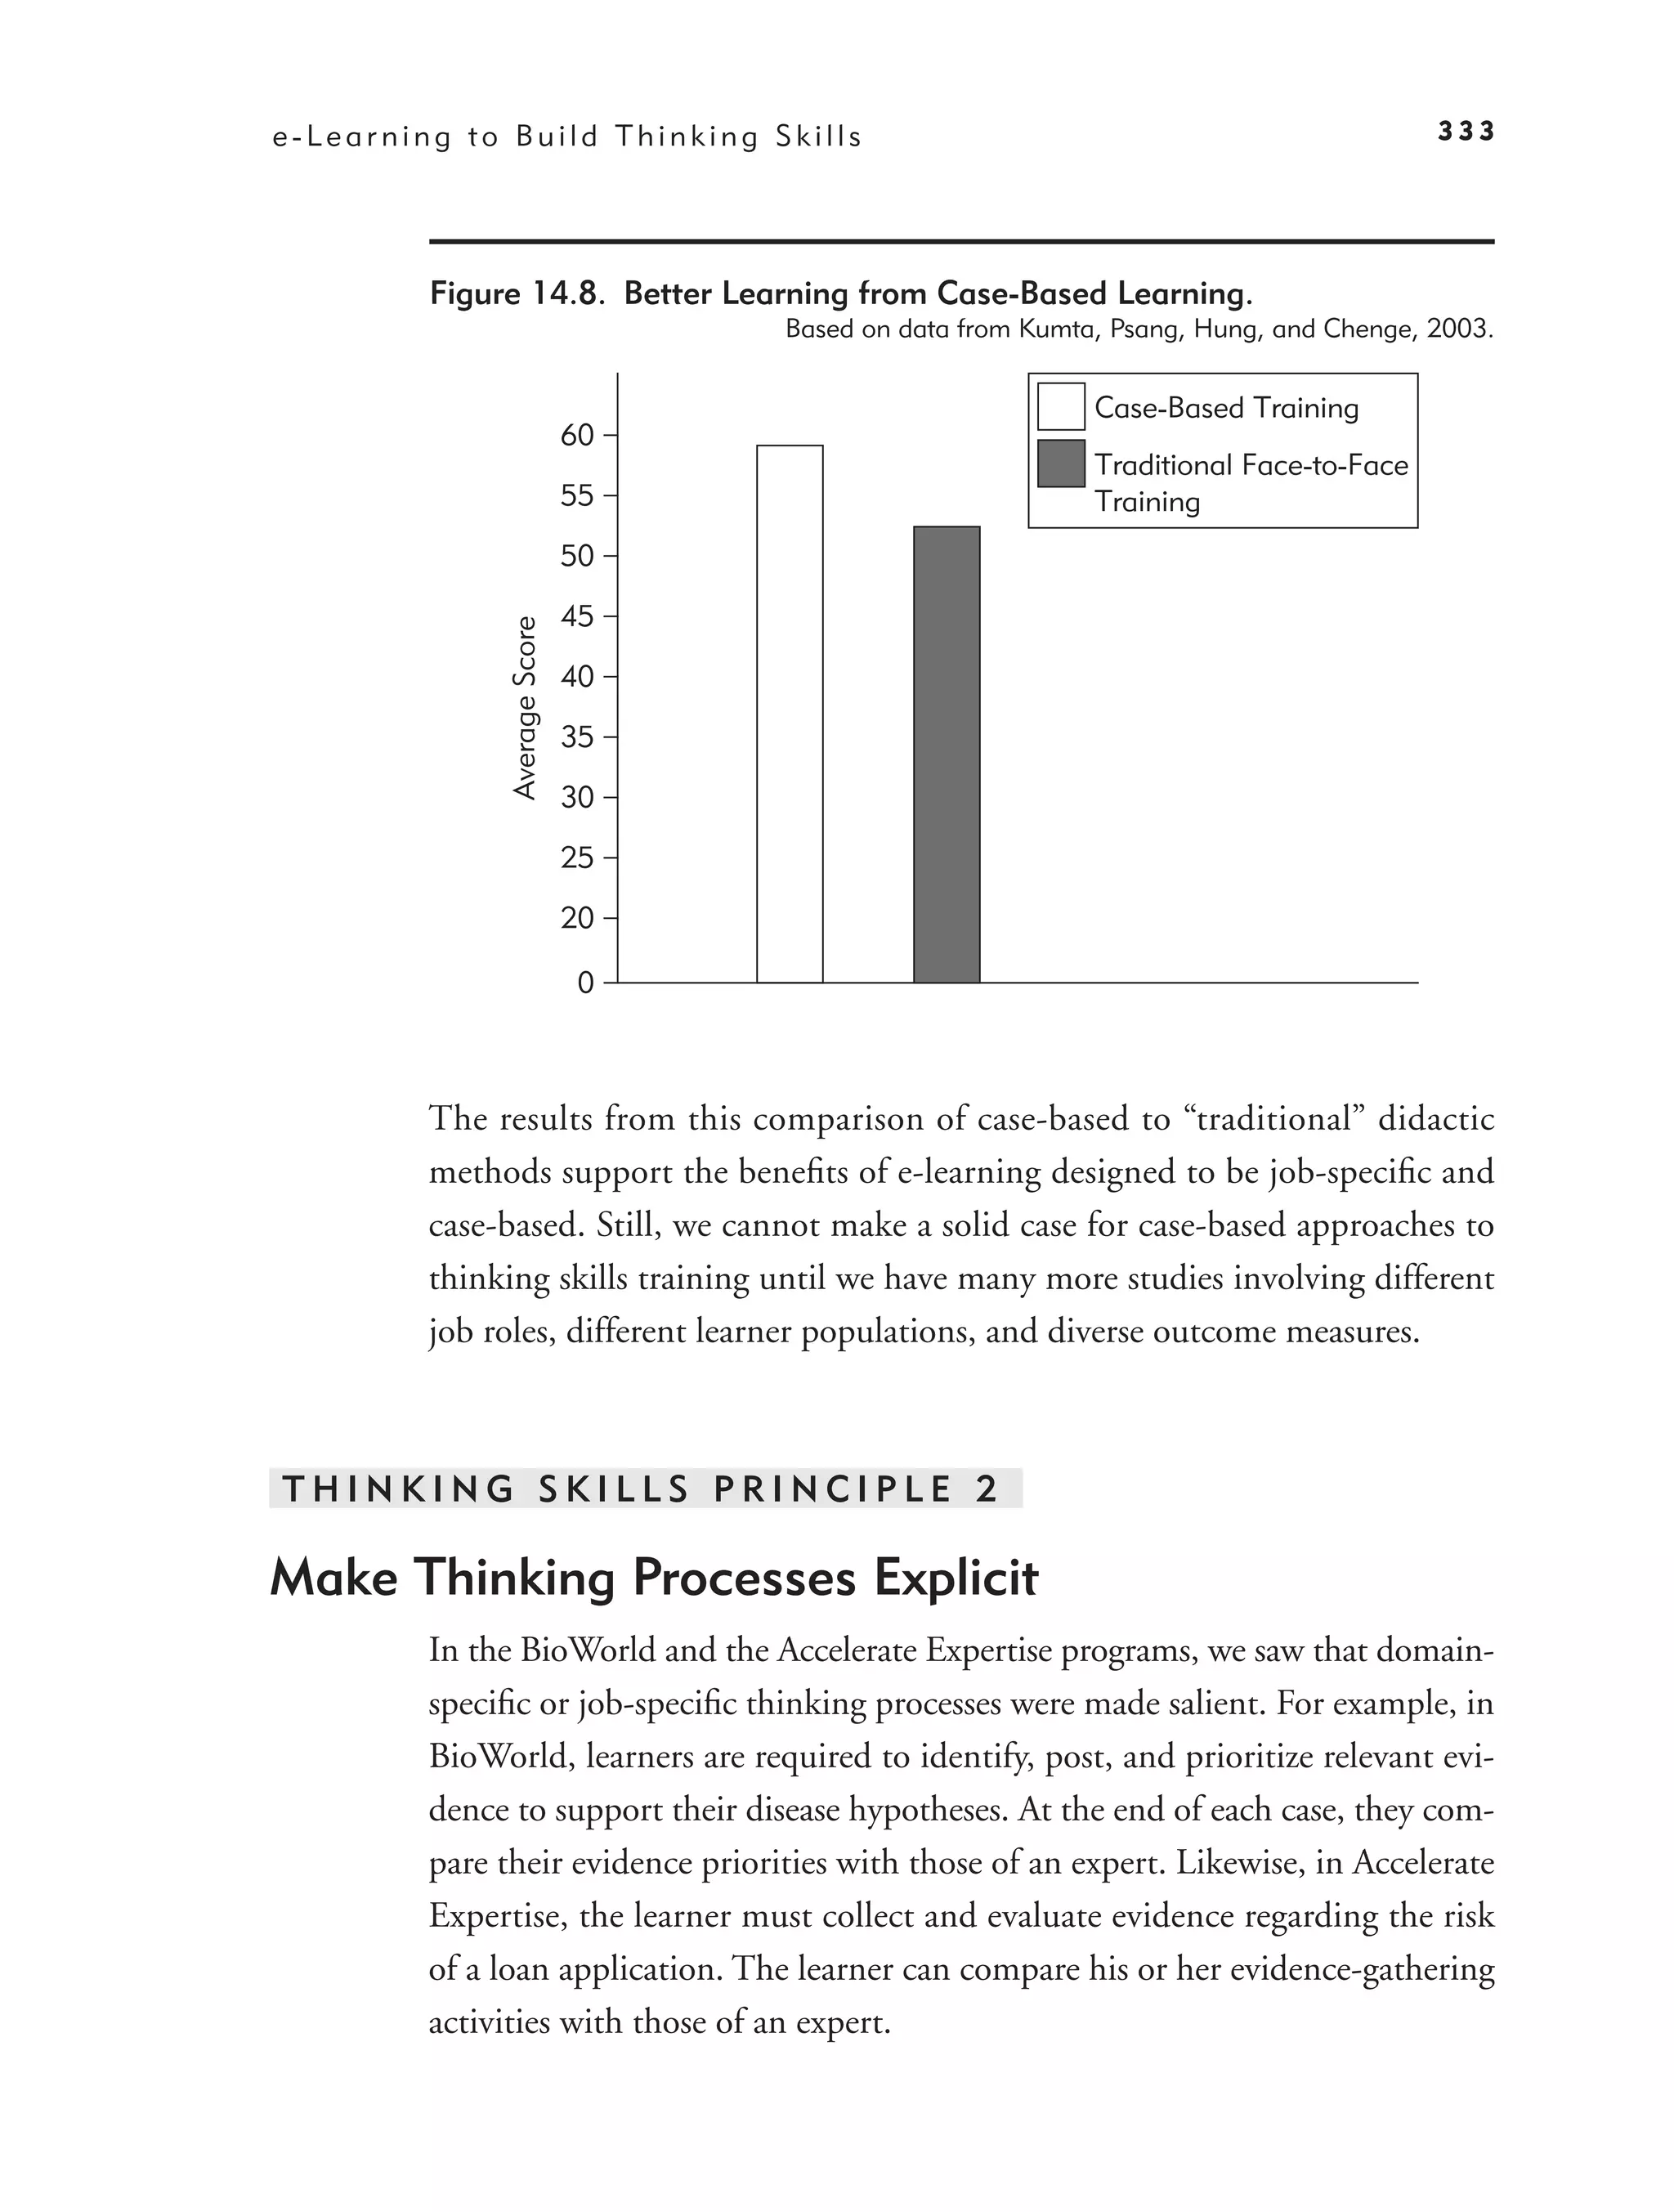
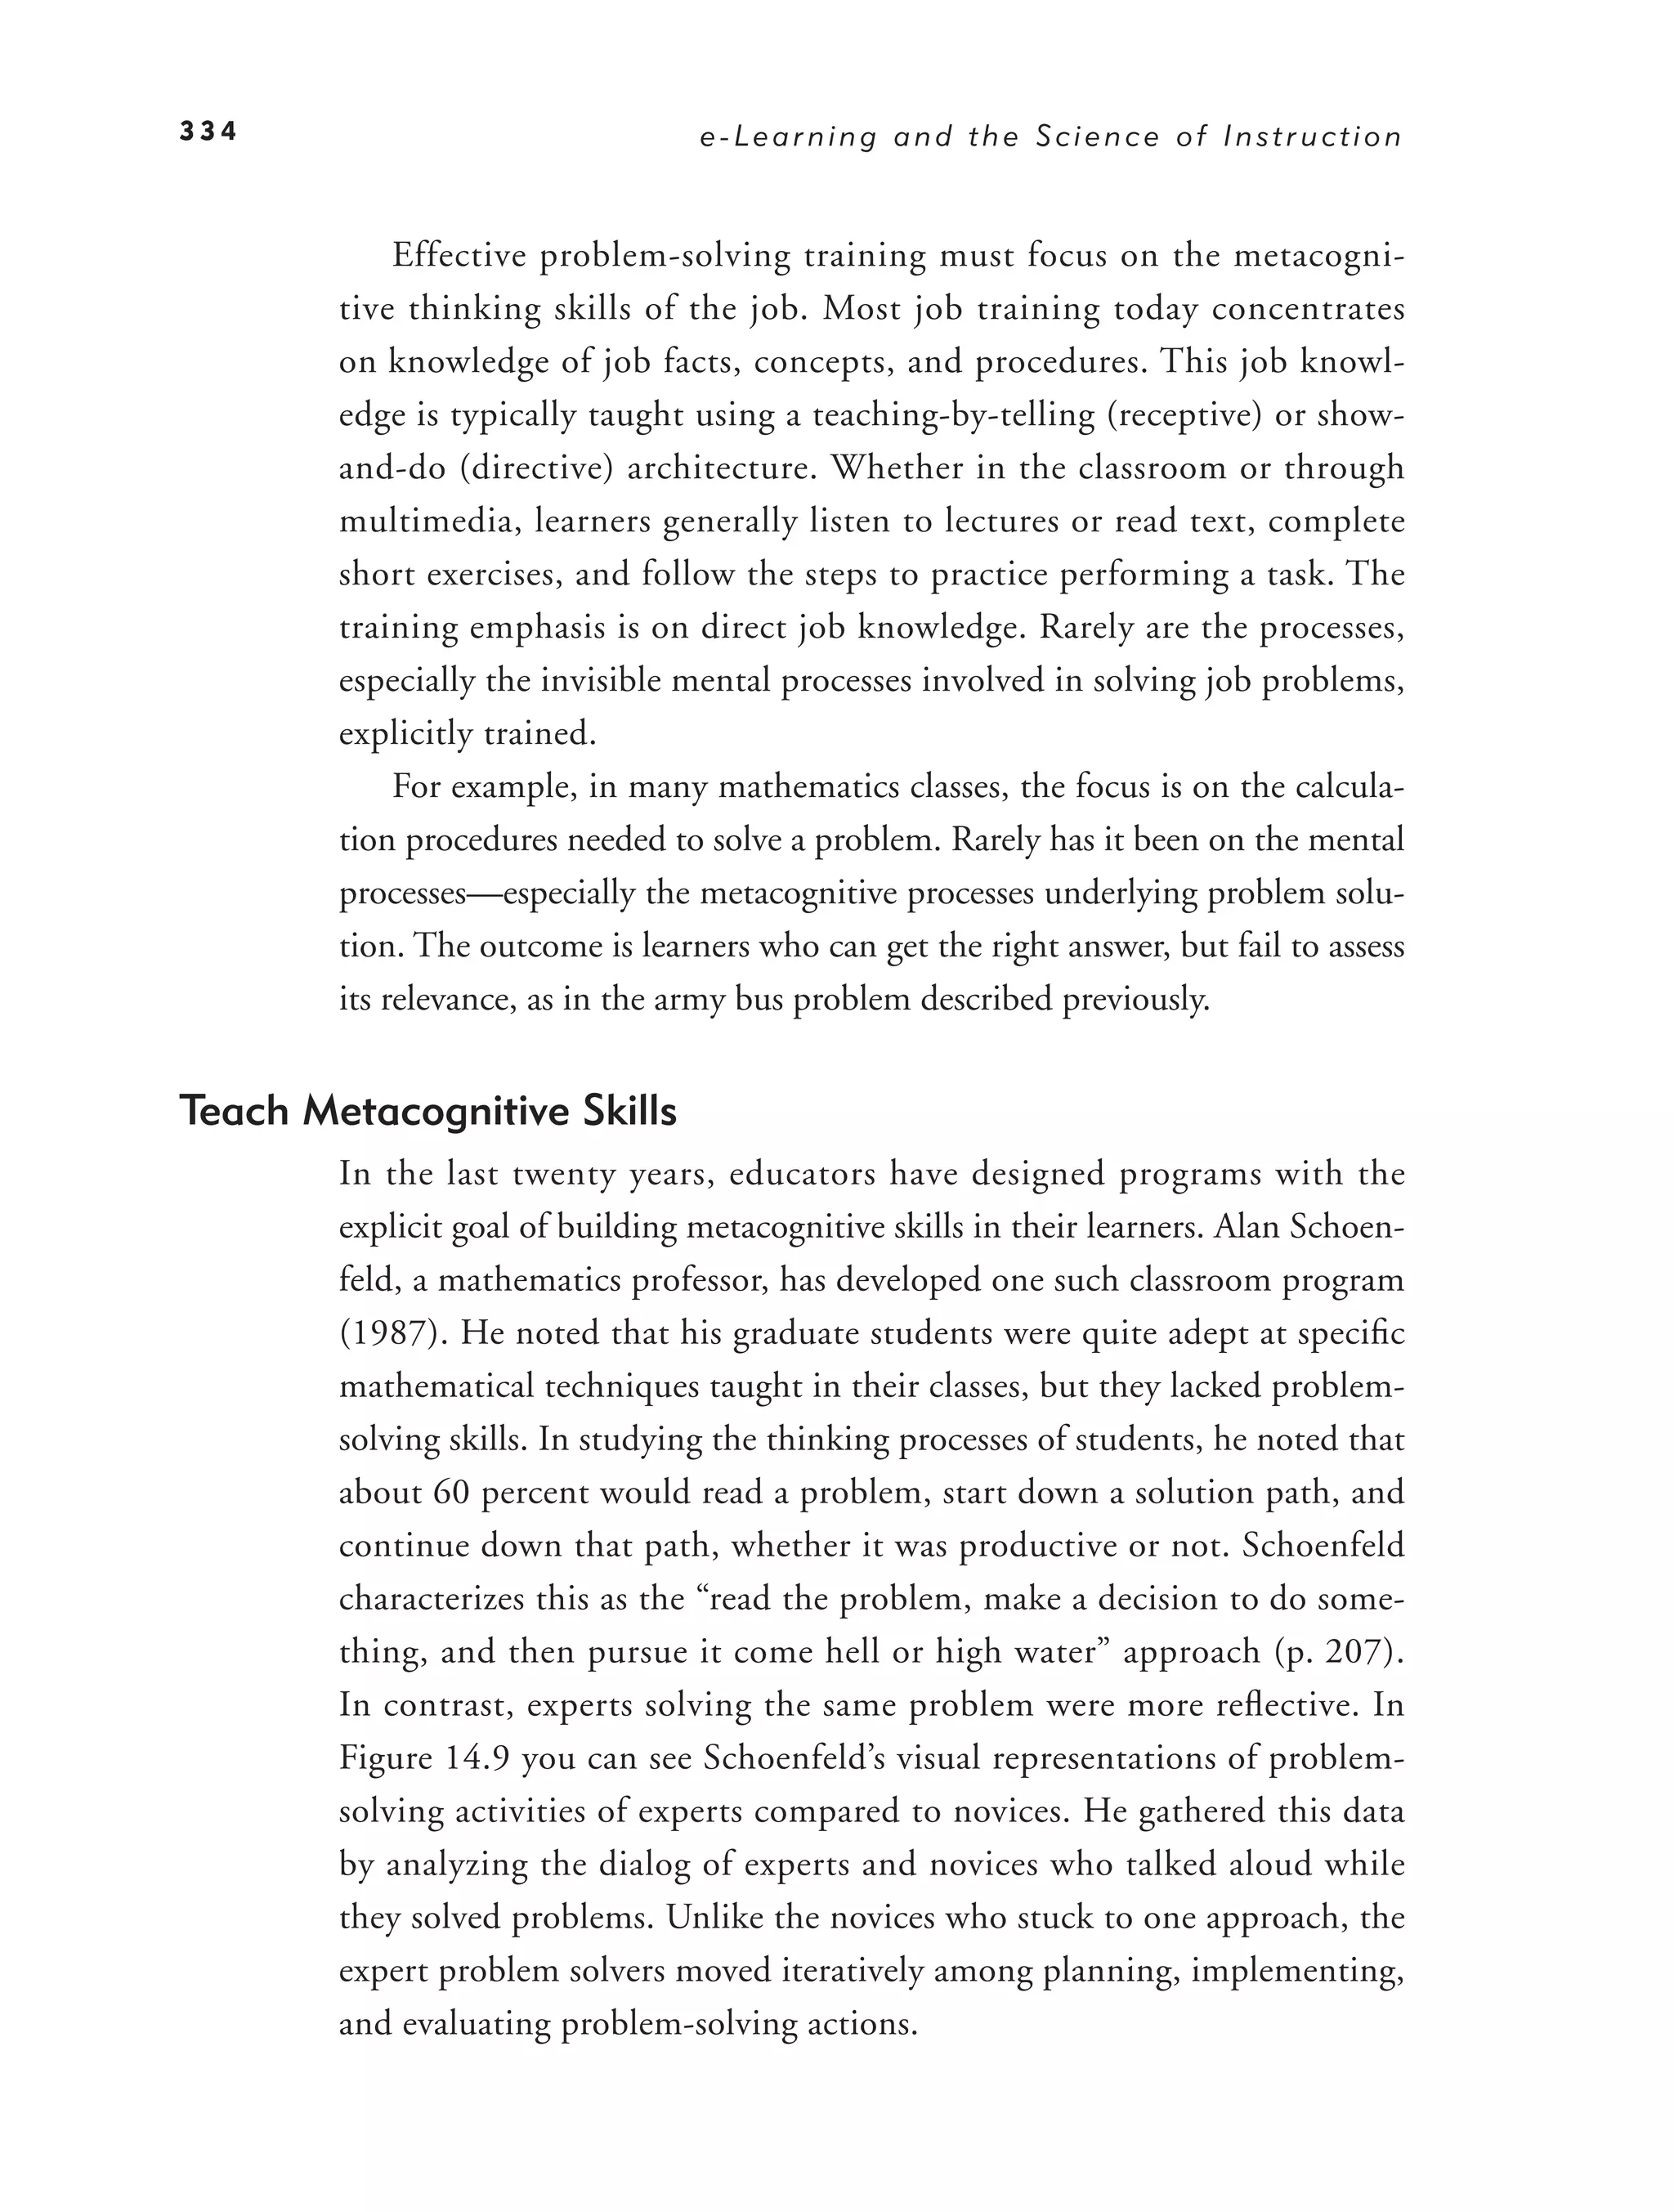
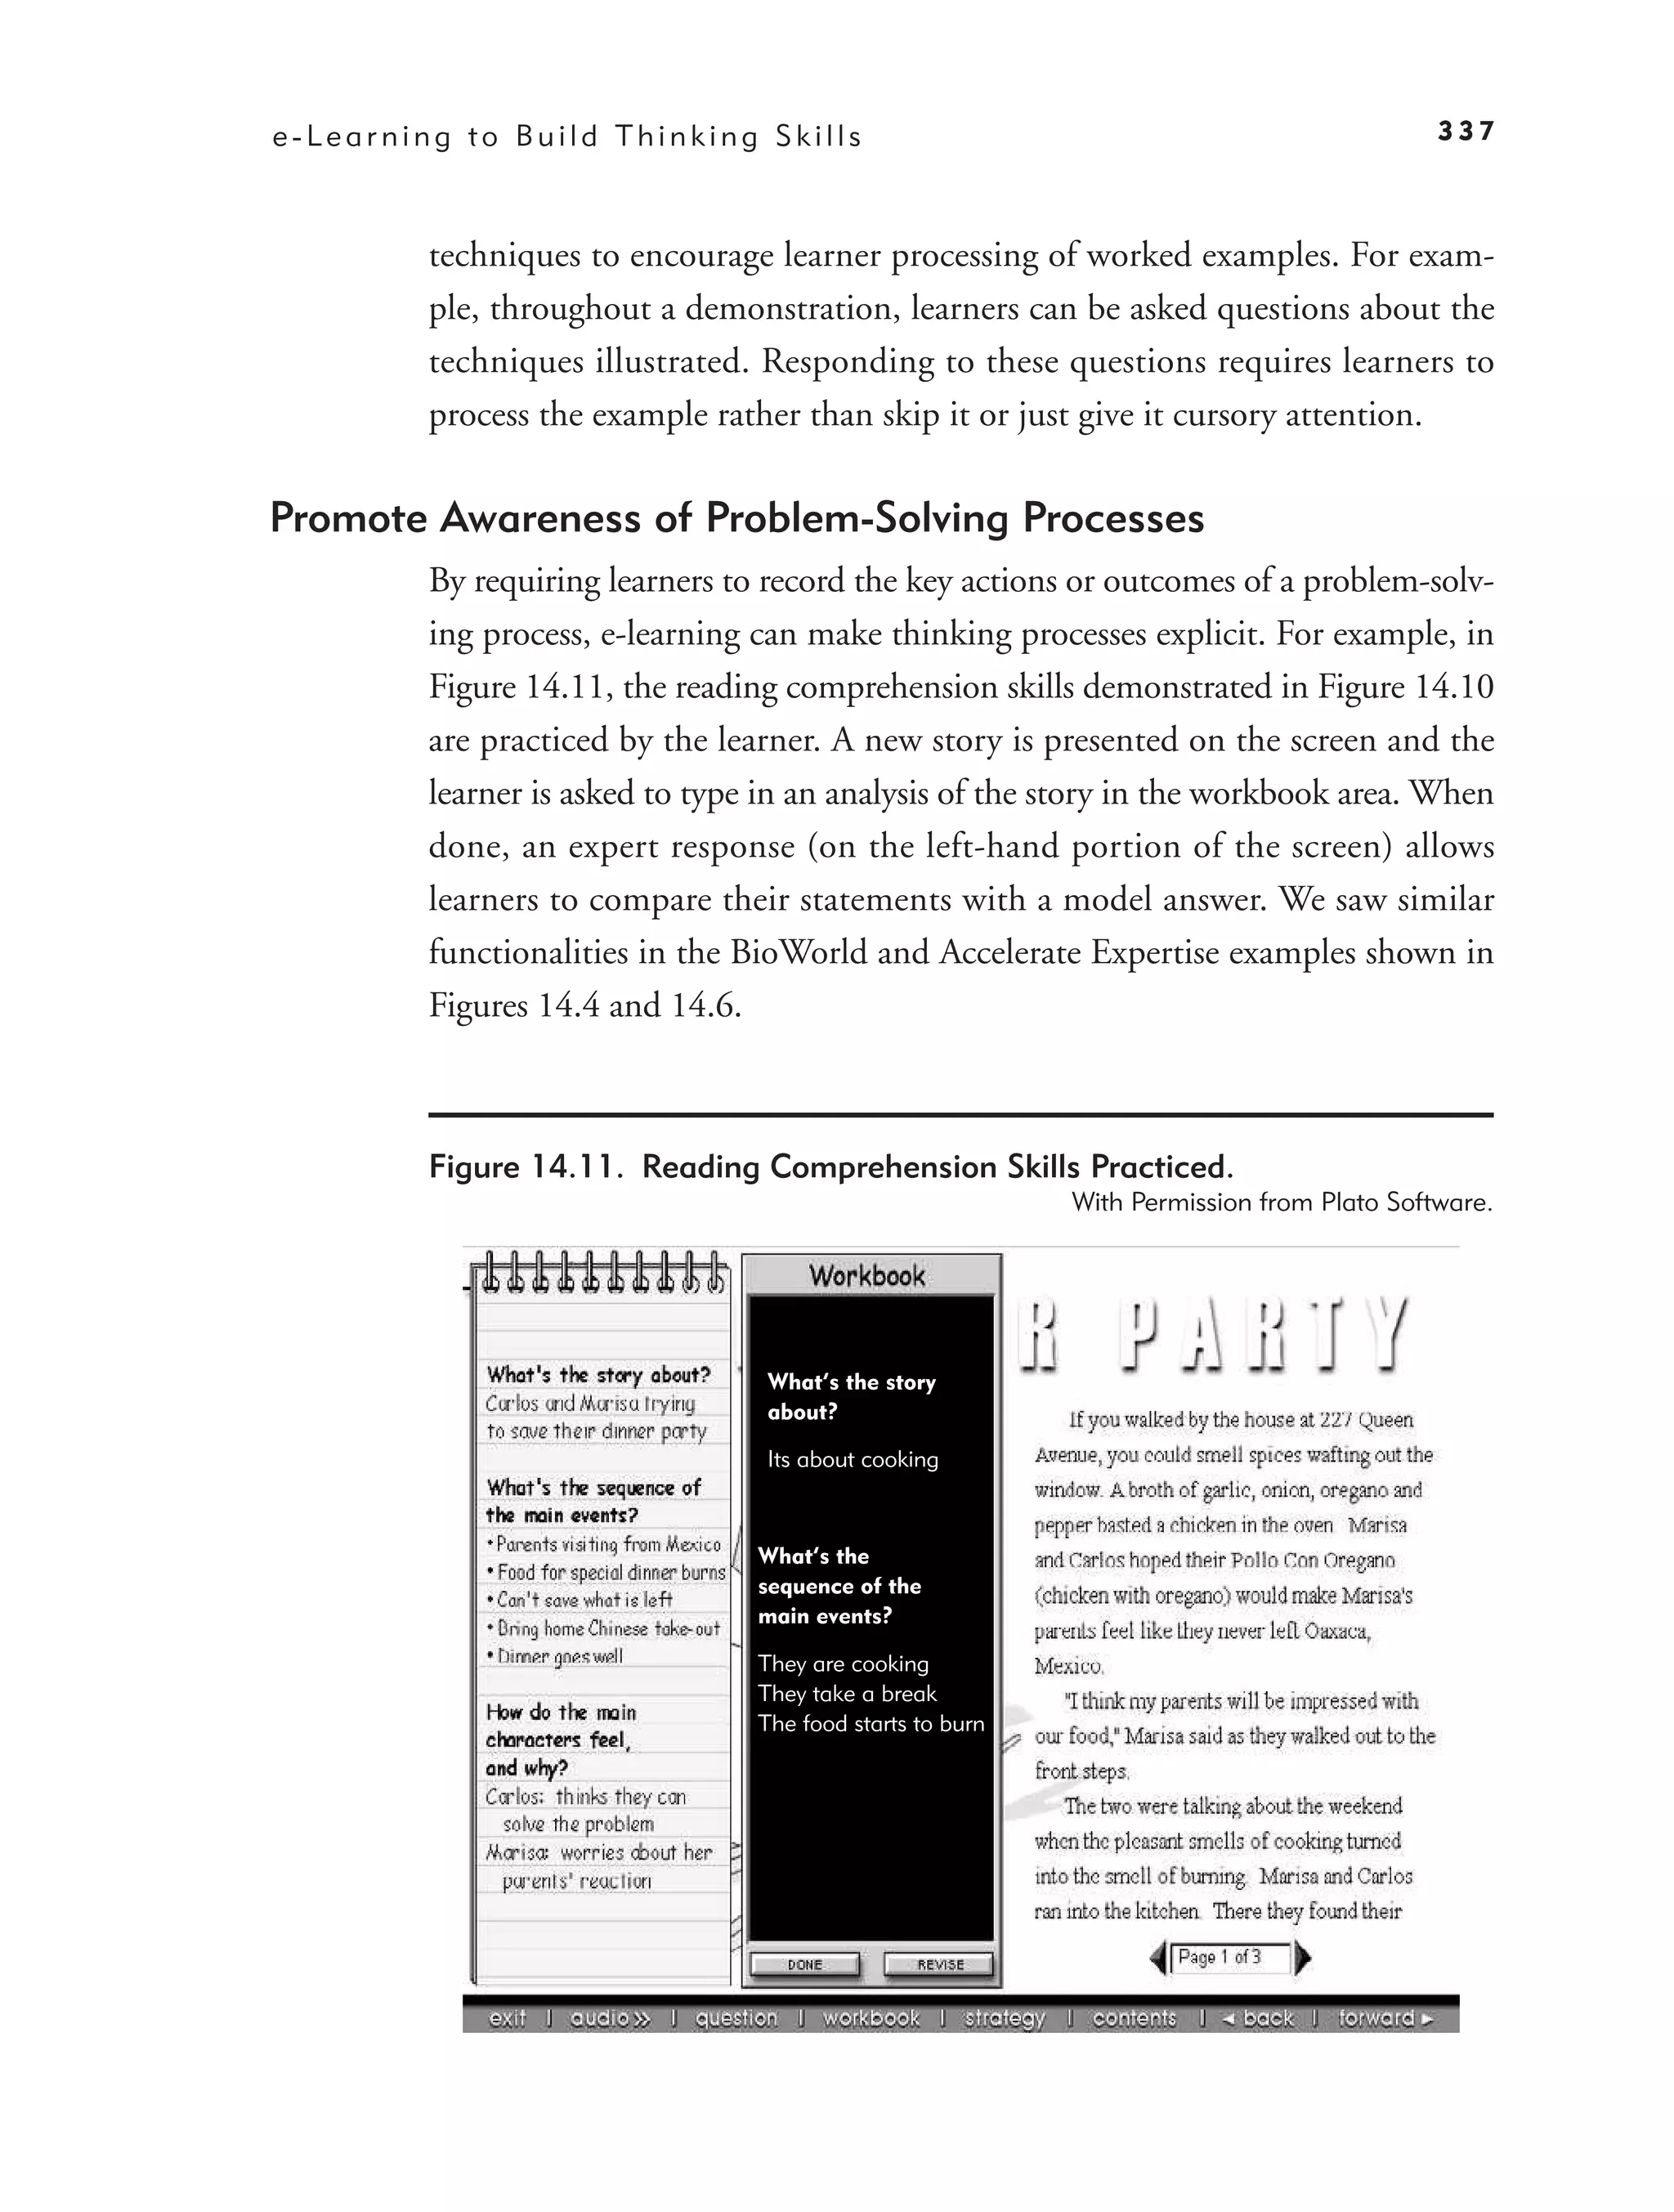
Thinking Skills Principle 2: Make Thinking Processes Explicit 333
Thinking Skills Principle 3: Define Job-Specific Problem-Solving
Processes 338
Teaching Thinking Skills: The Bottom Line 339
What We Don’t Know About Teaching Thinking Skills 340
15. Simulations and Games in e-Learning 345
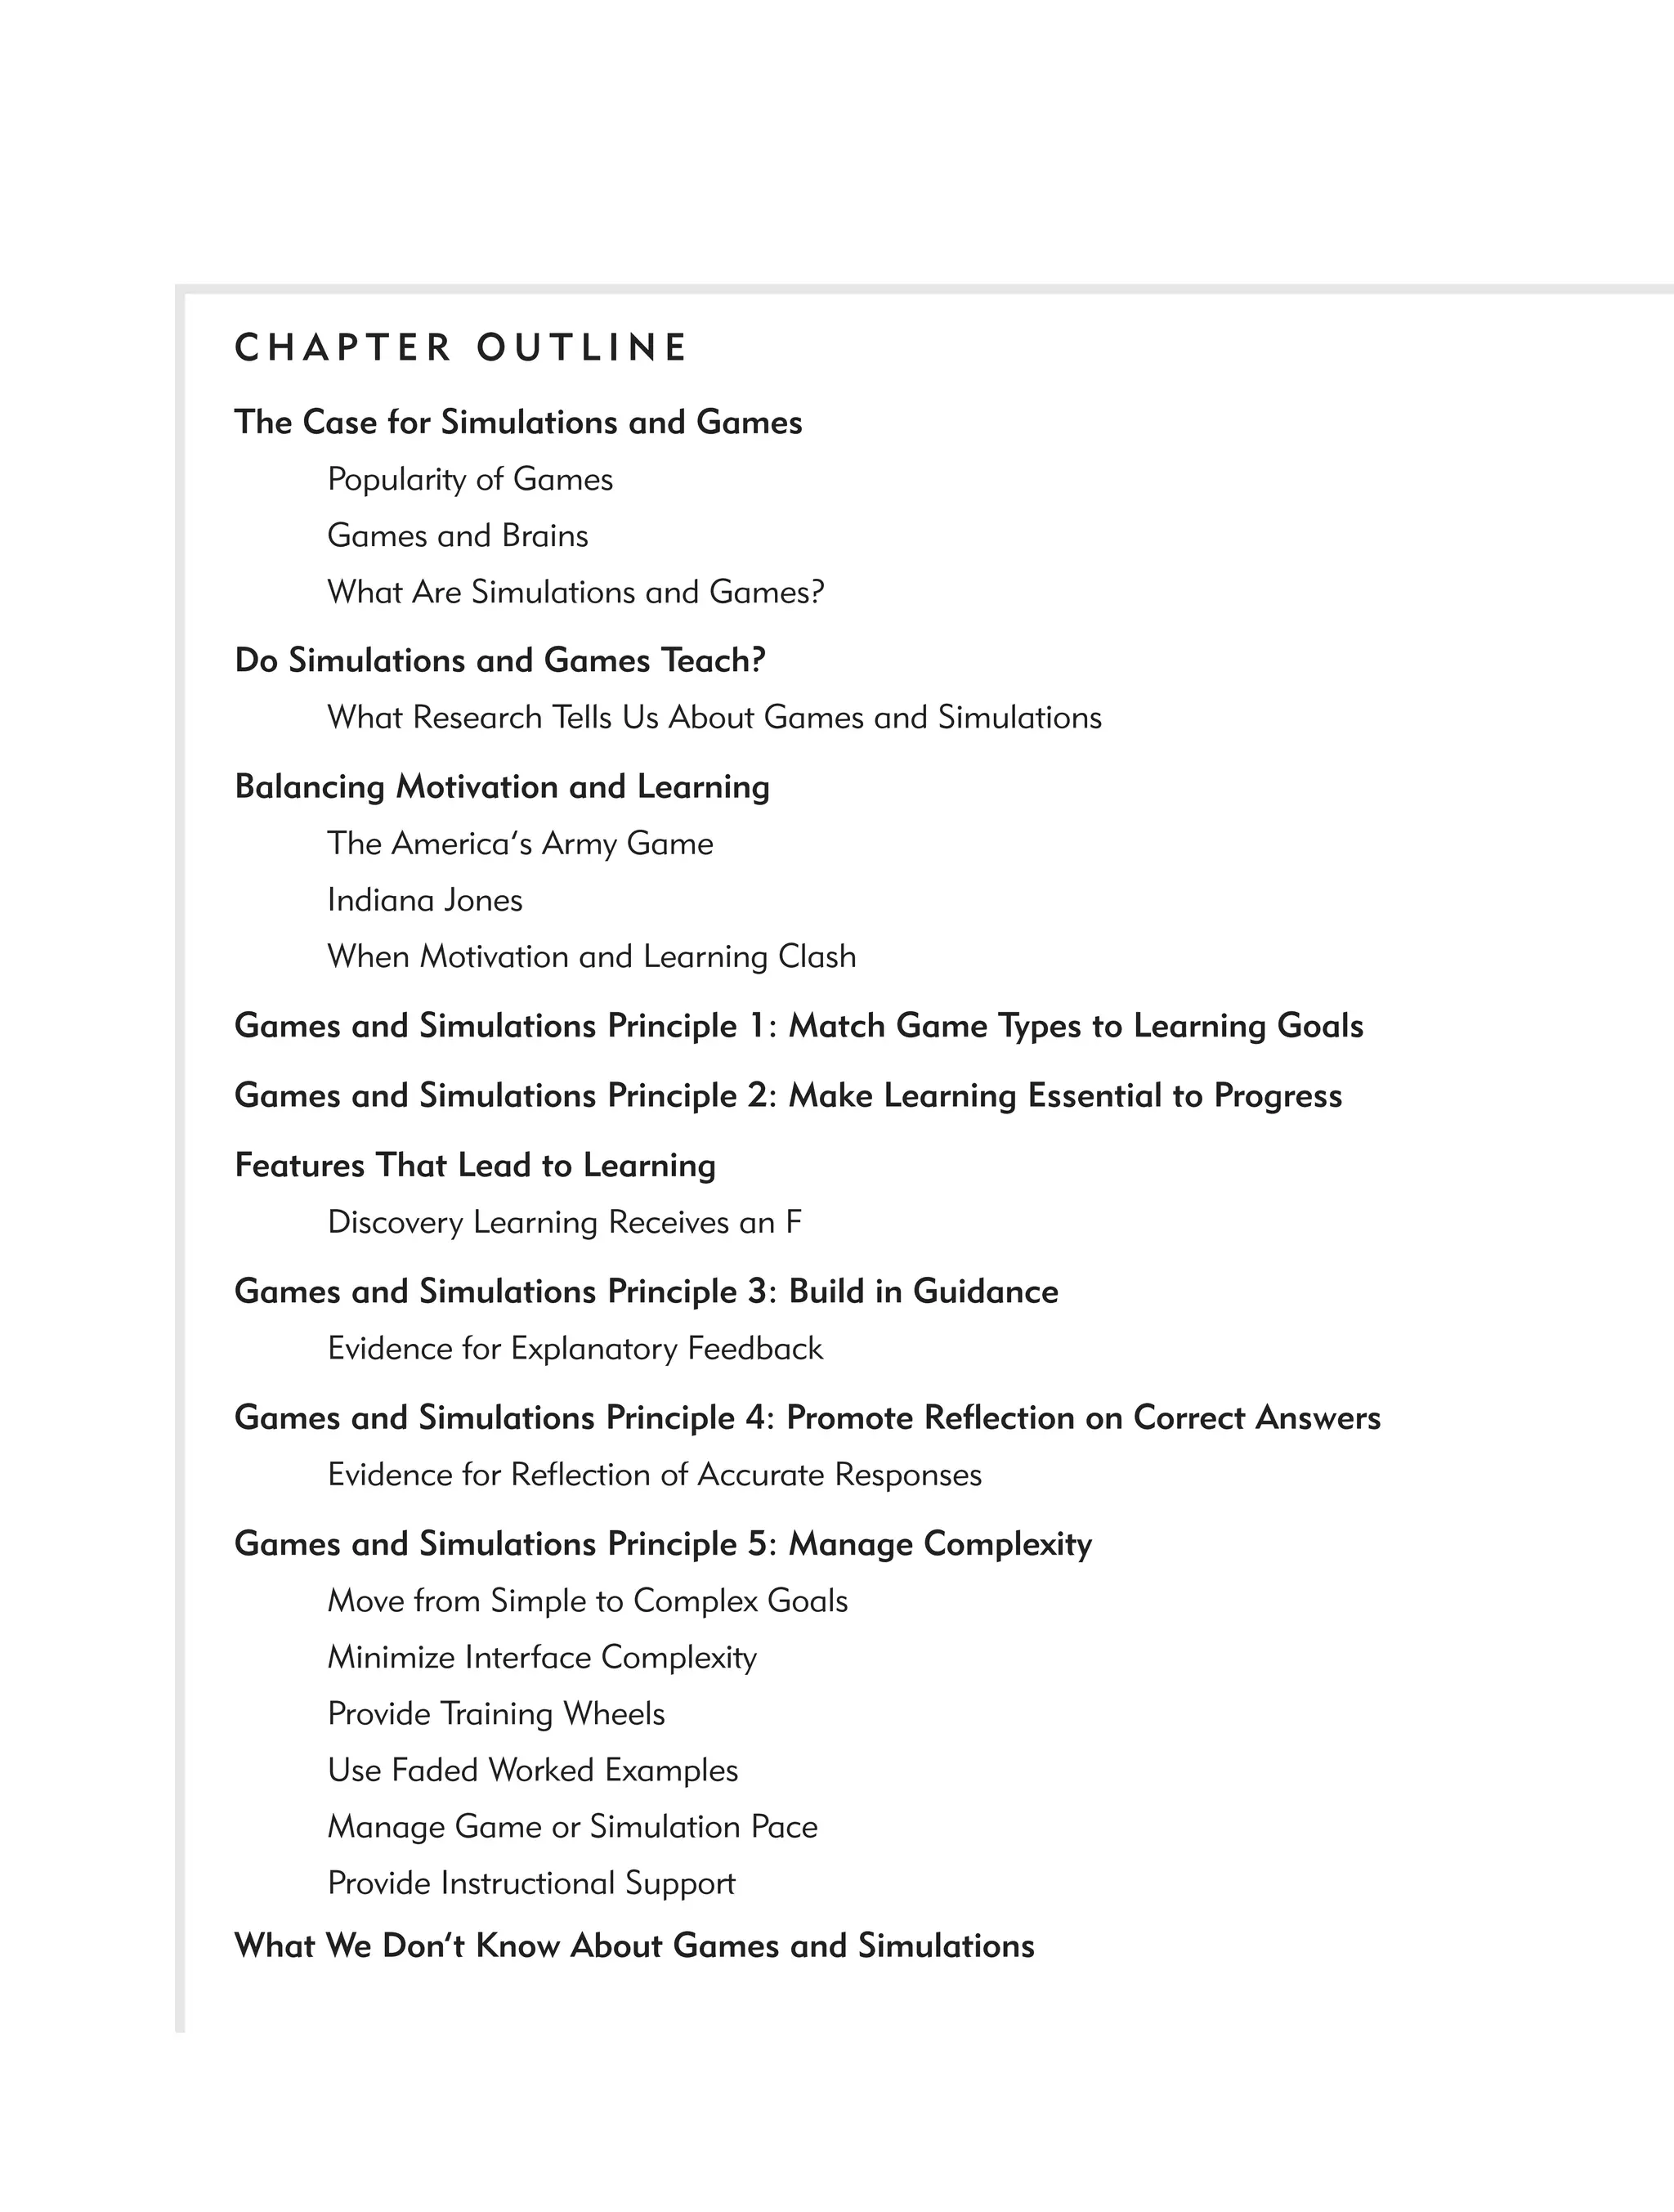
The Case for Simulations and Games 347
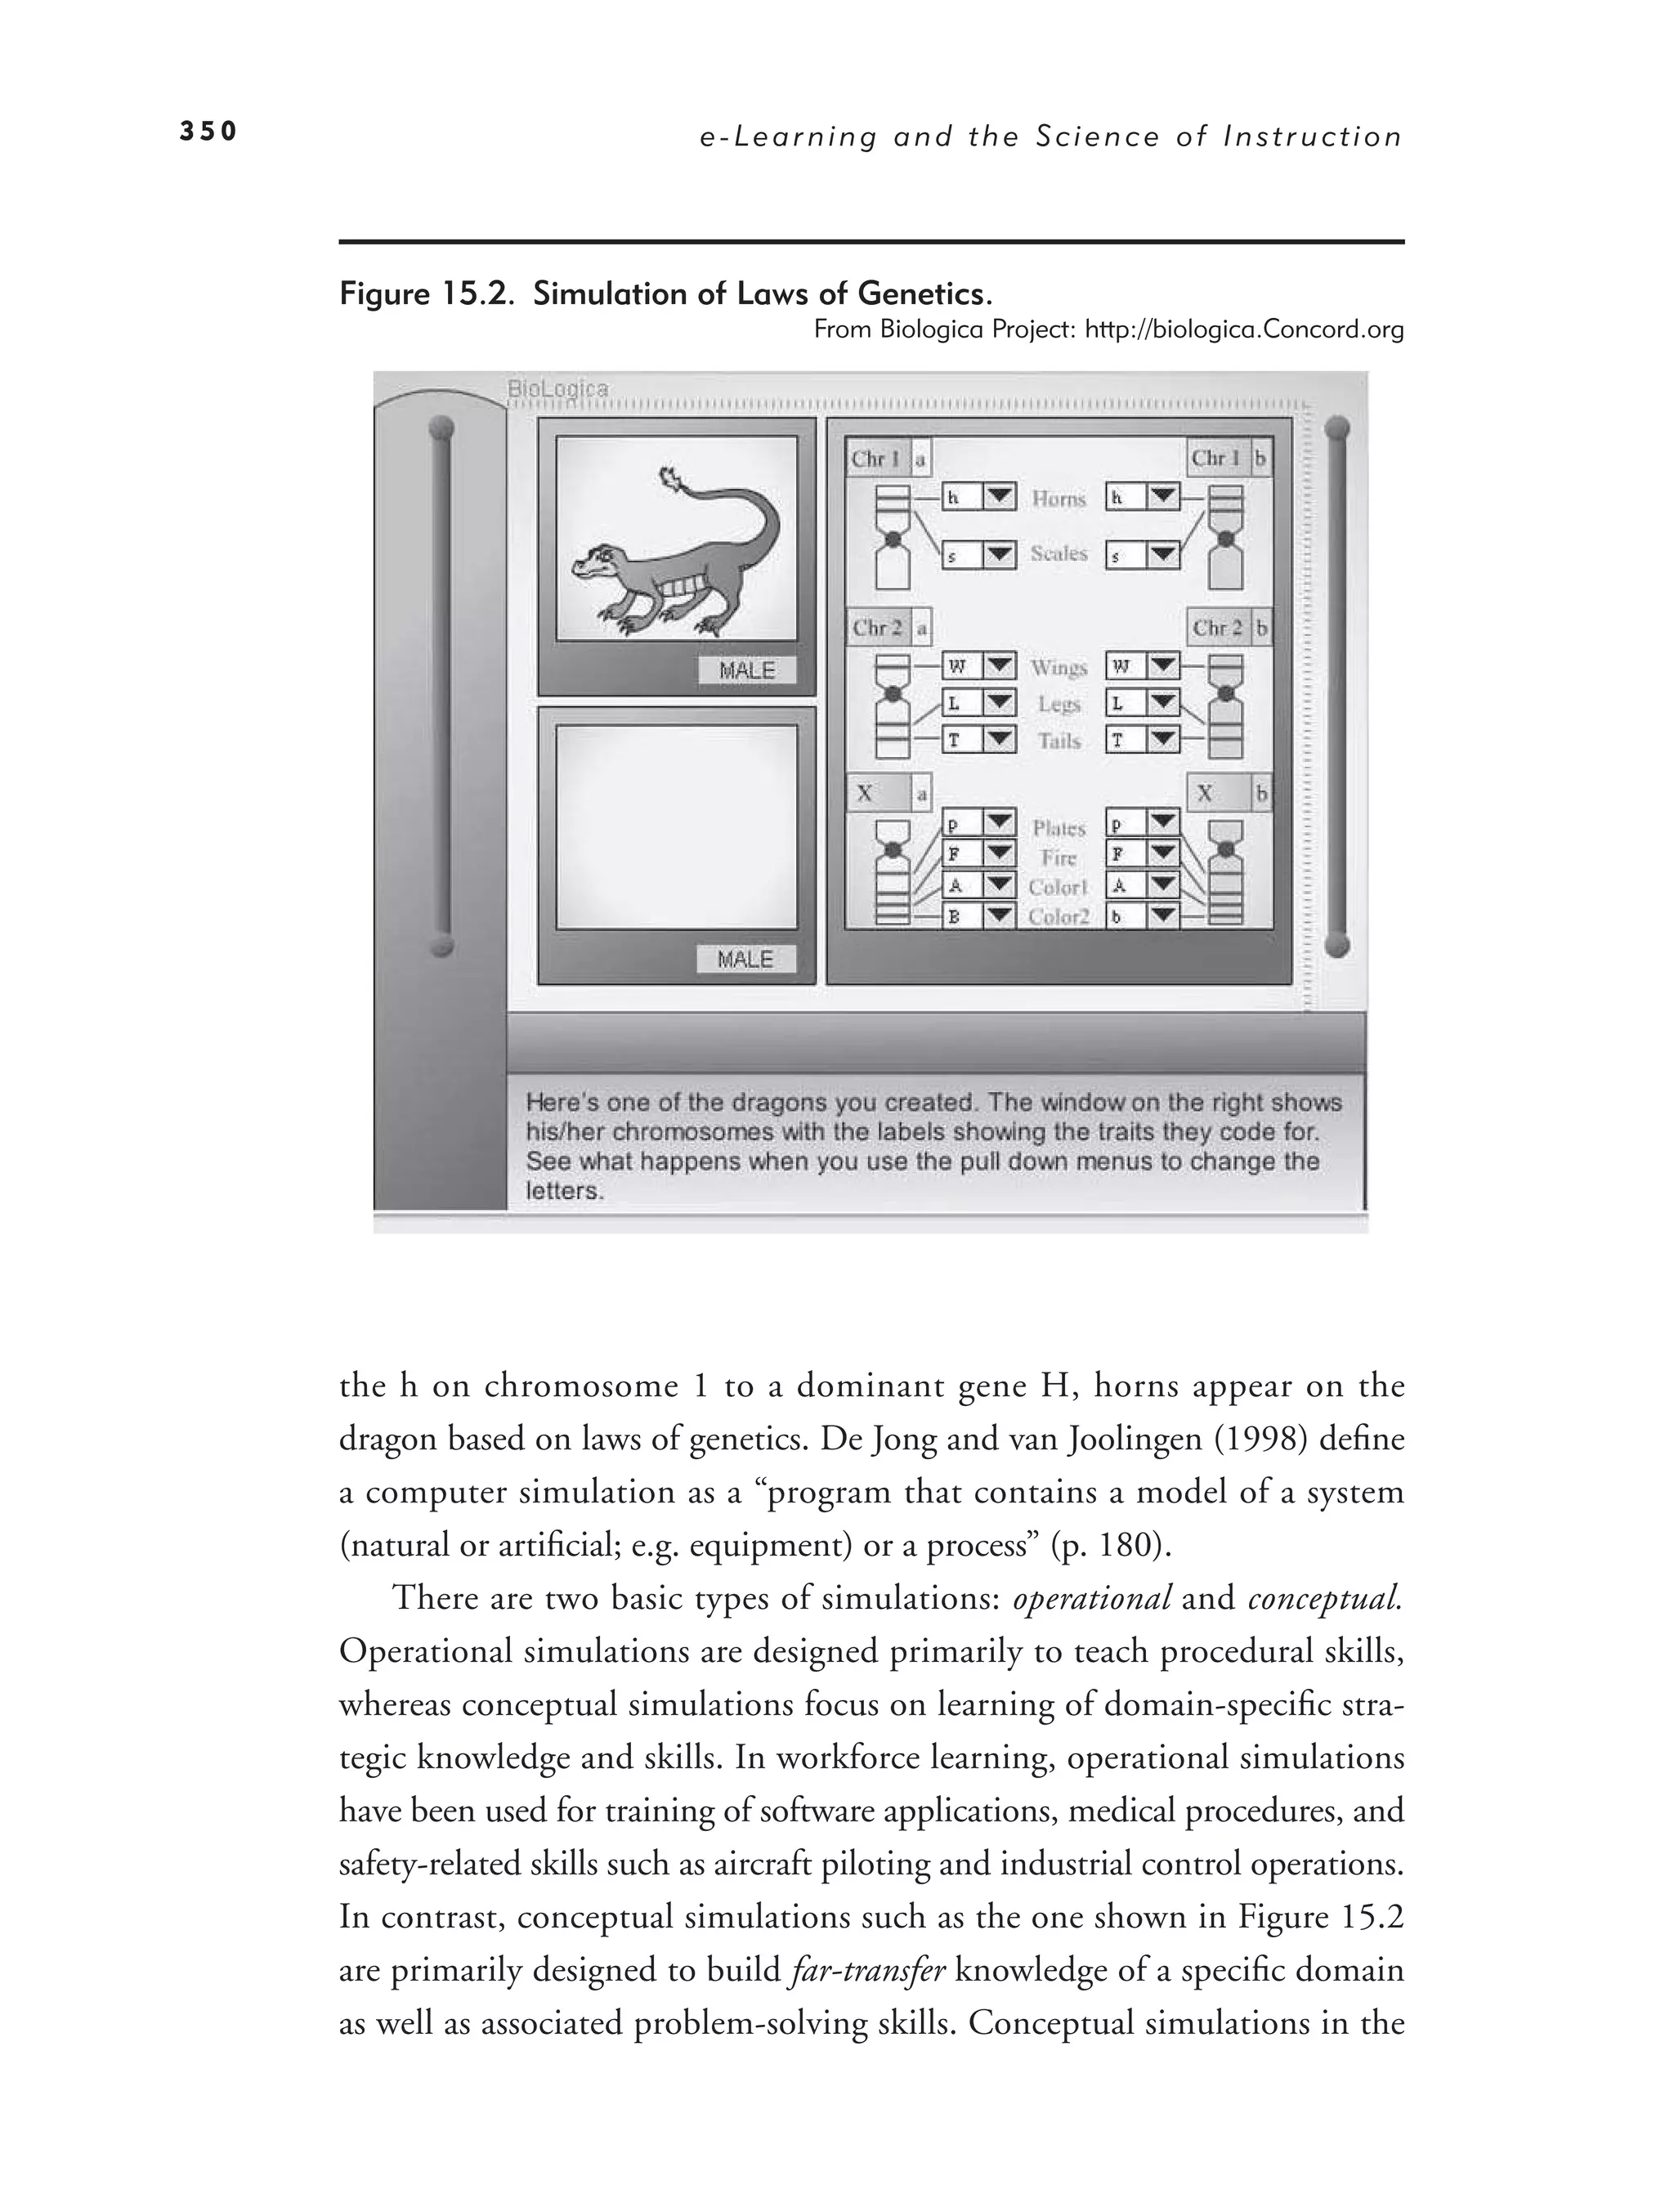
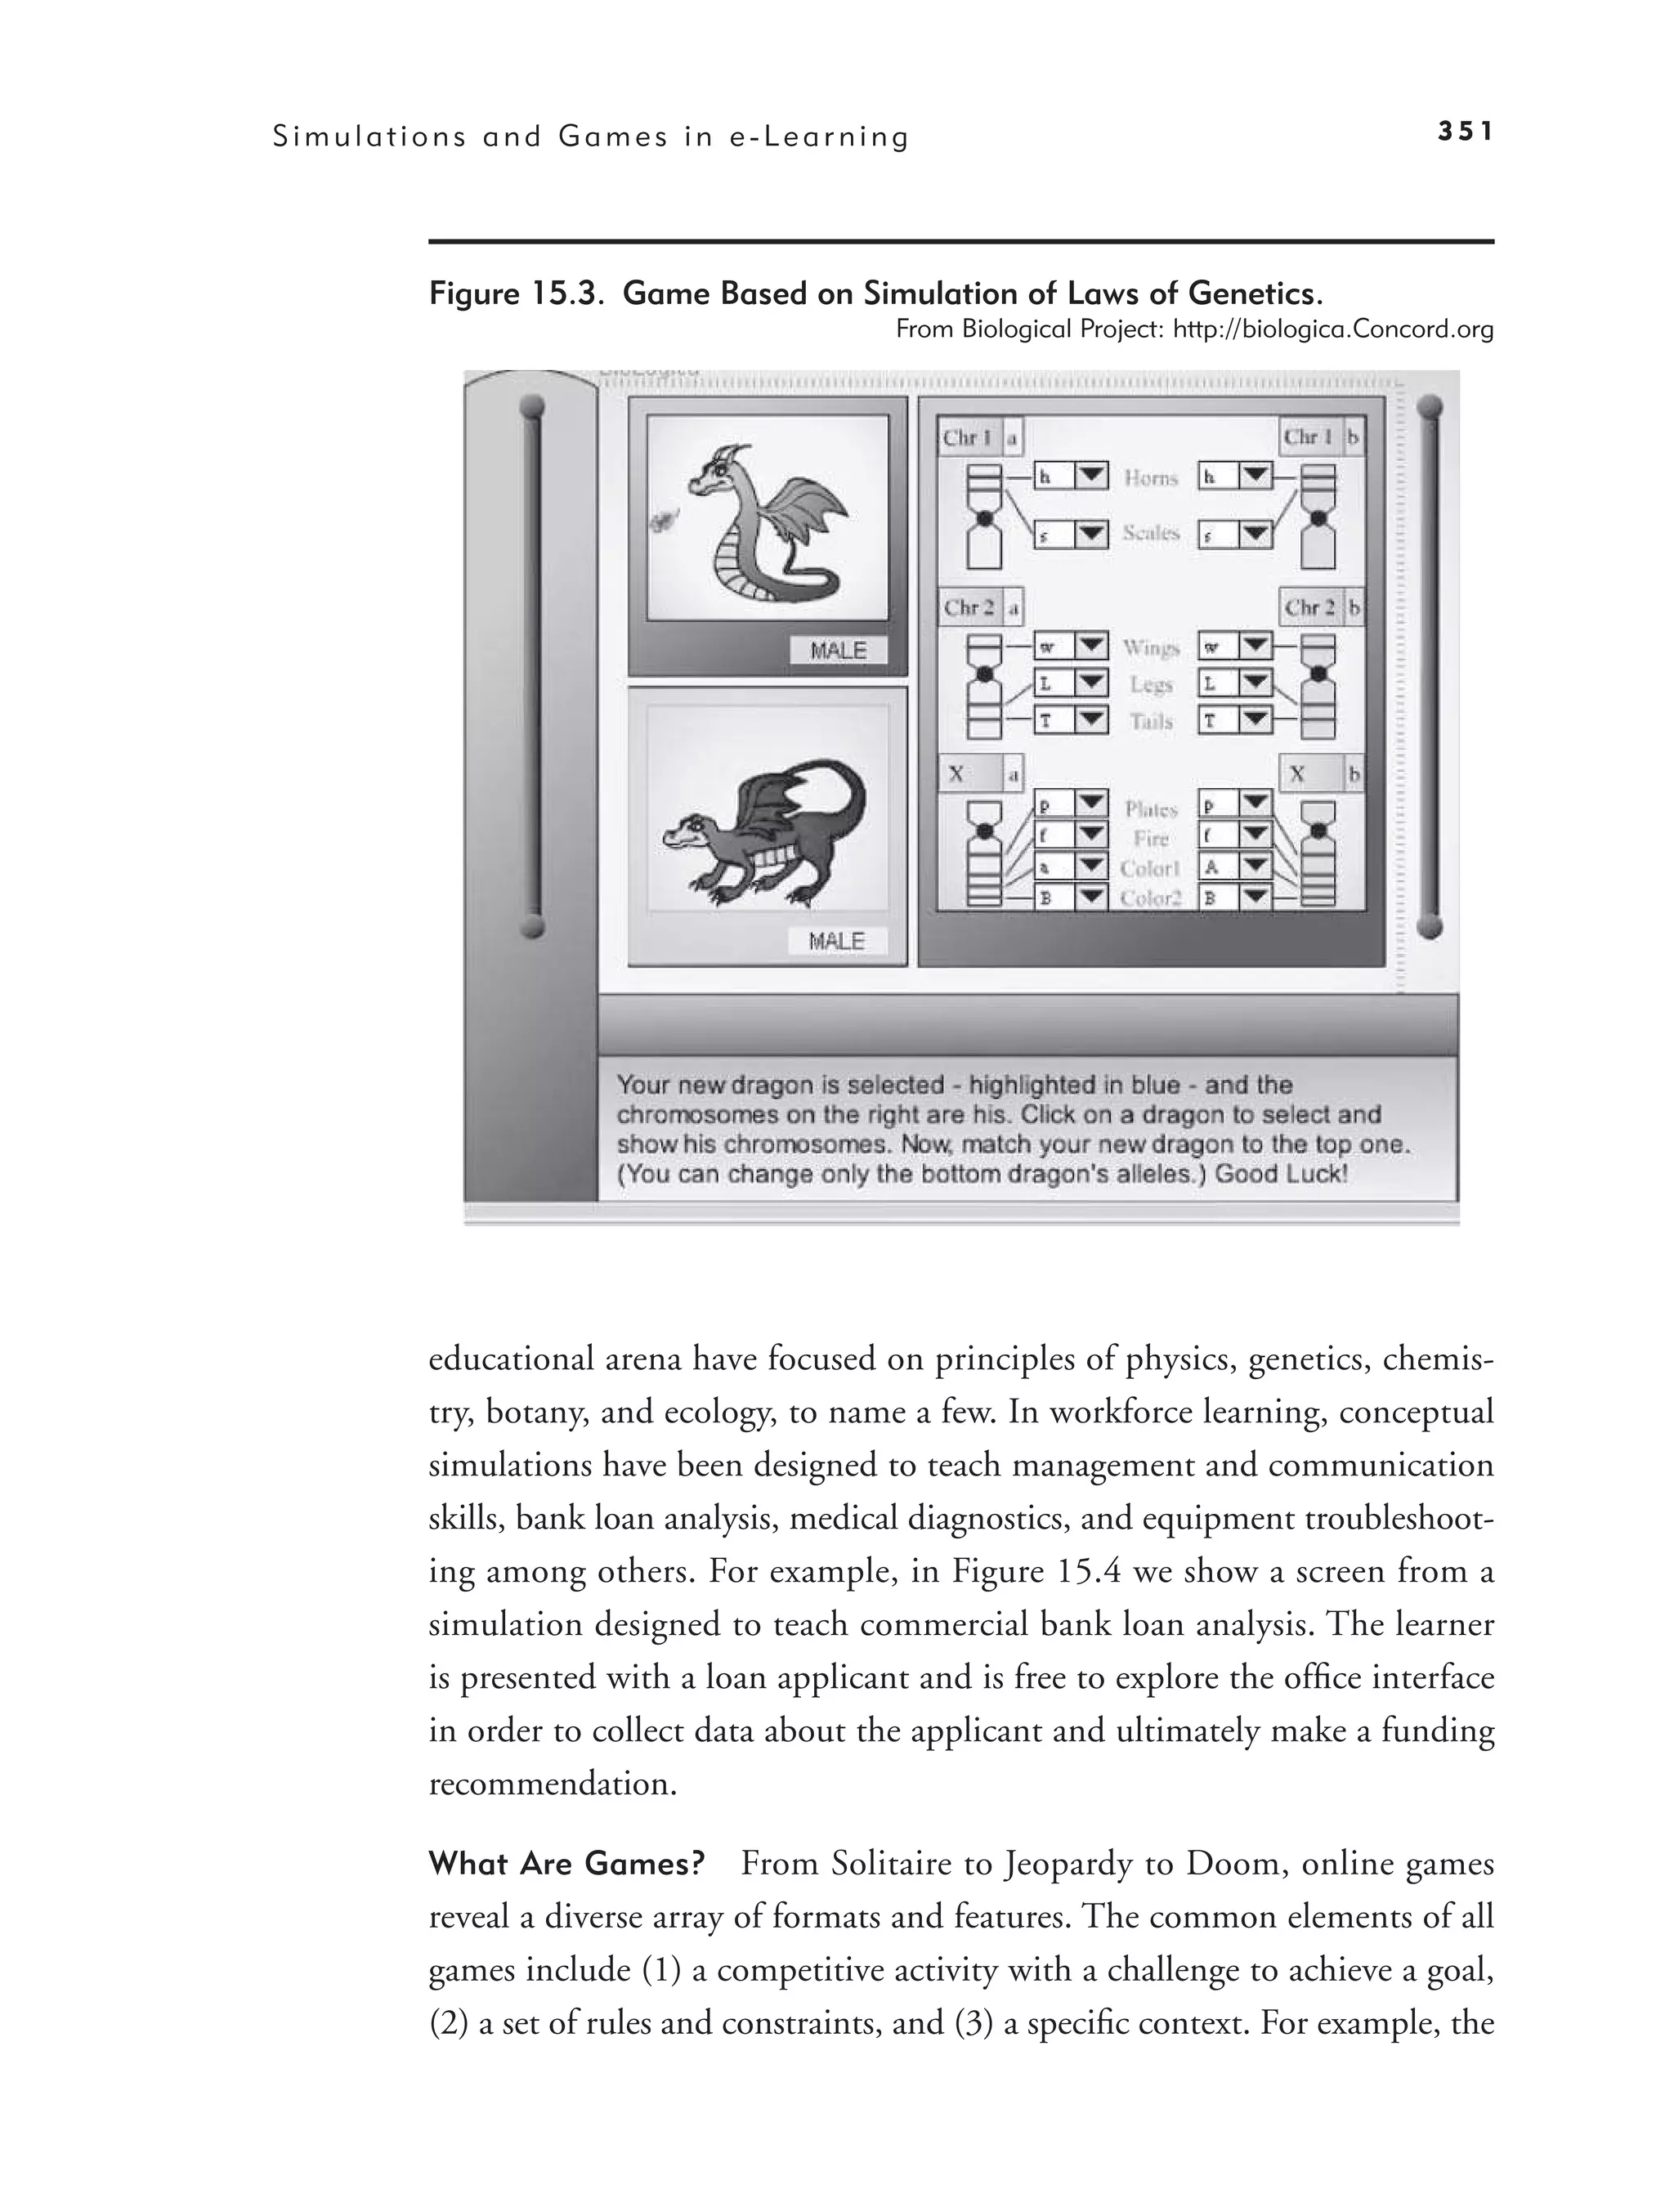
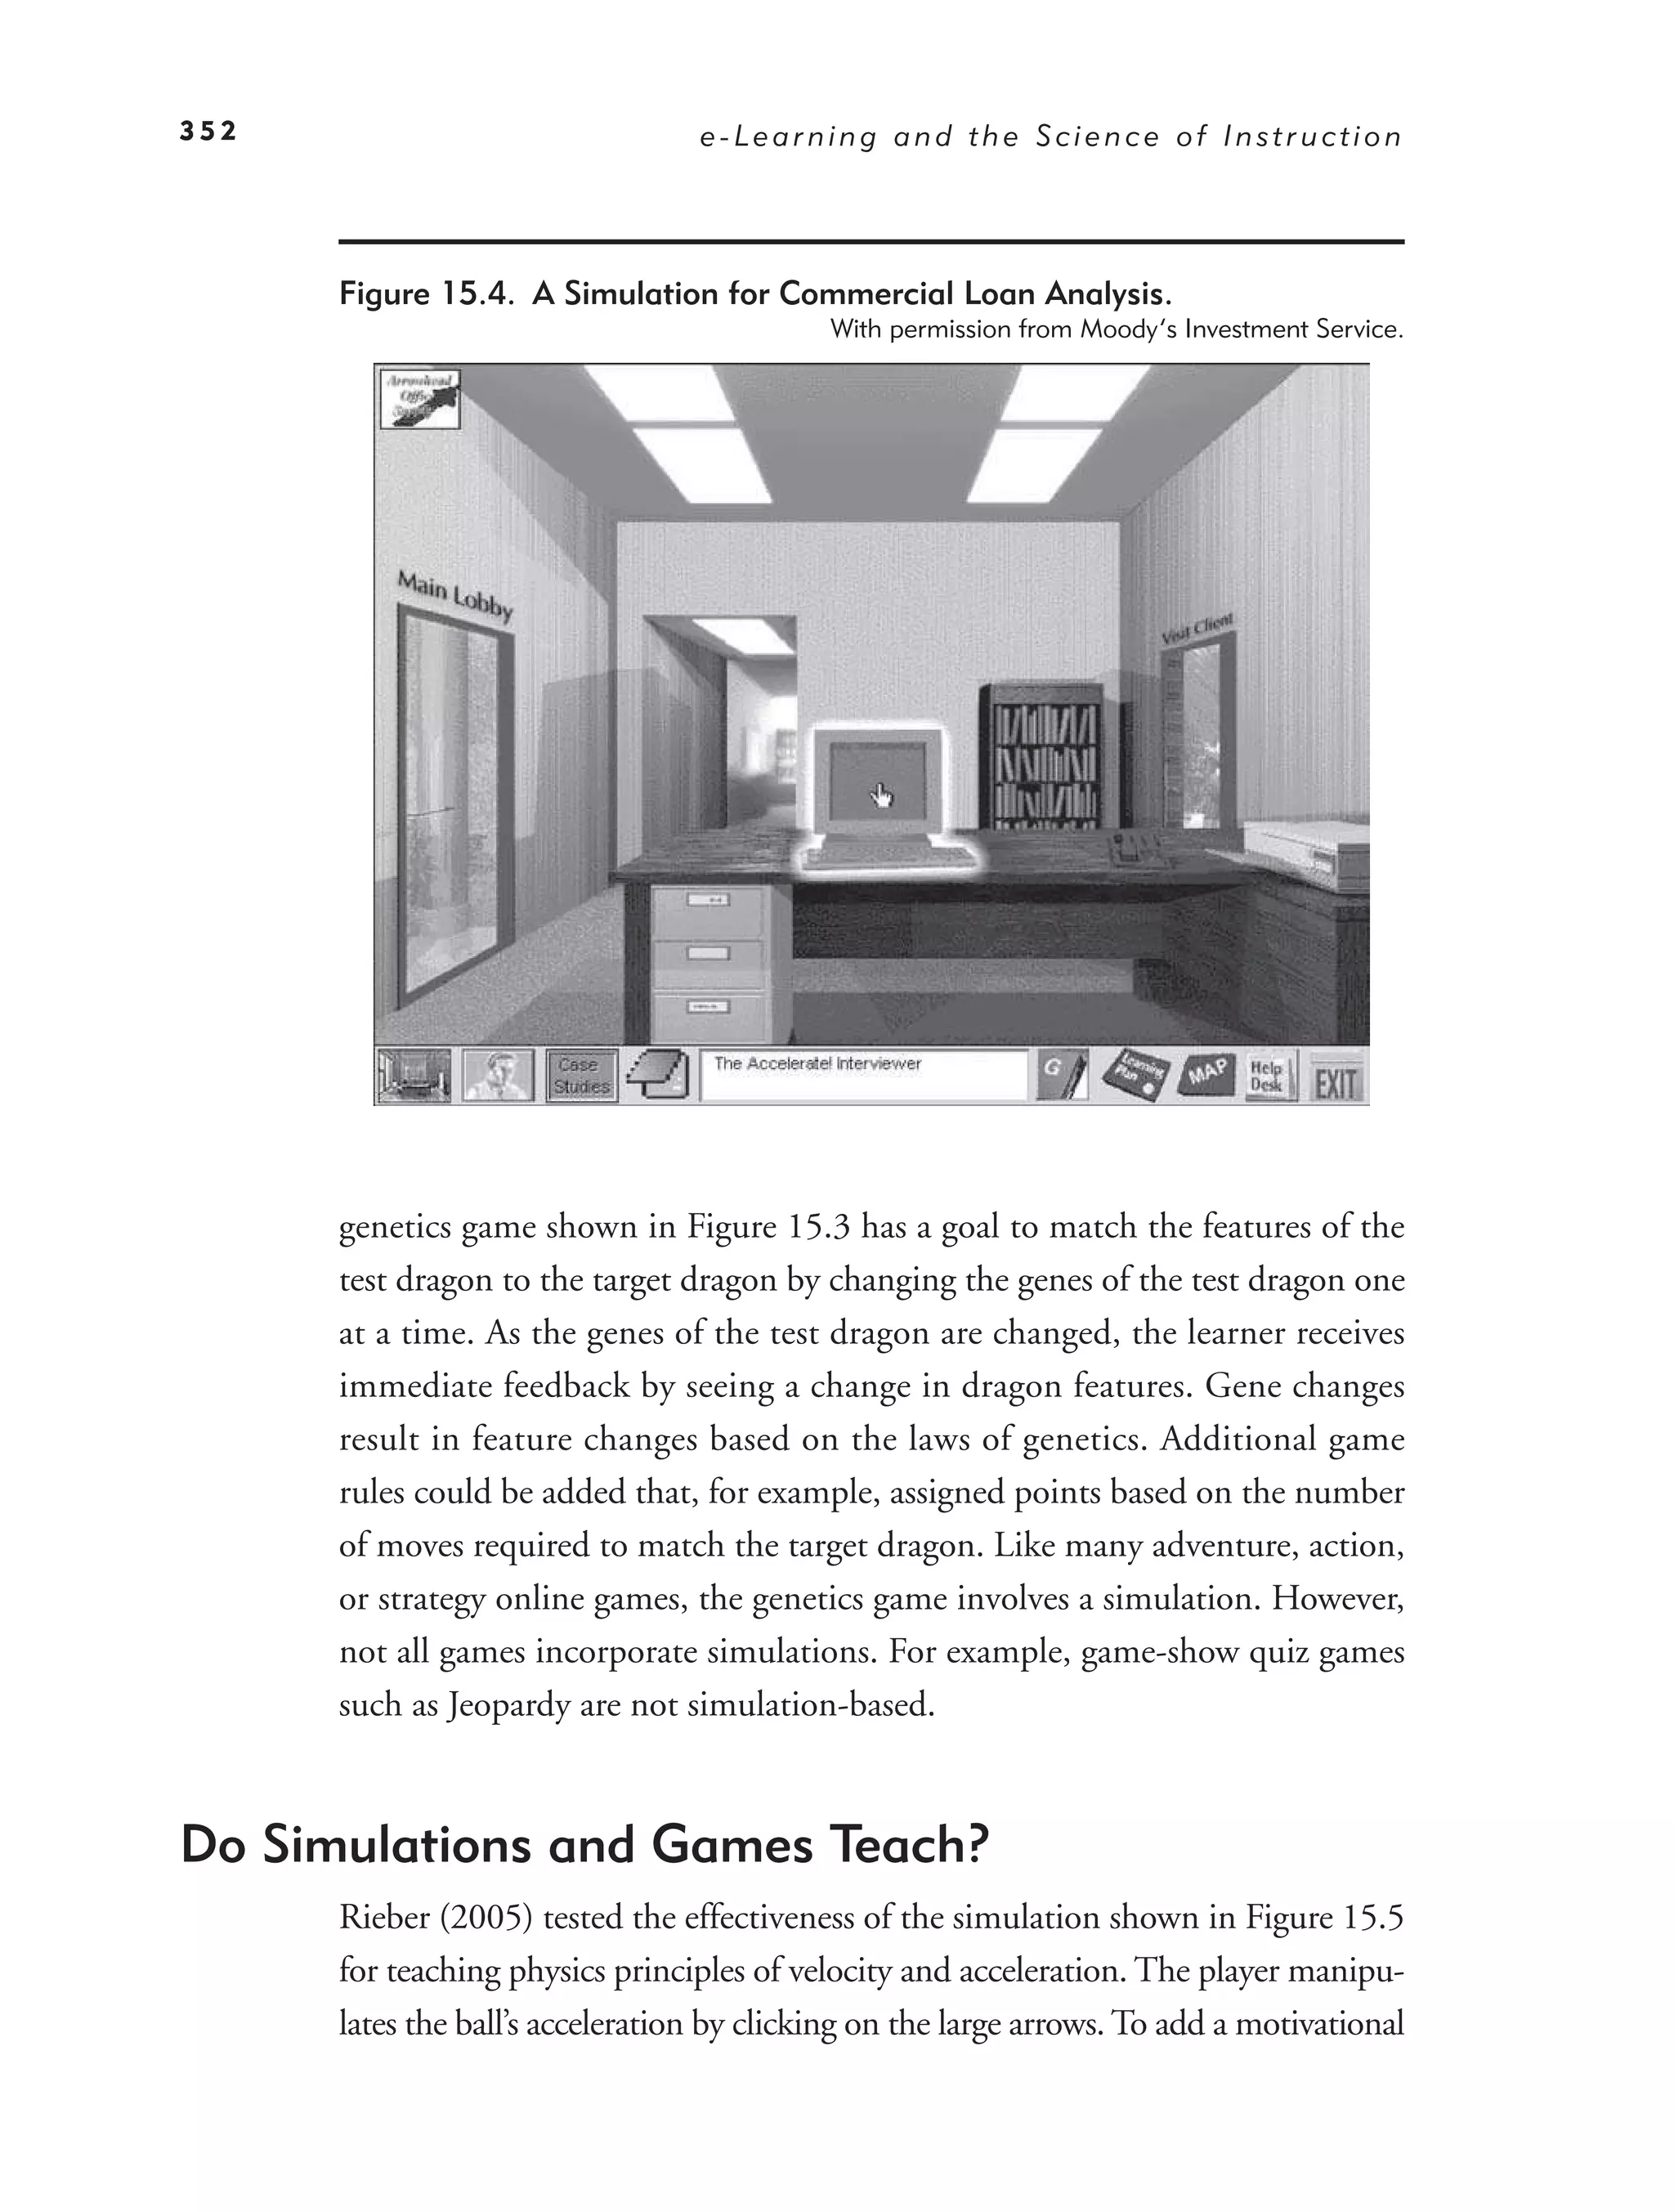
Do Simulations and Games Teach? 352
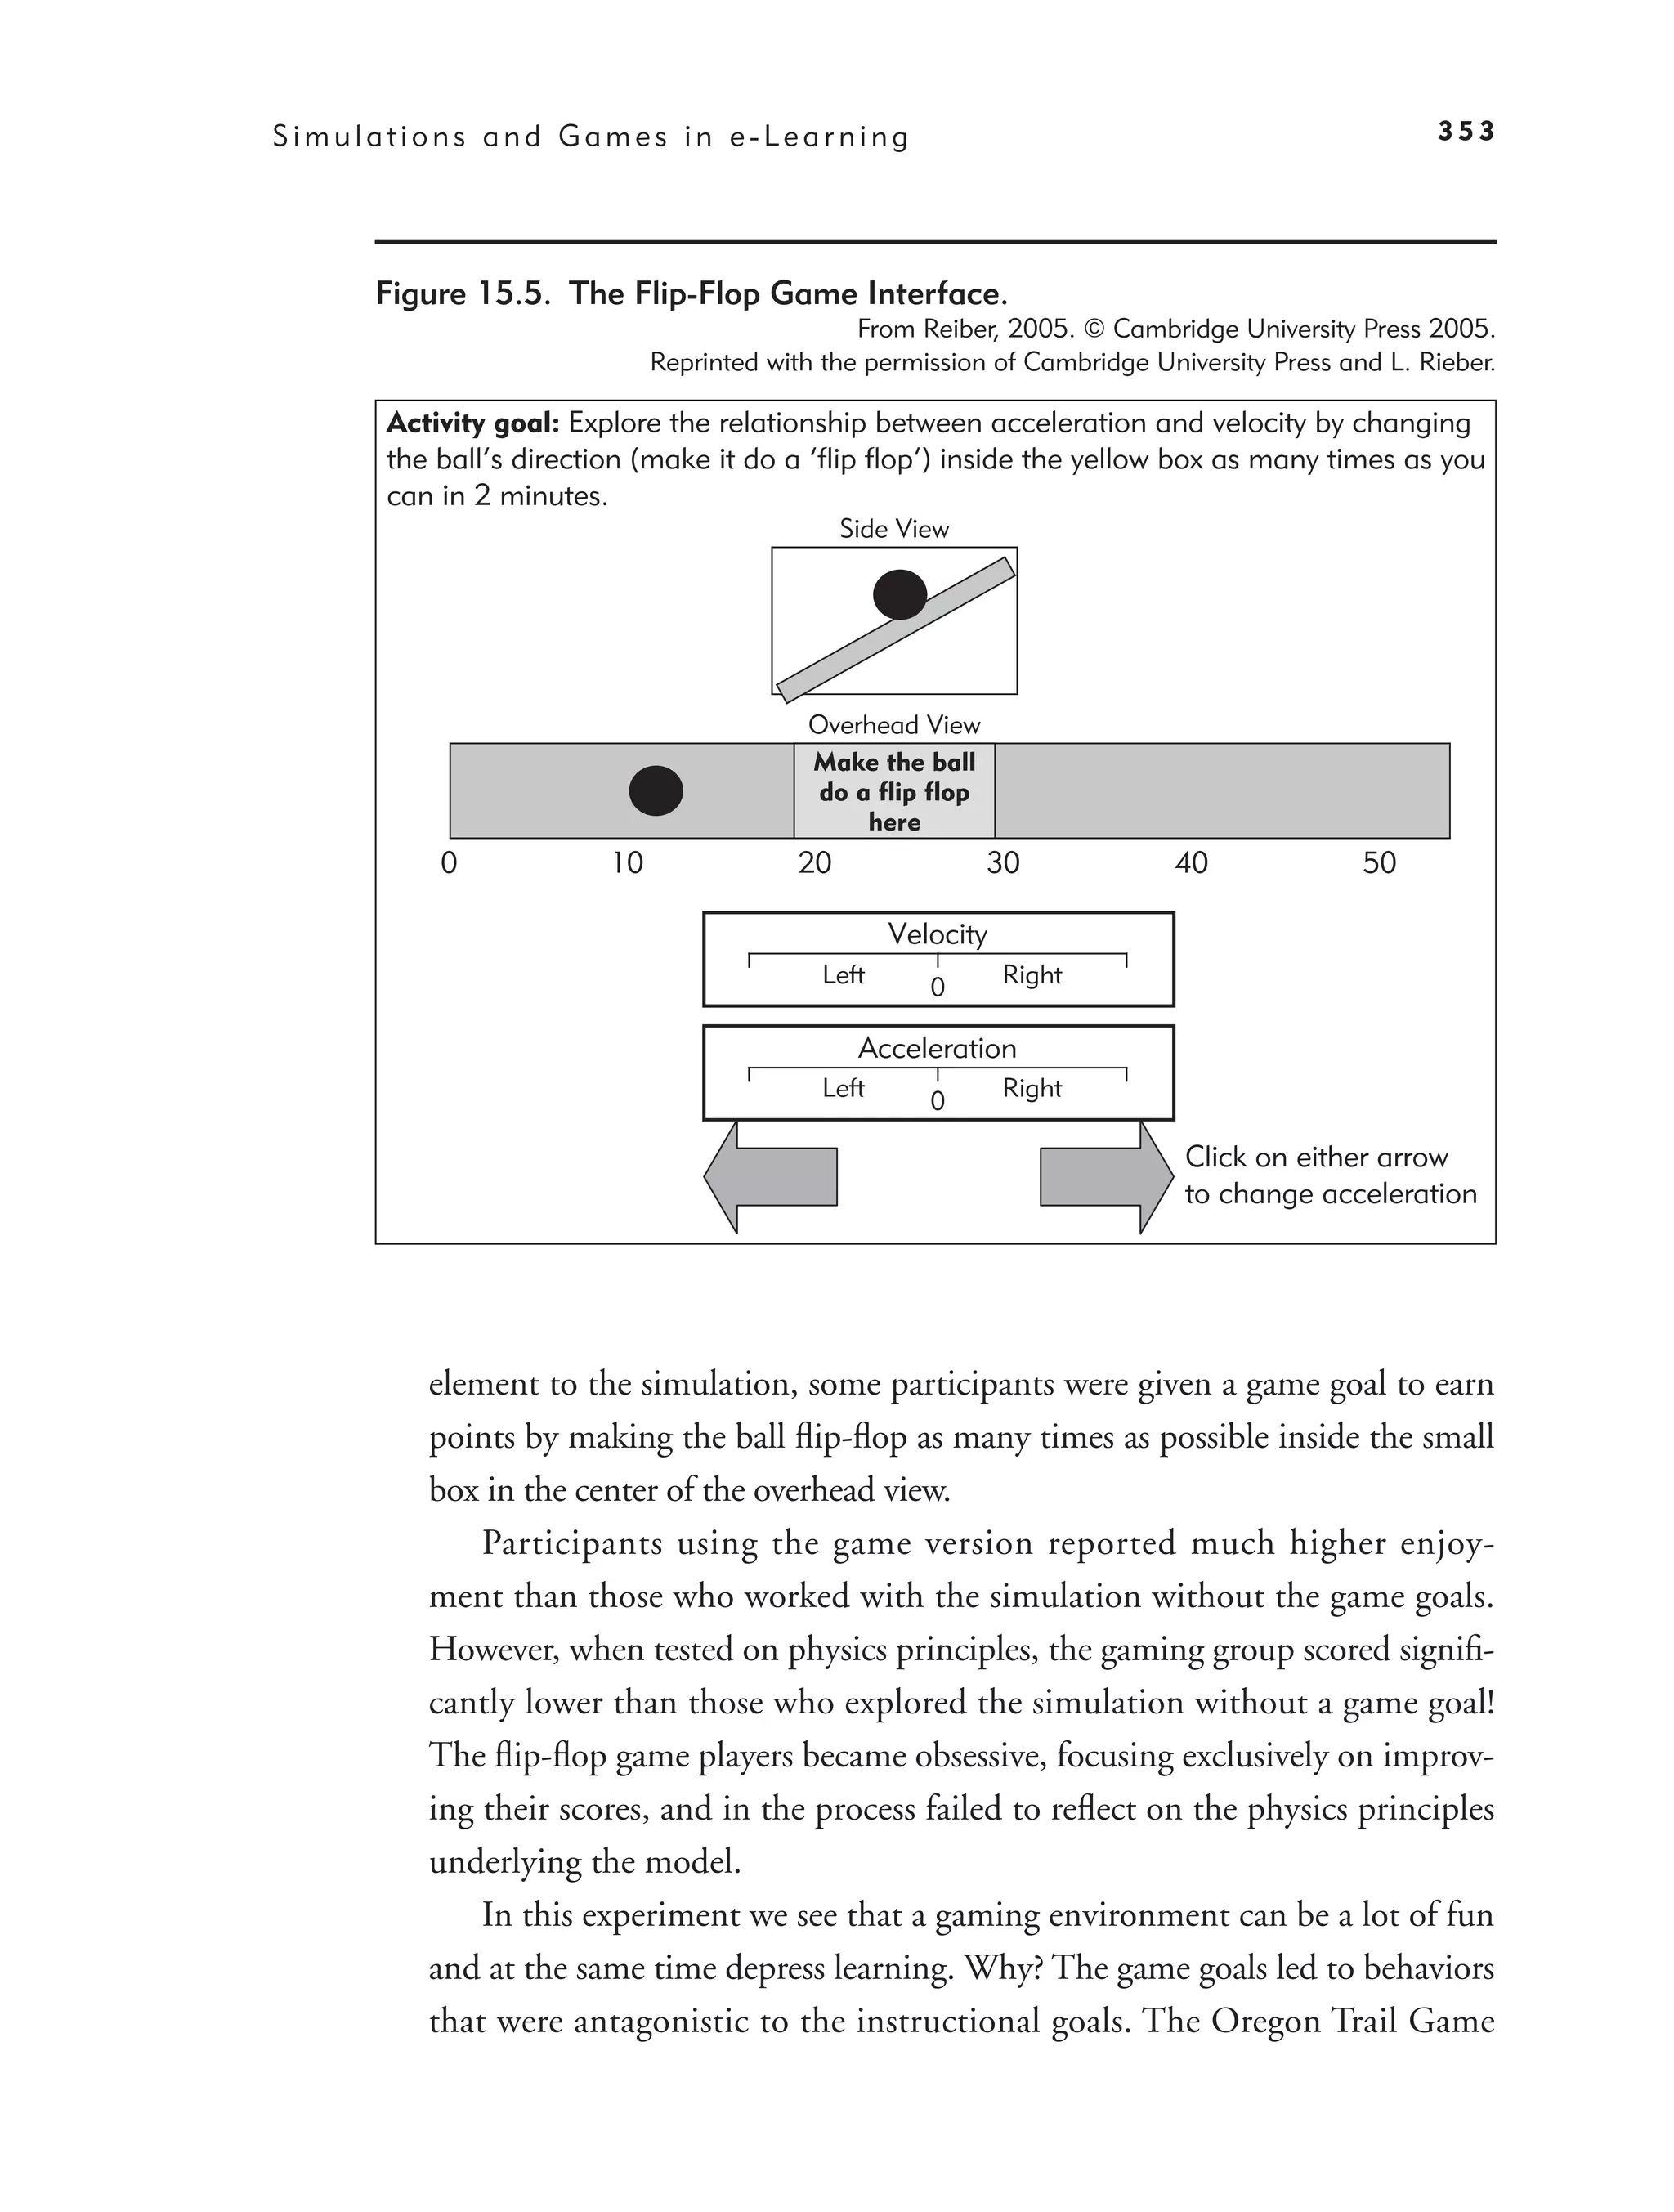
Balancing Motivation and Learning 355
Games and Simulations Principle 1: Match Game Types to Learning
Goals 357
Games and Simulations Principle 2: Make Learning Essential to
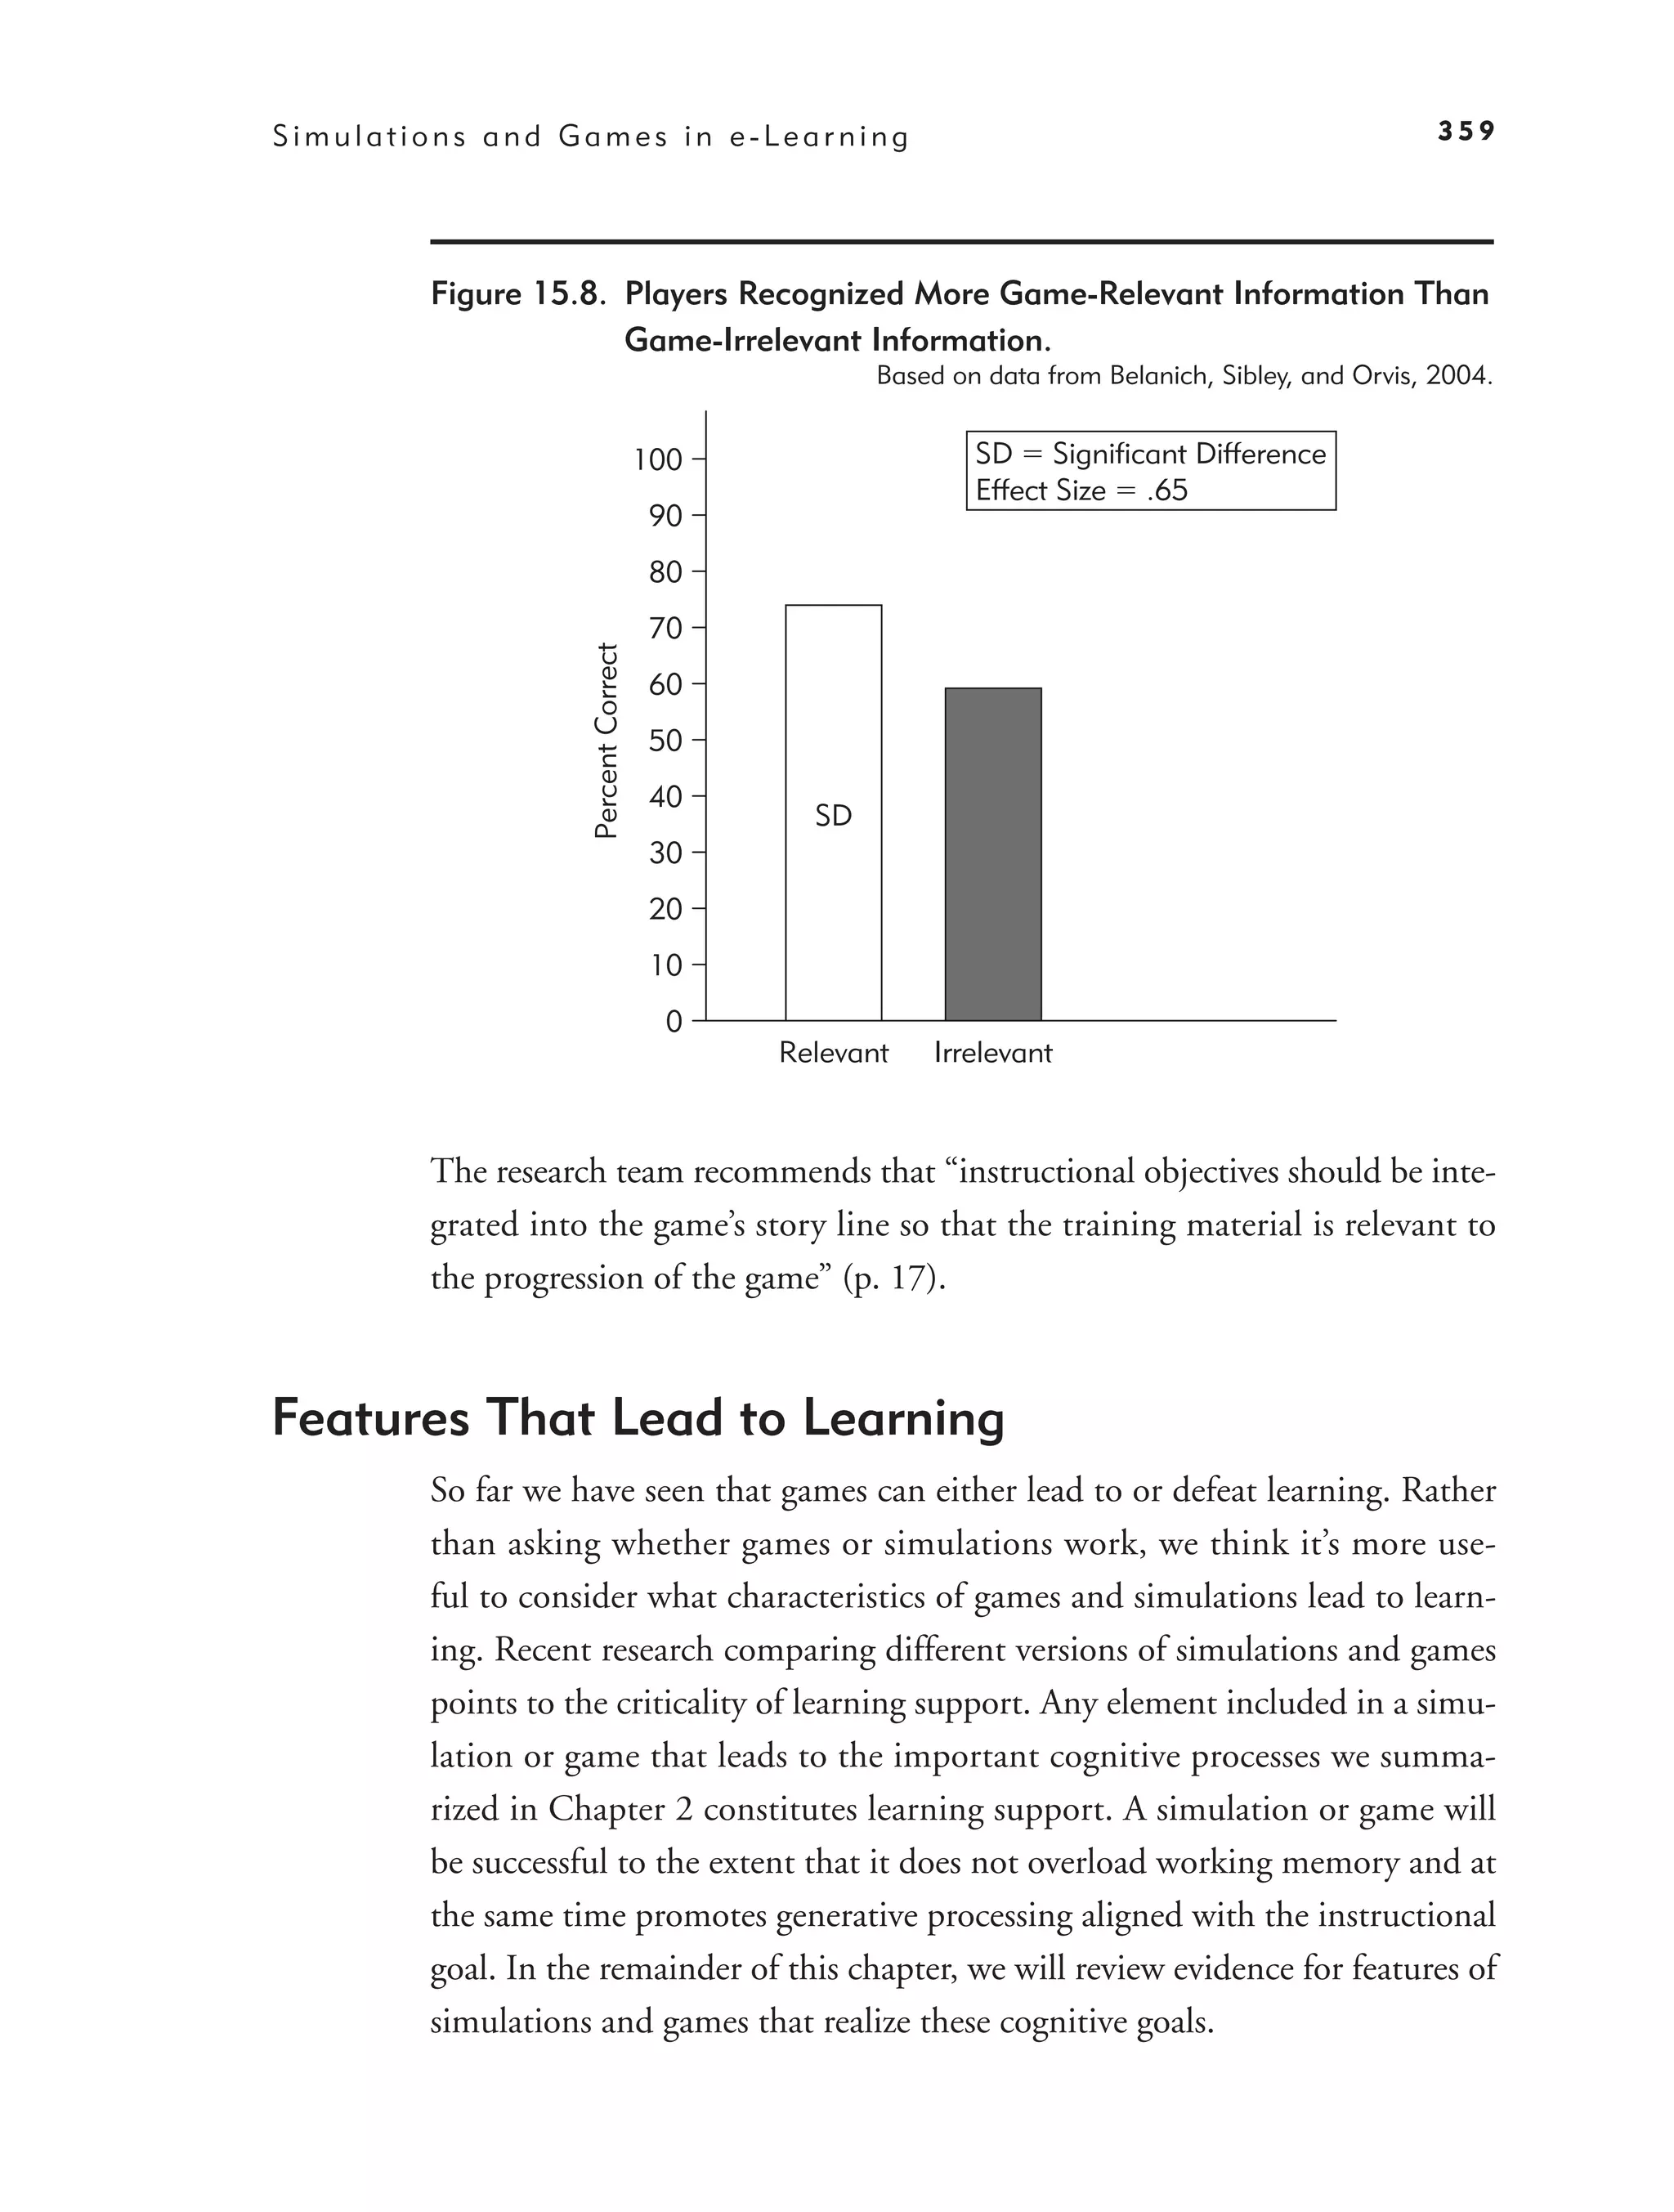
Progress 358
Features That Lead to Learning 359
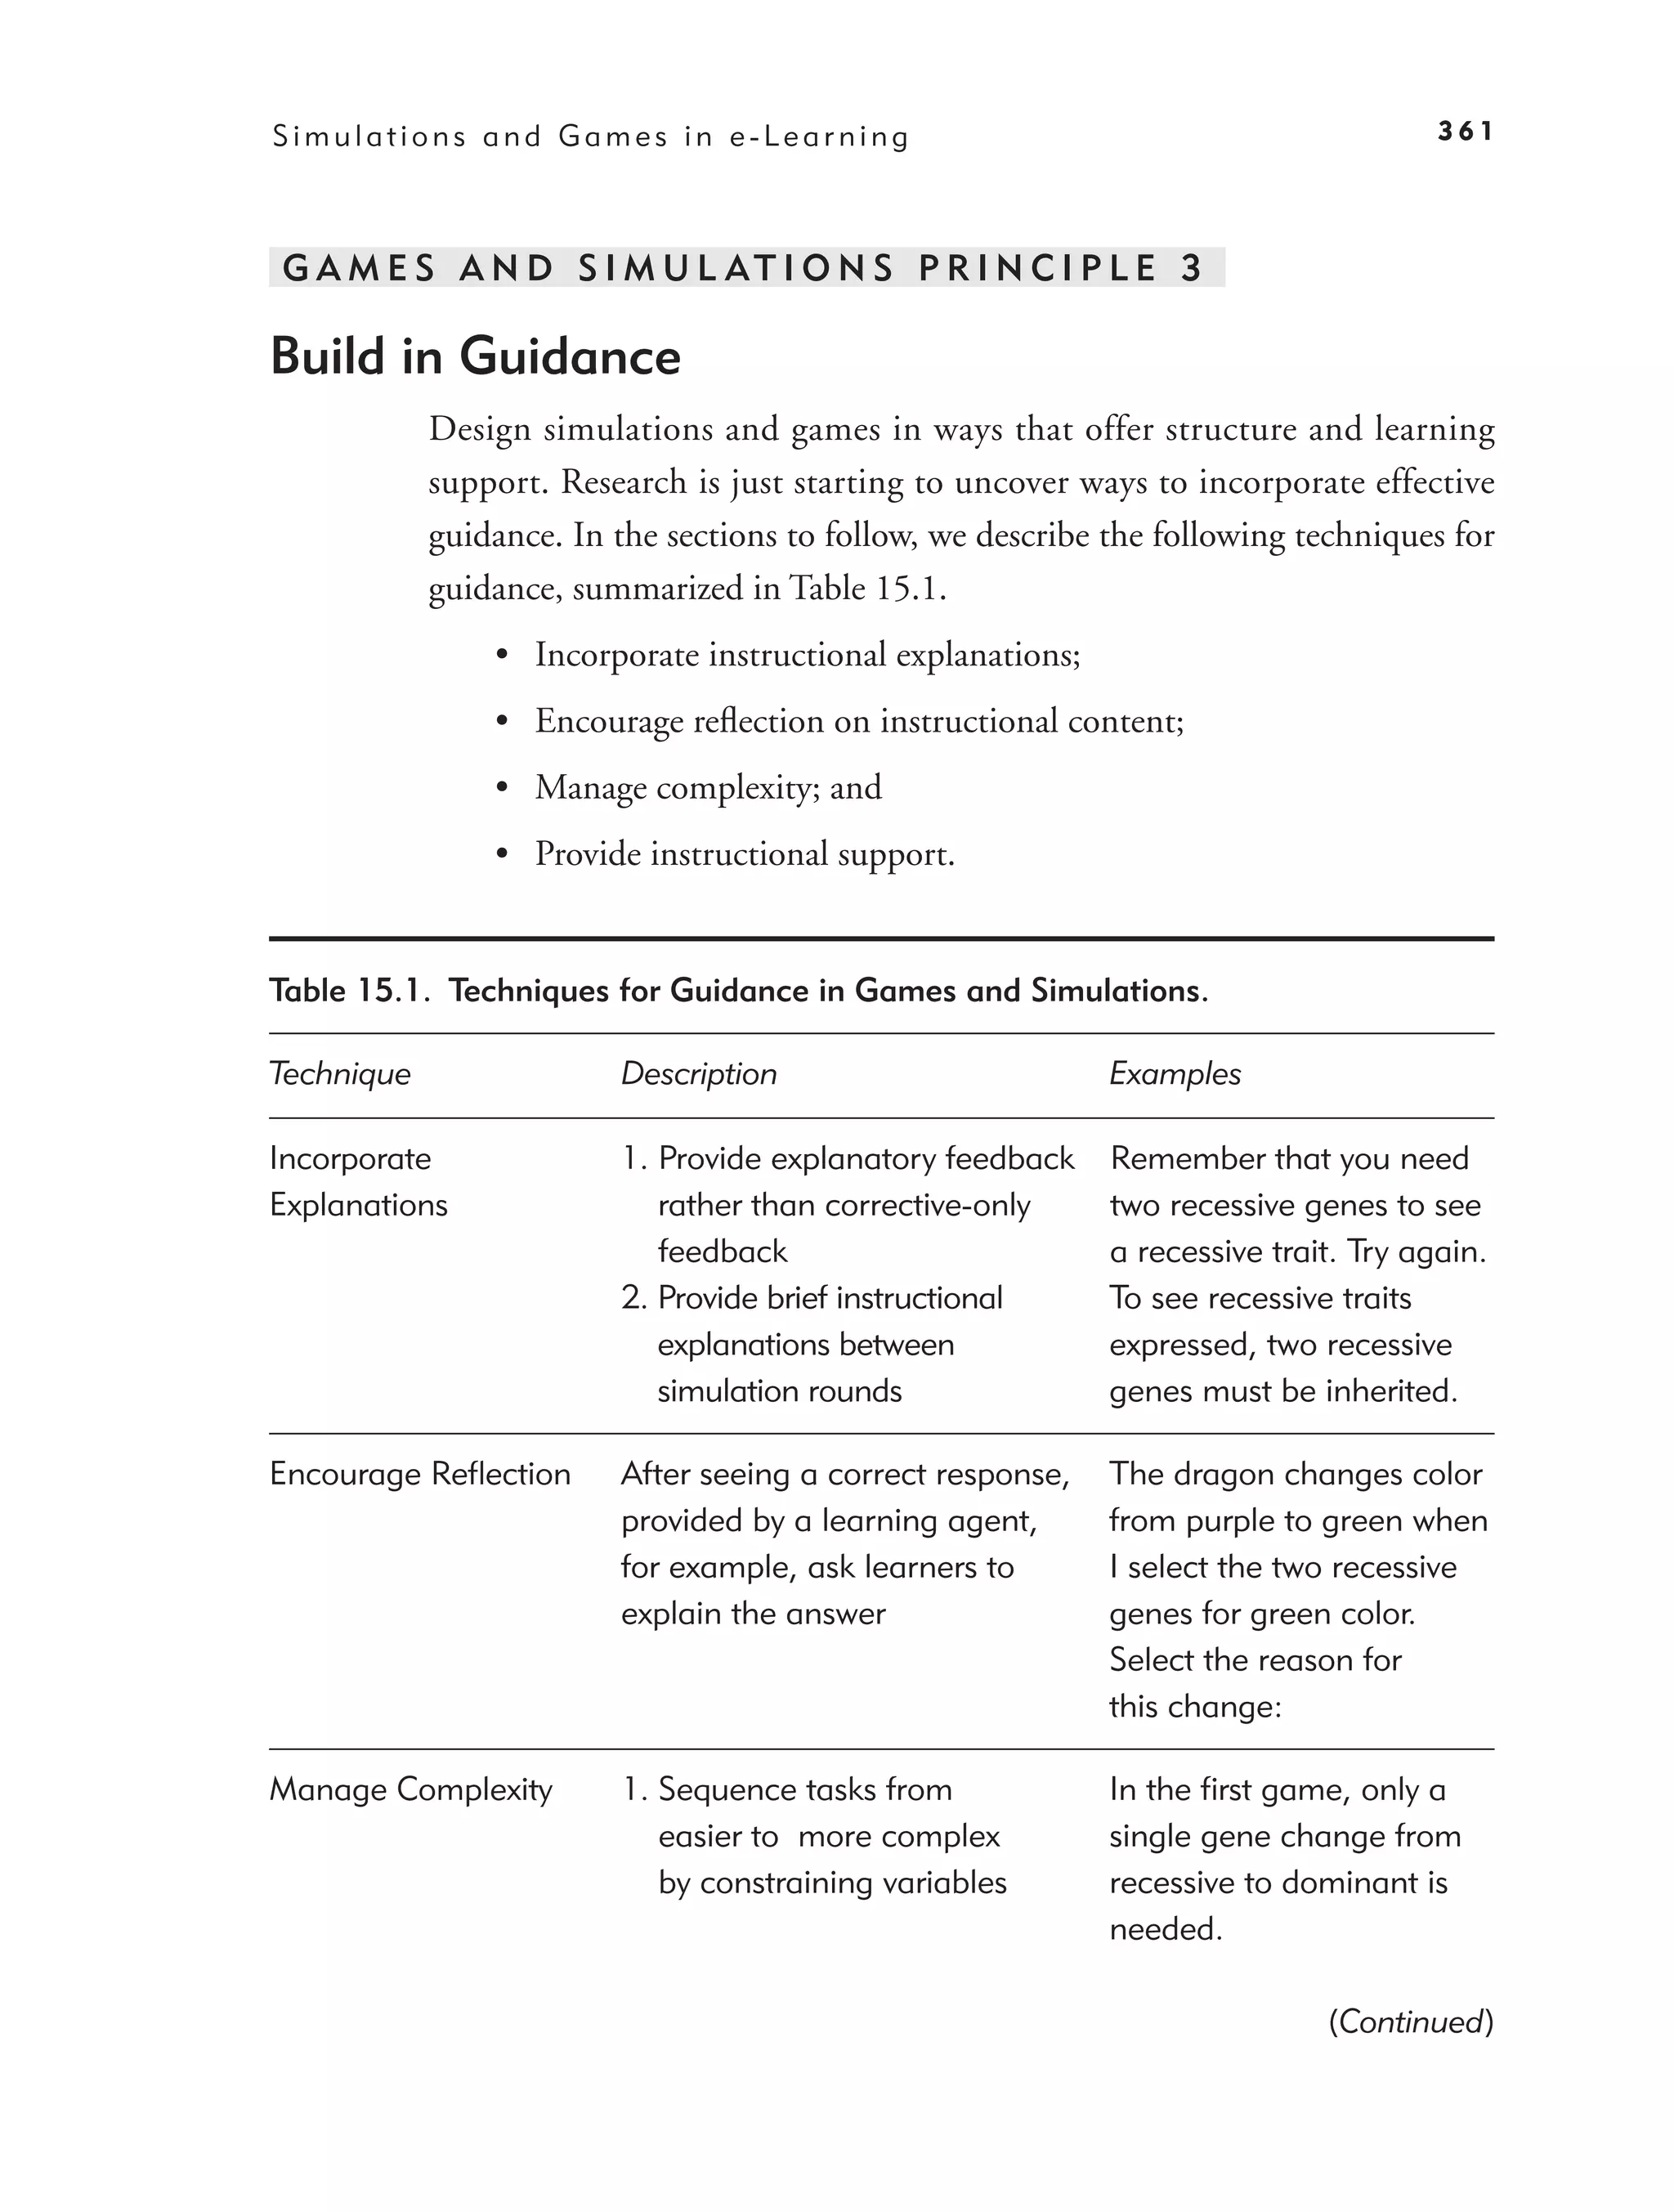
Games and Simulations Principle 3: Build in Guidance 361
Games and Simulations Principle 4: Promote Reflection on Correct
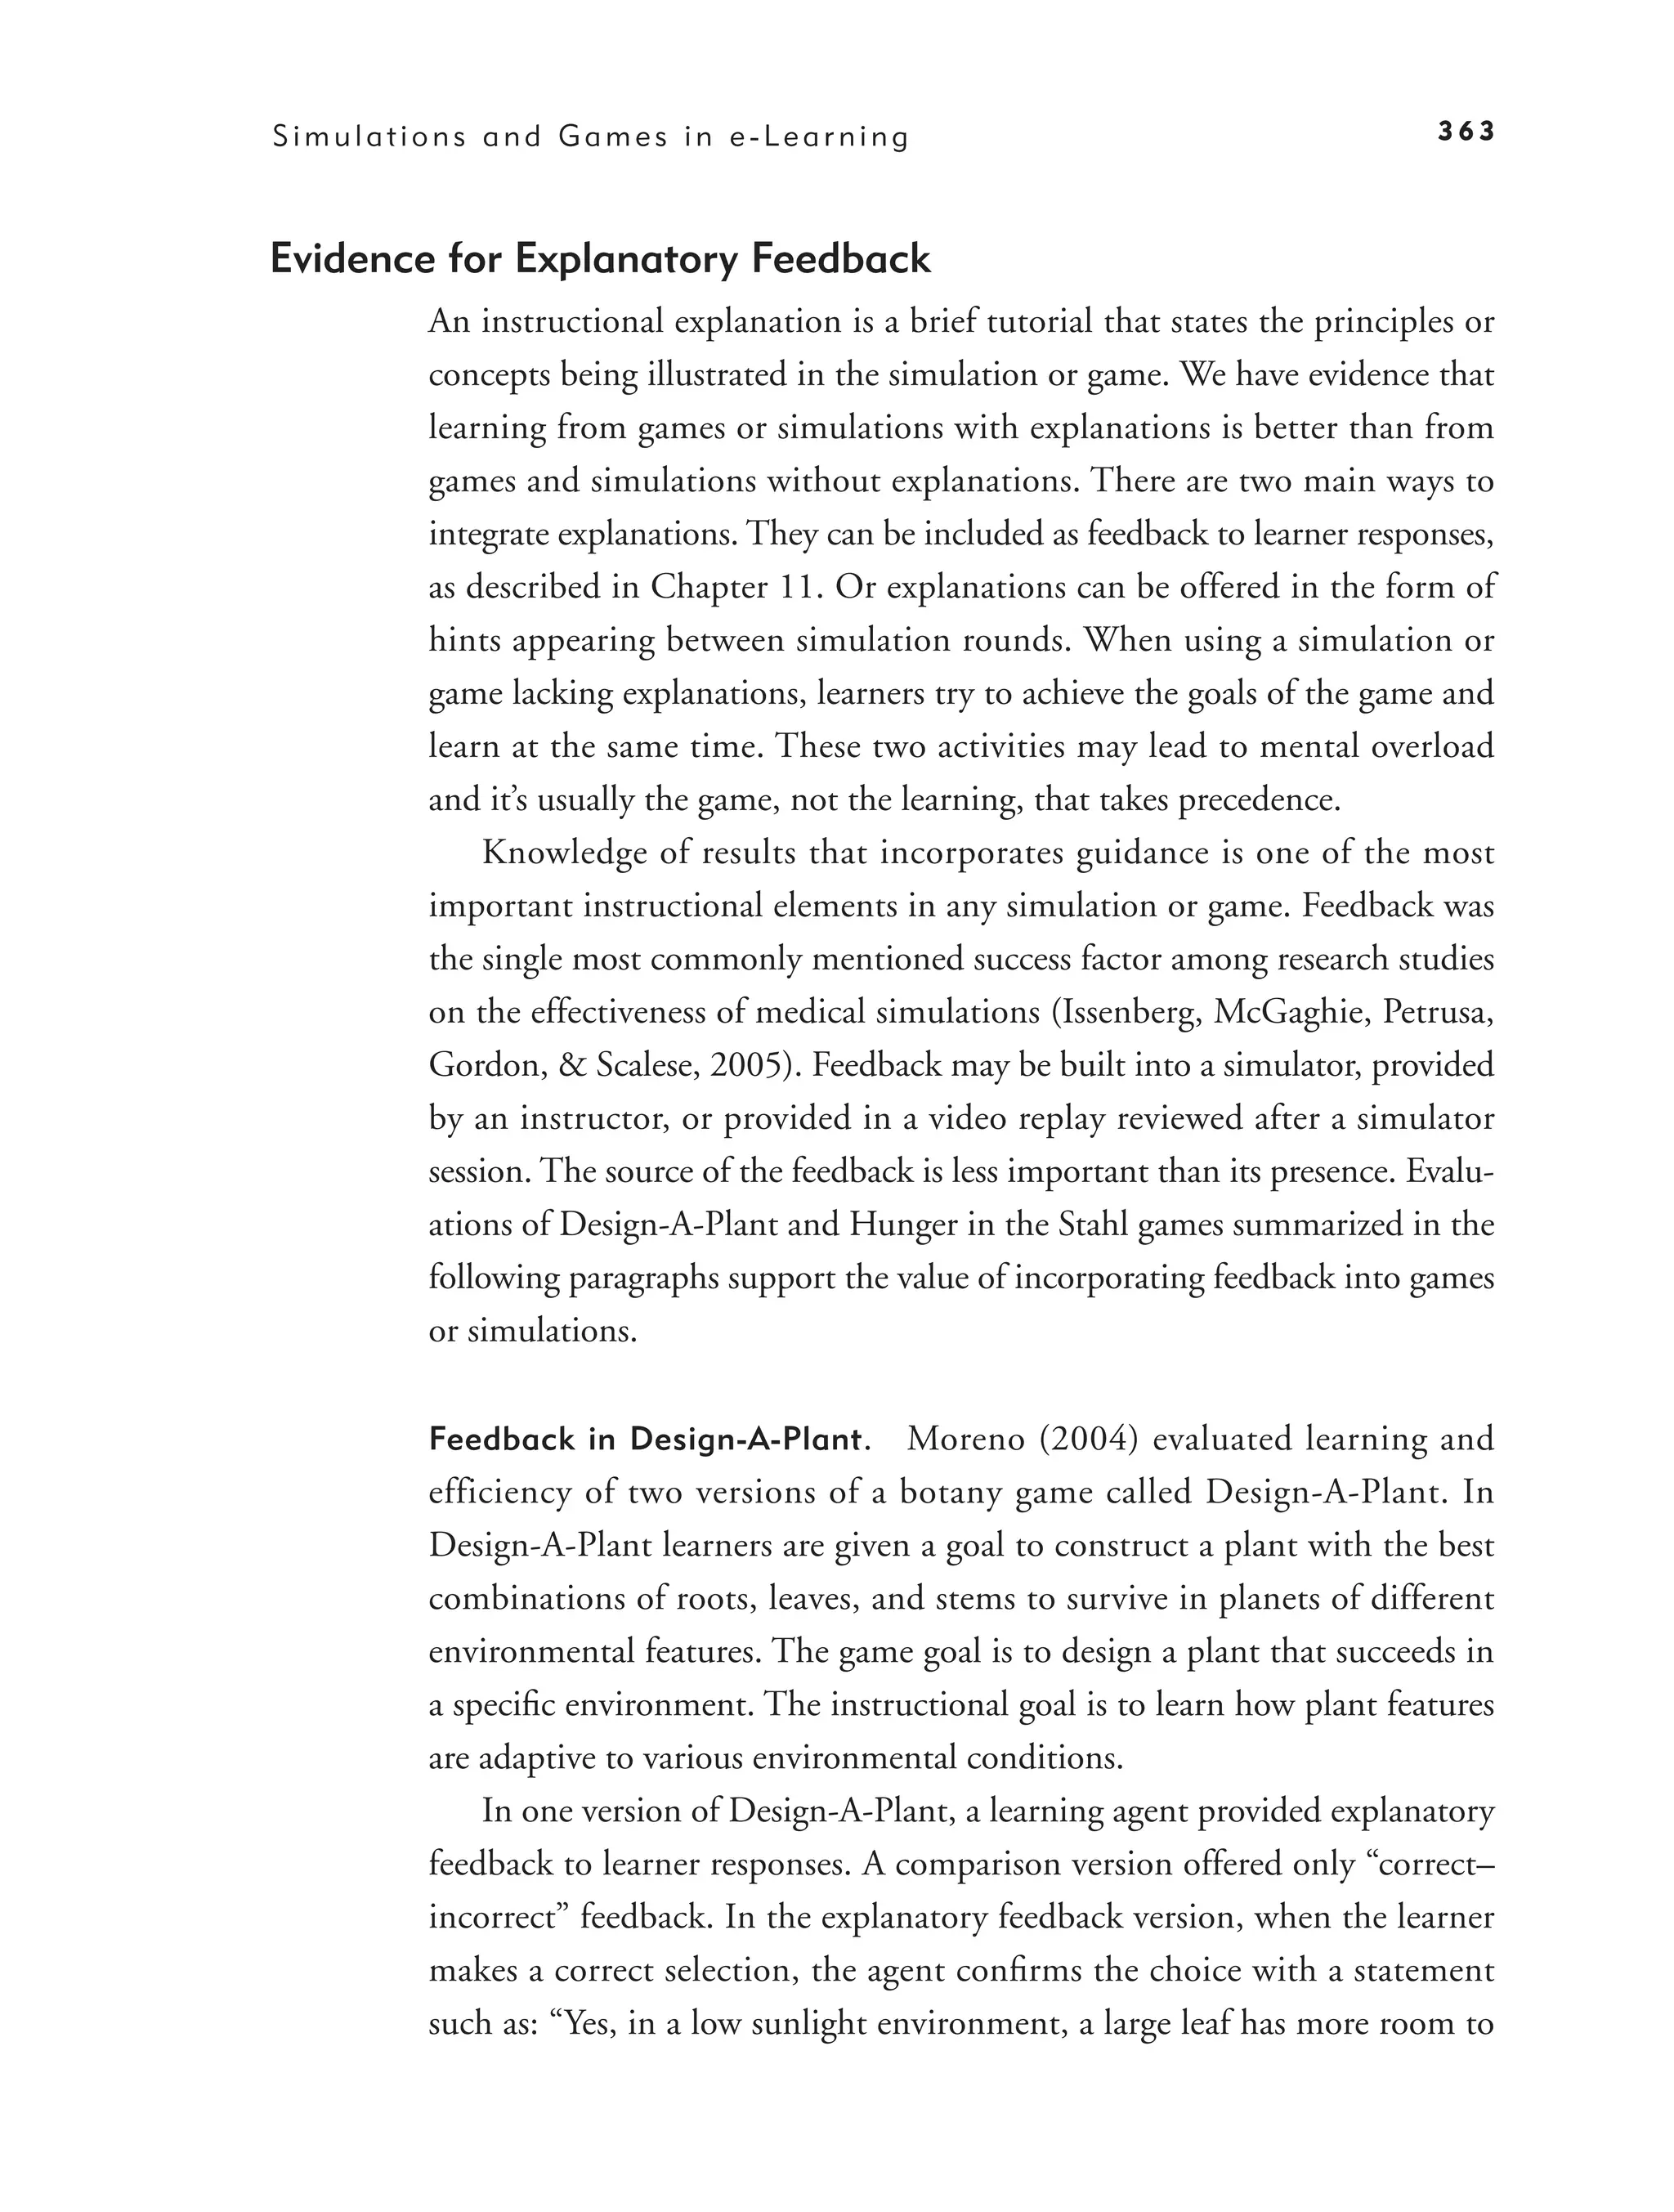
Answers 366
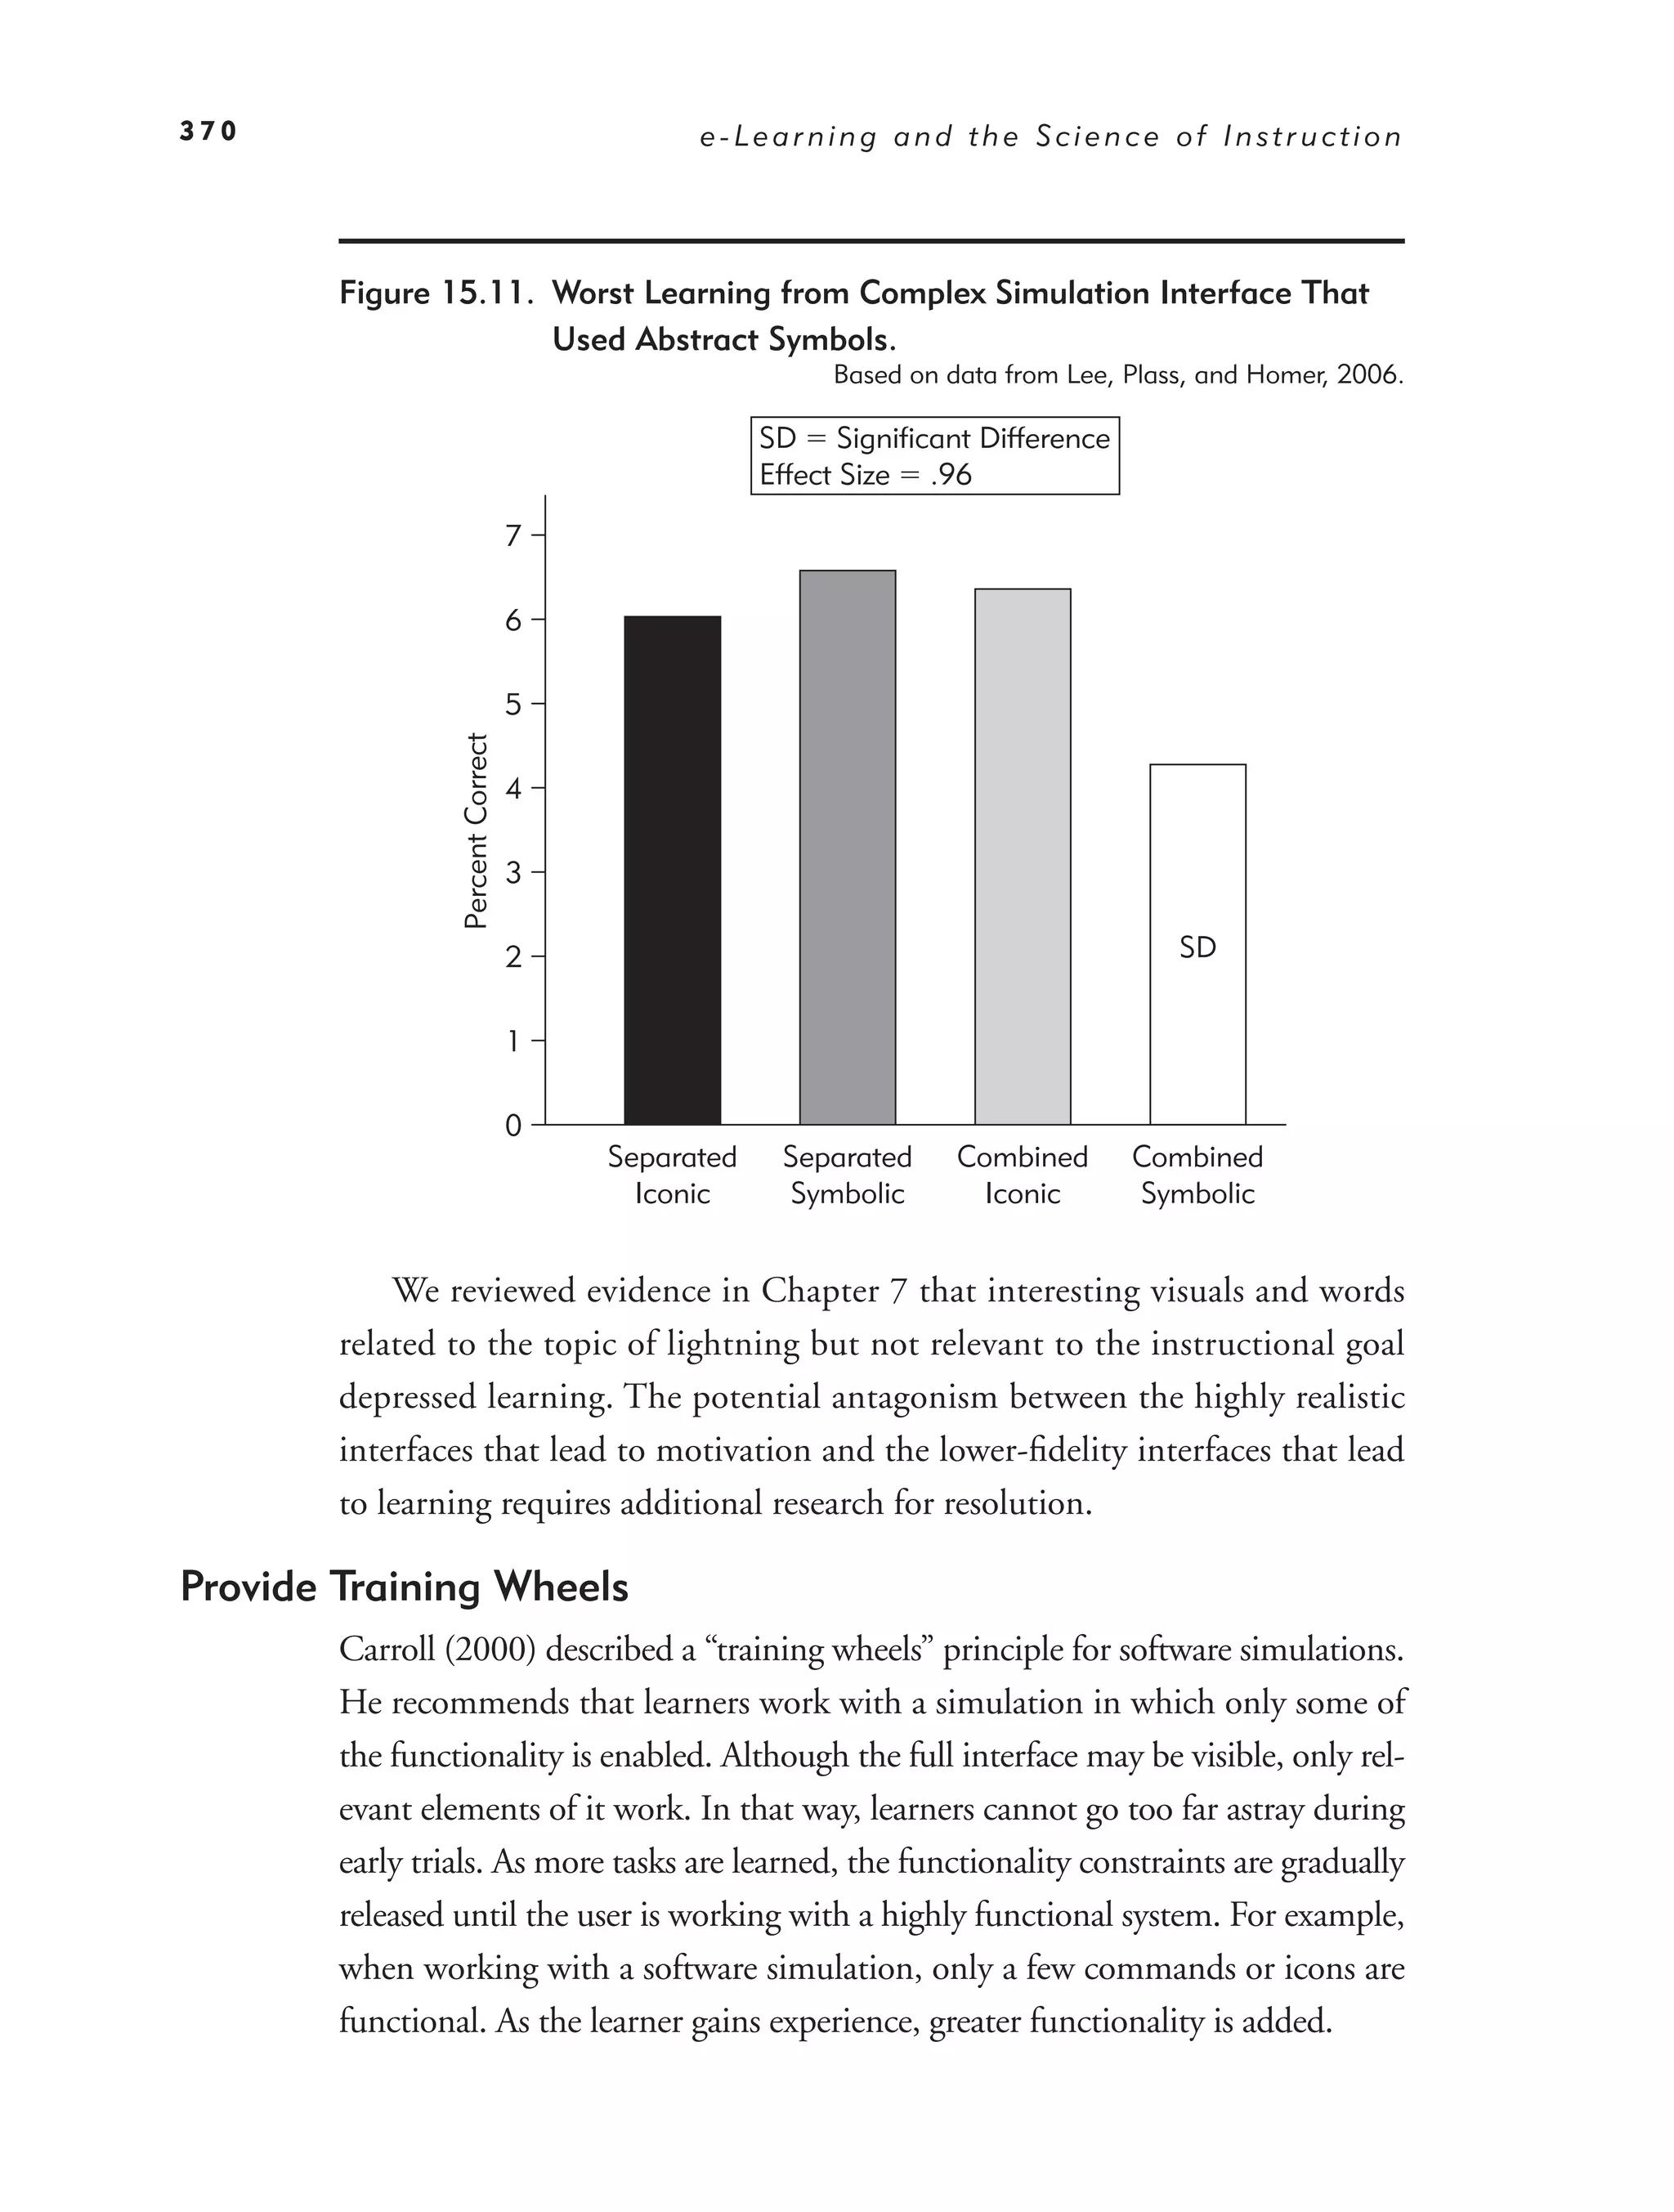
Games and Simulations Principle 5: Manage Complexity 367
What We Don’t Know About Games and Simulations 374
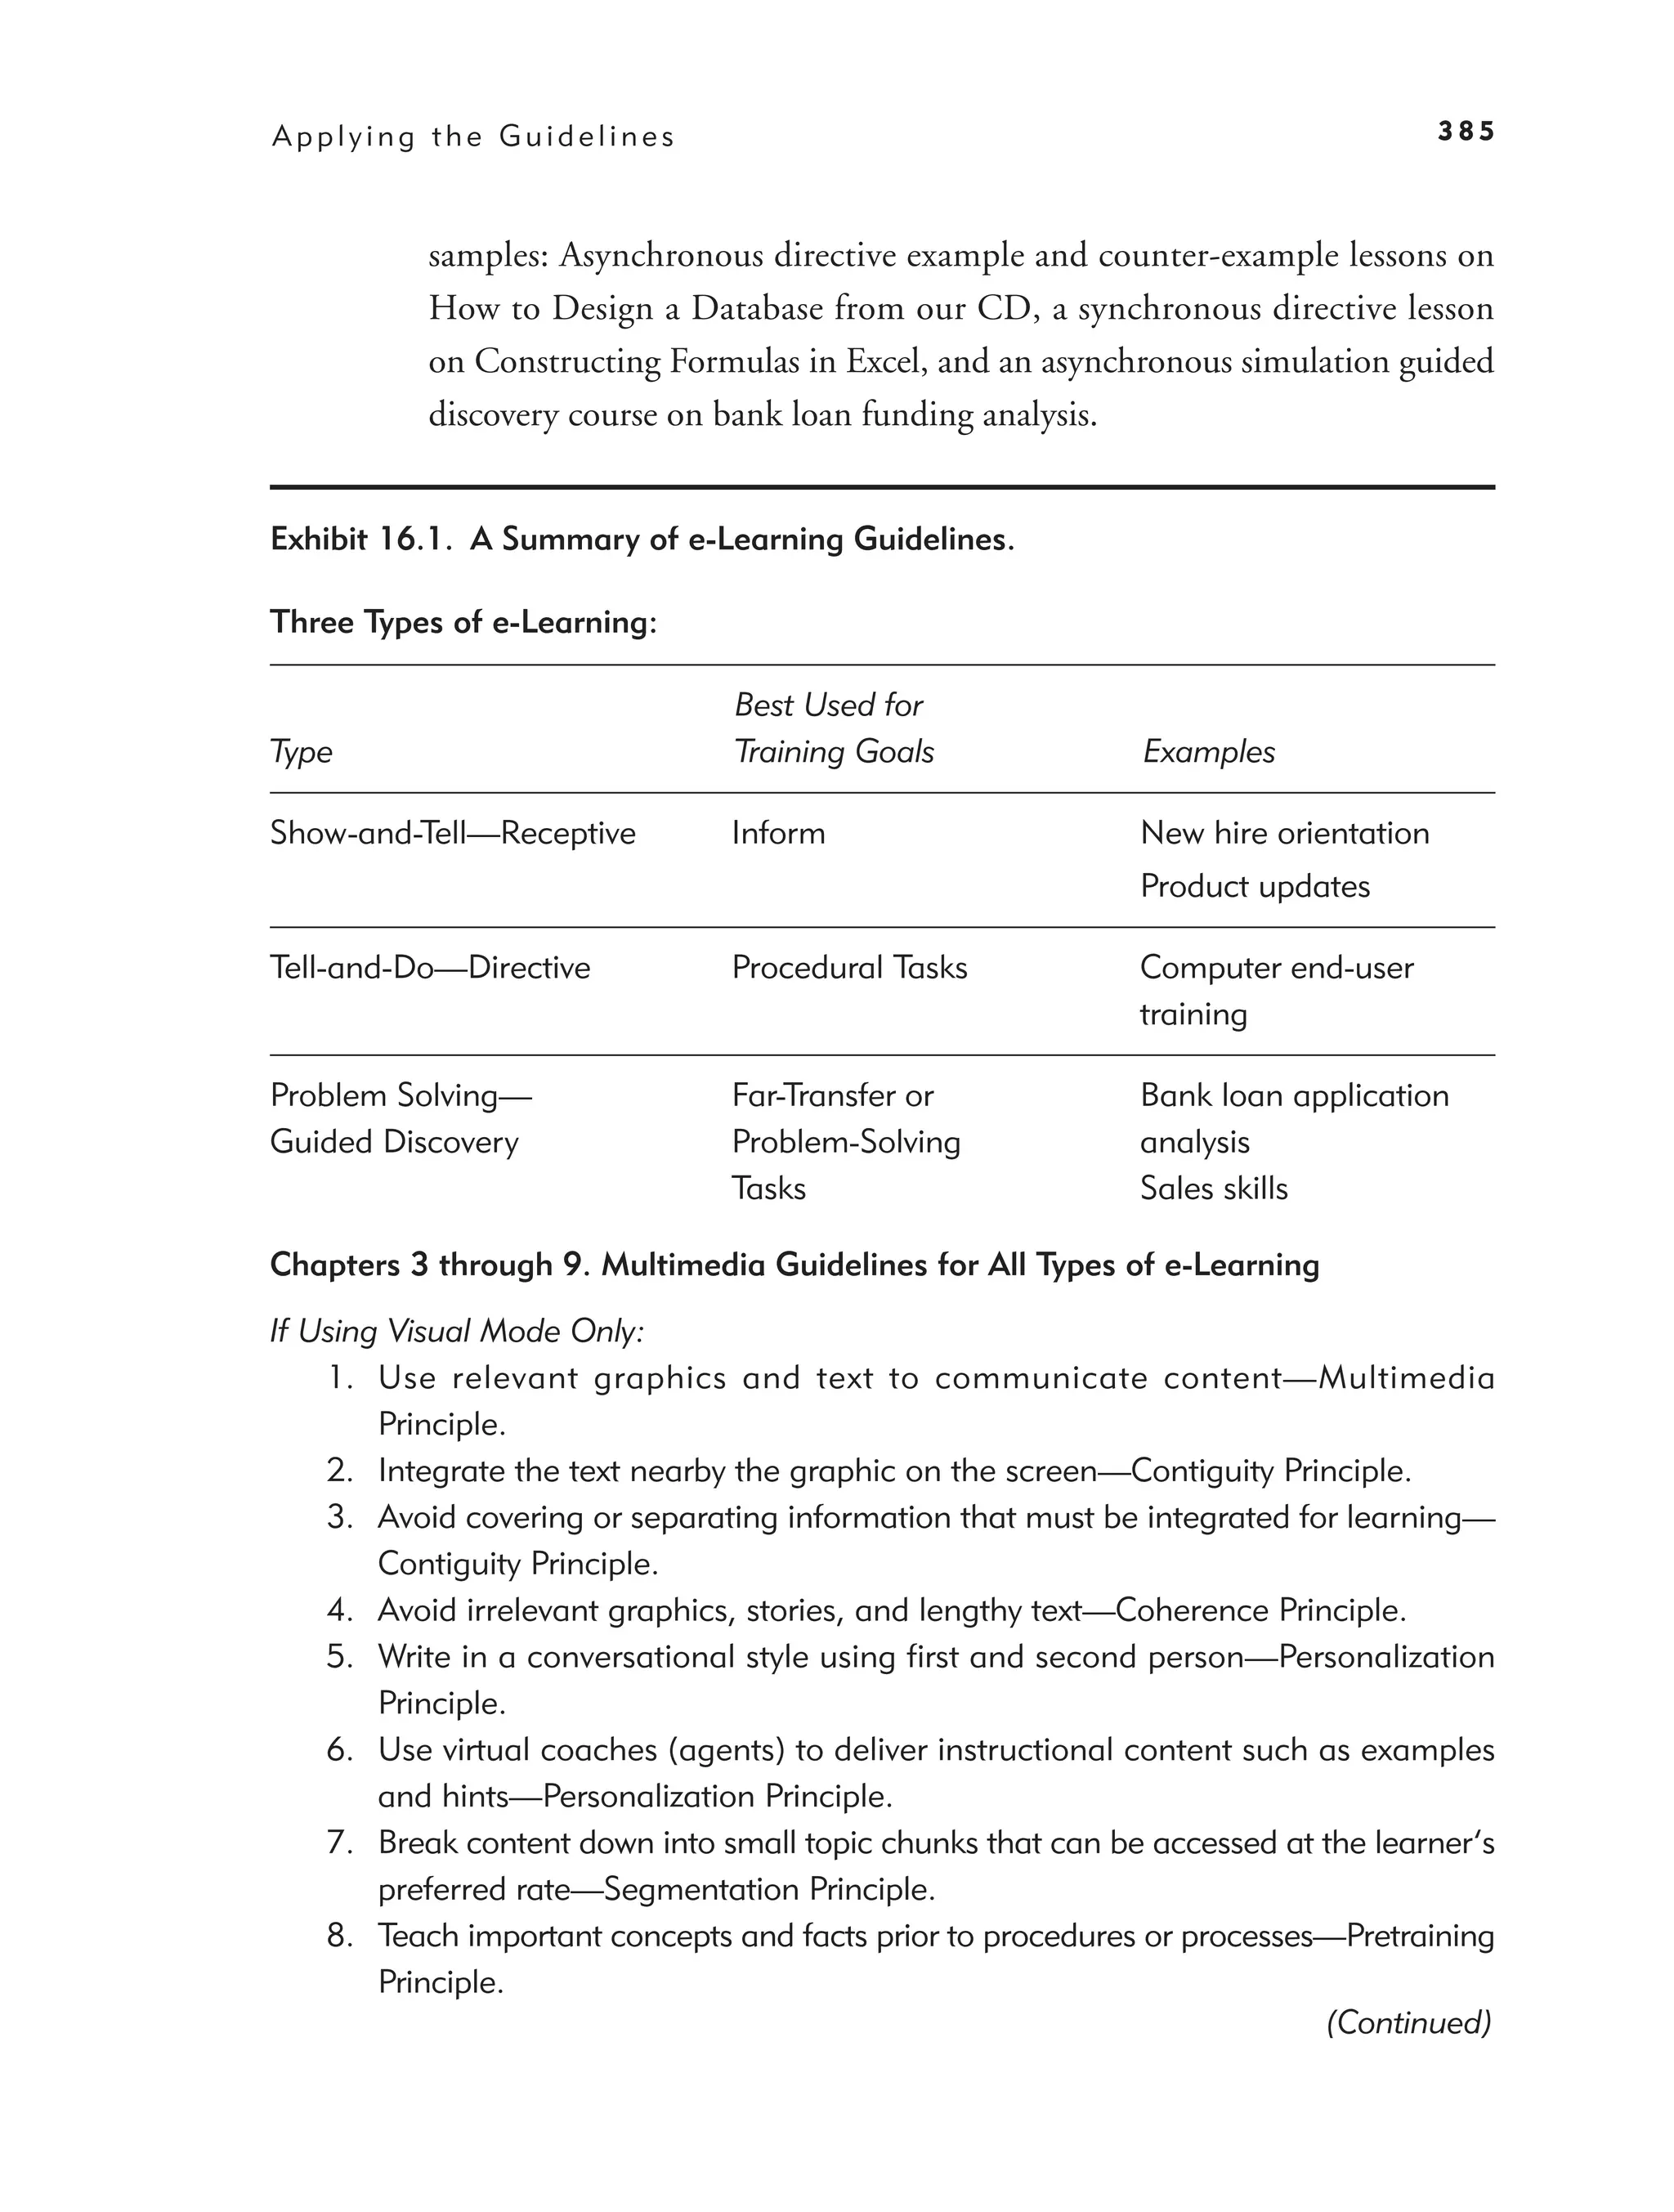
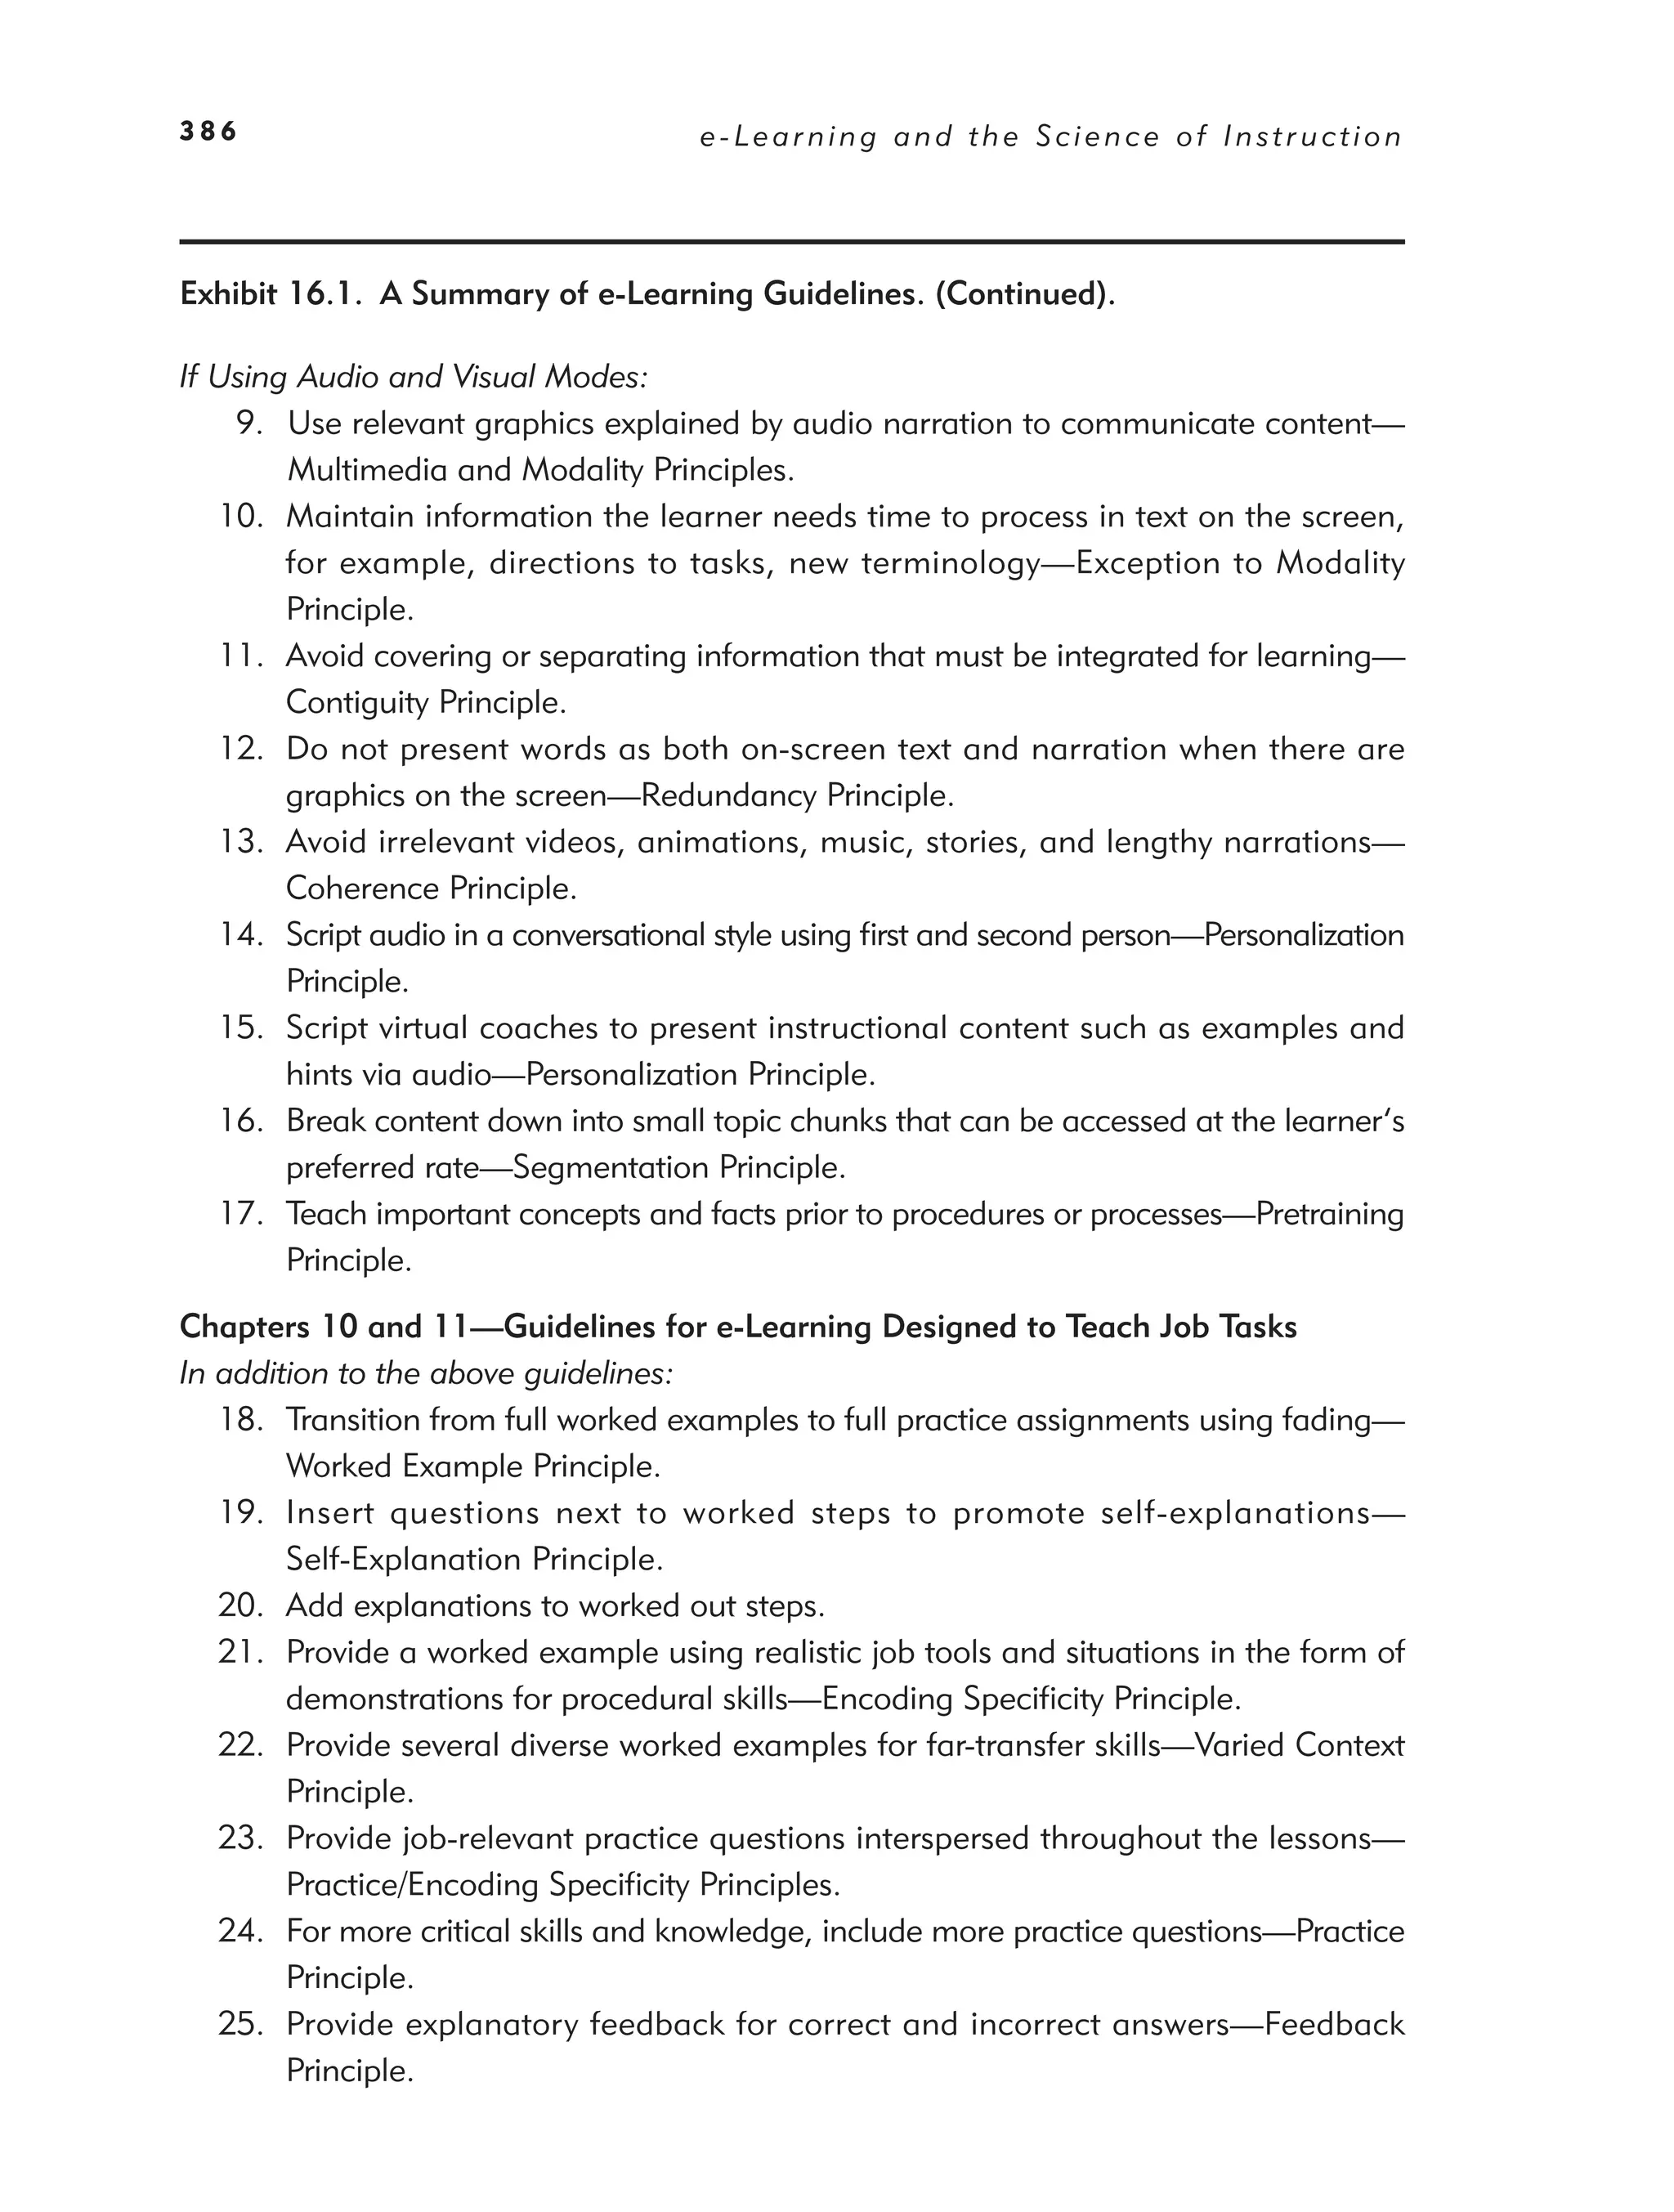
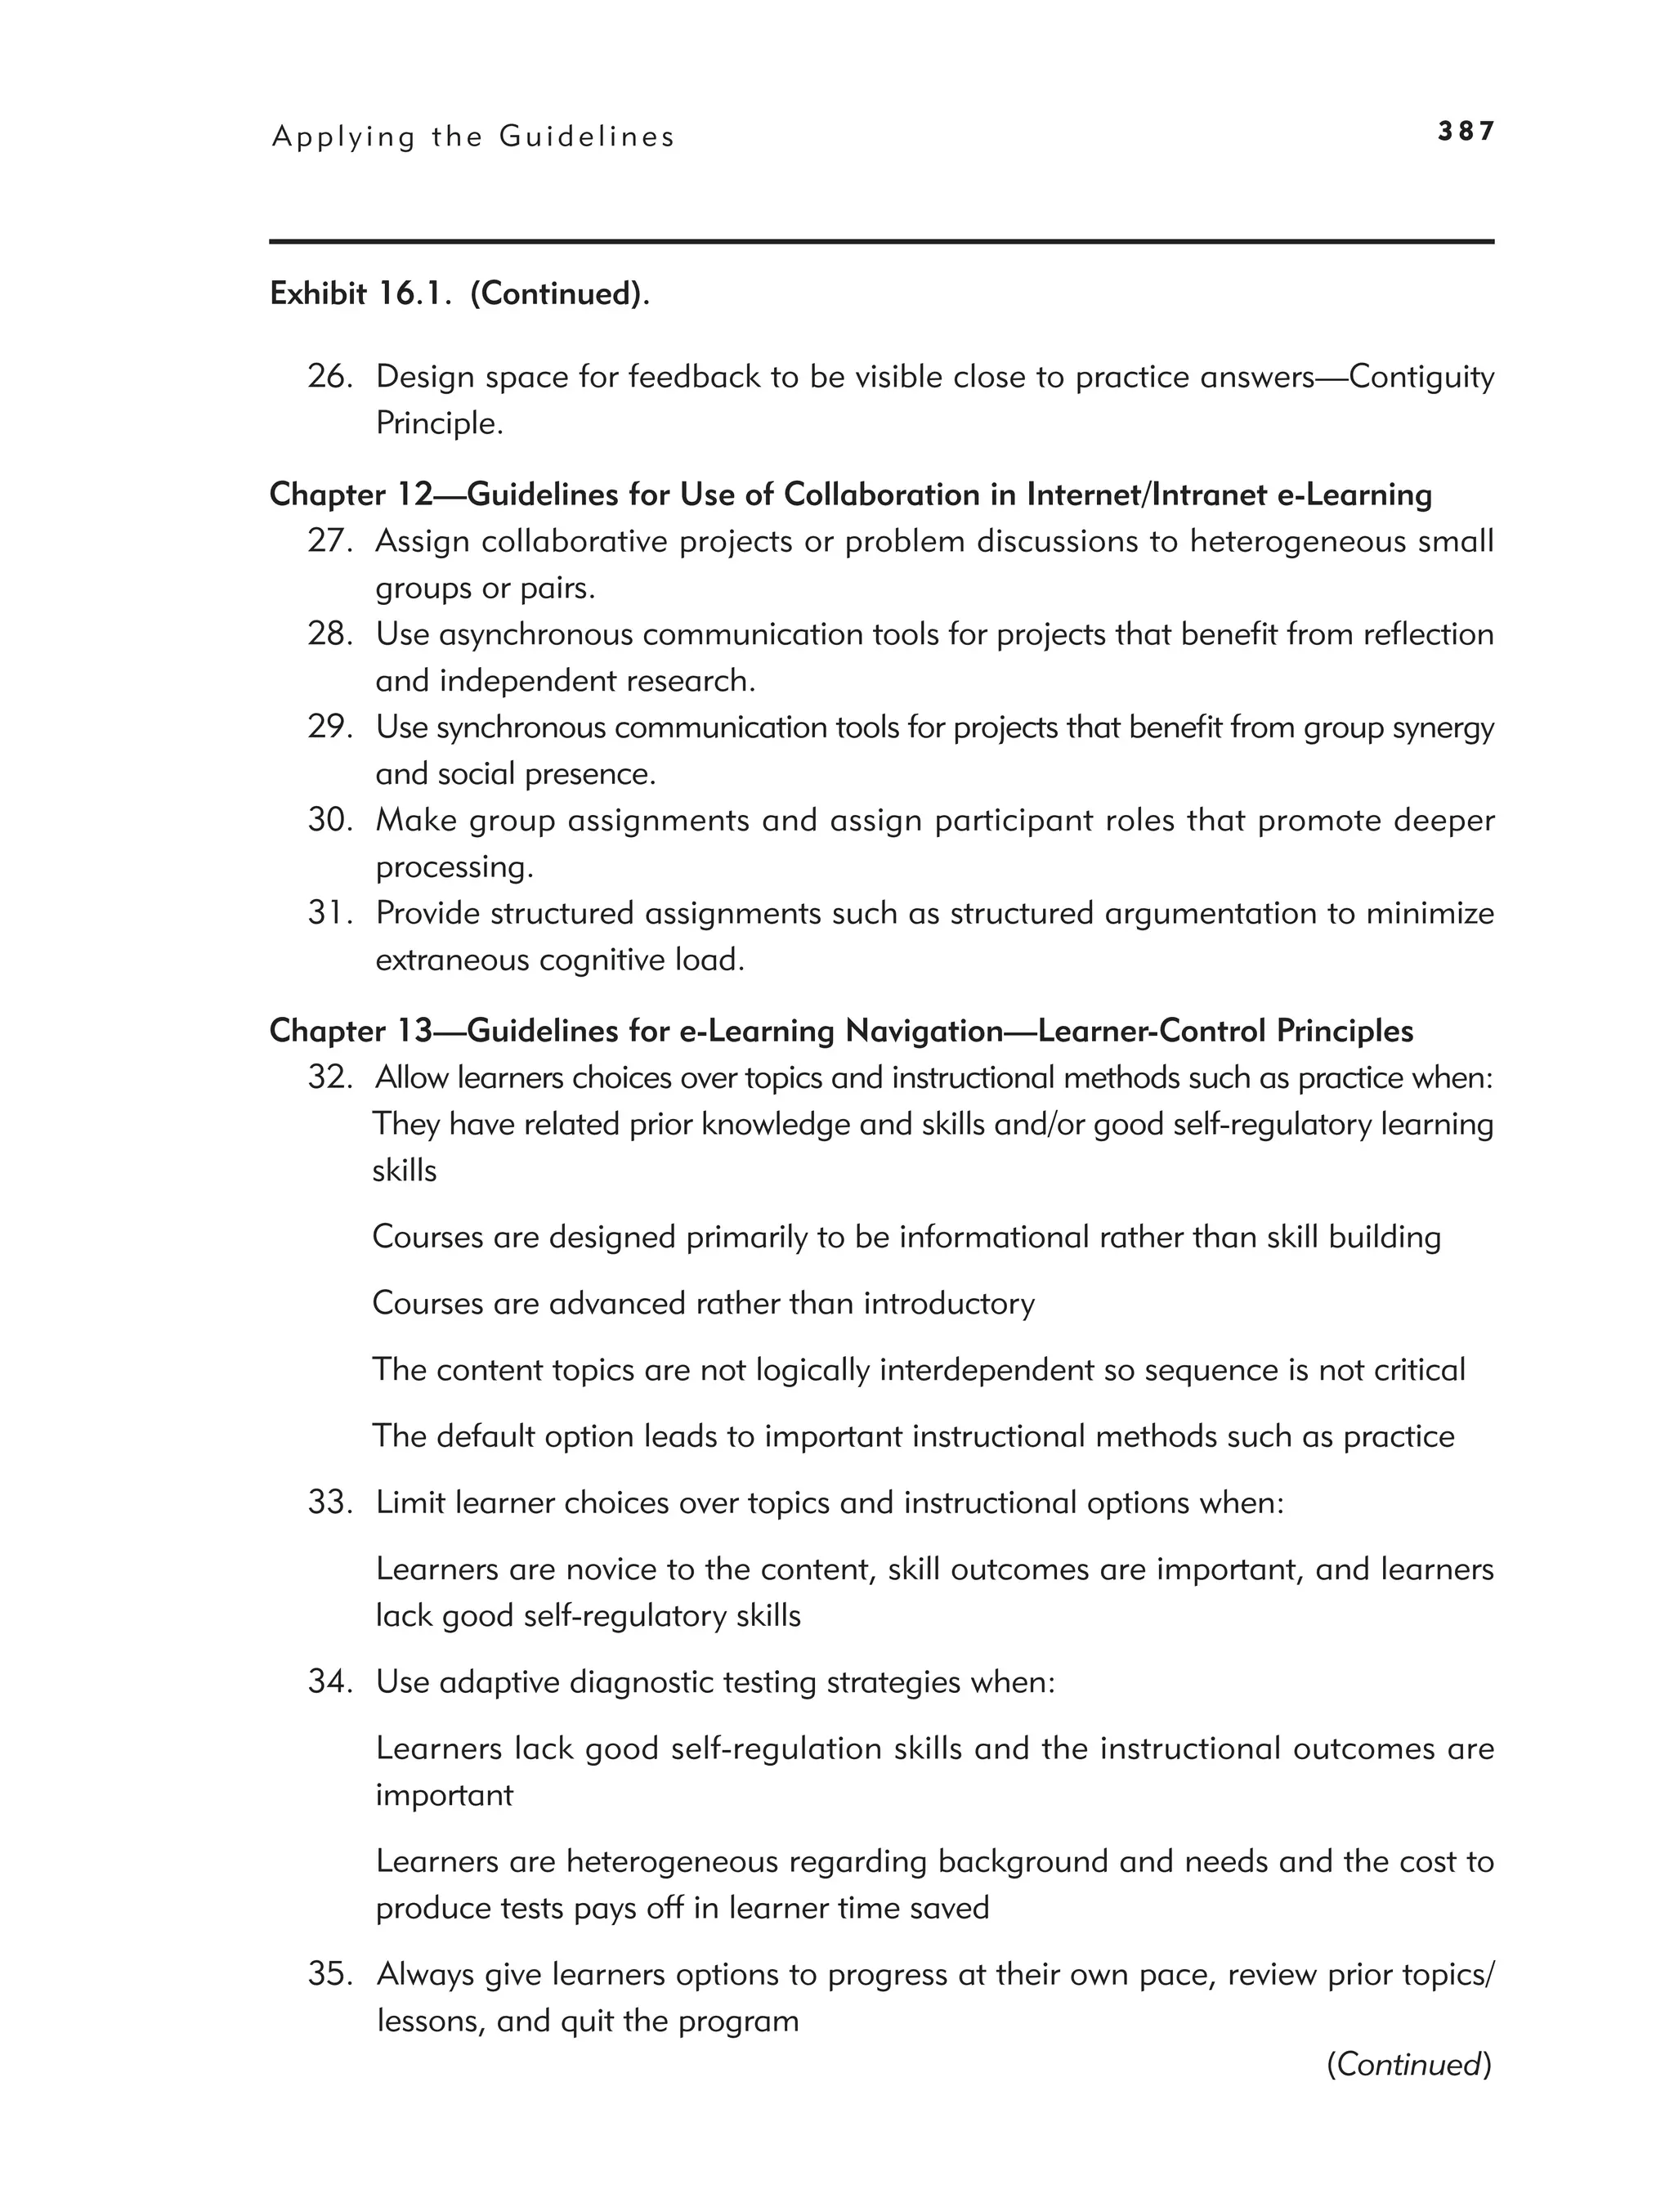
16. Applying the Guidelines 381
Applying Our Guidelines to Evaluate e-Courseware 382
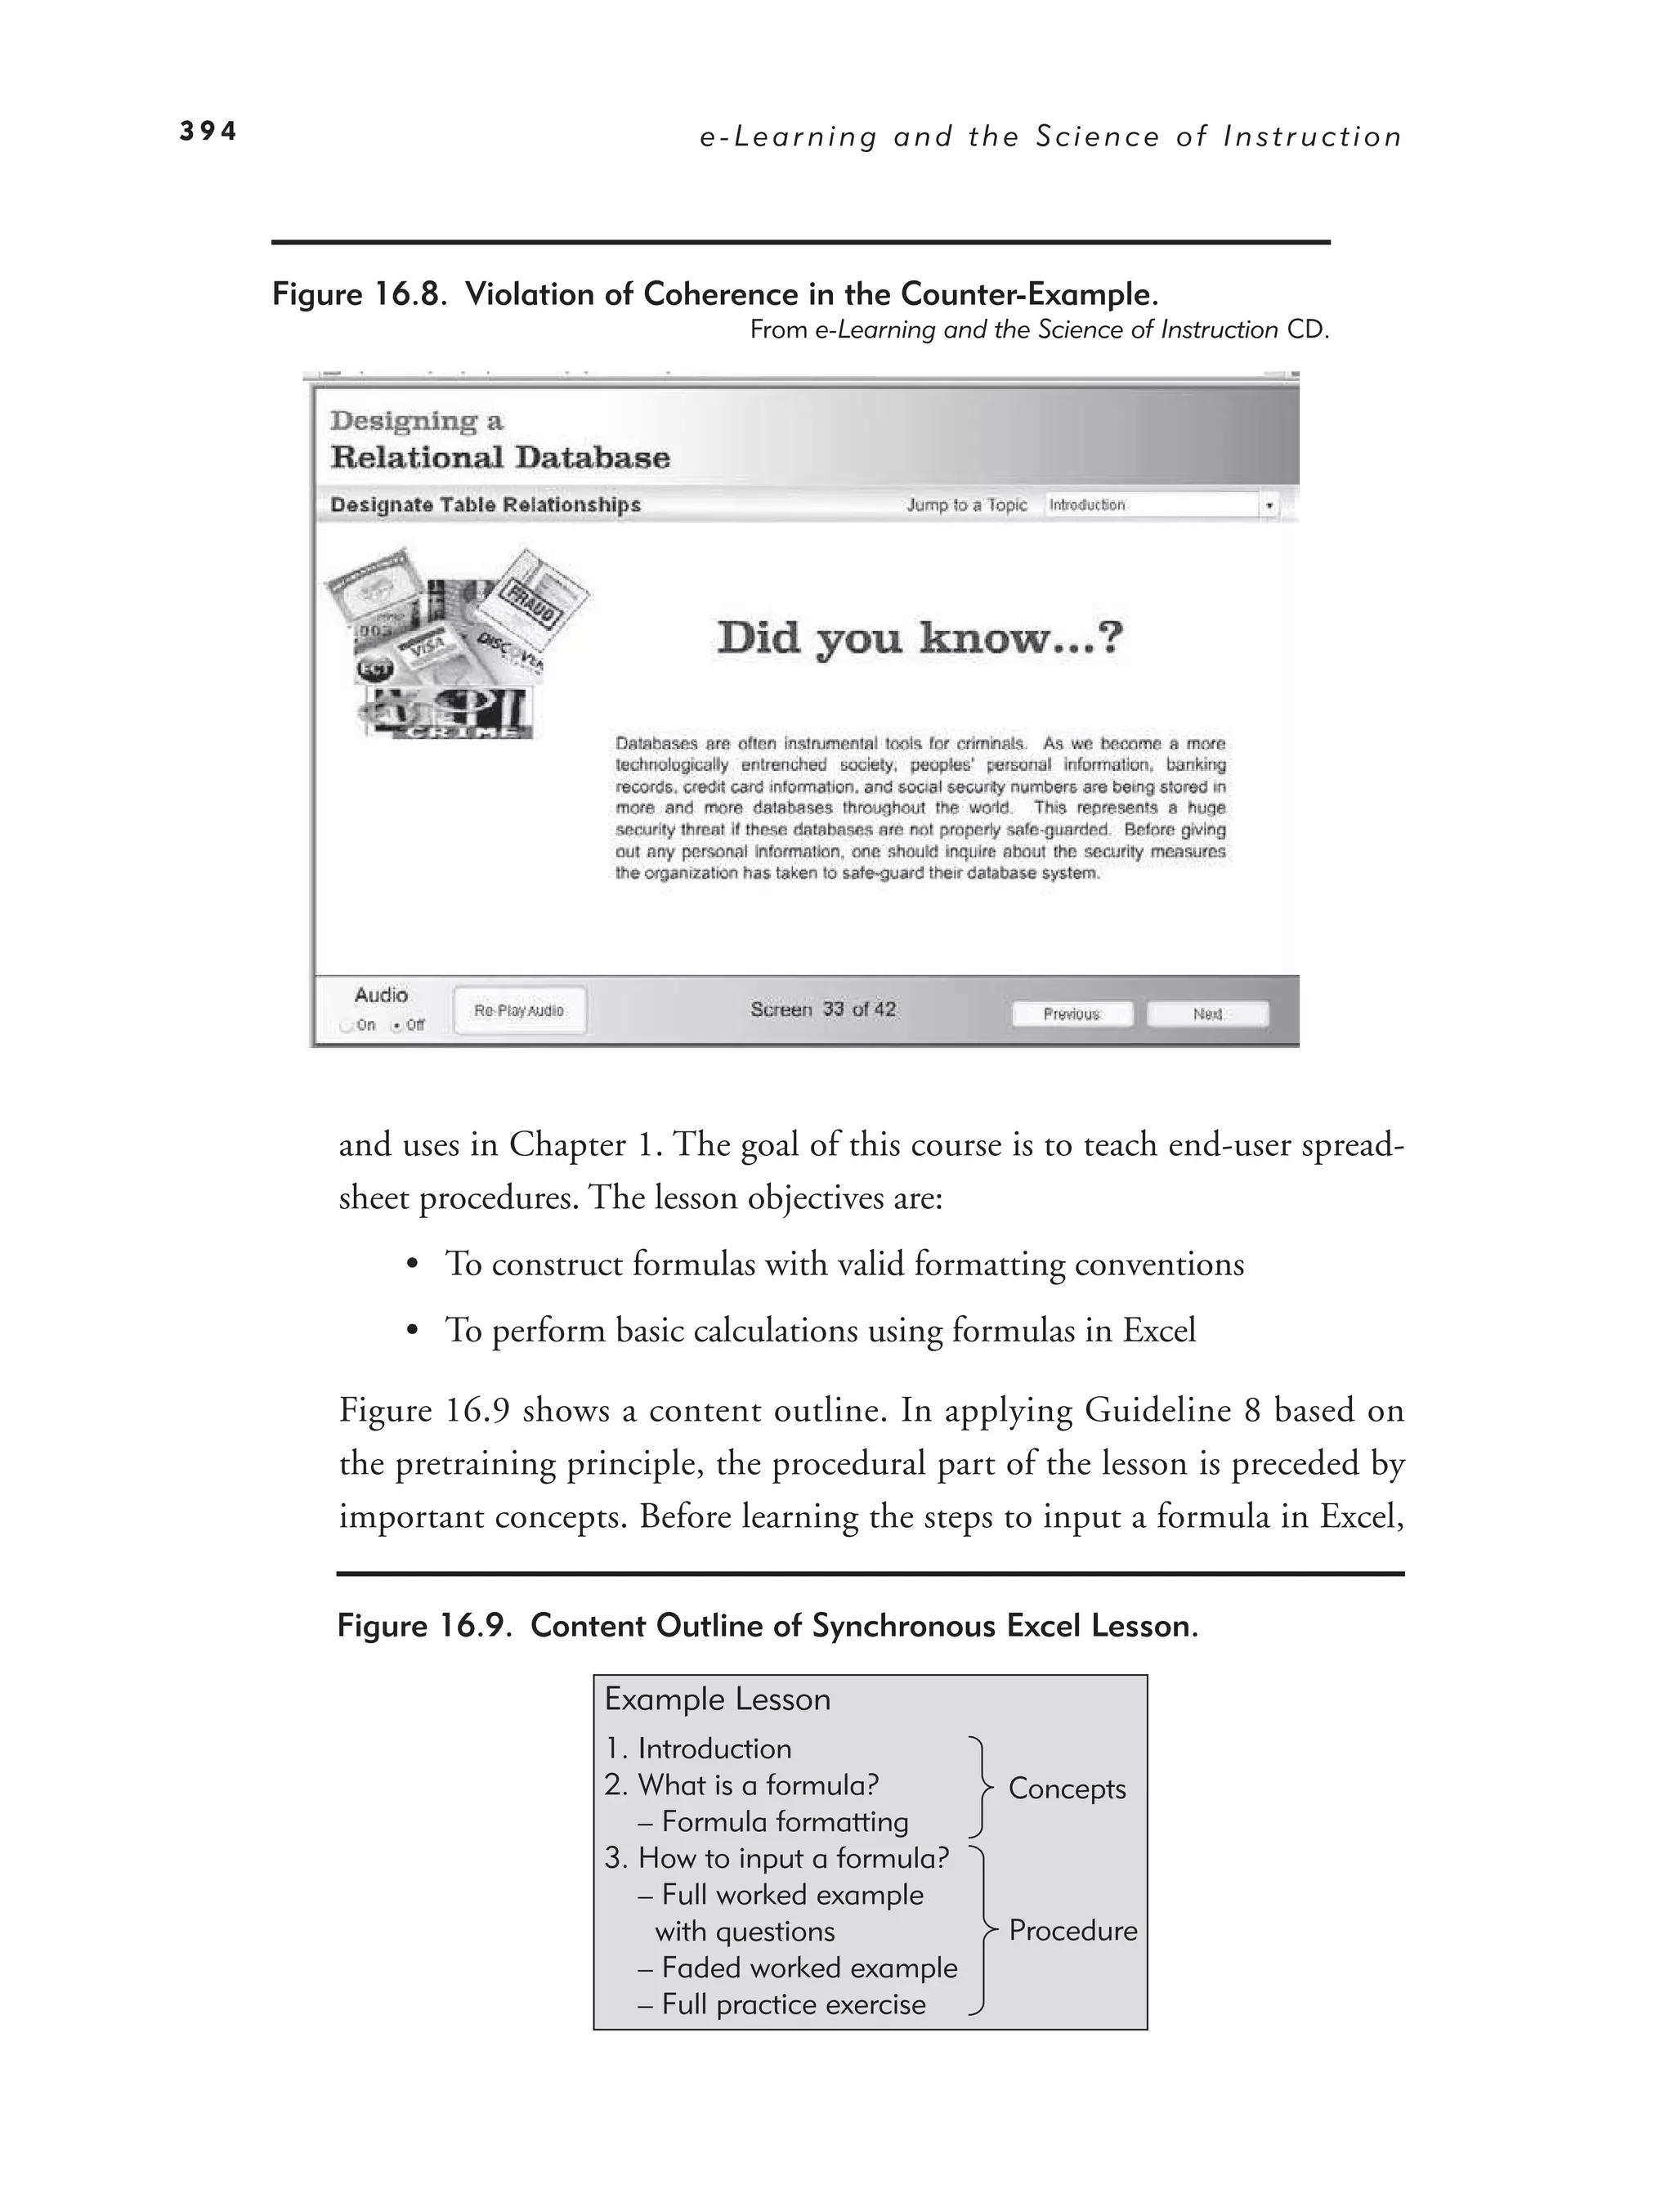
e-Lesson Reviews 384
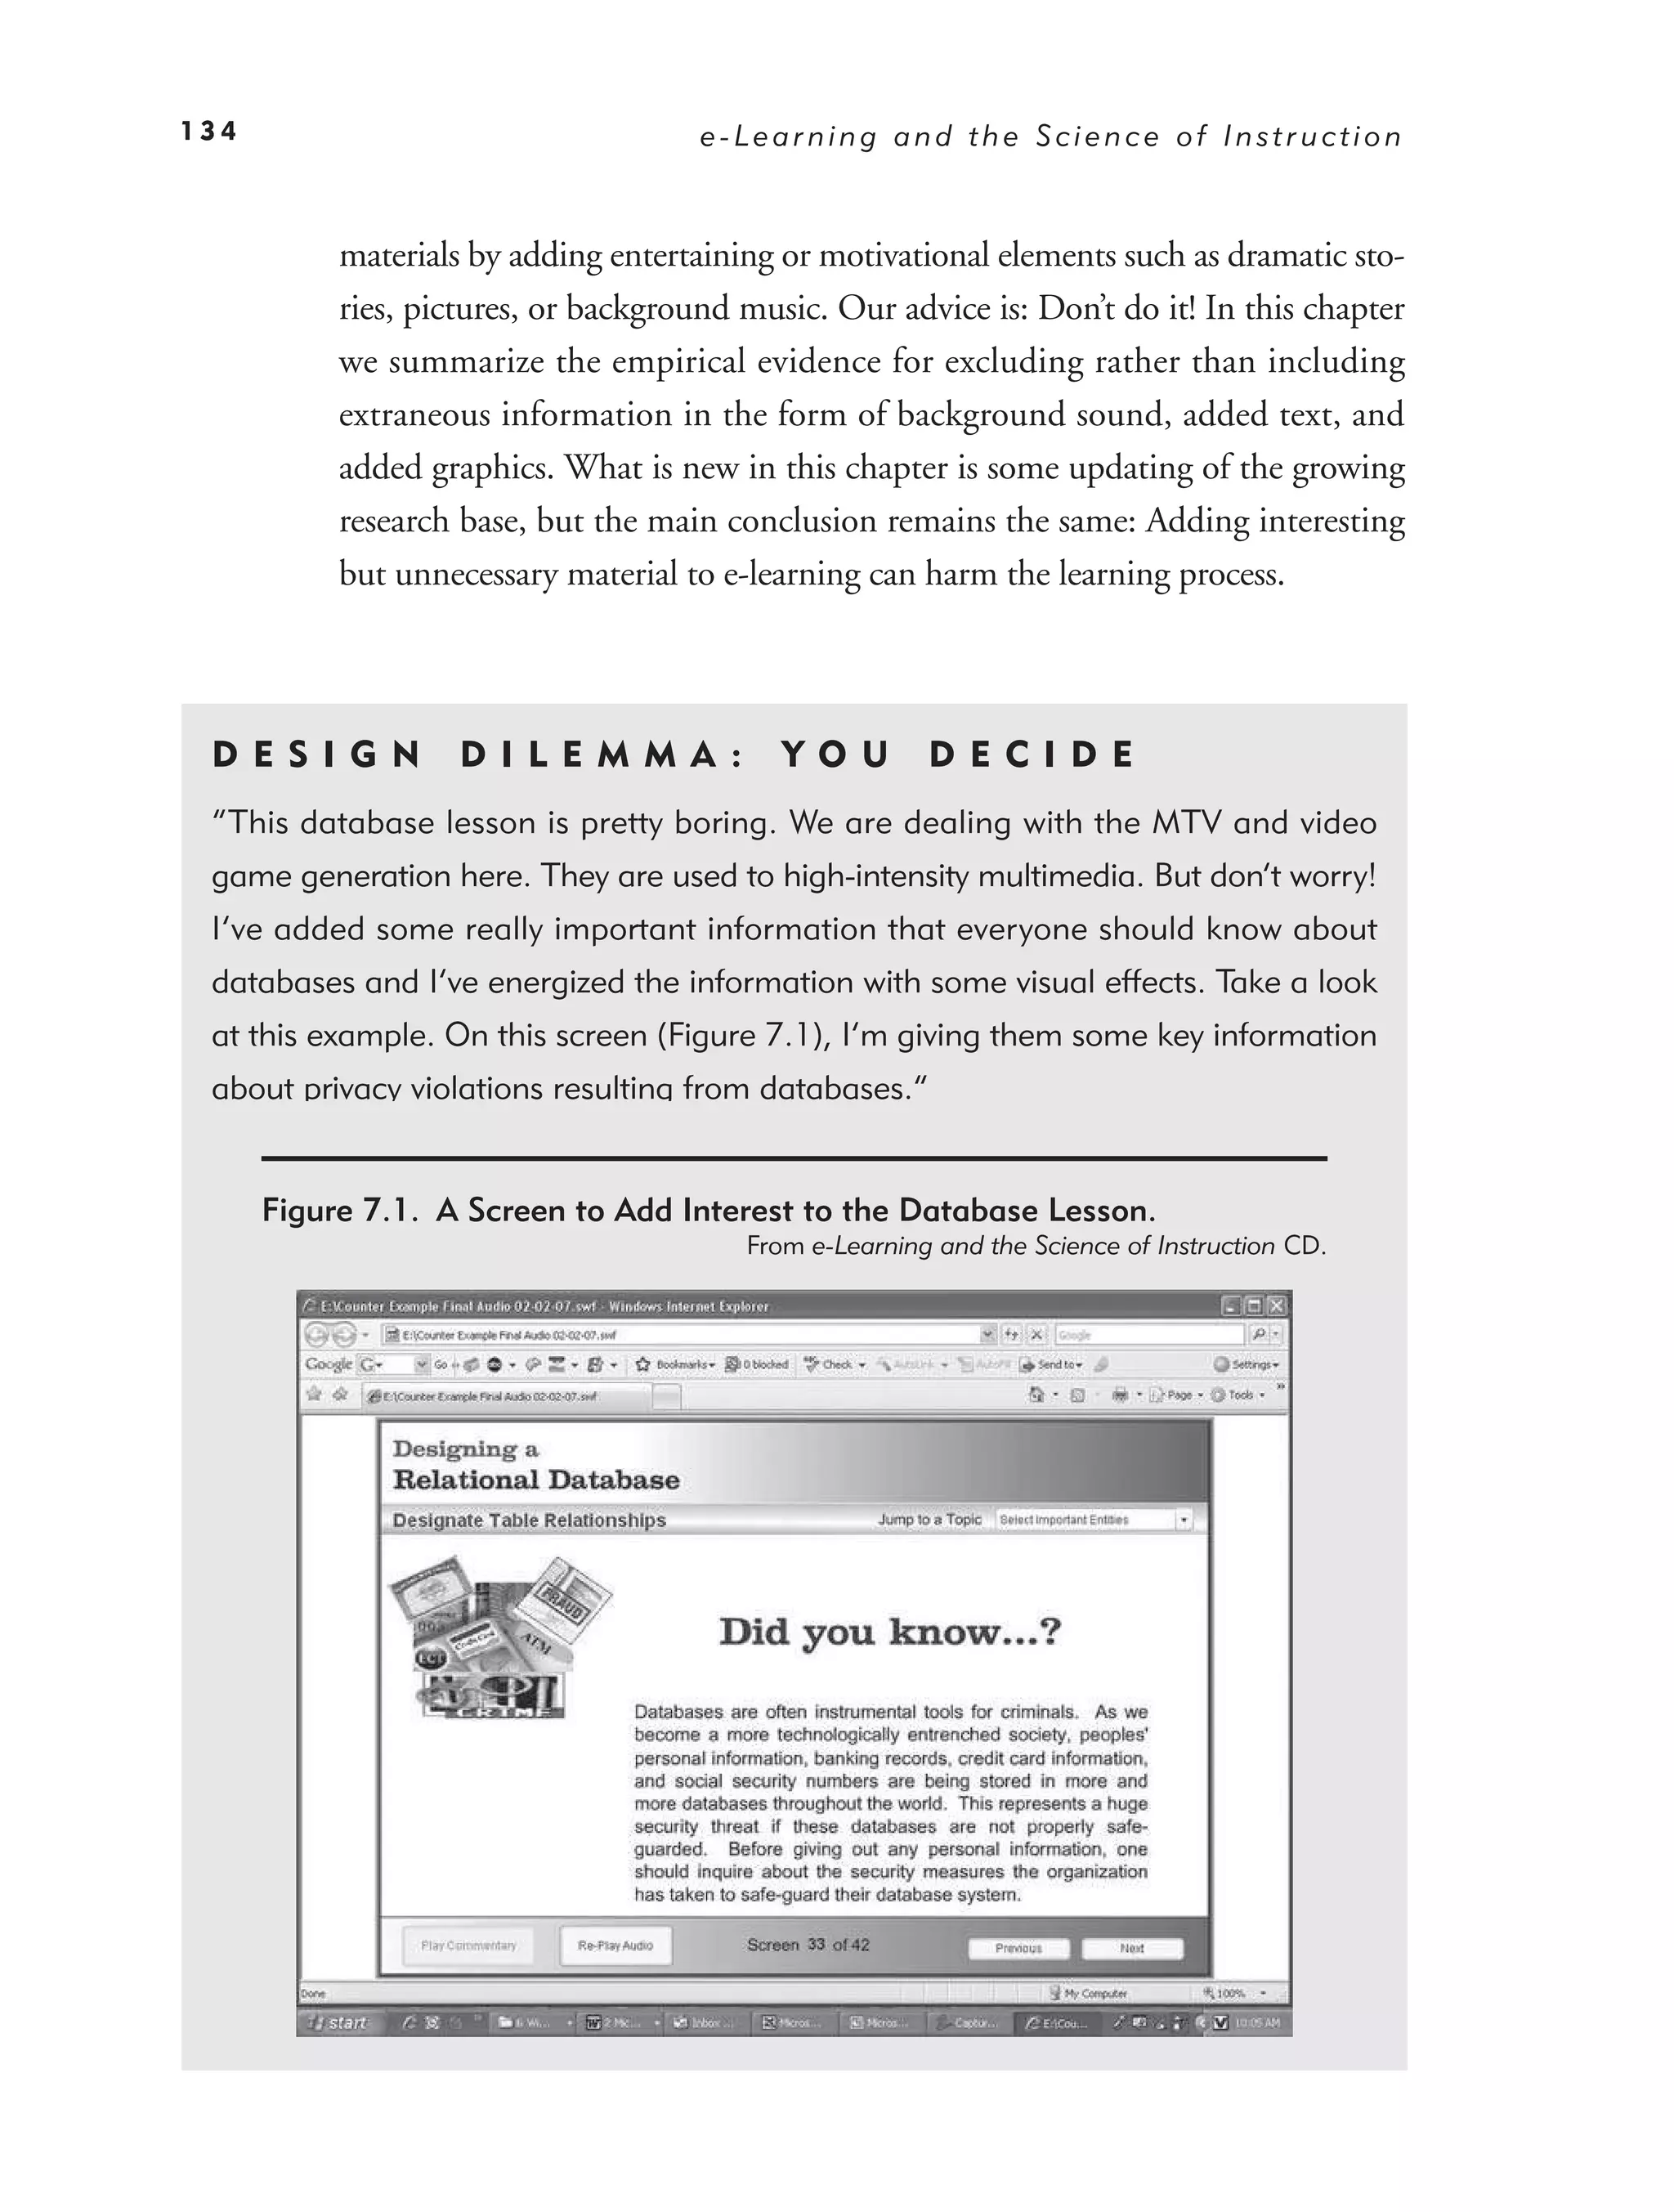
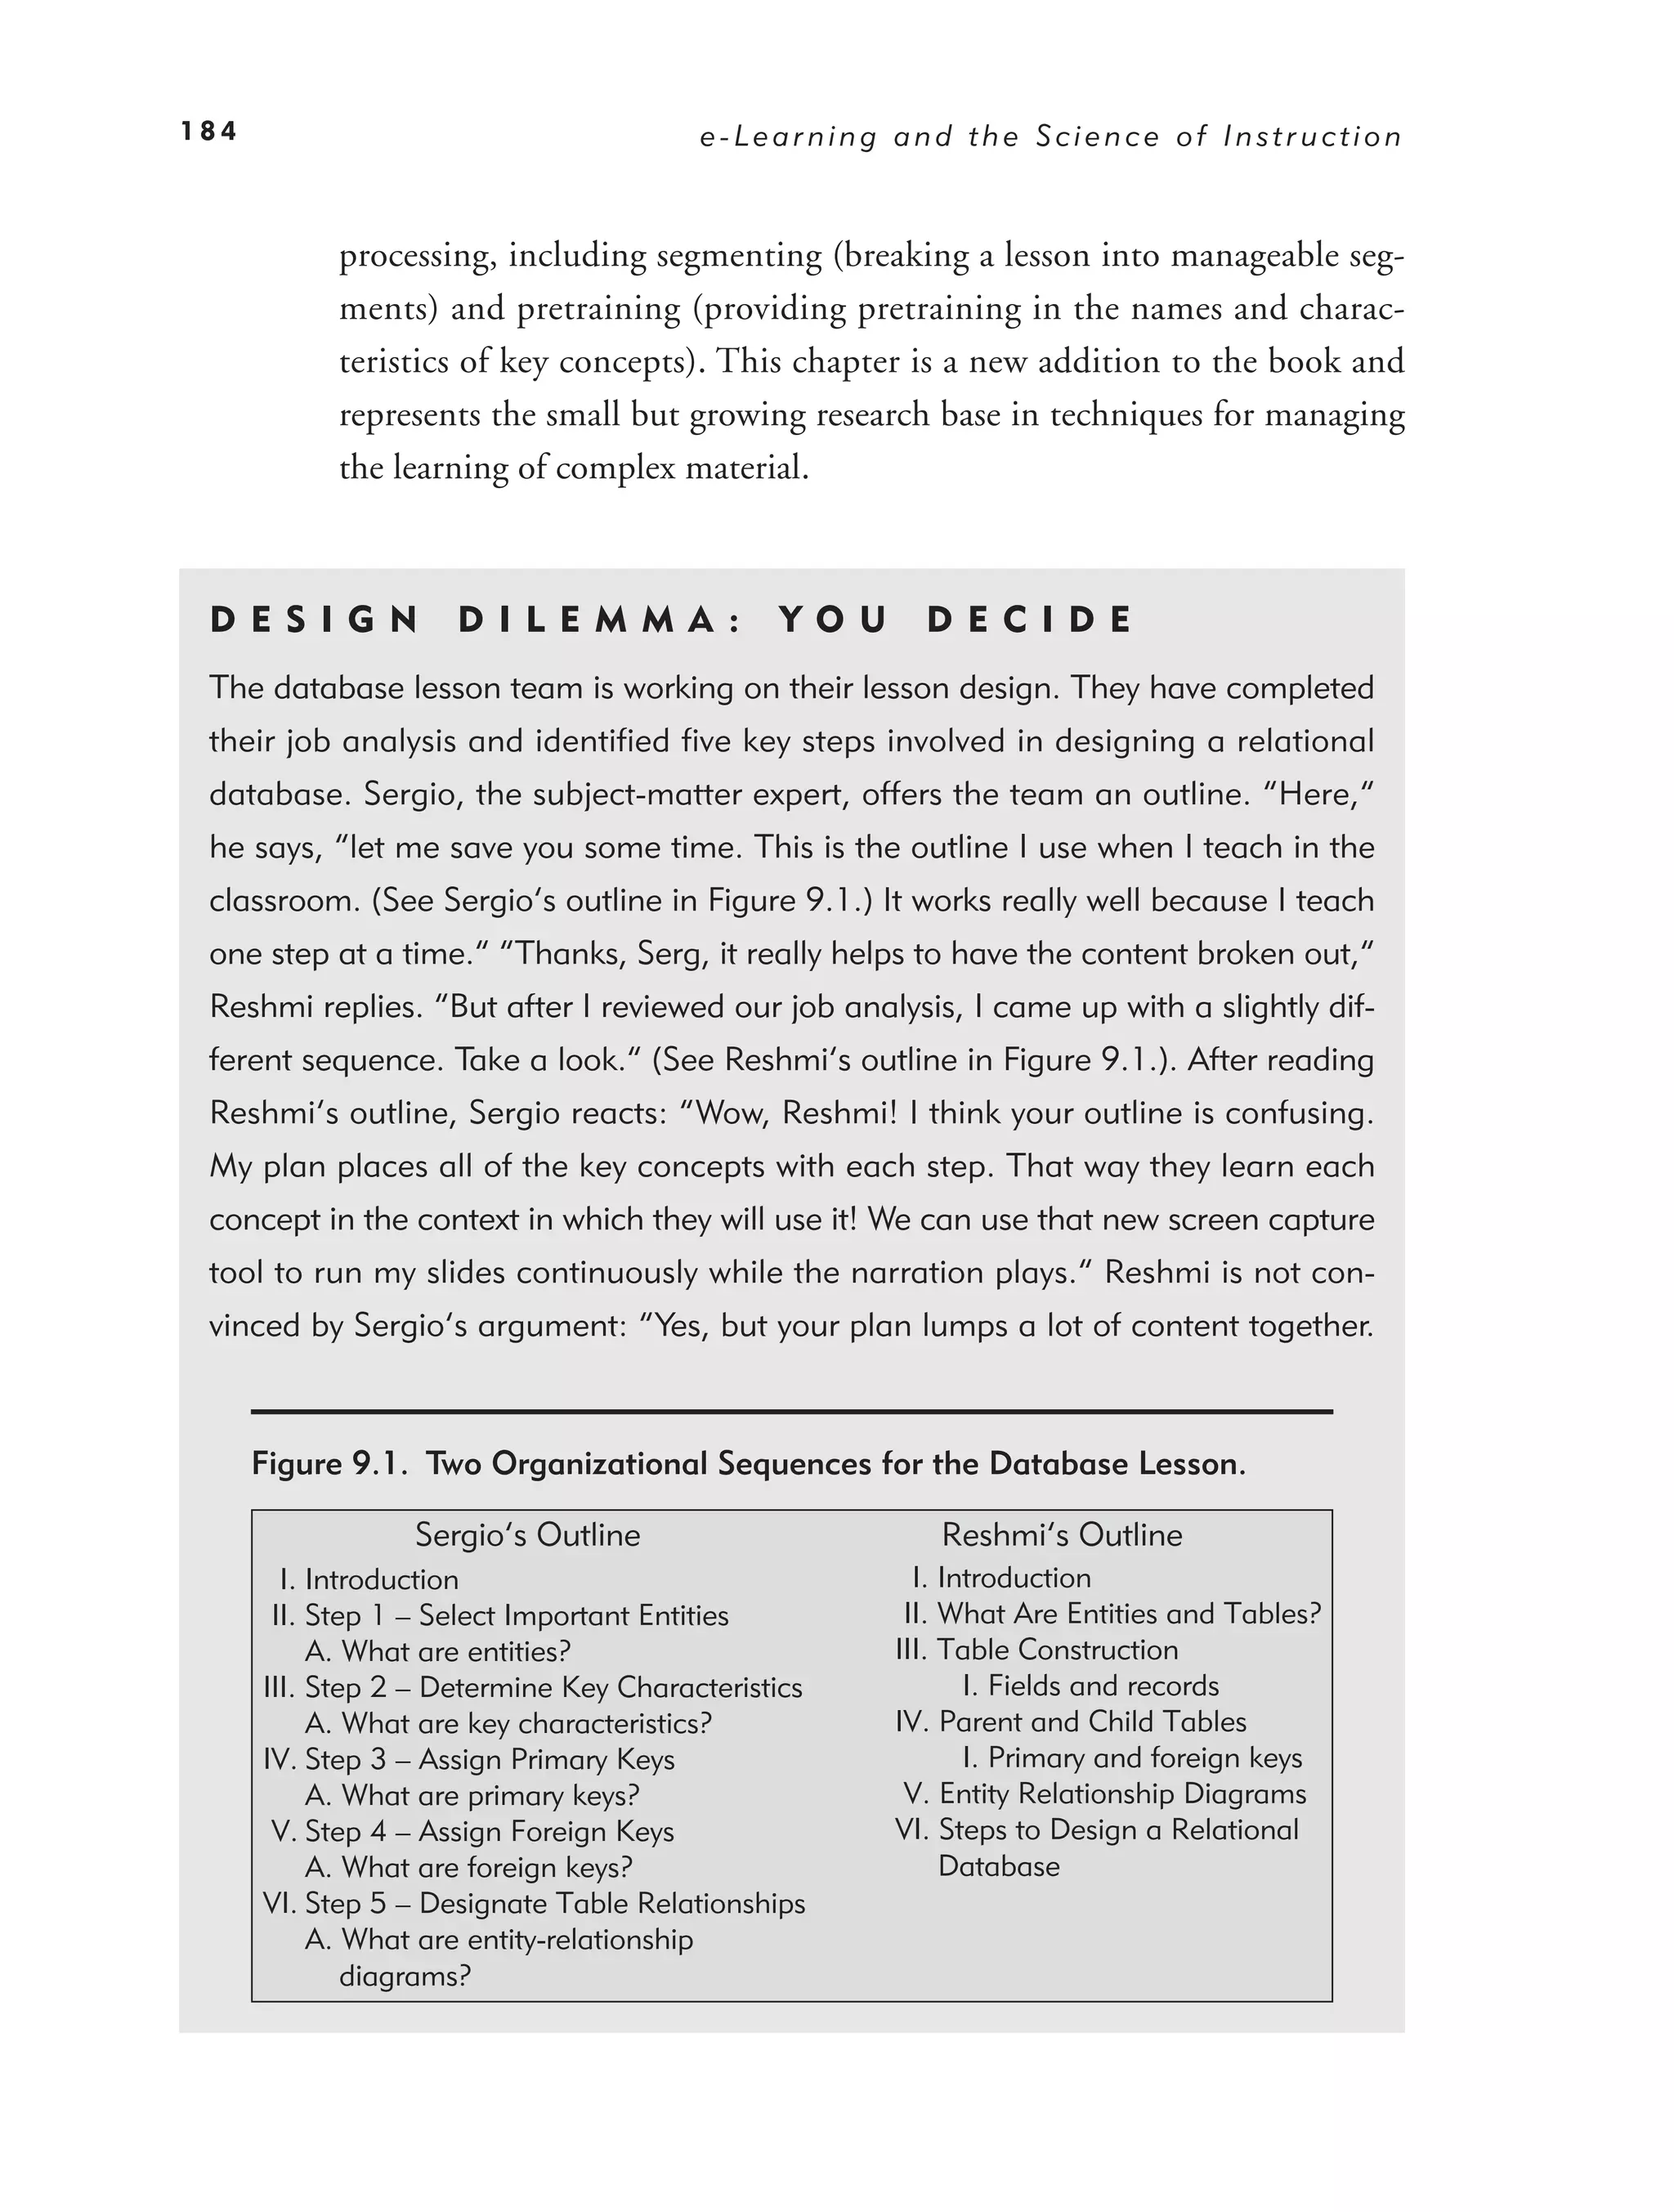
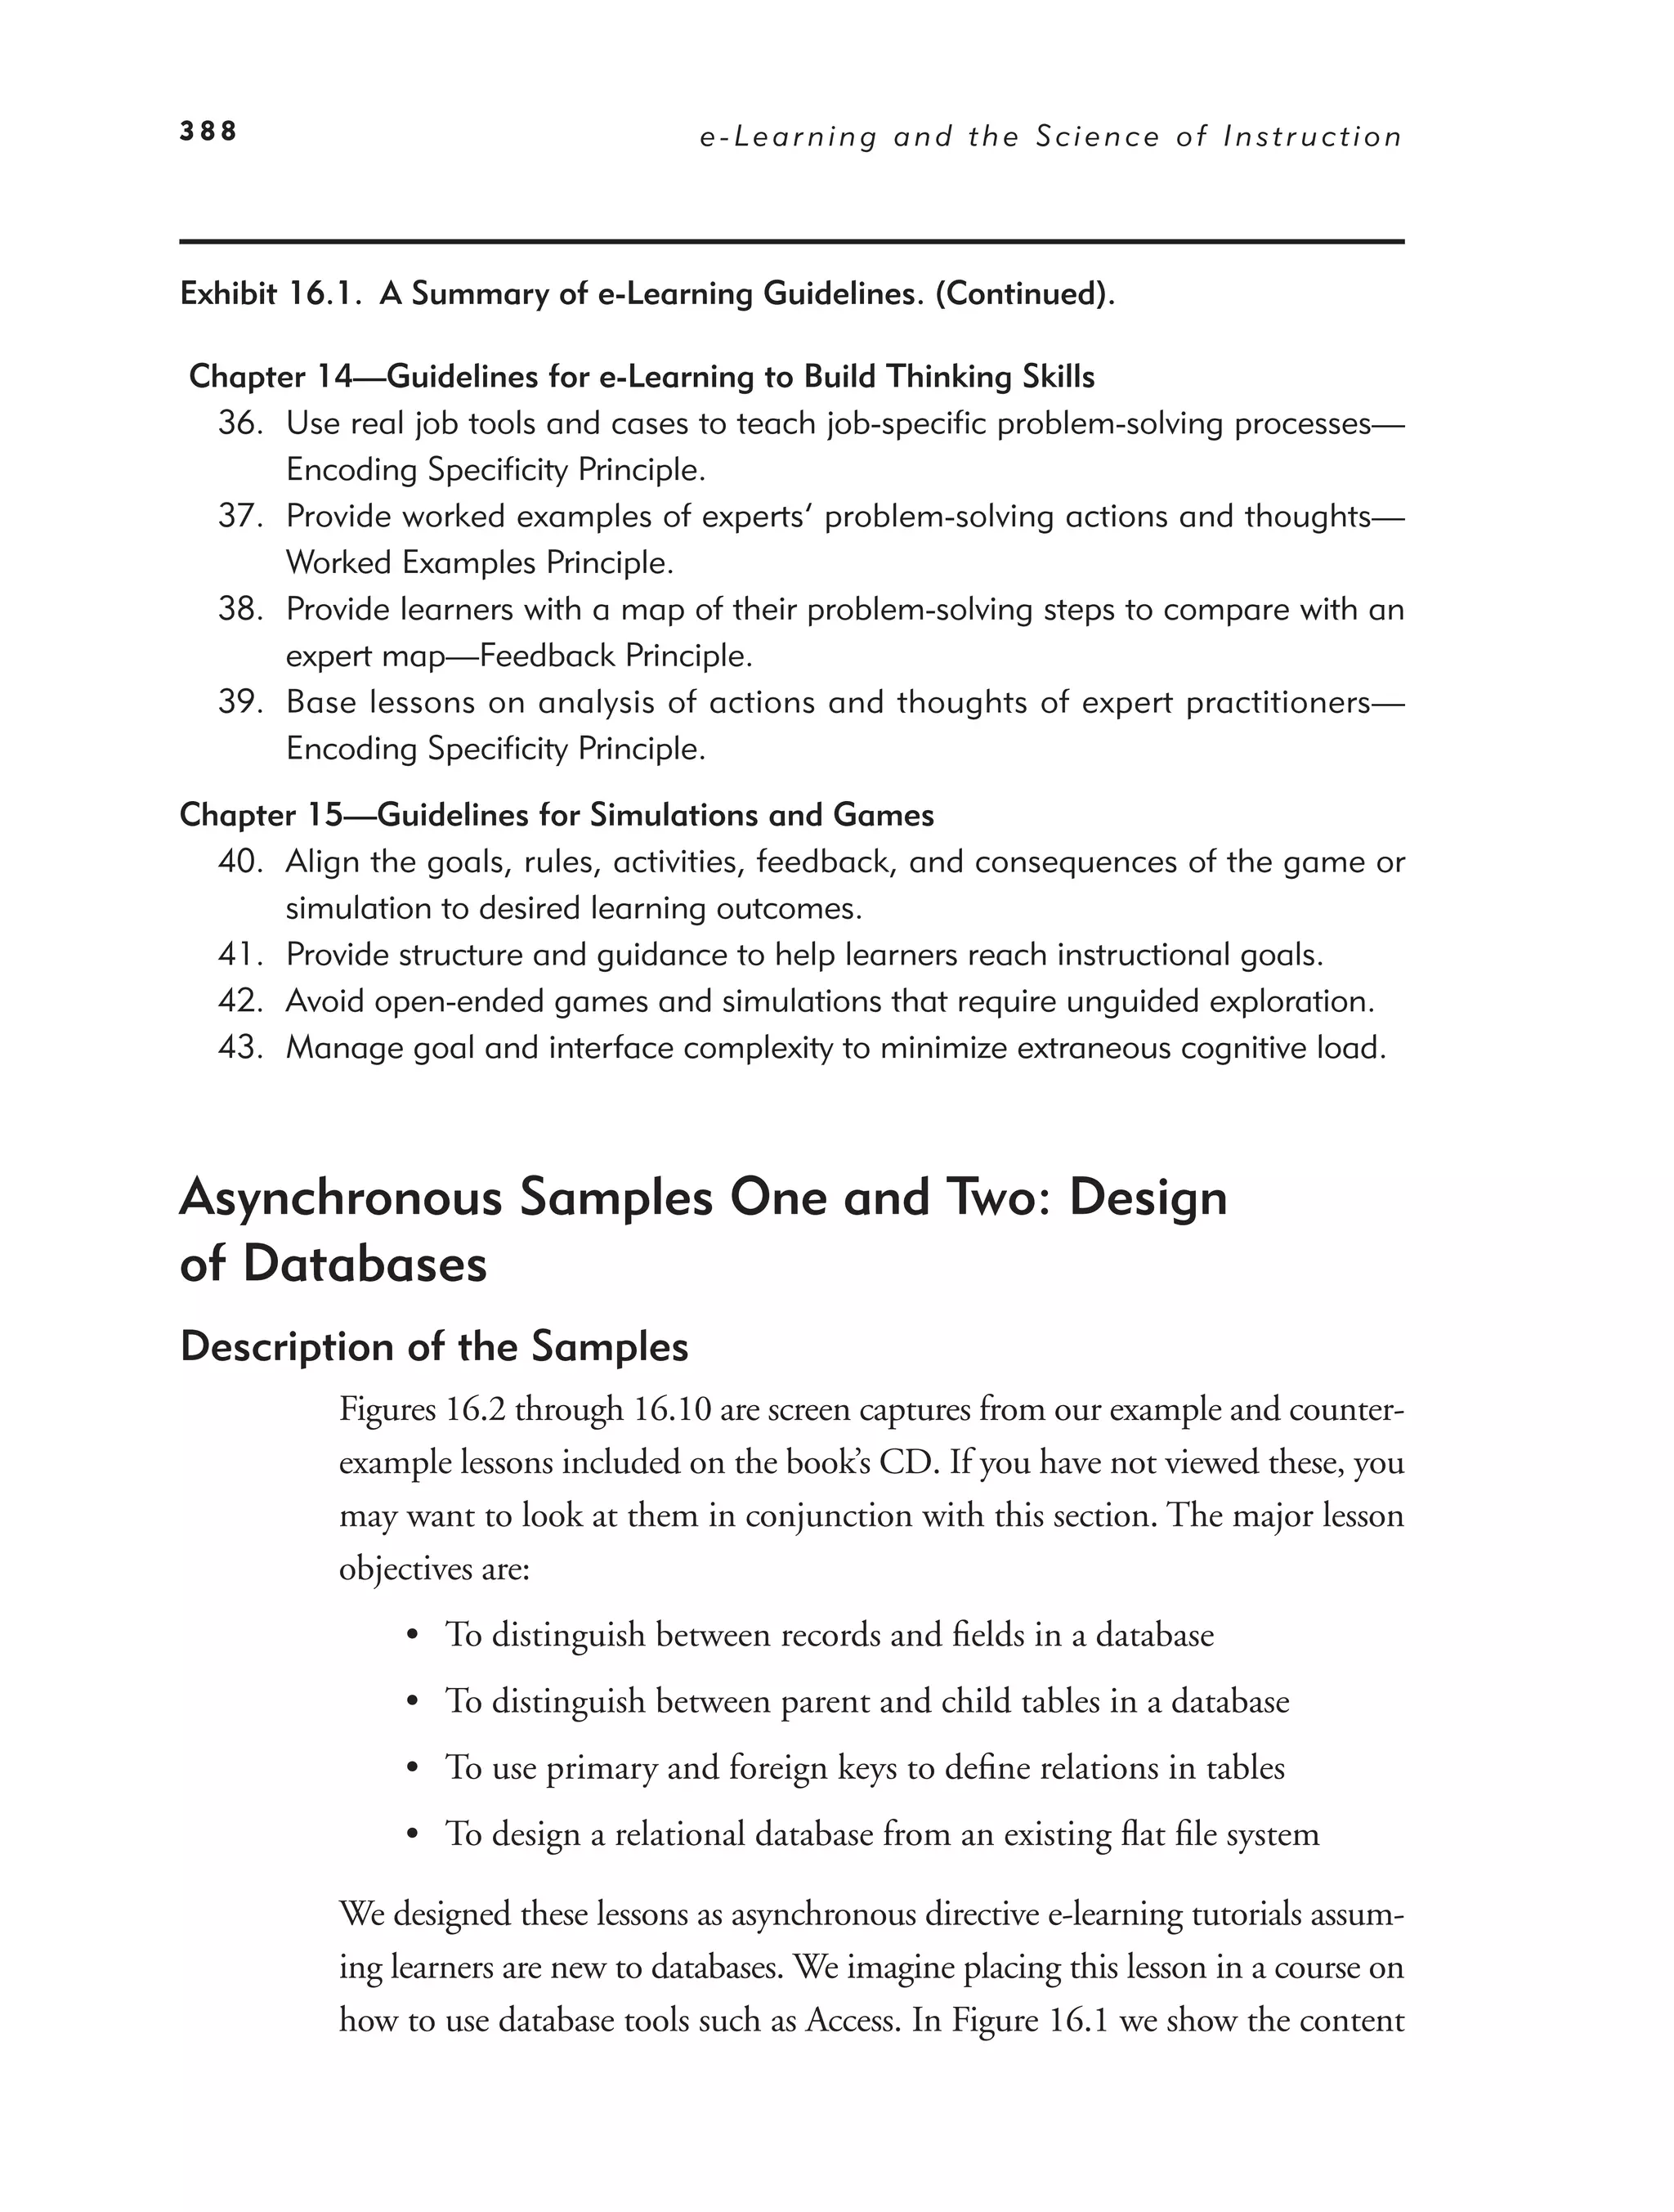
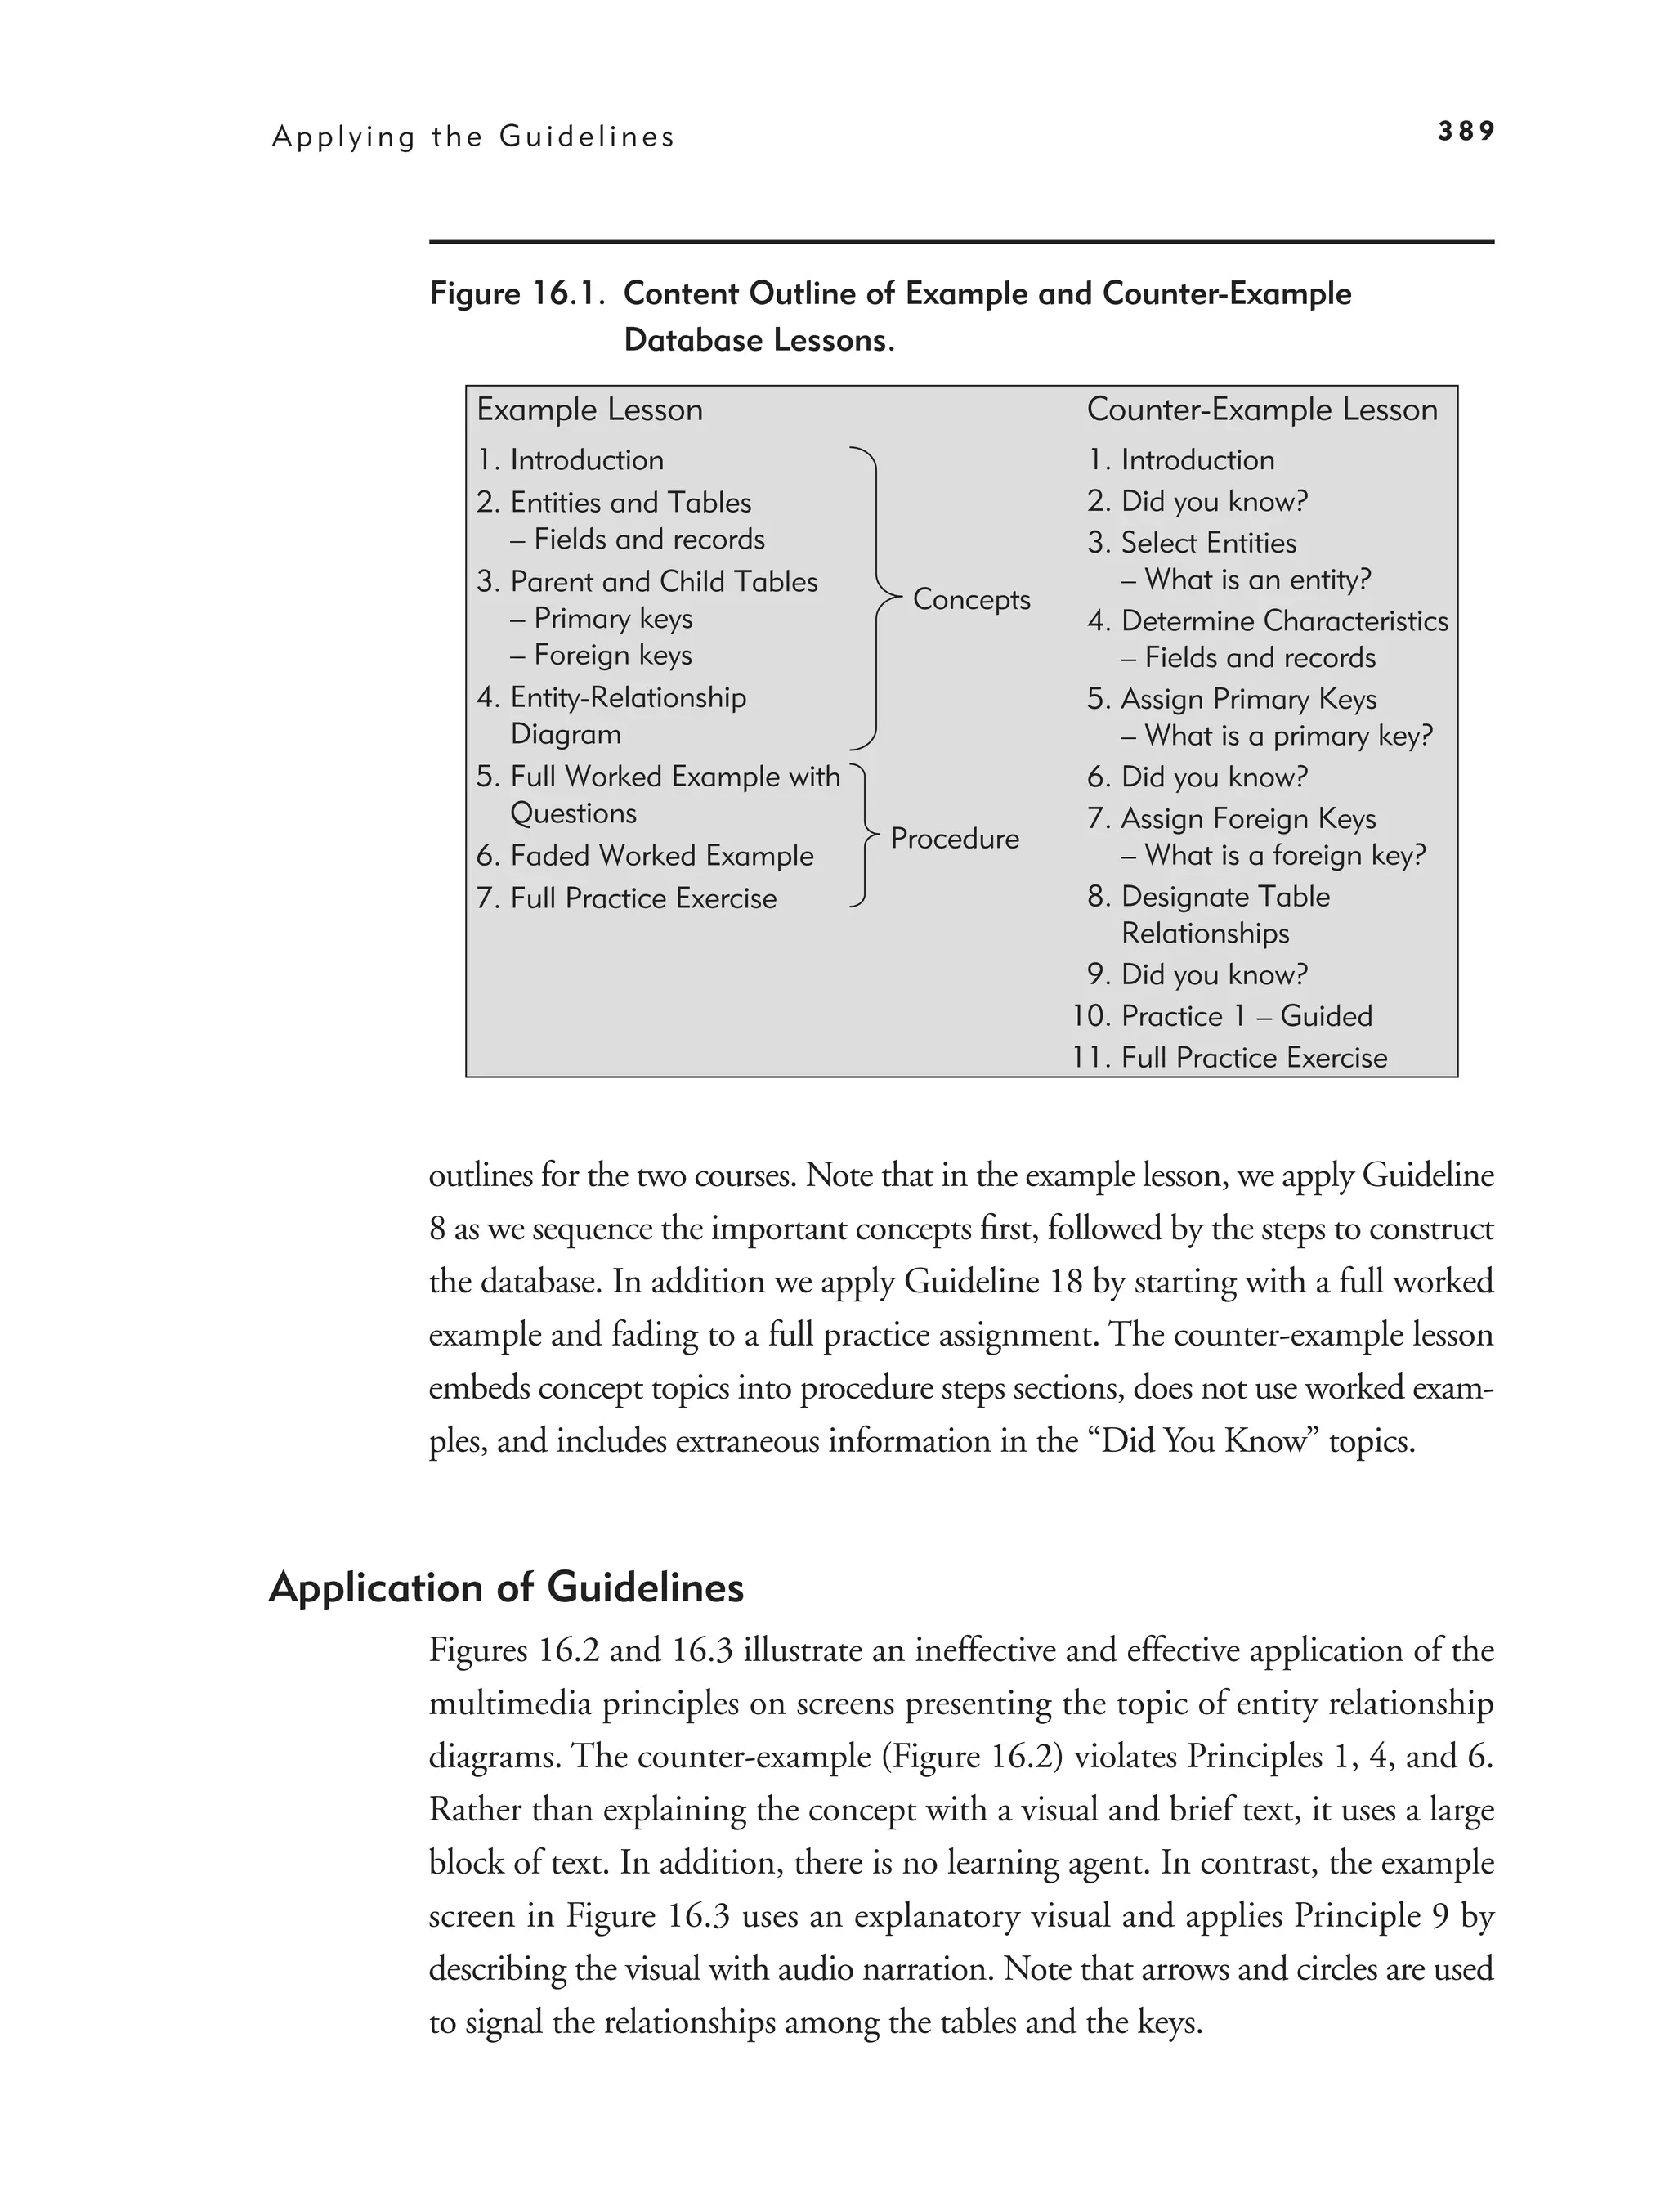
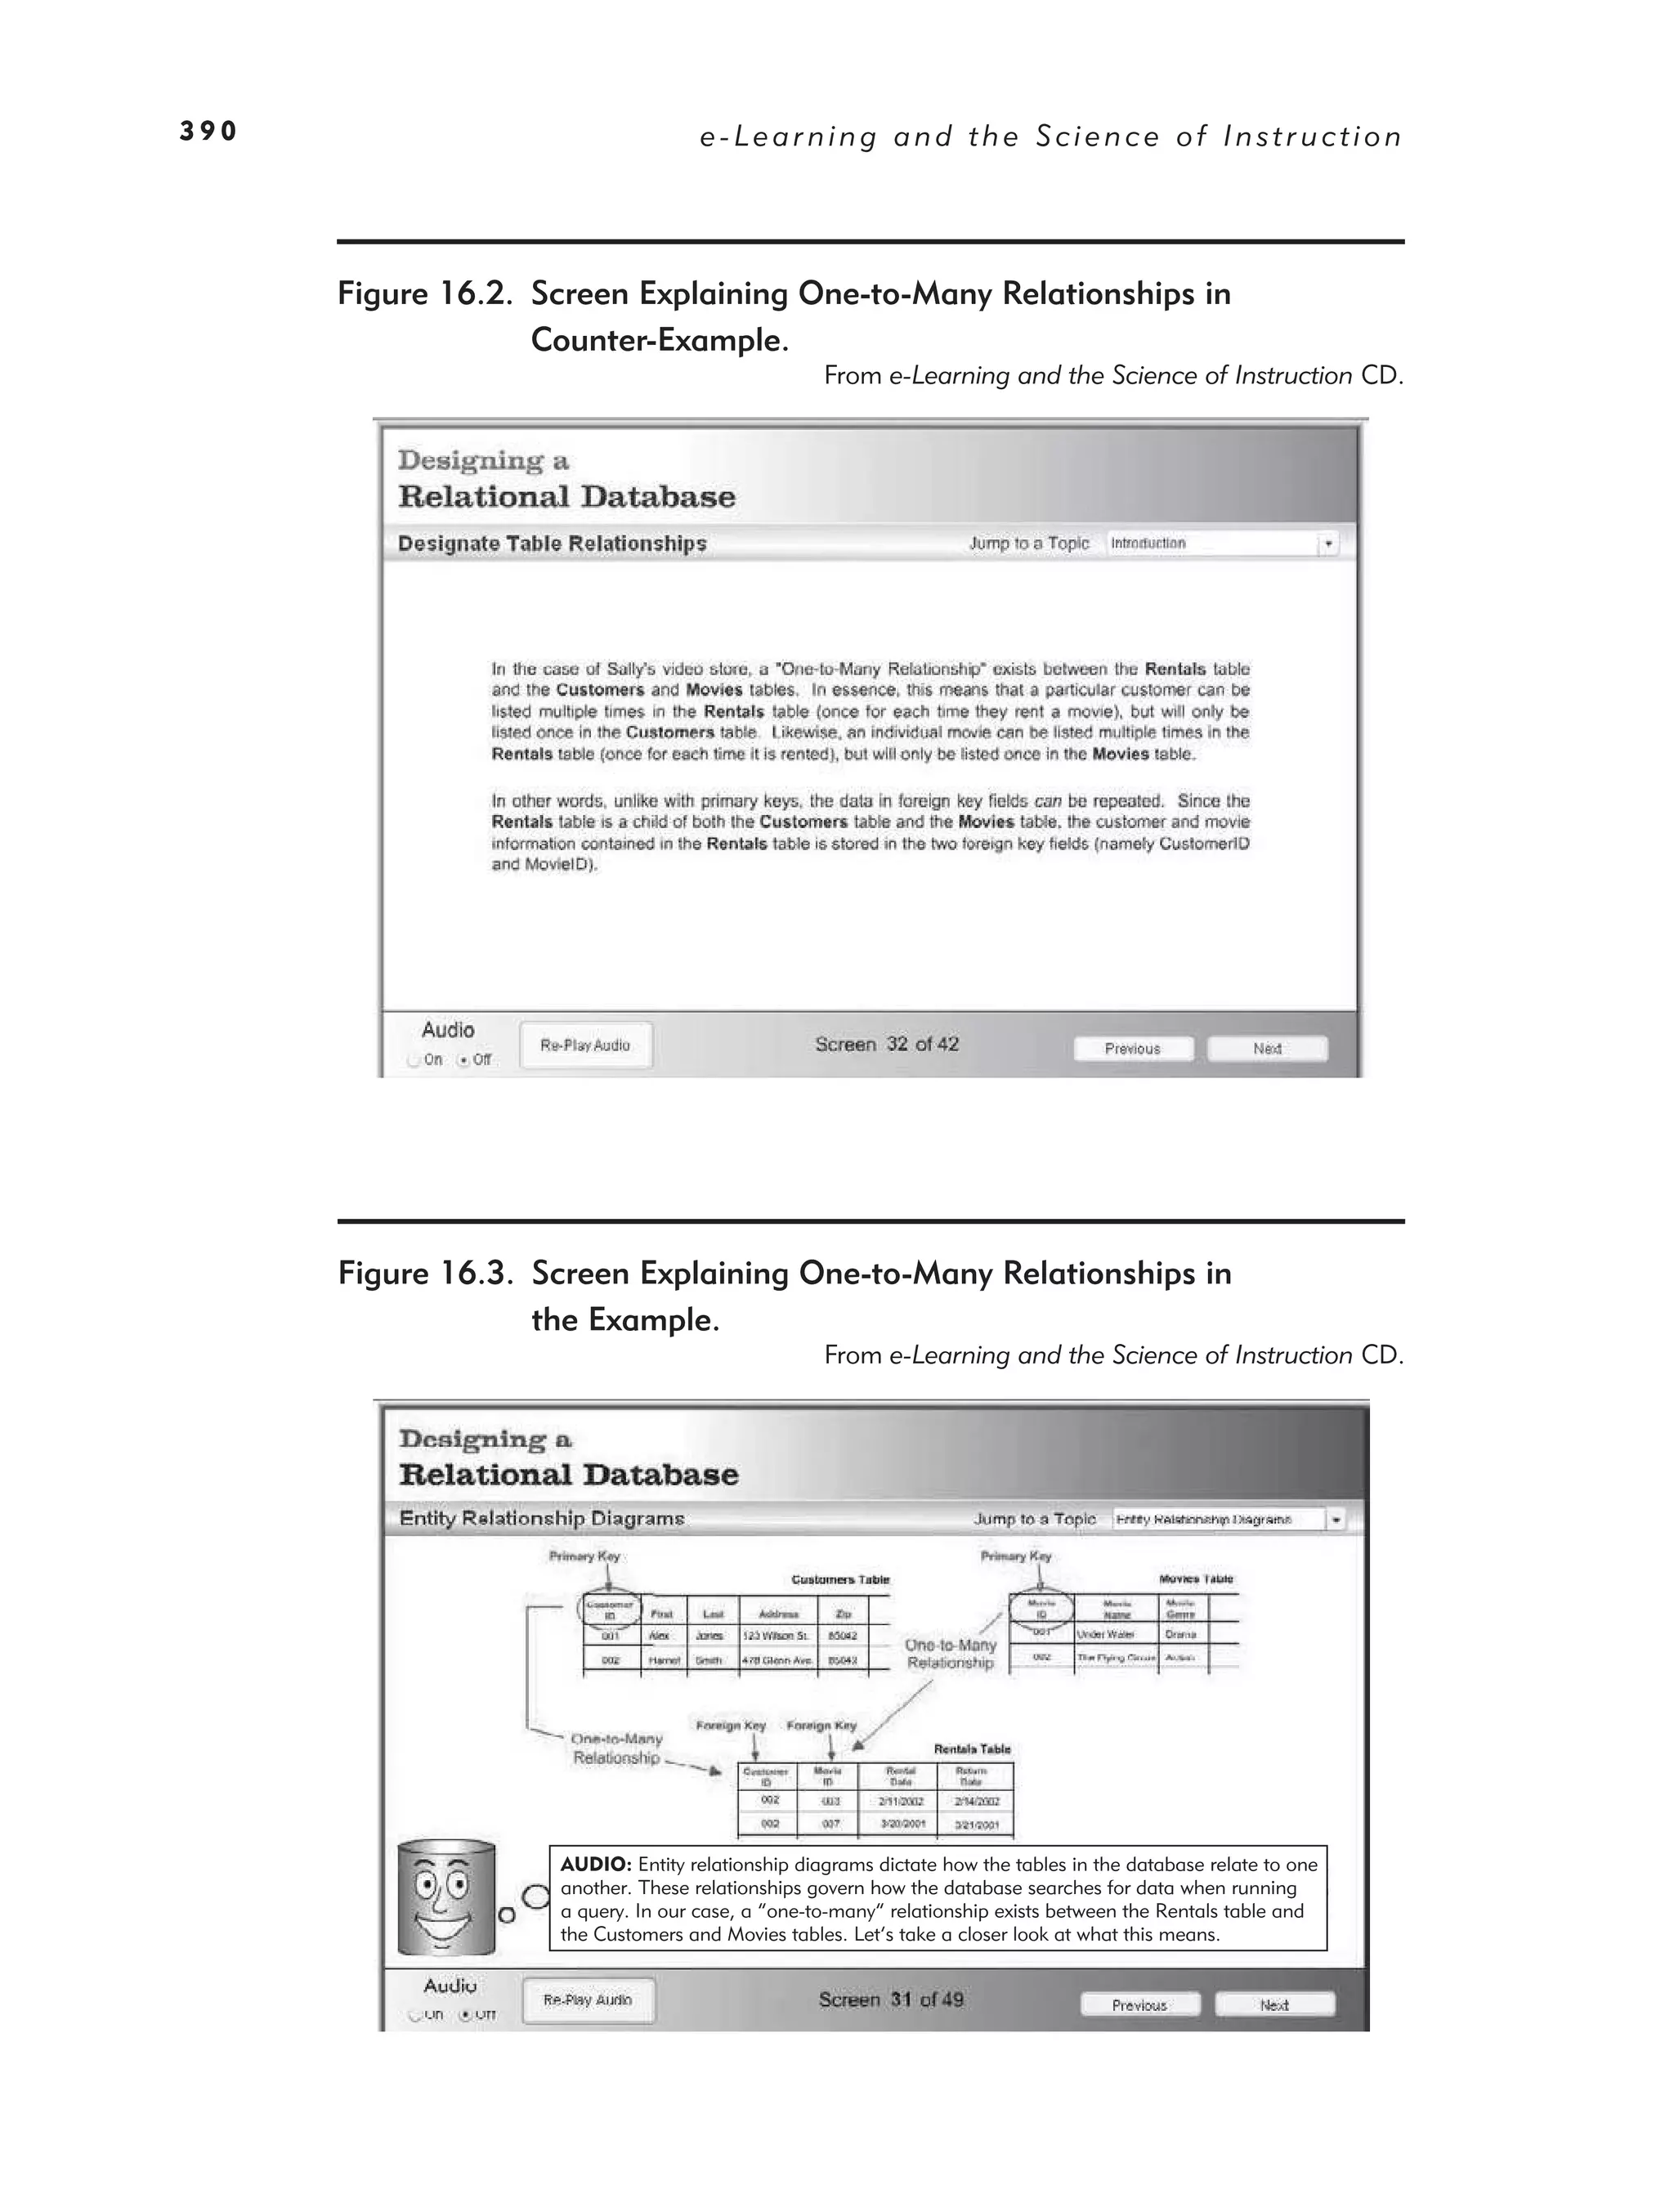
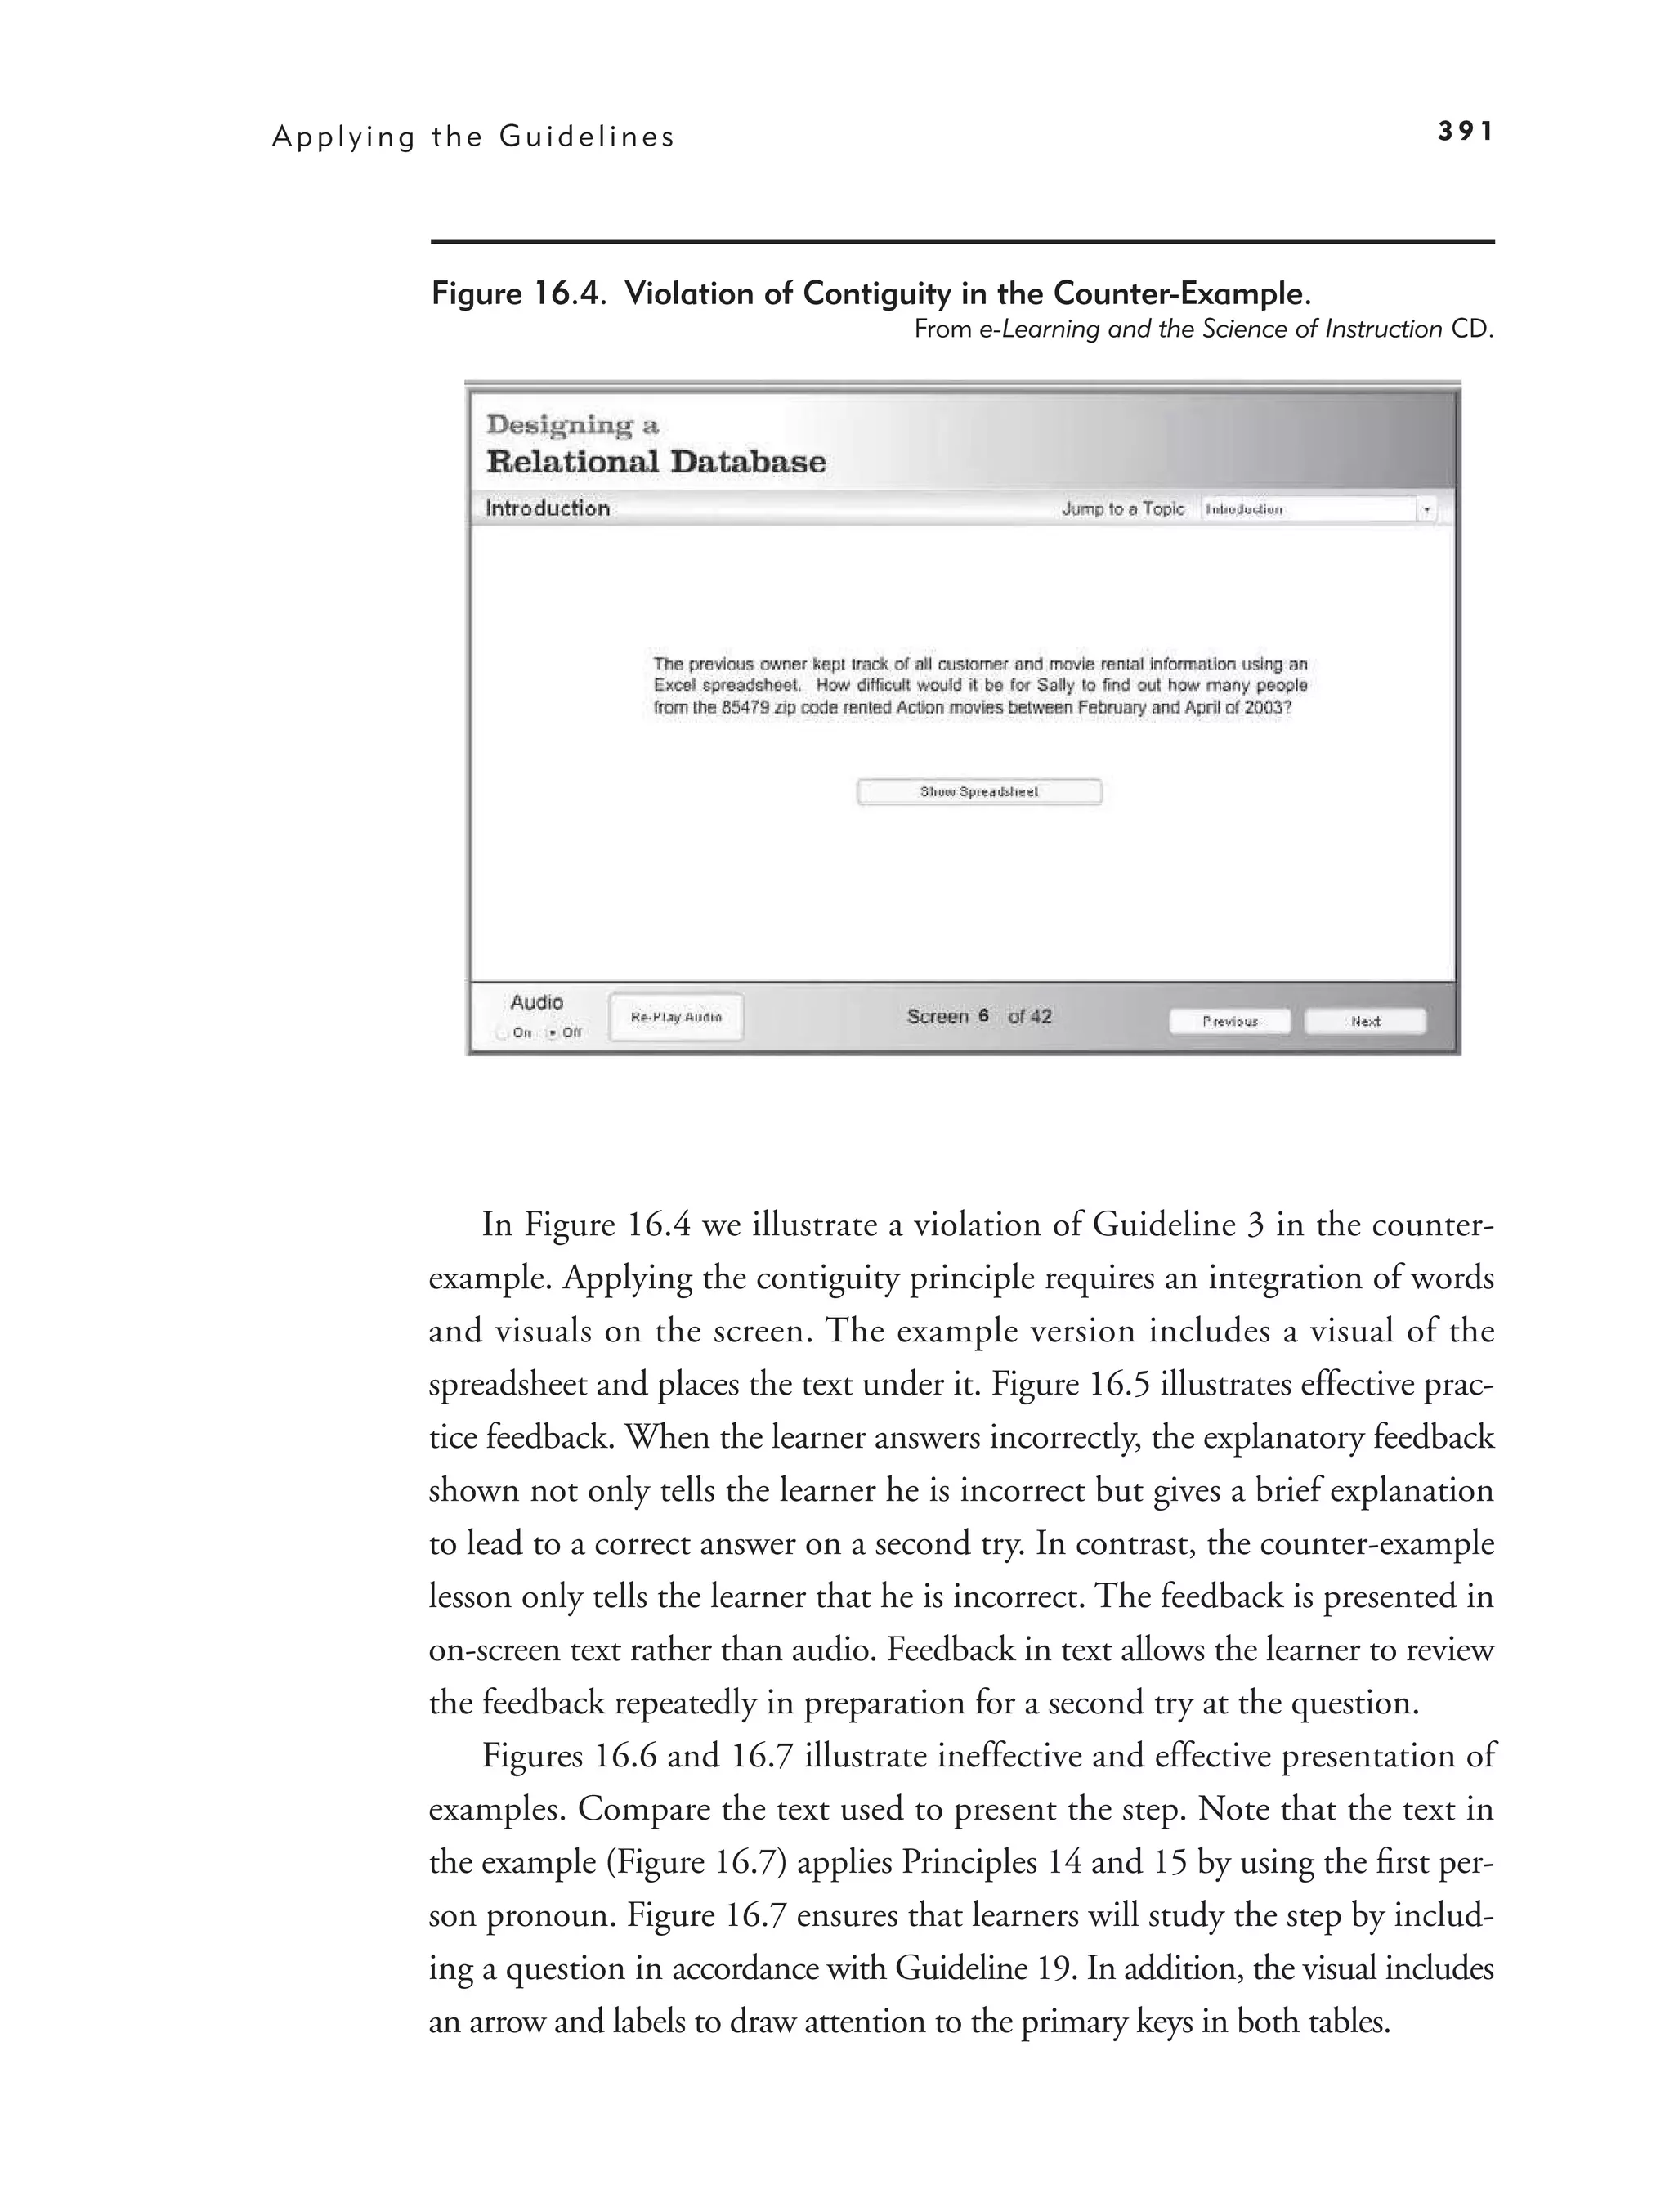
Asynchronous Samples One and Two: Design of Databases 388
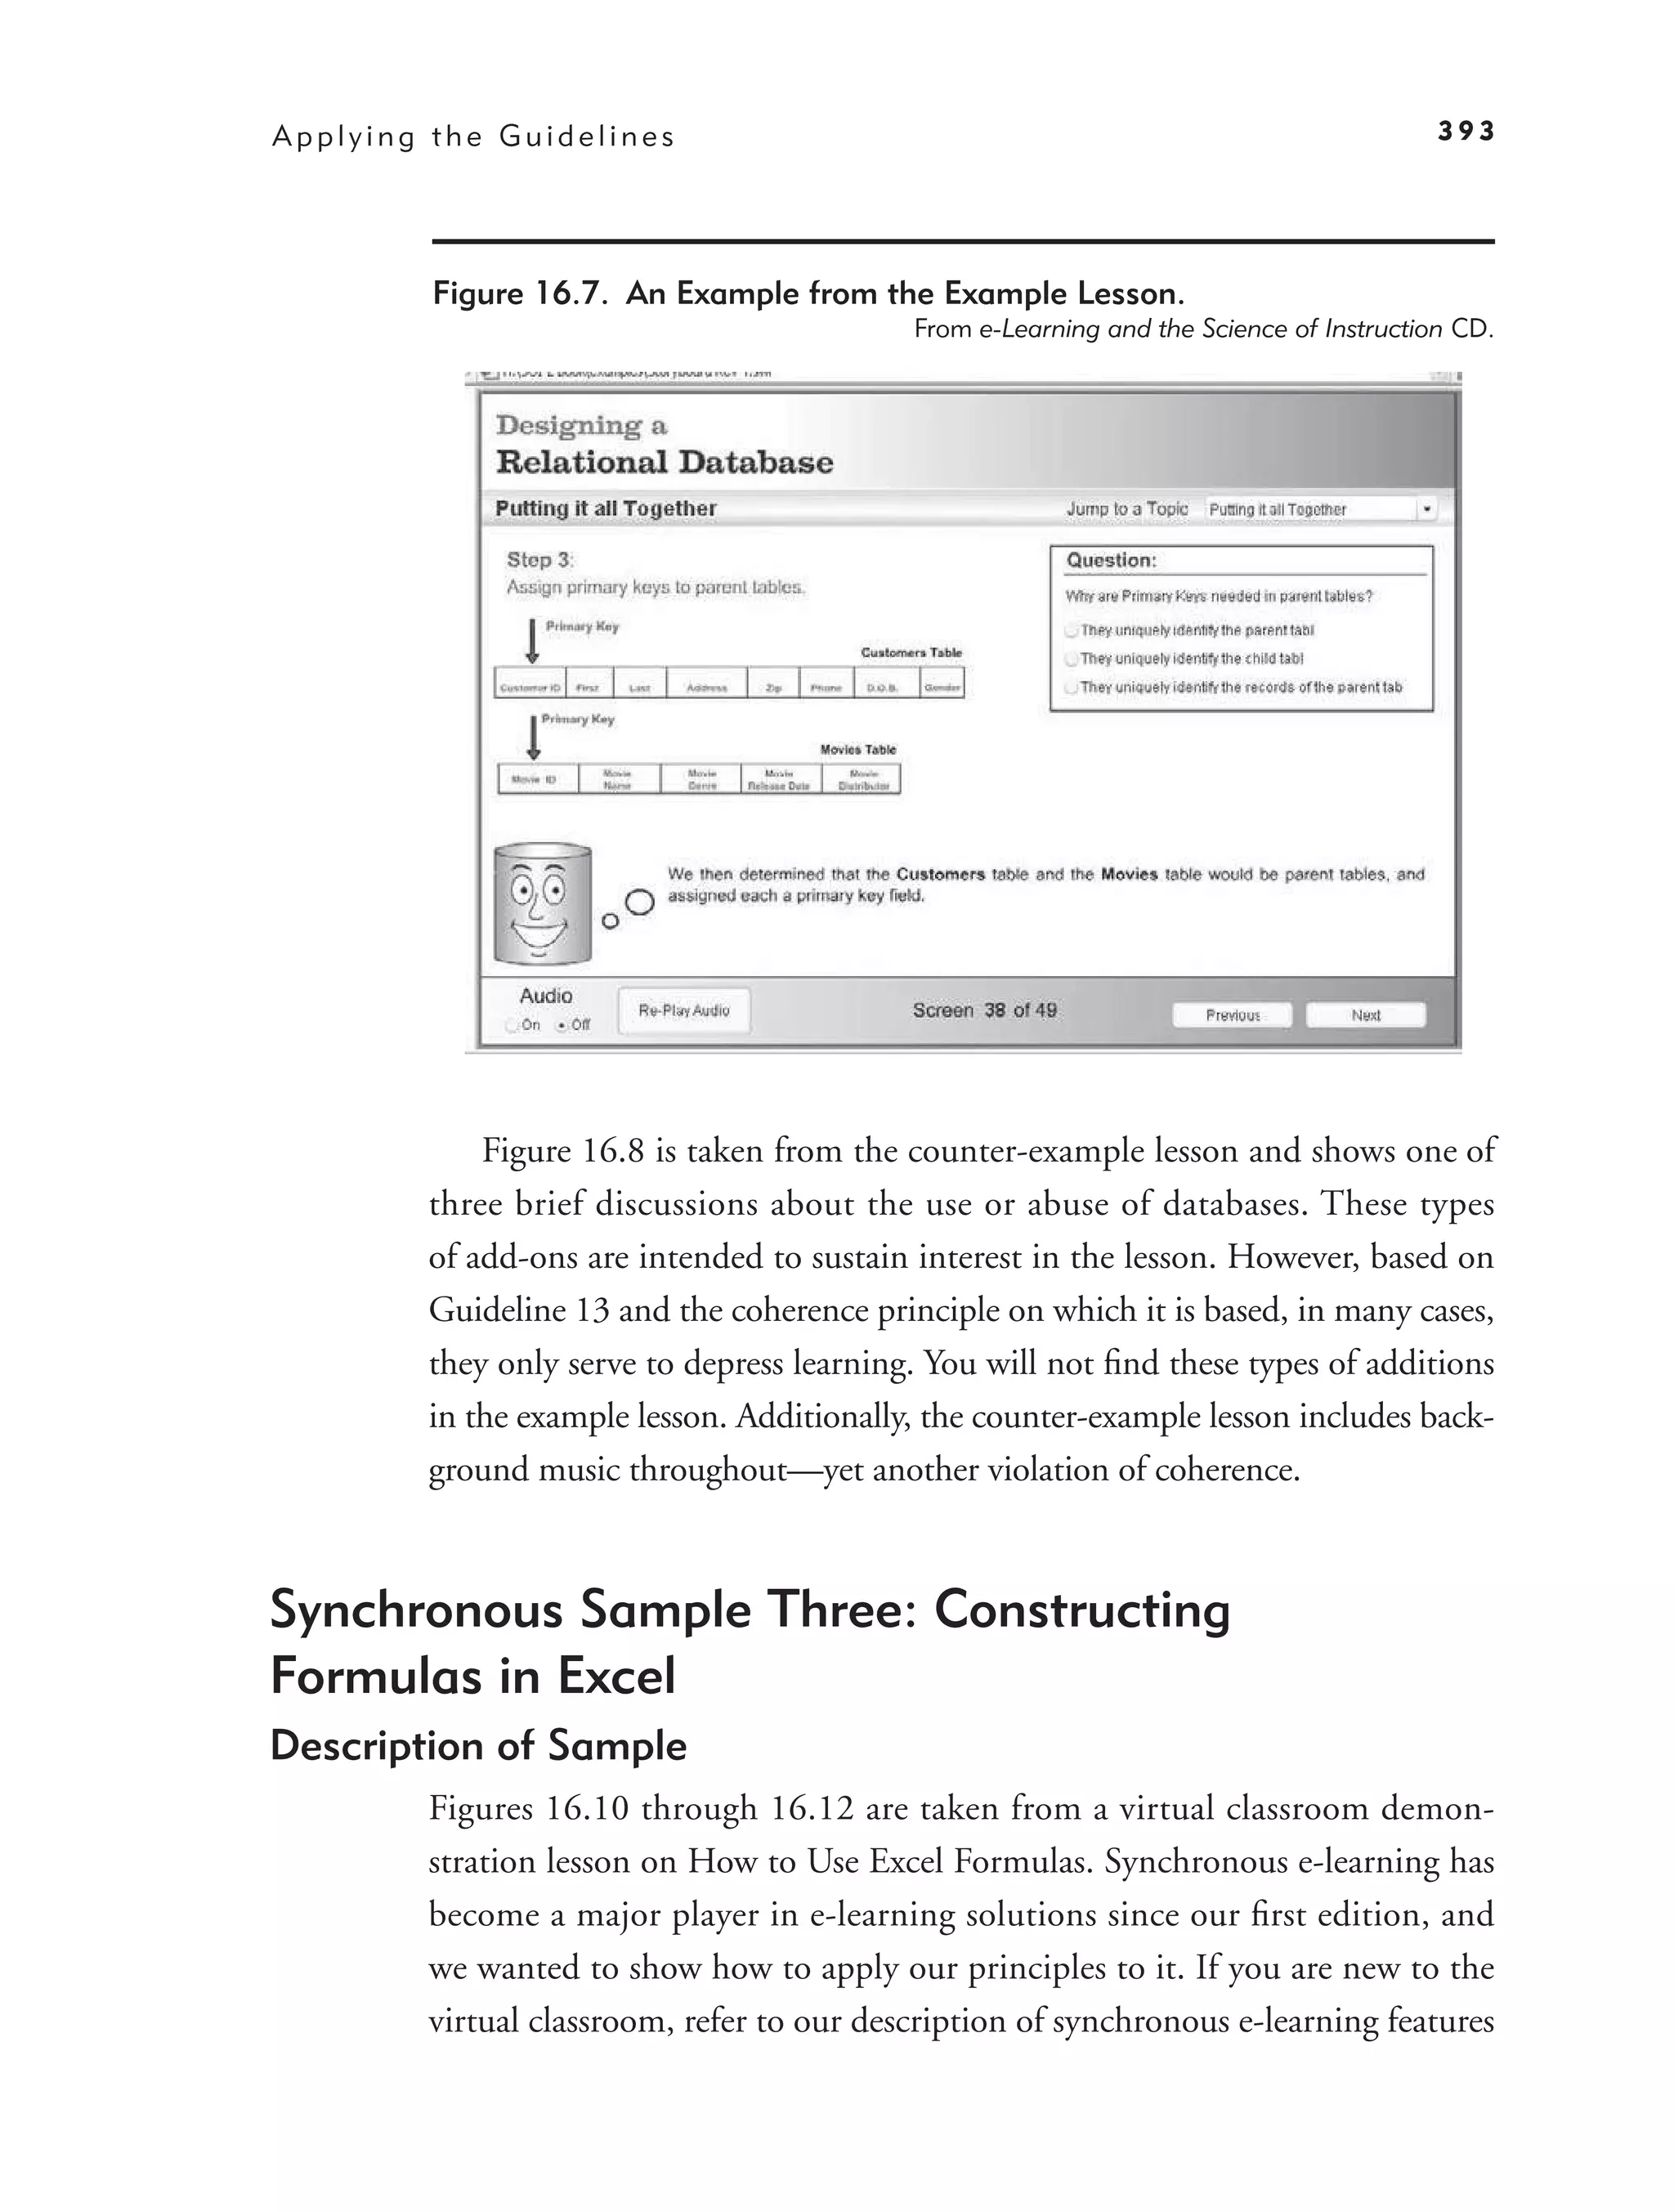
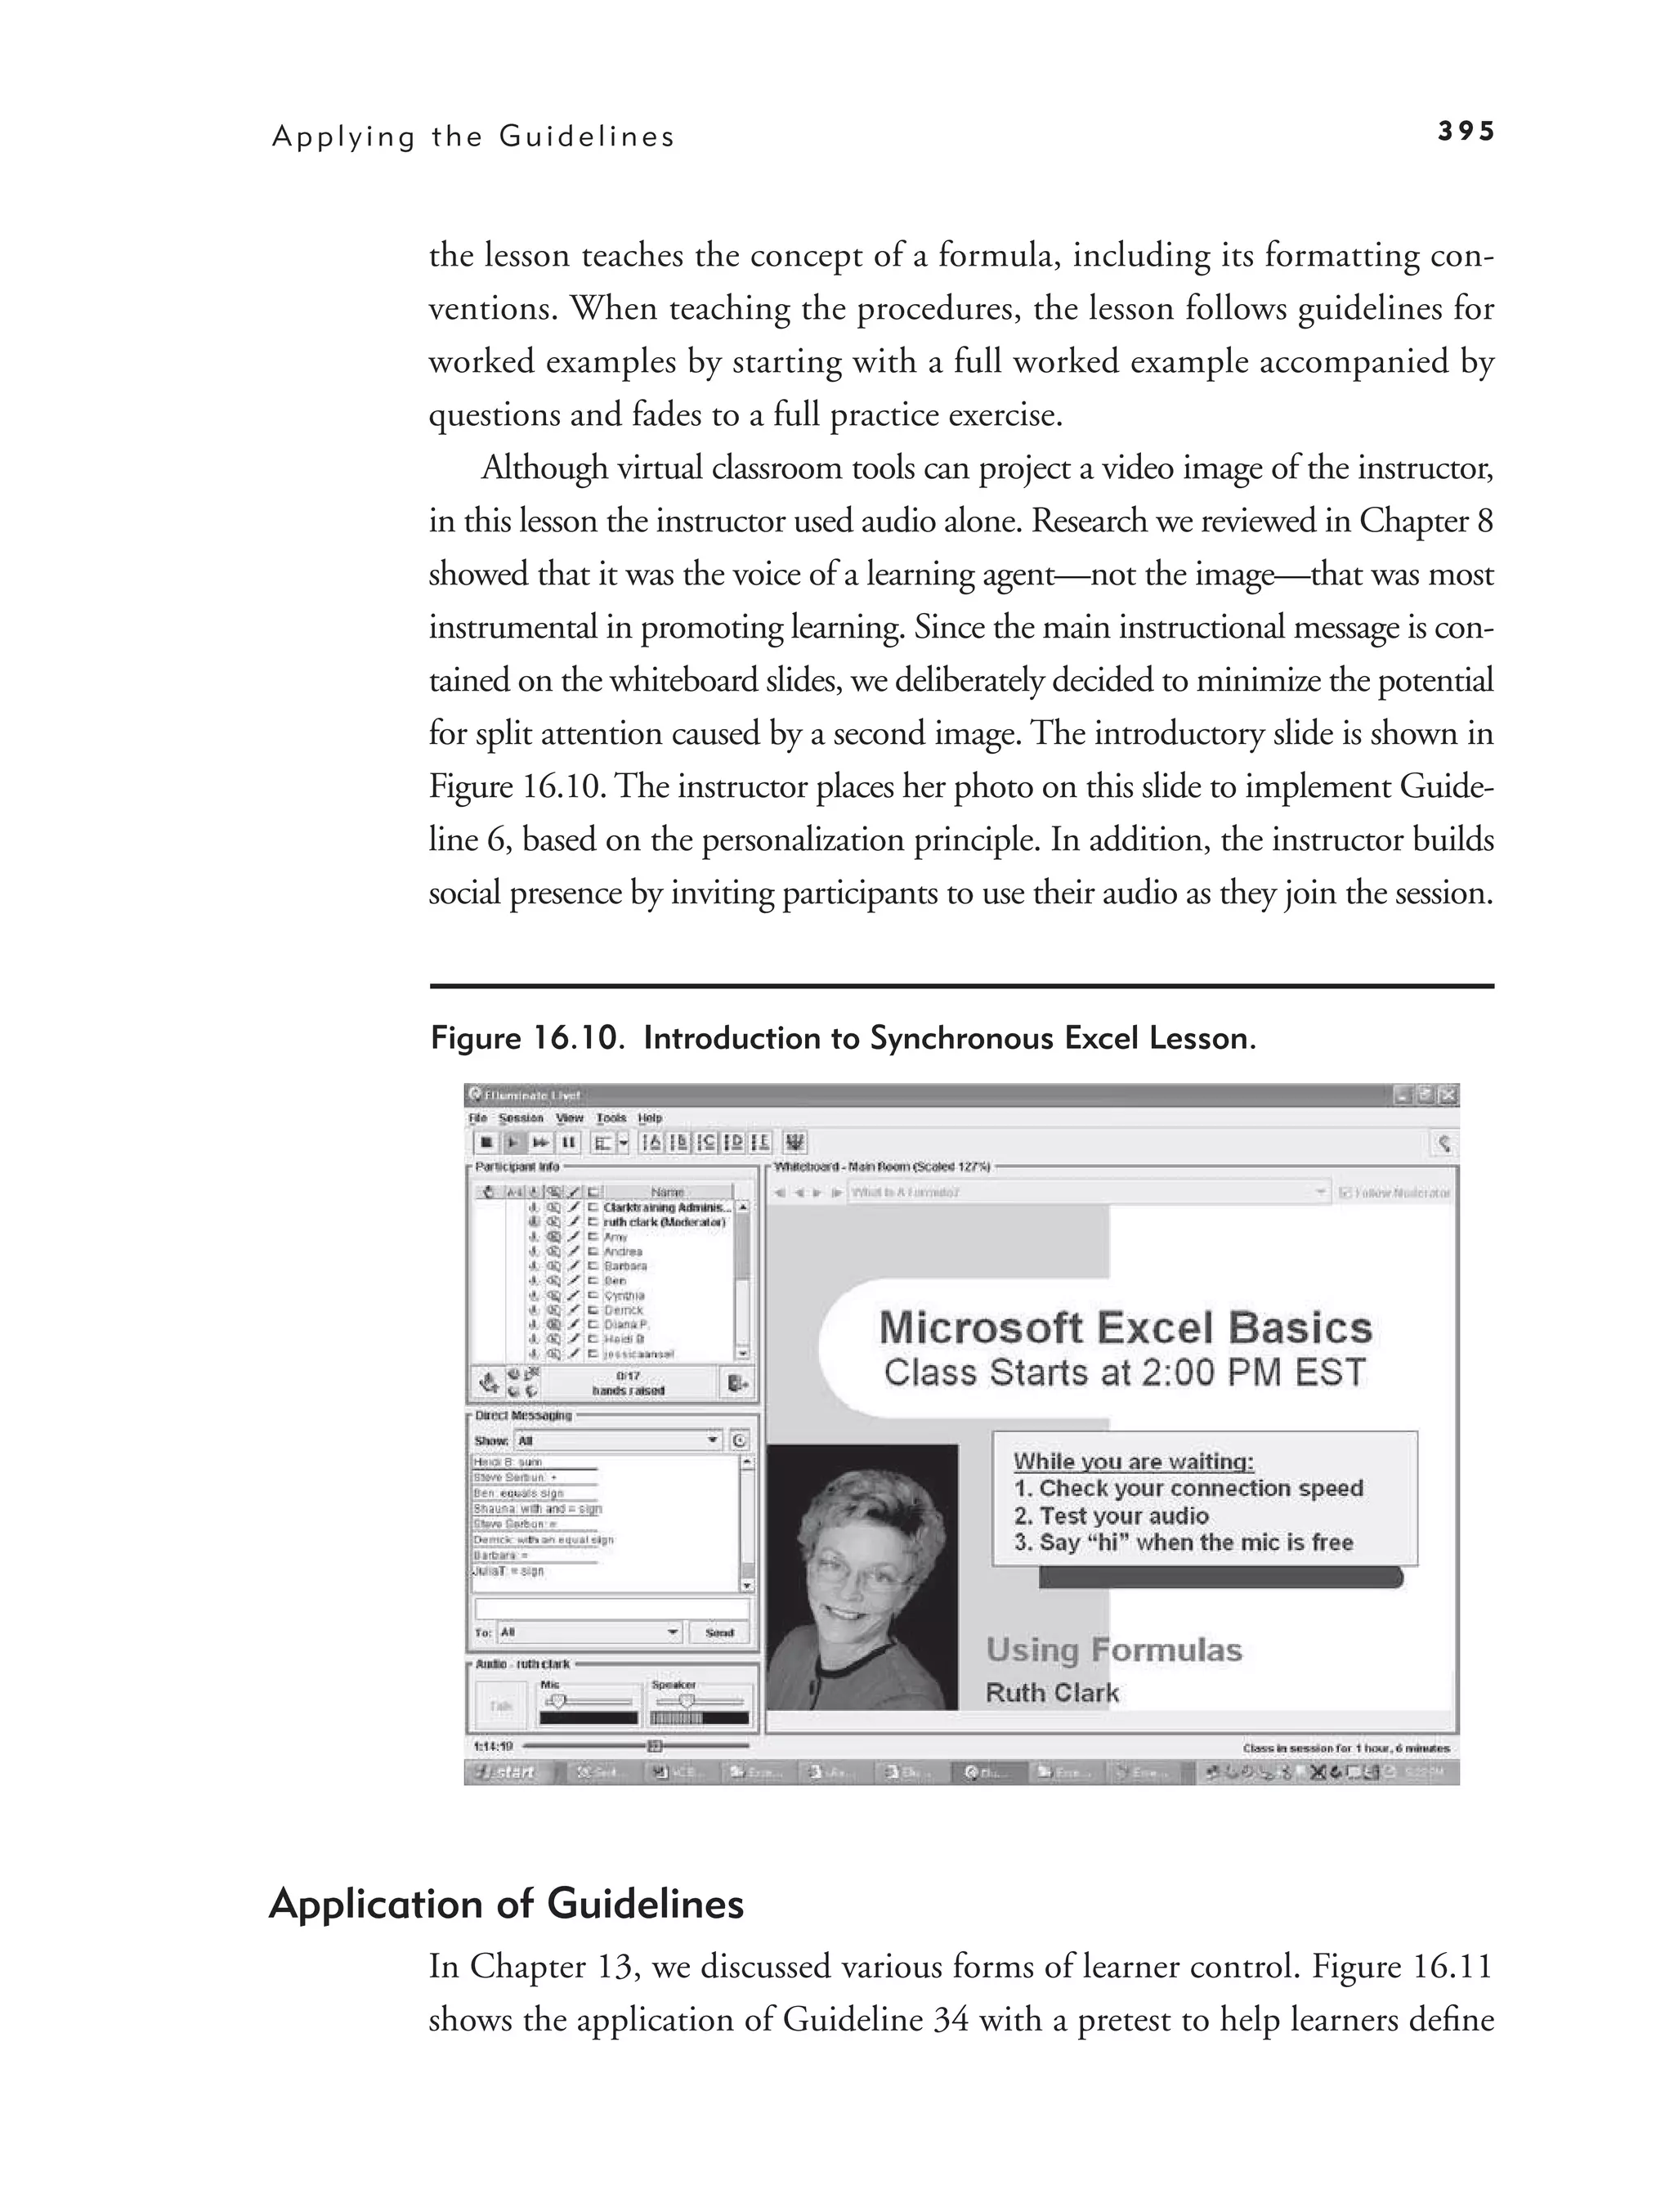
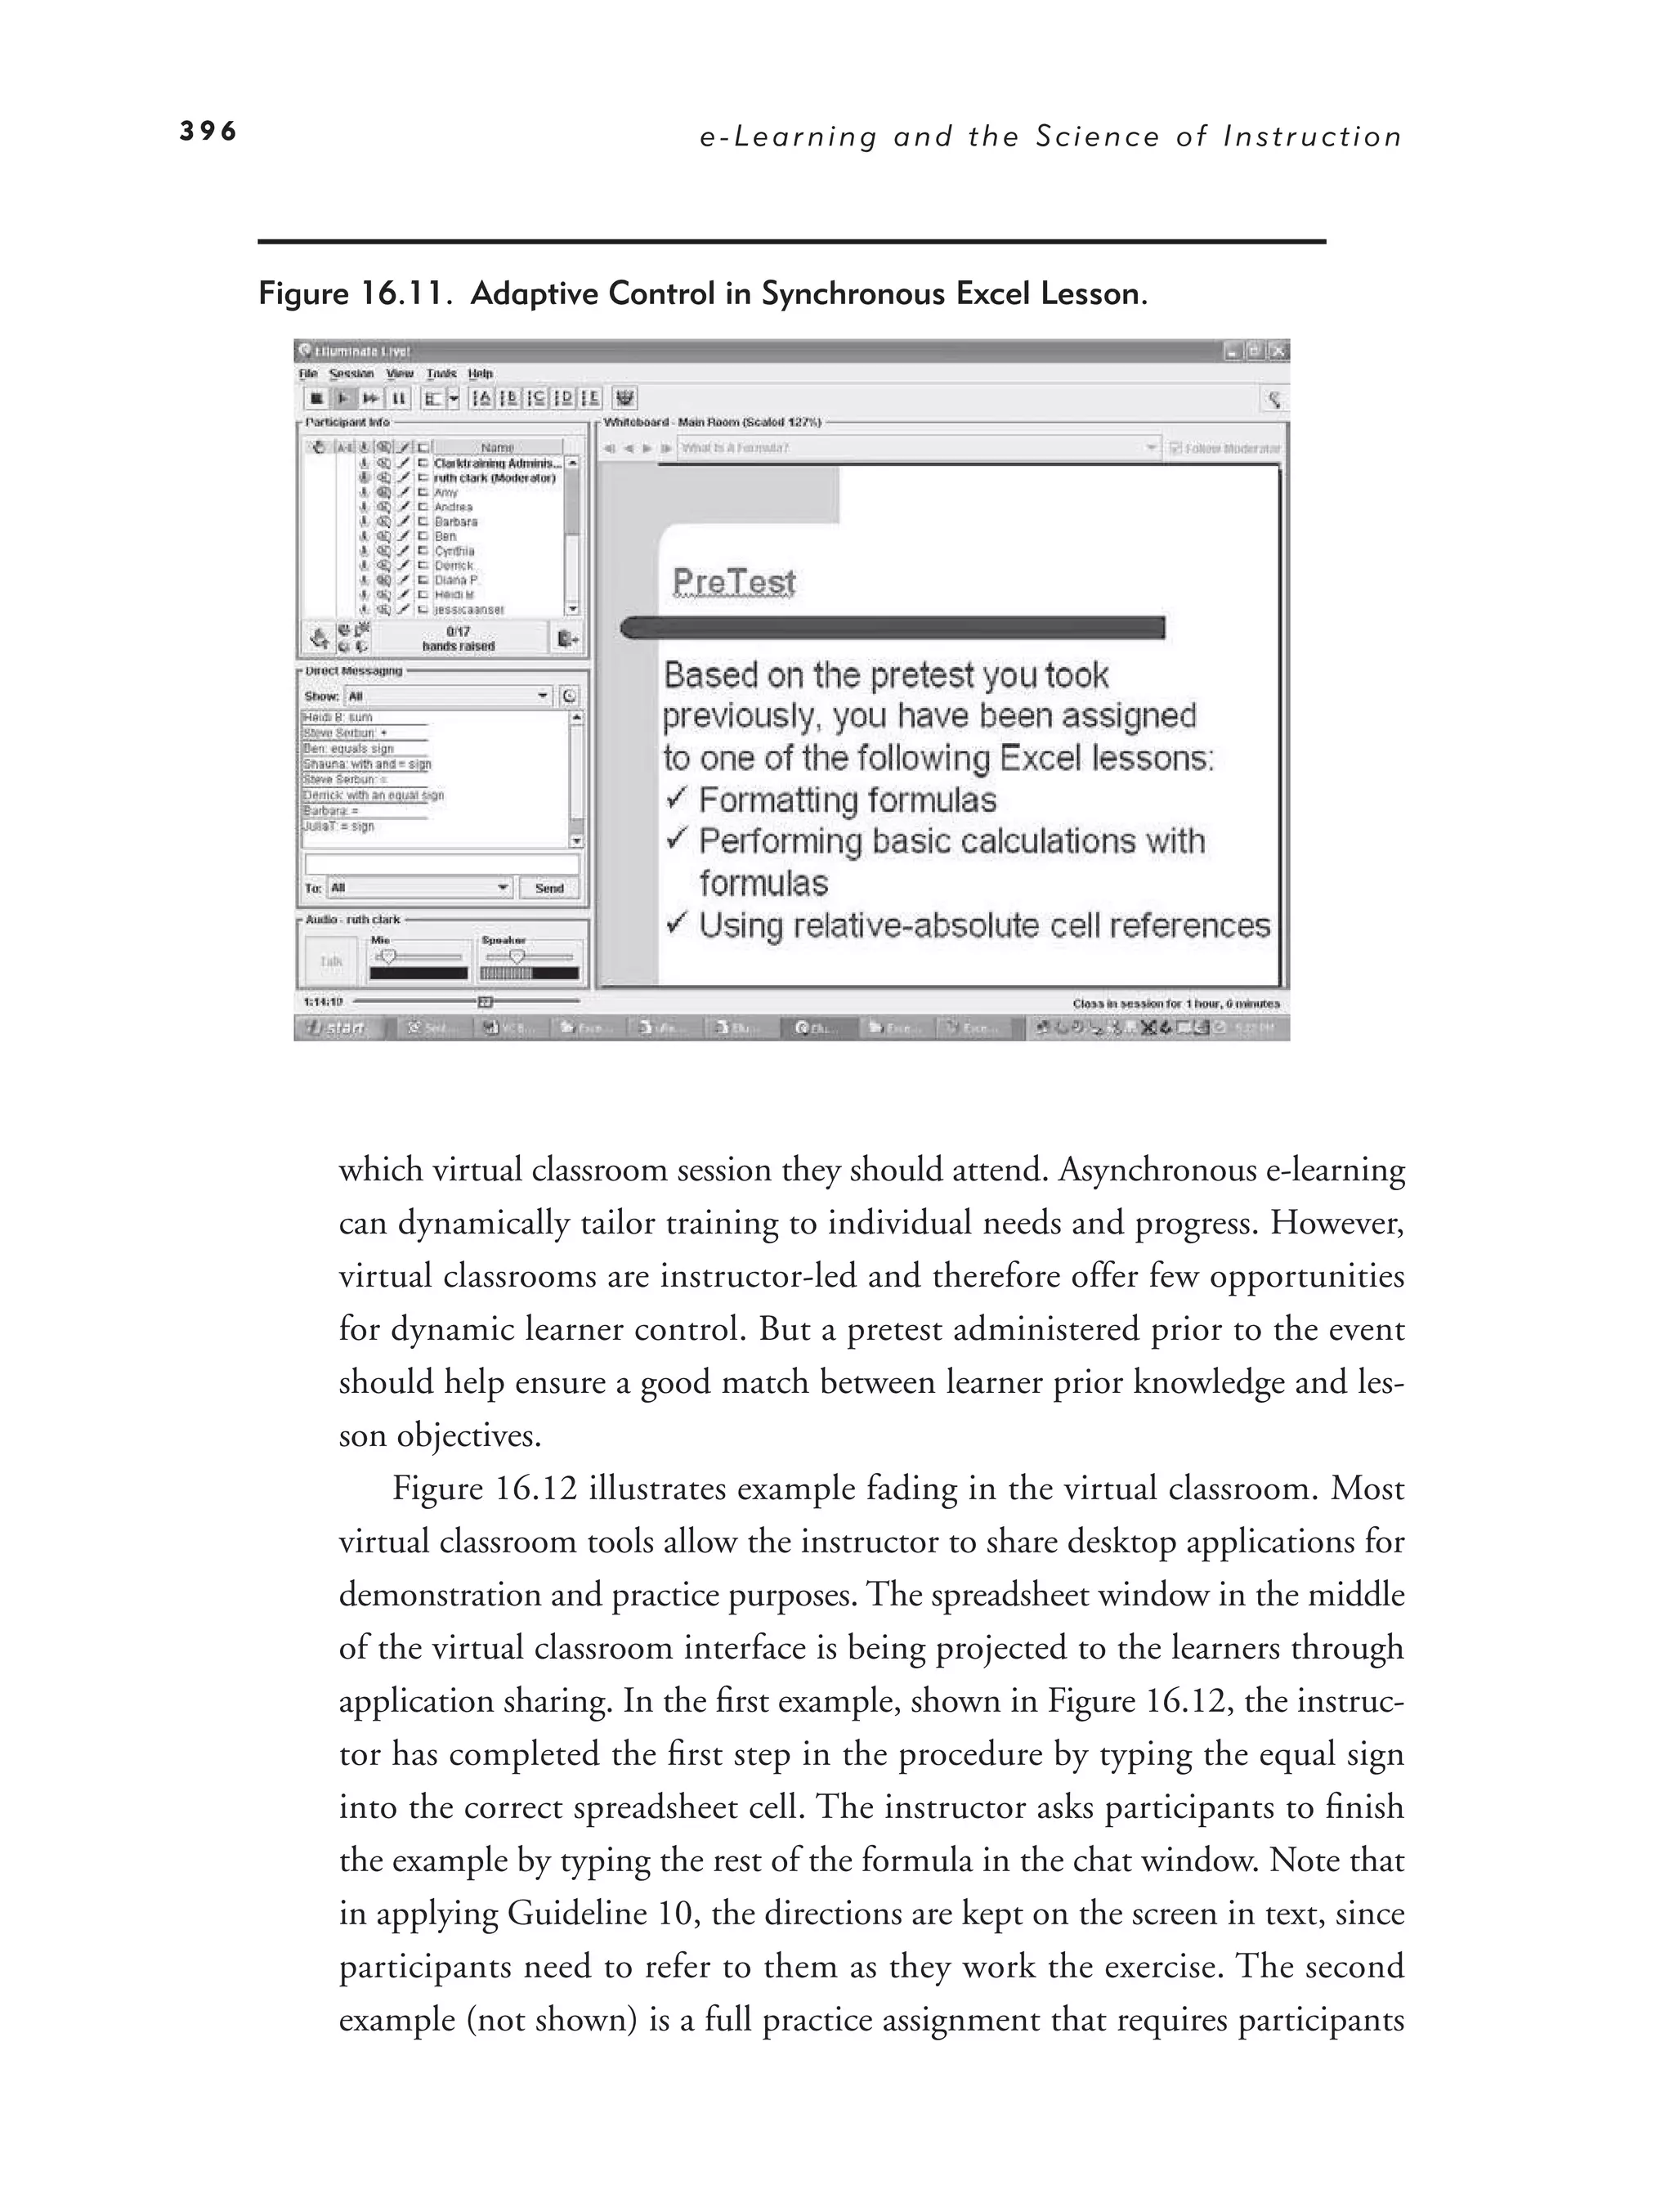
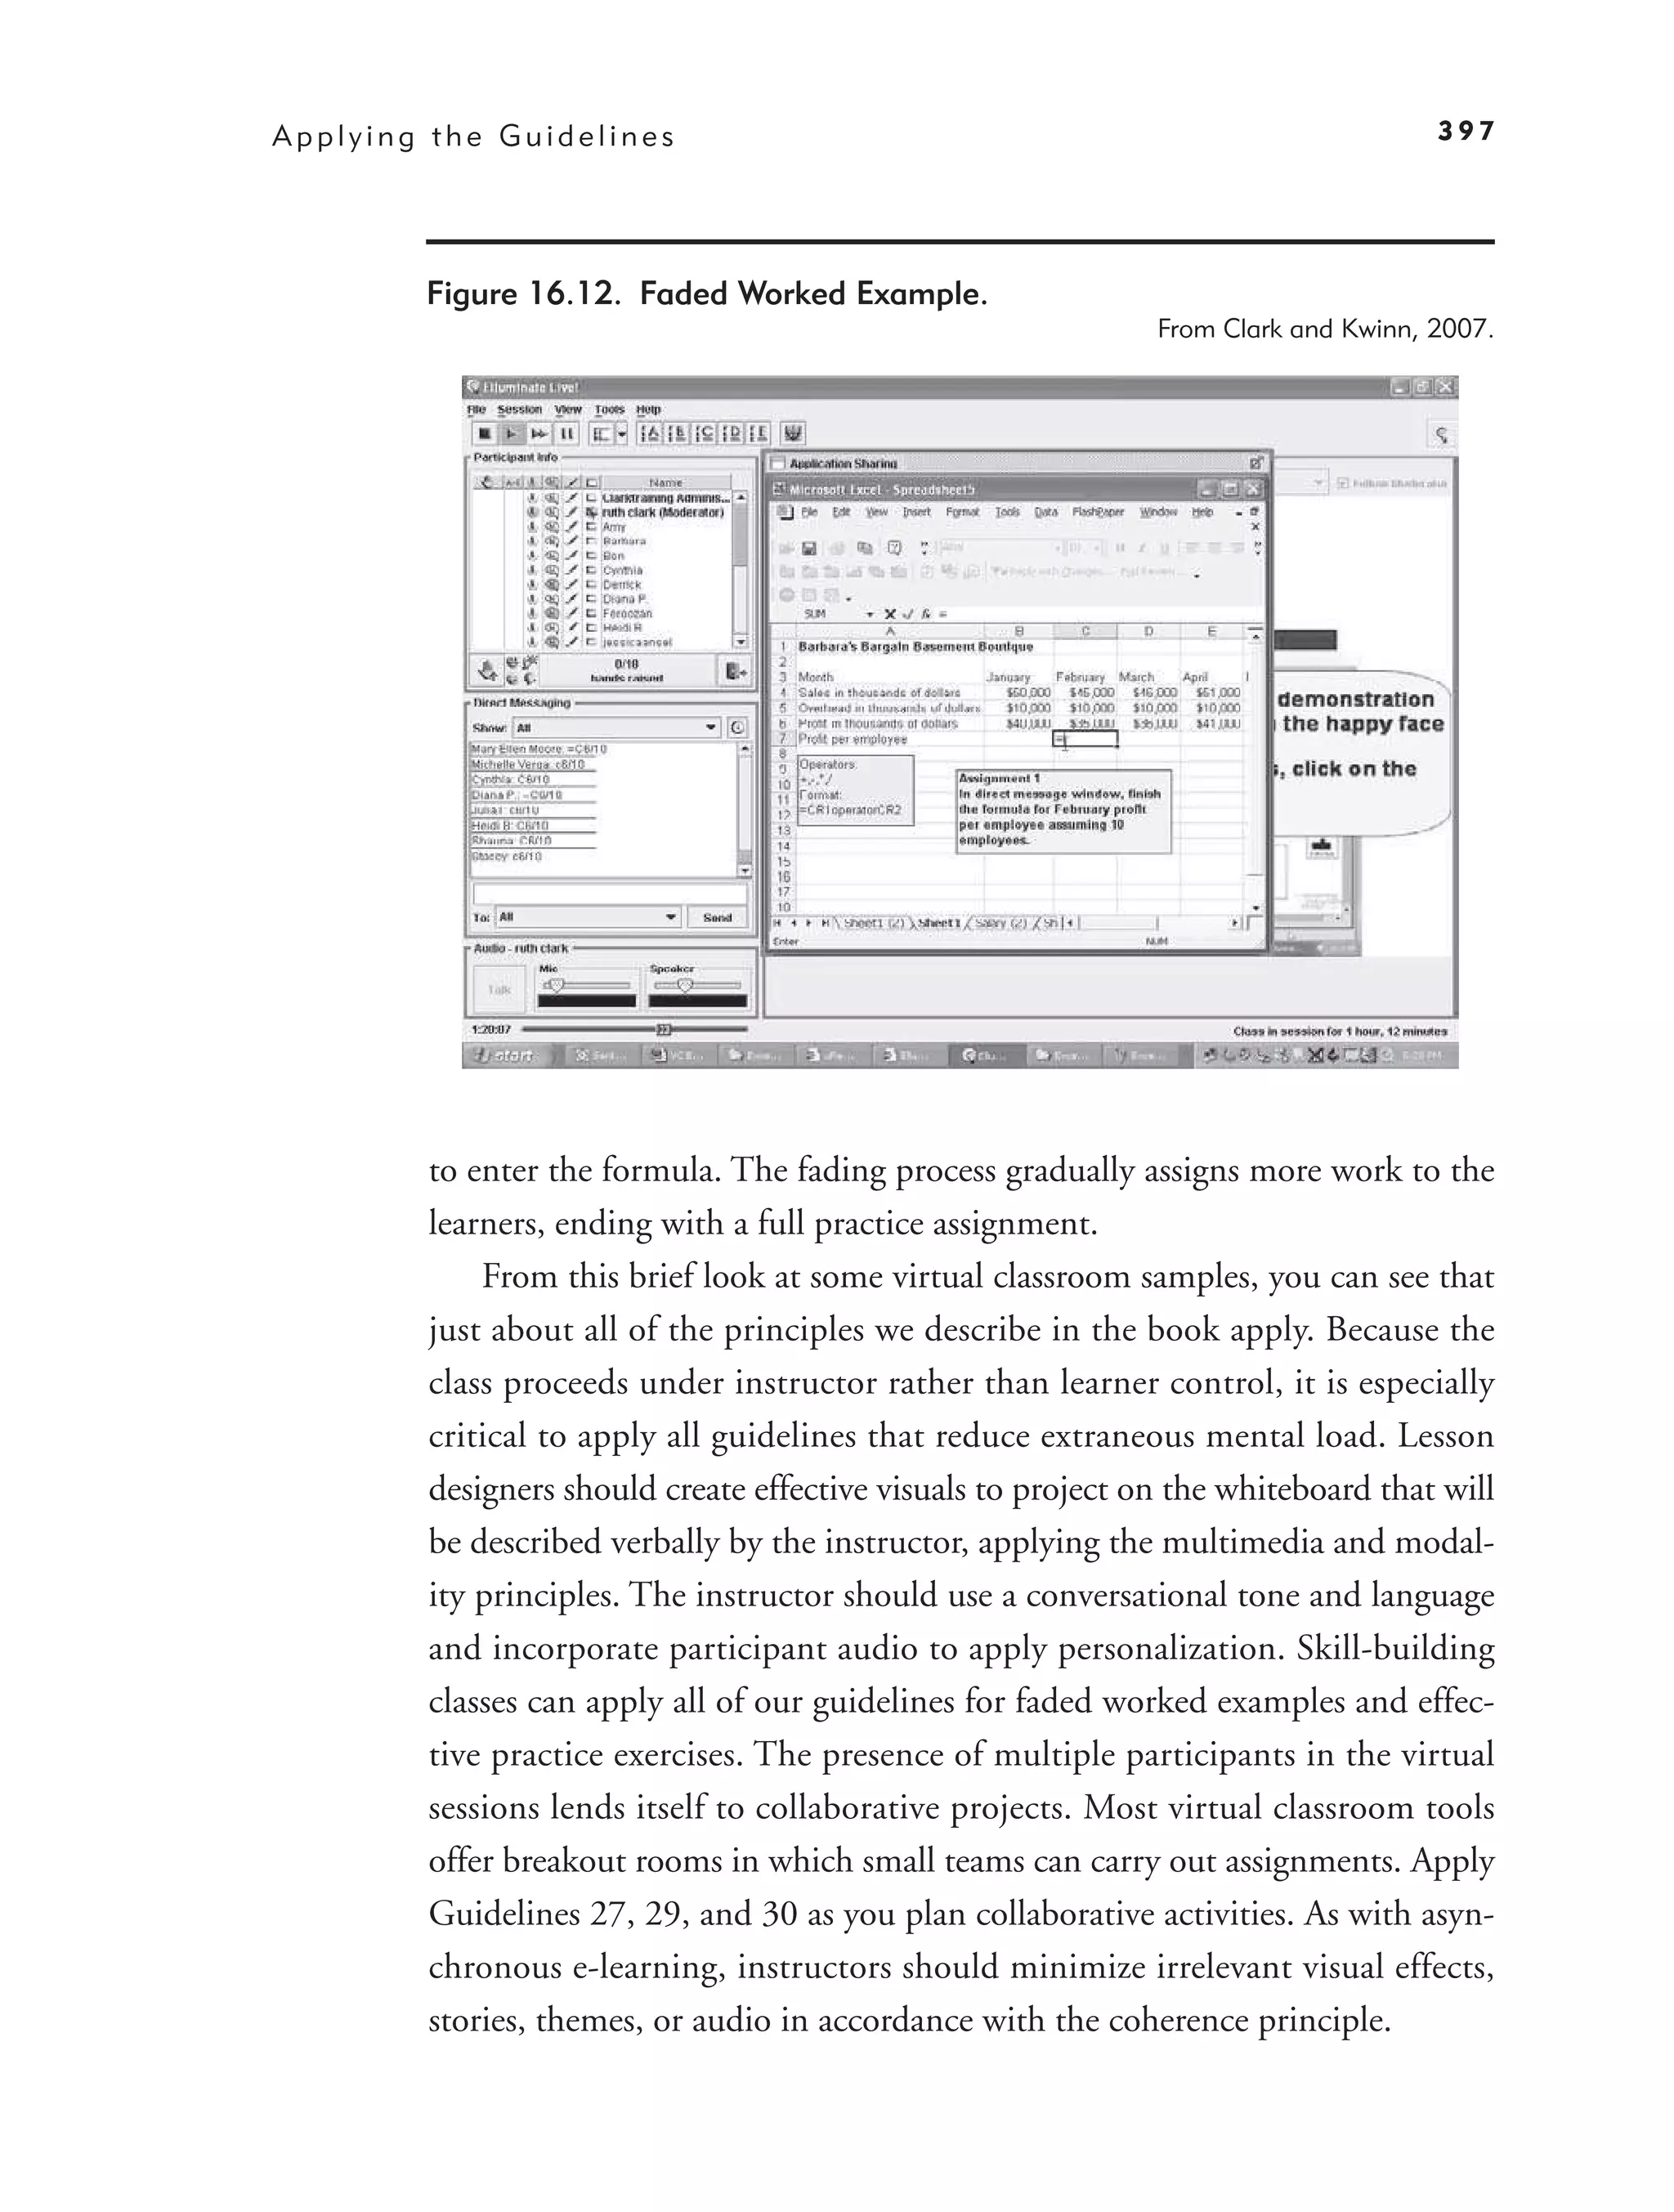
Synchronous Sample Three: Constructing Formulas in Excel 393
15.
xiv Contents
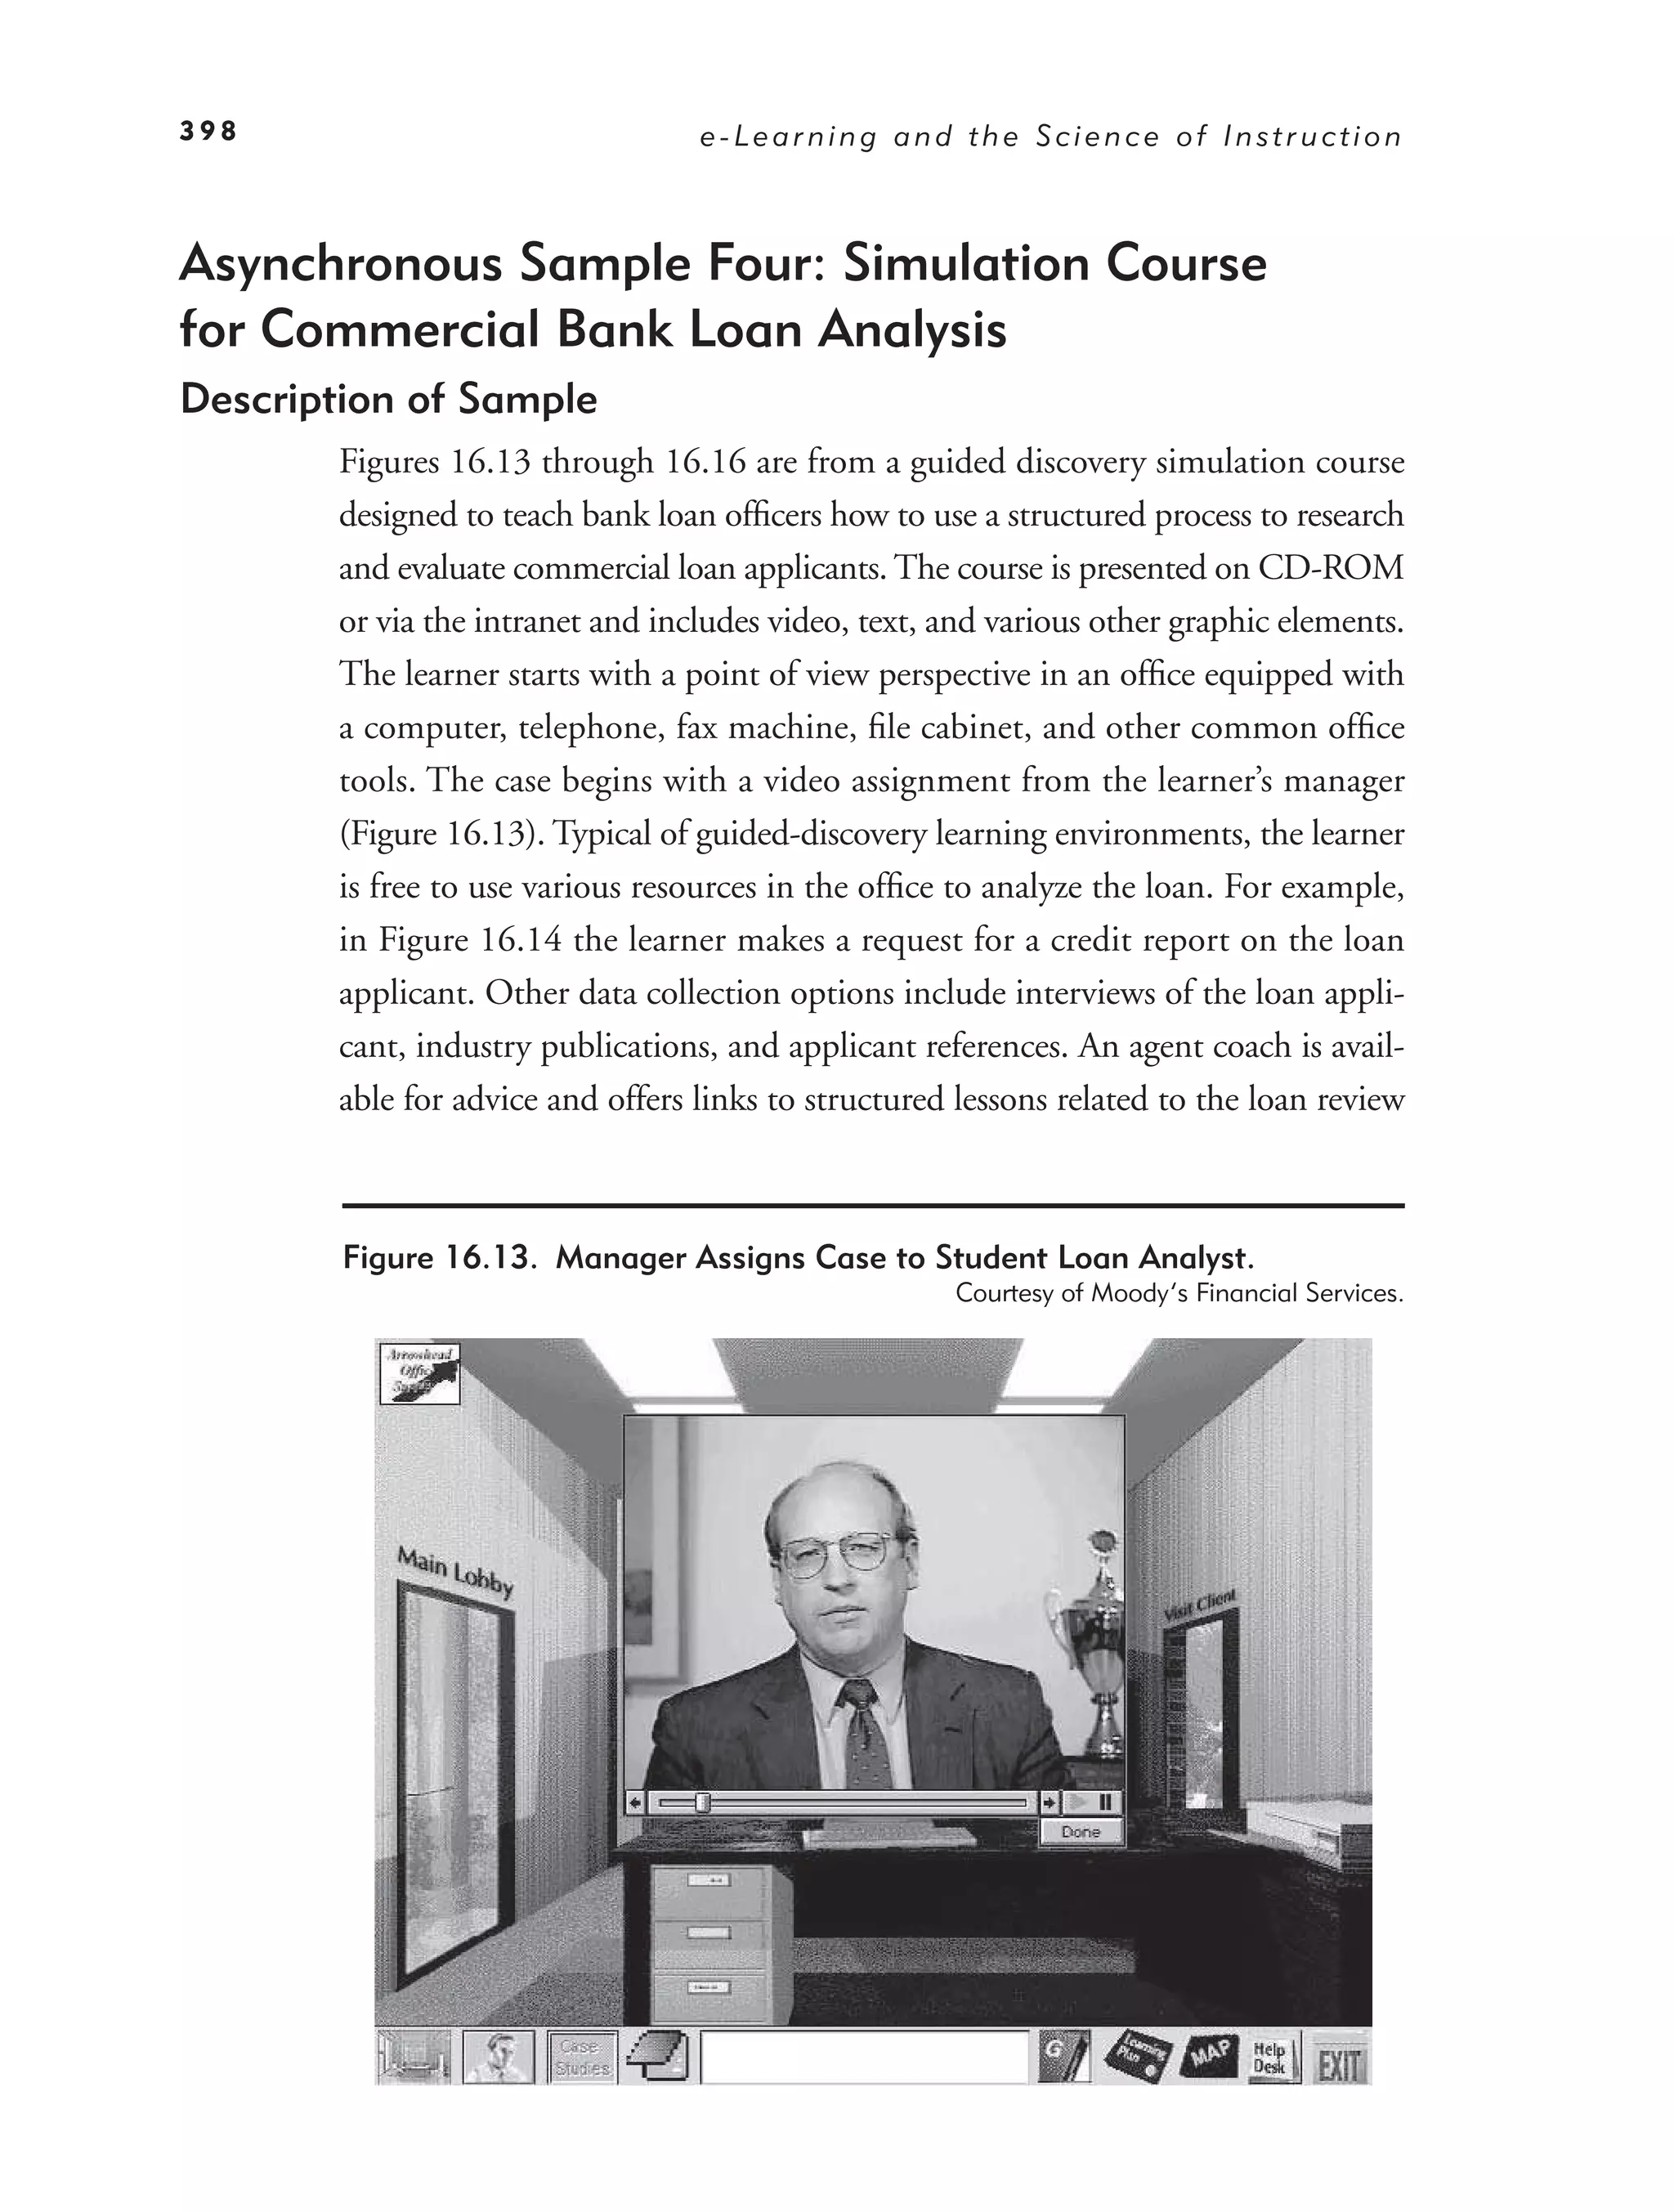
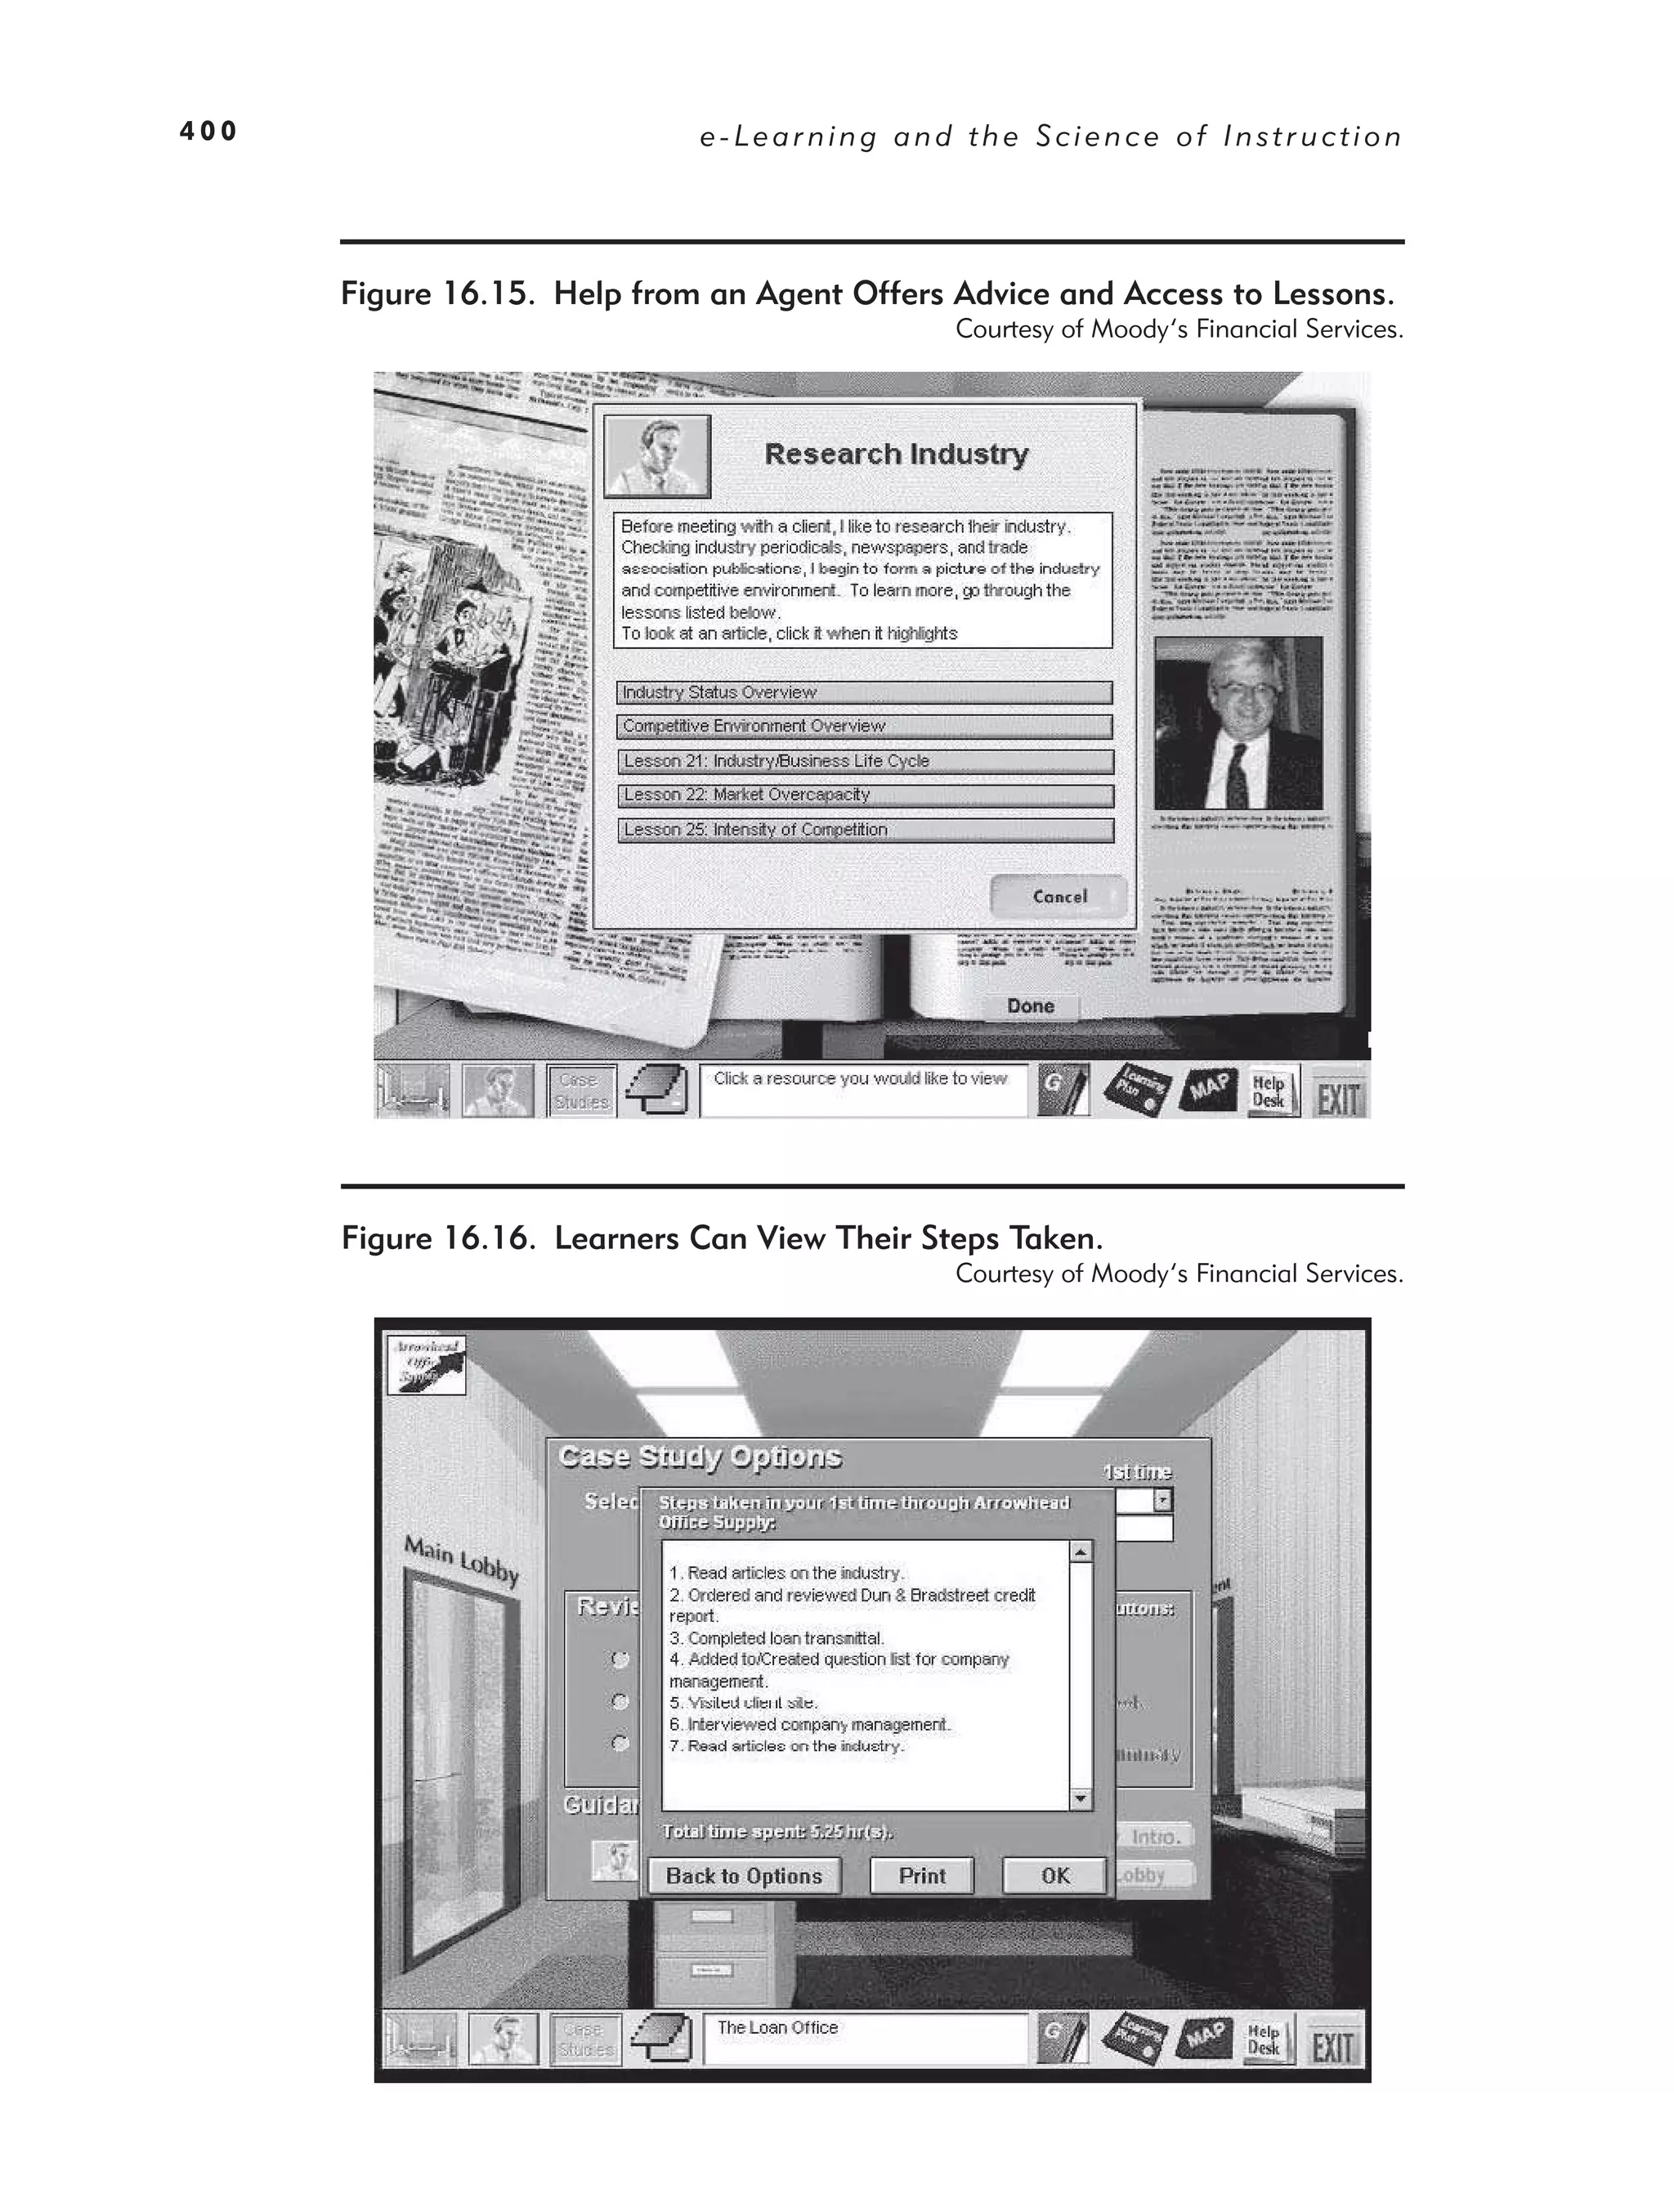
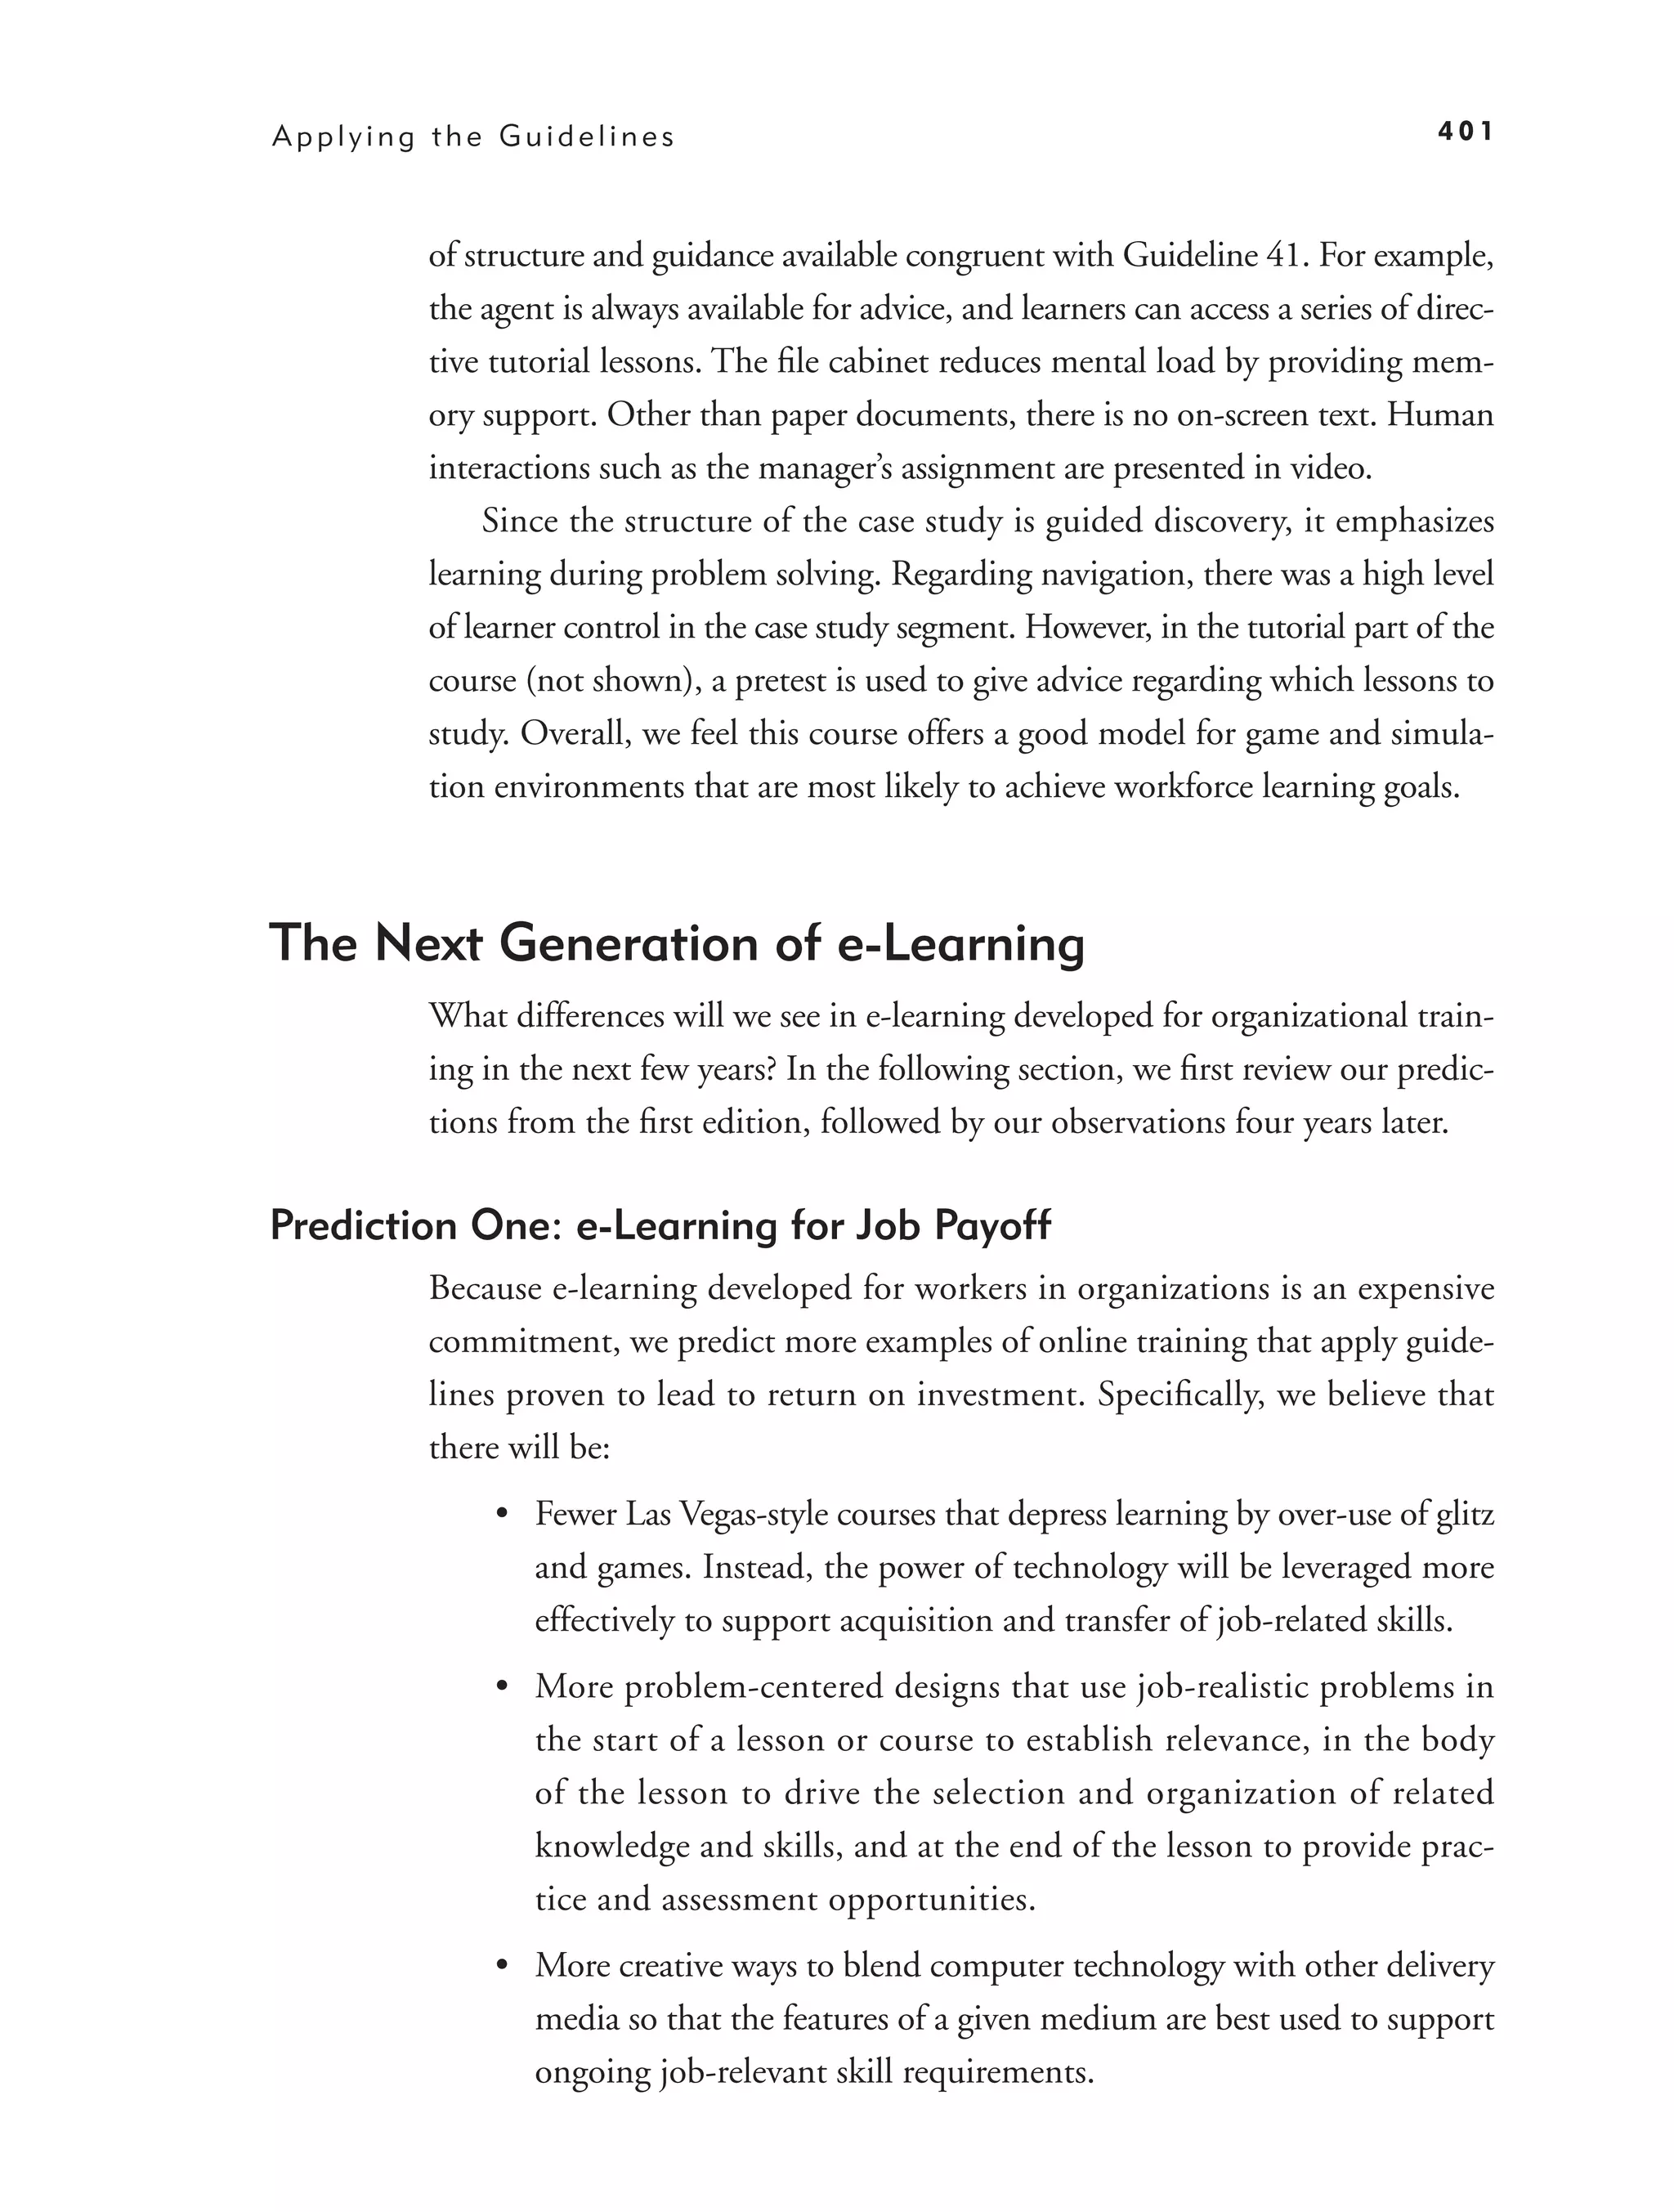
Asynchronous Sample Four: Simulation Course for
Commercial Bank Loan Analysis 398
The Next Generation of e-Learning 401
In Conclusion 403
References 405
Glossary 427
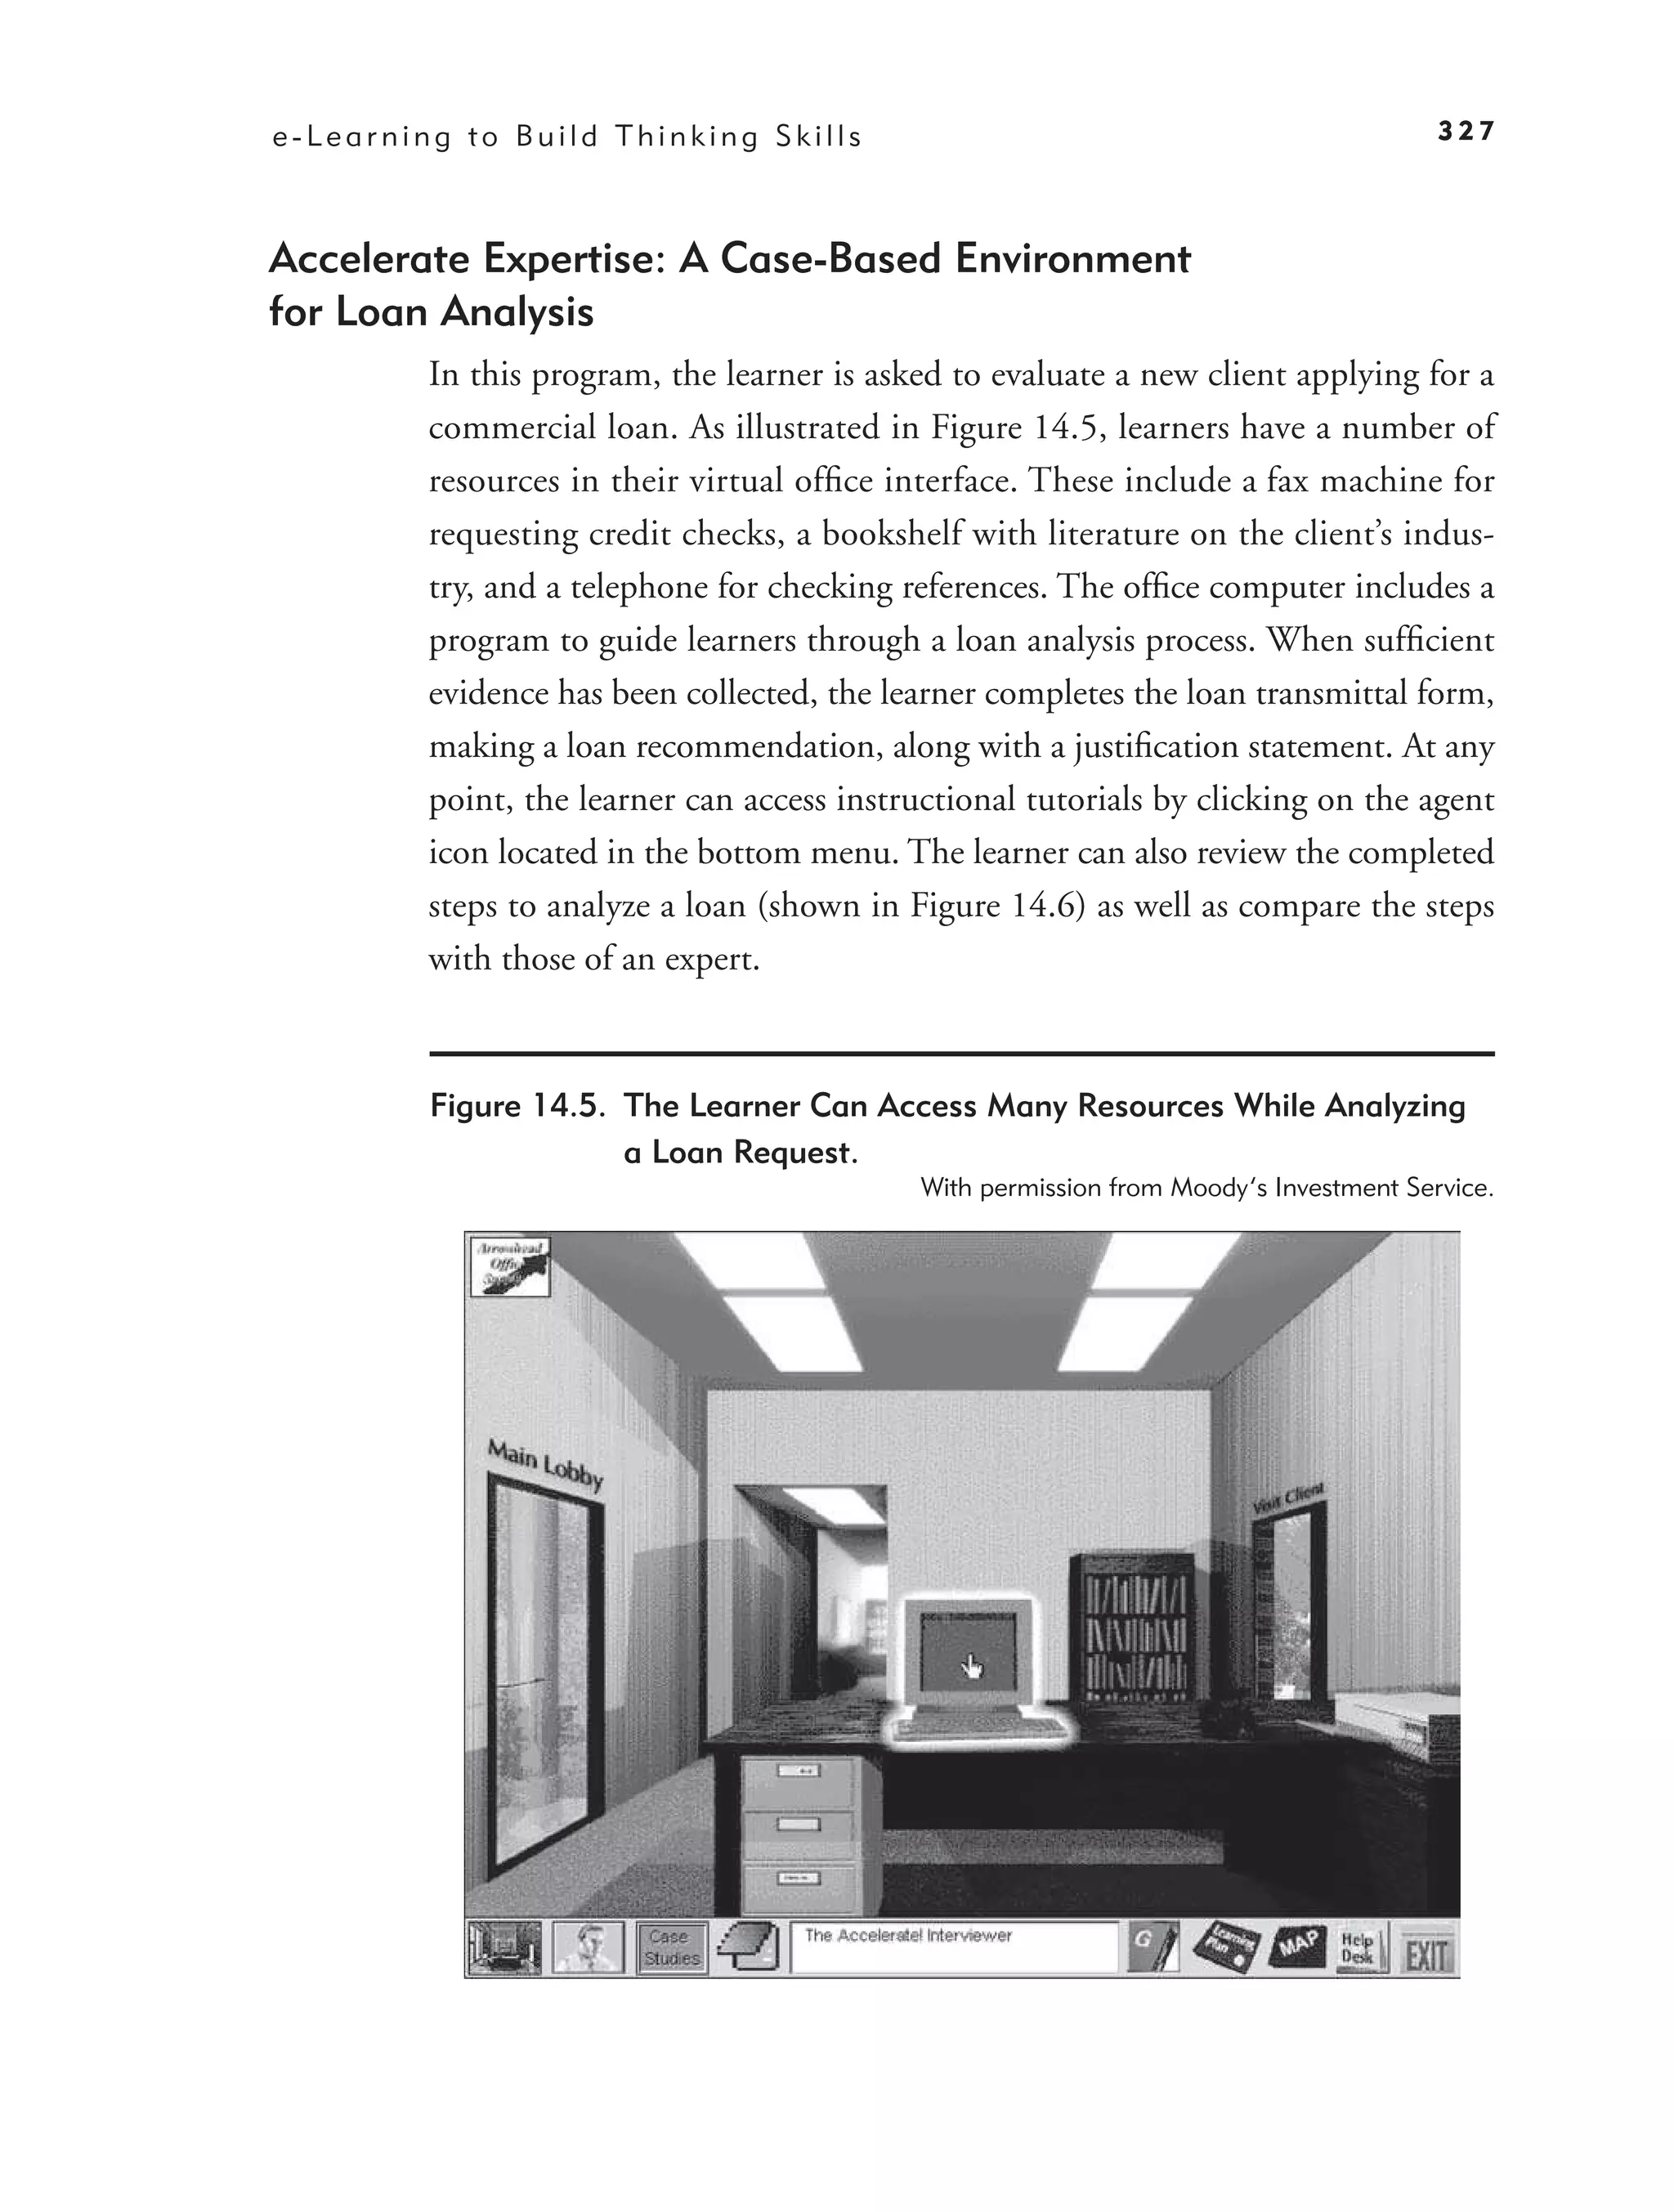
List of Tables and Figures 445
Name Index 455
Subject Index 459
About the Authors 473
How to Use the CD-ROM 475
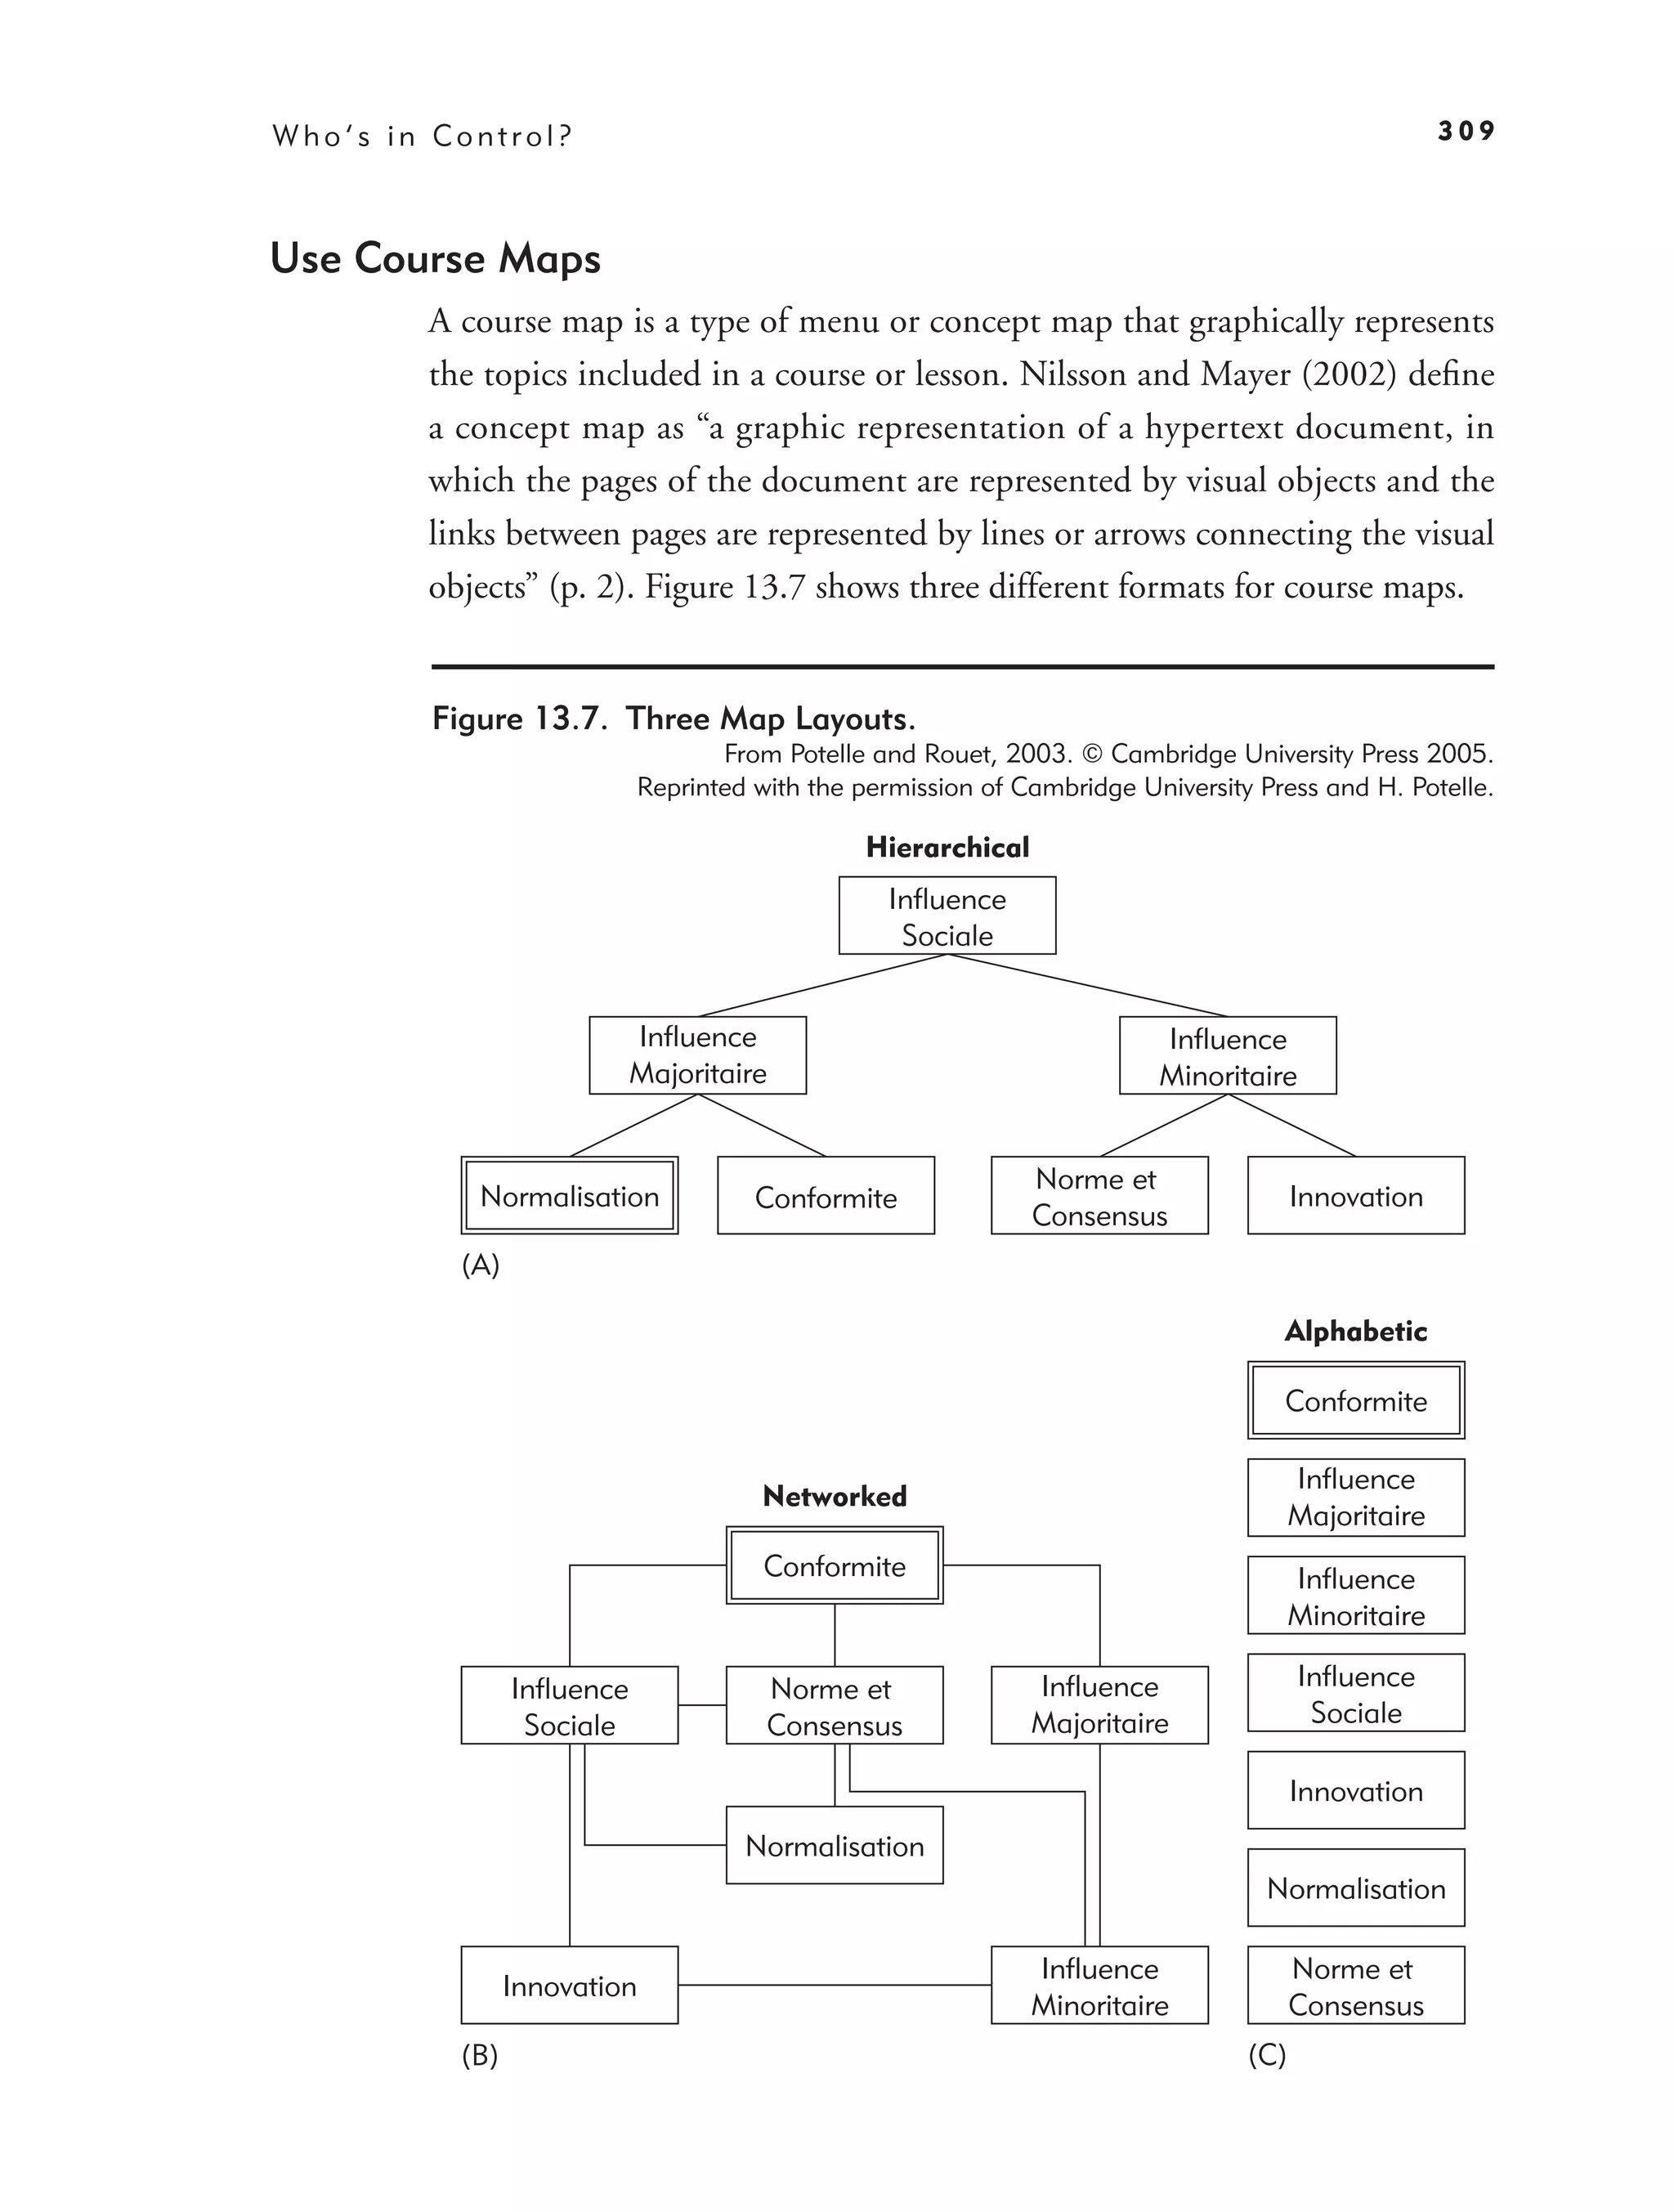
Pfeiffer Publication Guide 477
16.
ACKNOWLEDGMENTS
I N THIS NEW EDITION, we have added sample lessons on a CD
to illustrate the application and violation of our principles. We benefited
from the instructional design, programming, and audio expertise of Alan
Koenig of Arizona State University, who created these multimedia samples.
We also thank the following researchers or practitioners who reviewed
our work and/or gave us access to their examples and research for inclusion
in this second edition:
Robert Atkinson, Arizona State University
Education Networks of Australia
Susanne Lajoie, McGill University
Herve Potelle, University of Poitres
Lloyd Rieber, University of Georgia
Dan Suthers, University of Hawaii
xv
17.
xvi Acknowledgments
Ruta Valaitis, McMaster University
Richard Van Eck, University of North Dakota
Finally, we are grateful to support from the Pfeiffer team and especially
to Matt Davis and Leslie Stephen for editorial support.
18.
INTRODUCTION
GETTING THE MOSTFROM THIS RESOURCE
Purpose
The training field is undergoing an evolution from a craft based on fads
and folk wisdom to a profession that integrates evidence into the design and
development of its products. Part of the training revolution has been driven
by the use of digital technology to manage and deliver instructional solutions.
This book provides you with evidence-based guidelines for both self-study
(asynchronous) and virtual classroom (synchronous) forms of e-learning.
Here you will read the guidelines, the evidence, and examples to shape your
decisions about the design, development, and evaluation of e-learning.
Audience
If you are a designer, developer, or consumer of e-learning, you can use
the guidelines in this book to ensure that your courseware meets human
psychological learning requirements. Although most of our examples focus
1
19.
2 e-Learning and the Science of Instruction
on workforce learning, we believe instructional professionals in the educa-
tional and academic arenas can equally benefit from our guidelines.
Package Components
Because many of our guidelines pertain to use of media elements such as audio
and animation that are difficult to illustrate in a book format, we have included
two examples on the accompanying CD. The CD includes the following items:
• How to Design a Relational Database: Multimedia Example Lesson
• How to Design a Relational Database: Multimedia Counter-Example
Lesson
The counter-example lesson can be run in two ways. First, you can play the
lesson in regular mode. In addition, if you click on the commentary button,
you can hear a summary of the violations.
Our guidelines checklist, found in Chapter 16, is also placed on the CD,
allowing you to print it out and refer to it in a more convenient format.
Package Components
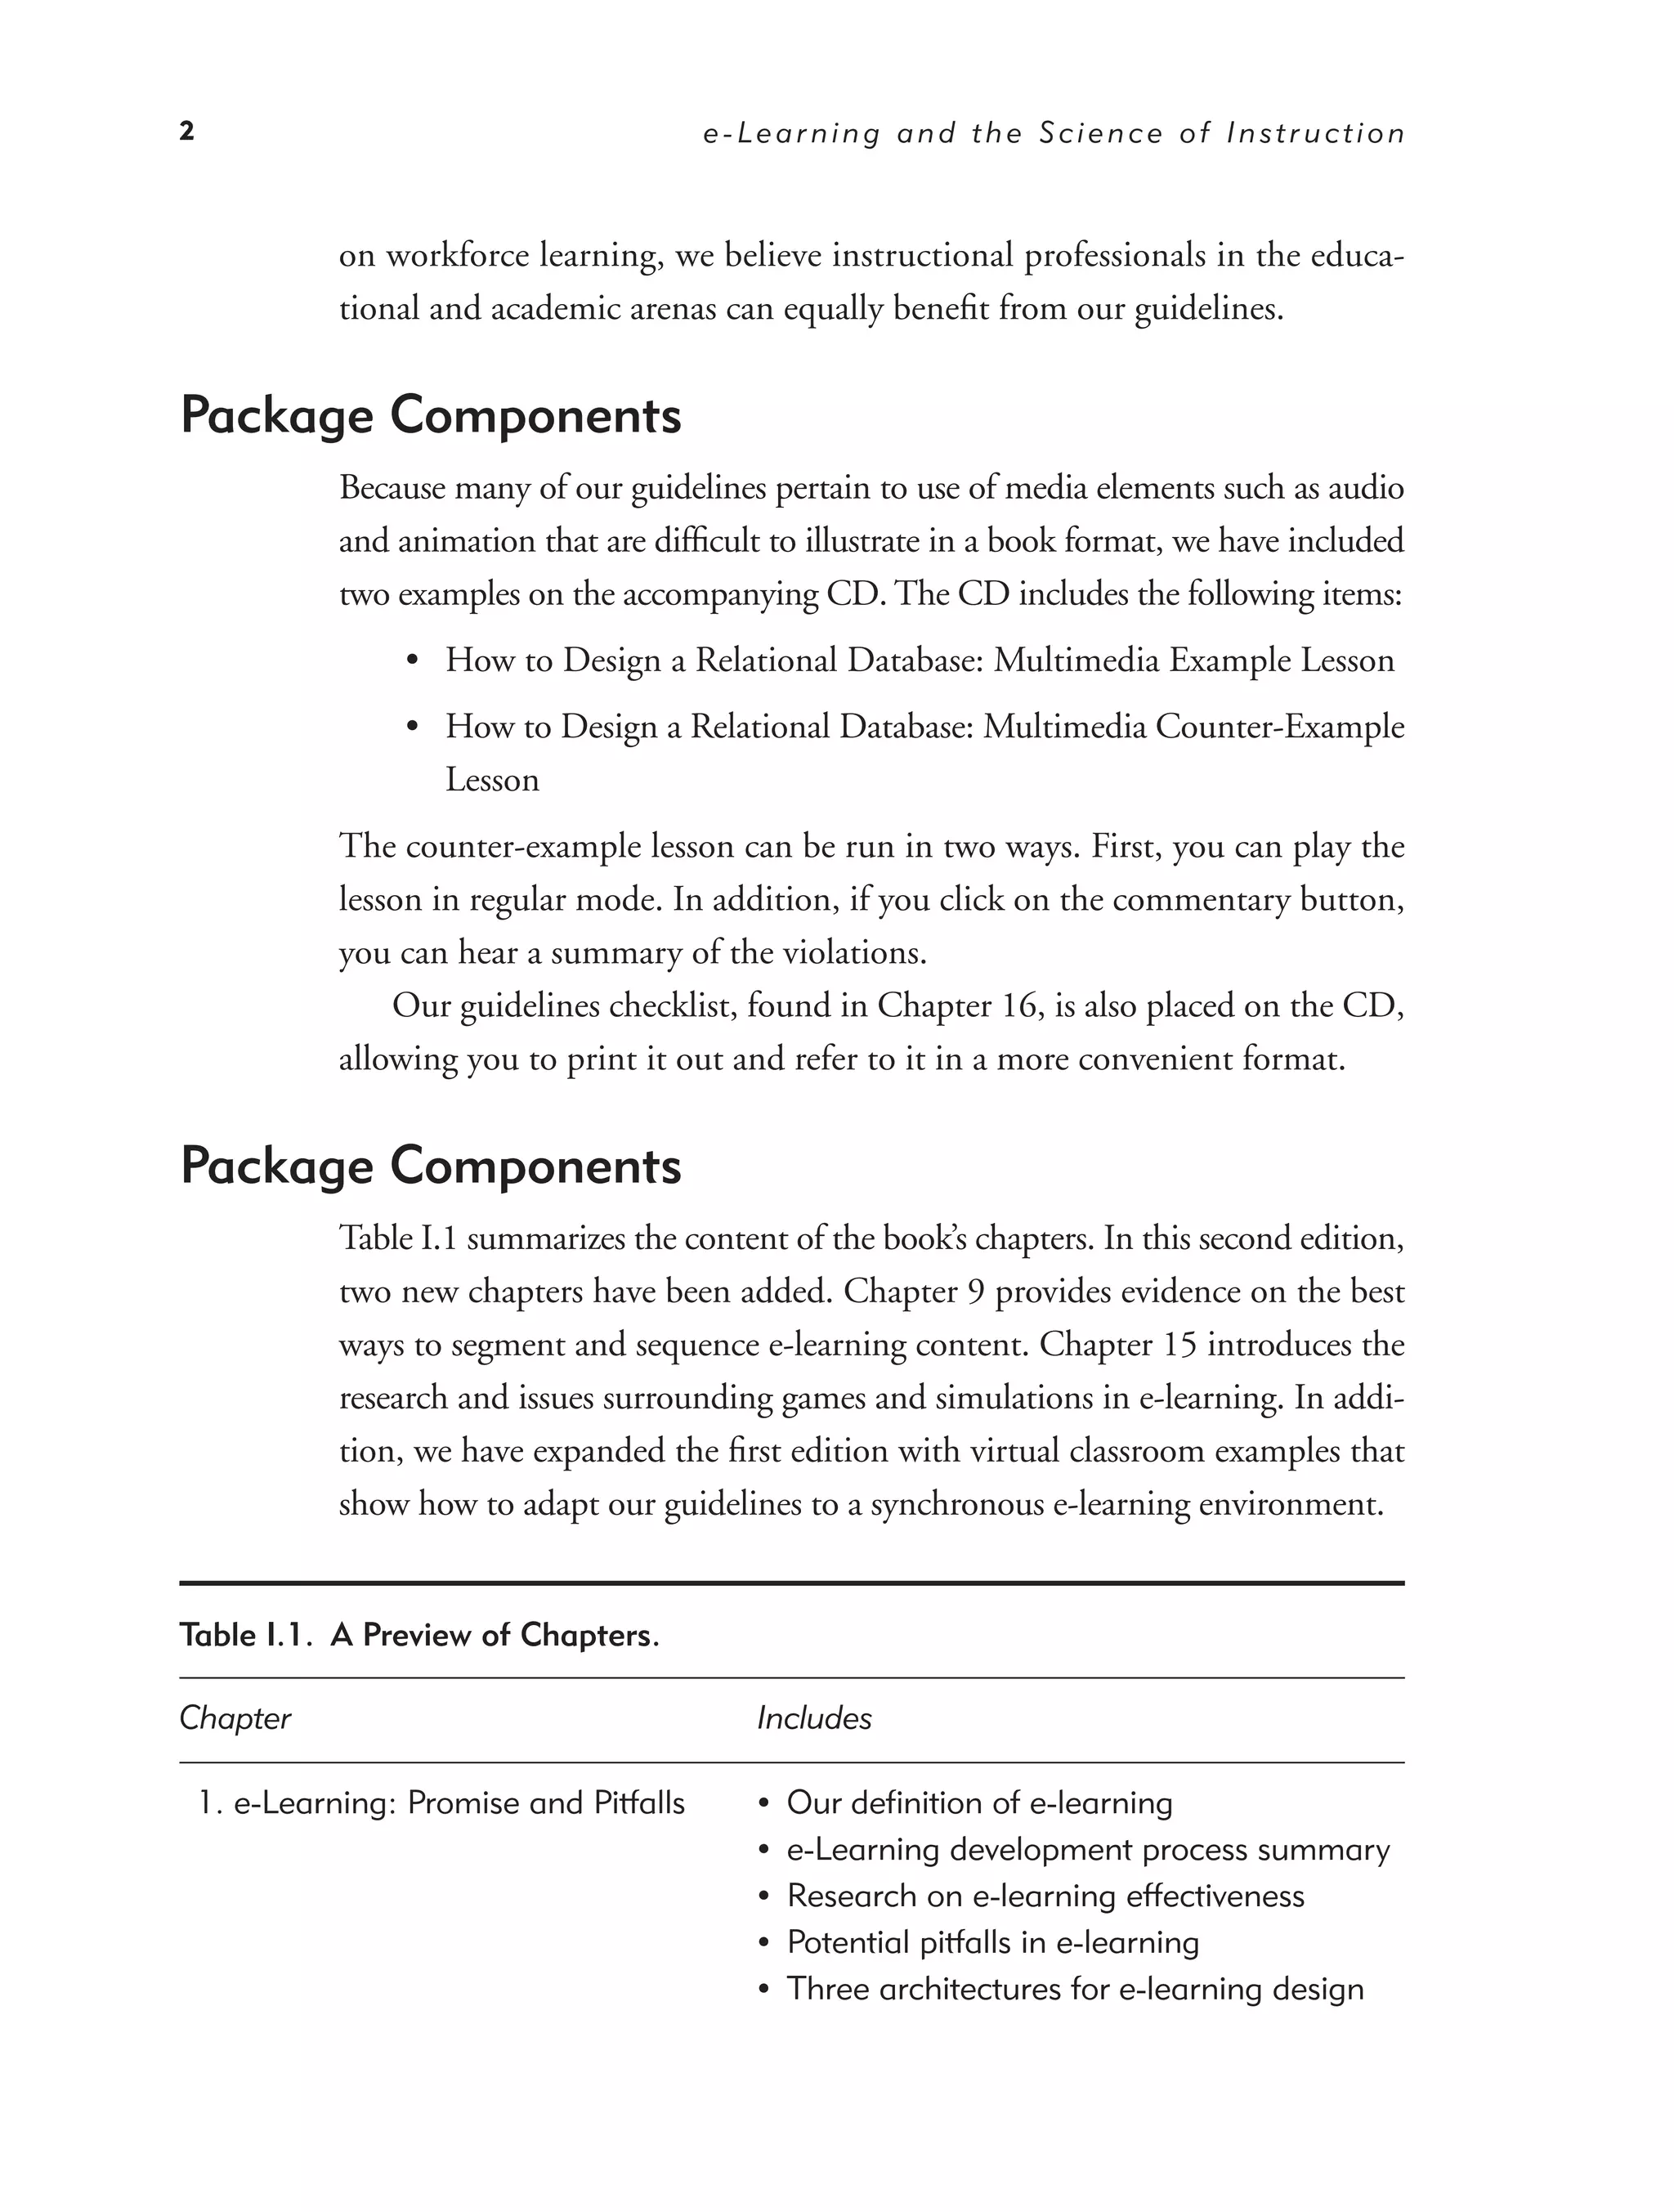
Table I.1 summarizes the content of the book’s chapters. In this second edition,
two new chapters have been added. Chapter 9 provides evidence on the best
ways to segment and sequence e-learning content. Chapter 15 introduces the
research and issues surrounding games and simulations in e-learning. In addi-
tion, we have expanded the first edition with virtual classroom examples that
show how to adapt our guidelines to a synchronous e-learning environment.
Table I.1. A Preview of Chapters.
Chapter Includes
1. e-Learning: Promise and Pitfalls • Our definition of e-learning
• e-Learning development process summary
• Research on e-learning effectiveness
• Potential pitfalls in e-learning
• Three architectures for e-learning design
20.
Introduction 3
Table I.1. (Continued).
Chapter Includes
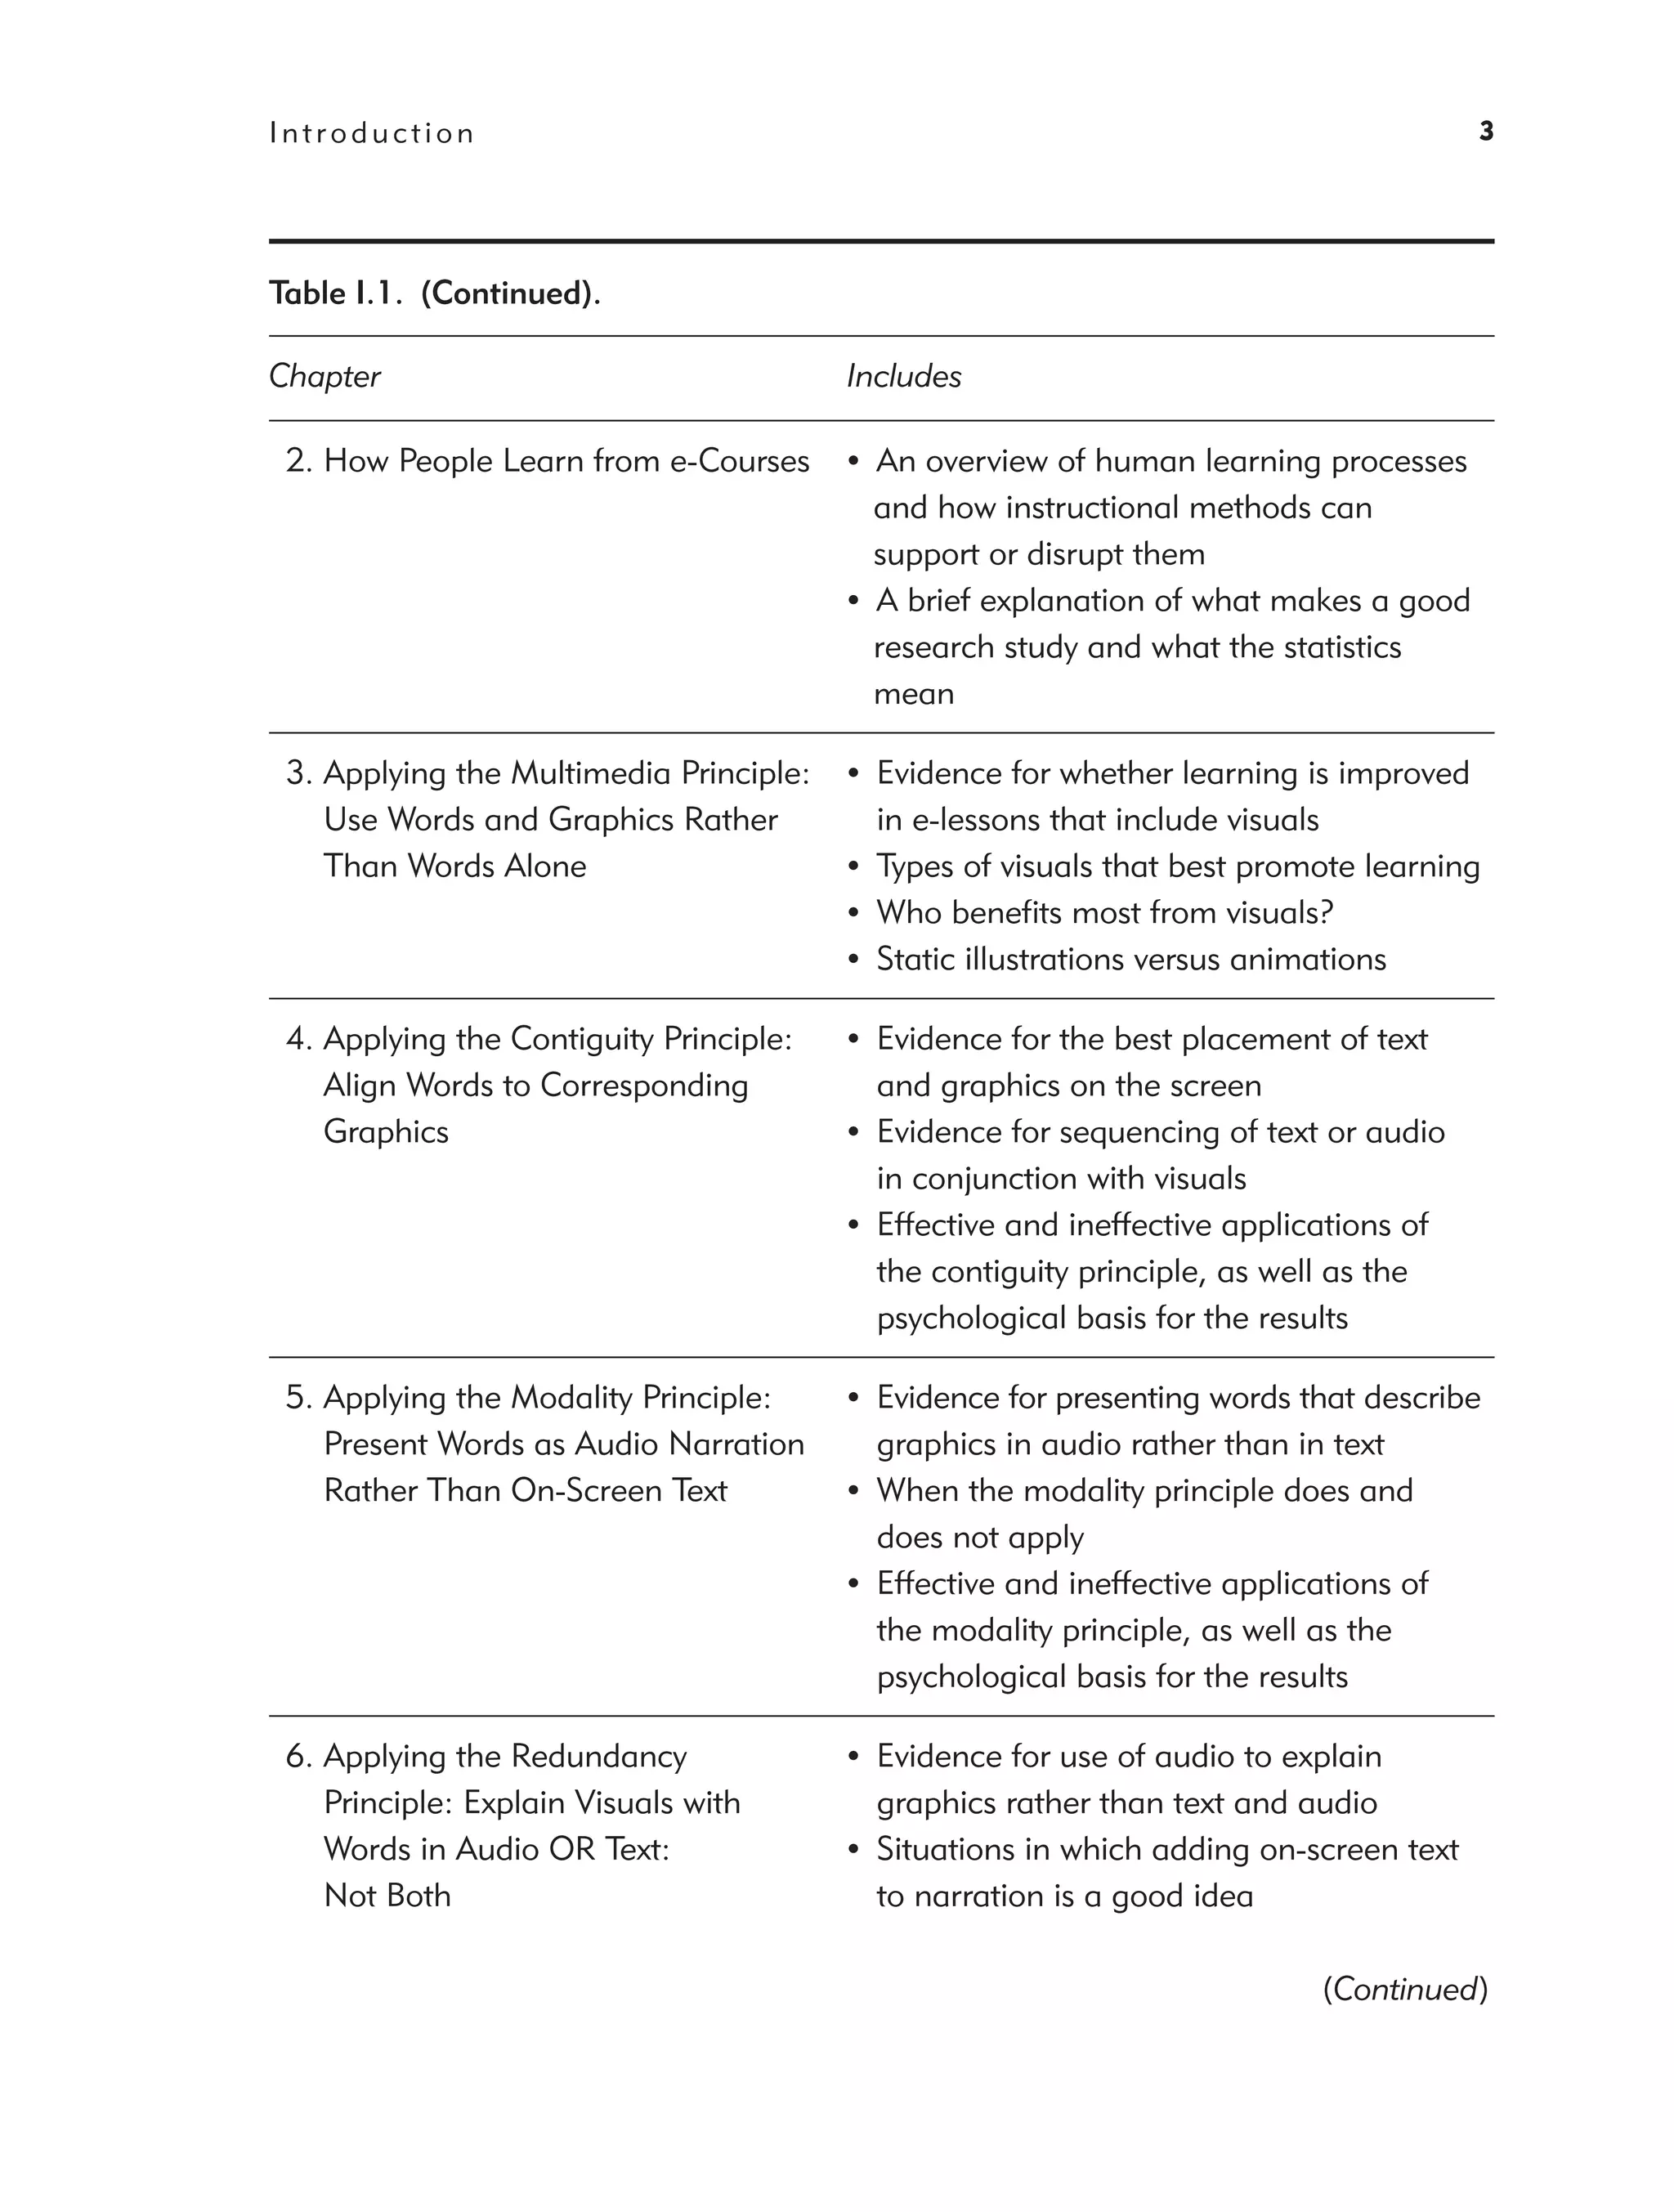
2. How People Learn from e-Courses • An overview of human learning processes
and how instructional methods can
support or disrupt them
• A brief explanation of what makes a good
research study and what the statistics
mean
3. Applying the Multimedia Principle: • Evidence for whether learning is improved
Use Words and Graphics Rather in e-lessons that include visuals
Than Words Alone • Types of visuals that best promote learning
• Who benefits most from visuals?
• Static illustrations versus animations
4. Applying the Contiguity Principle: • Evidence for the best placement of text
Align Words to Corresponding and graphics on the screen
Graphics • Evidence for sequencing of text or audio
in conjunction with visuals
• Effective and ineffective applications of
the contiguity principle, as well as the
psychological basis for the results
5. Applying the Modality Principle: • Evidence for presenting words that describe
Present Words as Audio Narration graphics in audio rather than in text
Rather Than On-Screen Text • When the modality principle does and
does not apply
• Effective and ineffective applications of
the modality principle, as well as the
psychological basis for the results
6. Applying the Redundancy • Evidence for use of audio to explain
Principle: Explain Visuals with graphics rather than text and audio
Words in Audio OR Text: • Situations in which adding on-screen text
Not Both to narration is a good idea
(Continued)
21.
4 e-Learning and the Science of Instruction
Table I.1. (Continued).
Chapter Includes
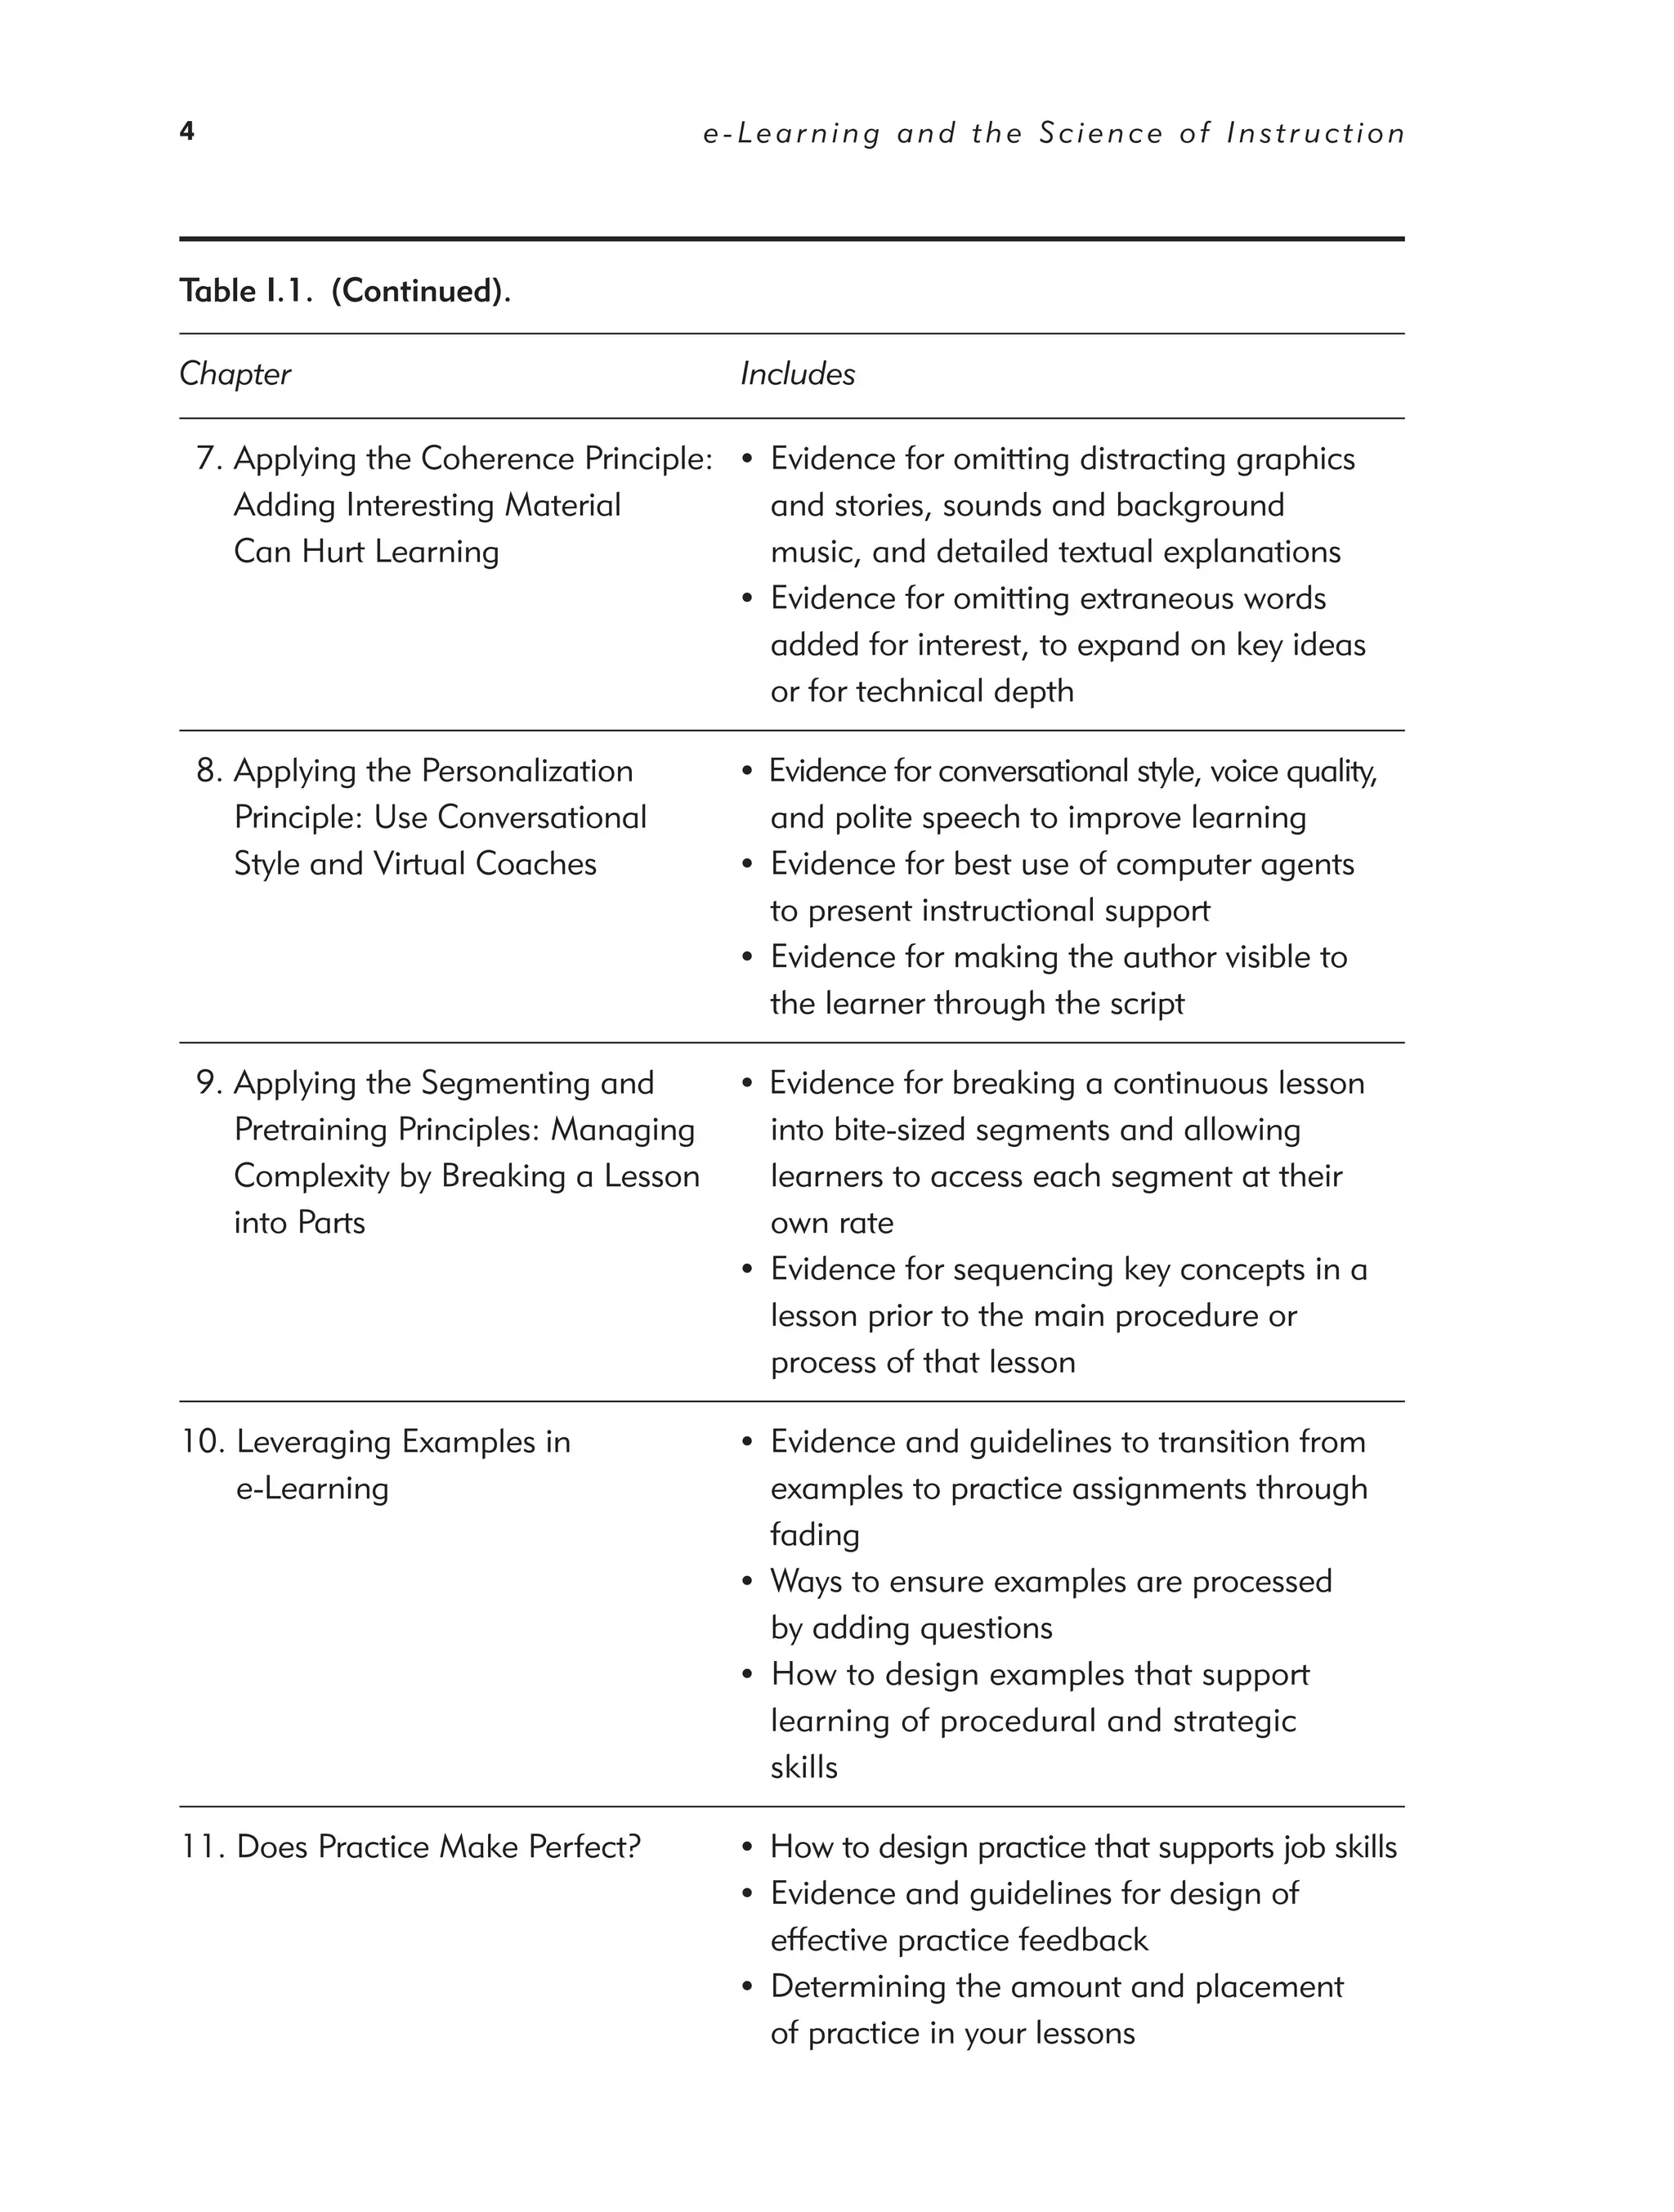
7. Applying the Coherence Principle: • Evidence for omitting distracting graphics
Adding Interesting Material and stories, sounds and background
Can Hurt Learning music, and detailed textual explanations
• Evidence for omitting extraneous words
added for interest, to expand on key ideas
or for technical depth
8. Applying the Personalization • Evidence for conversational style, voice quality,
Principle: Use Conversational and polite speech to improve learning
Style and Virtual Coaches • Evidence for best use of computer agents
to present instructional support
• Evidence for making the author visible to
the learner through the script
9. Applying the Segmenting and • Evidence for breaking a continuous lesson
Pretraining Principles: Managing into bite-sized segments and allowing
Complexity by Breaking a Lesson learners to access each segment at their
into Parts own rate
• Evidence for sequencing key concepts in a
lesson prior to the main procedure or
process of that lesson
10. Leveraging Examples in • Evidence and guidelines to transition from
e-Learning examples to practice assignments through
fading
• Ways to ensure examples are processed
by adding questions
• How to design examples that support
learning of procedural and strategic
skills
11. Does Practice Make Perfect? • How to design practice that supports job skills
• Evidence and guidelines for design of
effective practice feedback
• Determining the amount and placement
of practice in your lessons
22.
Introduction 5
Table I.1. (Continued).
Chapter Includes
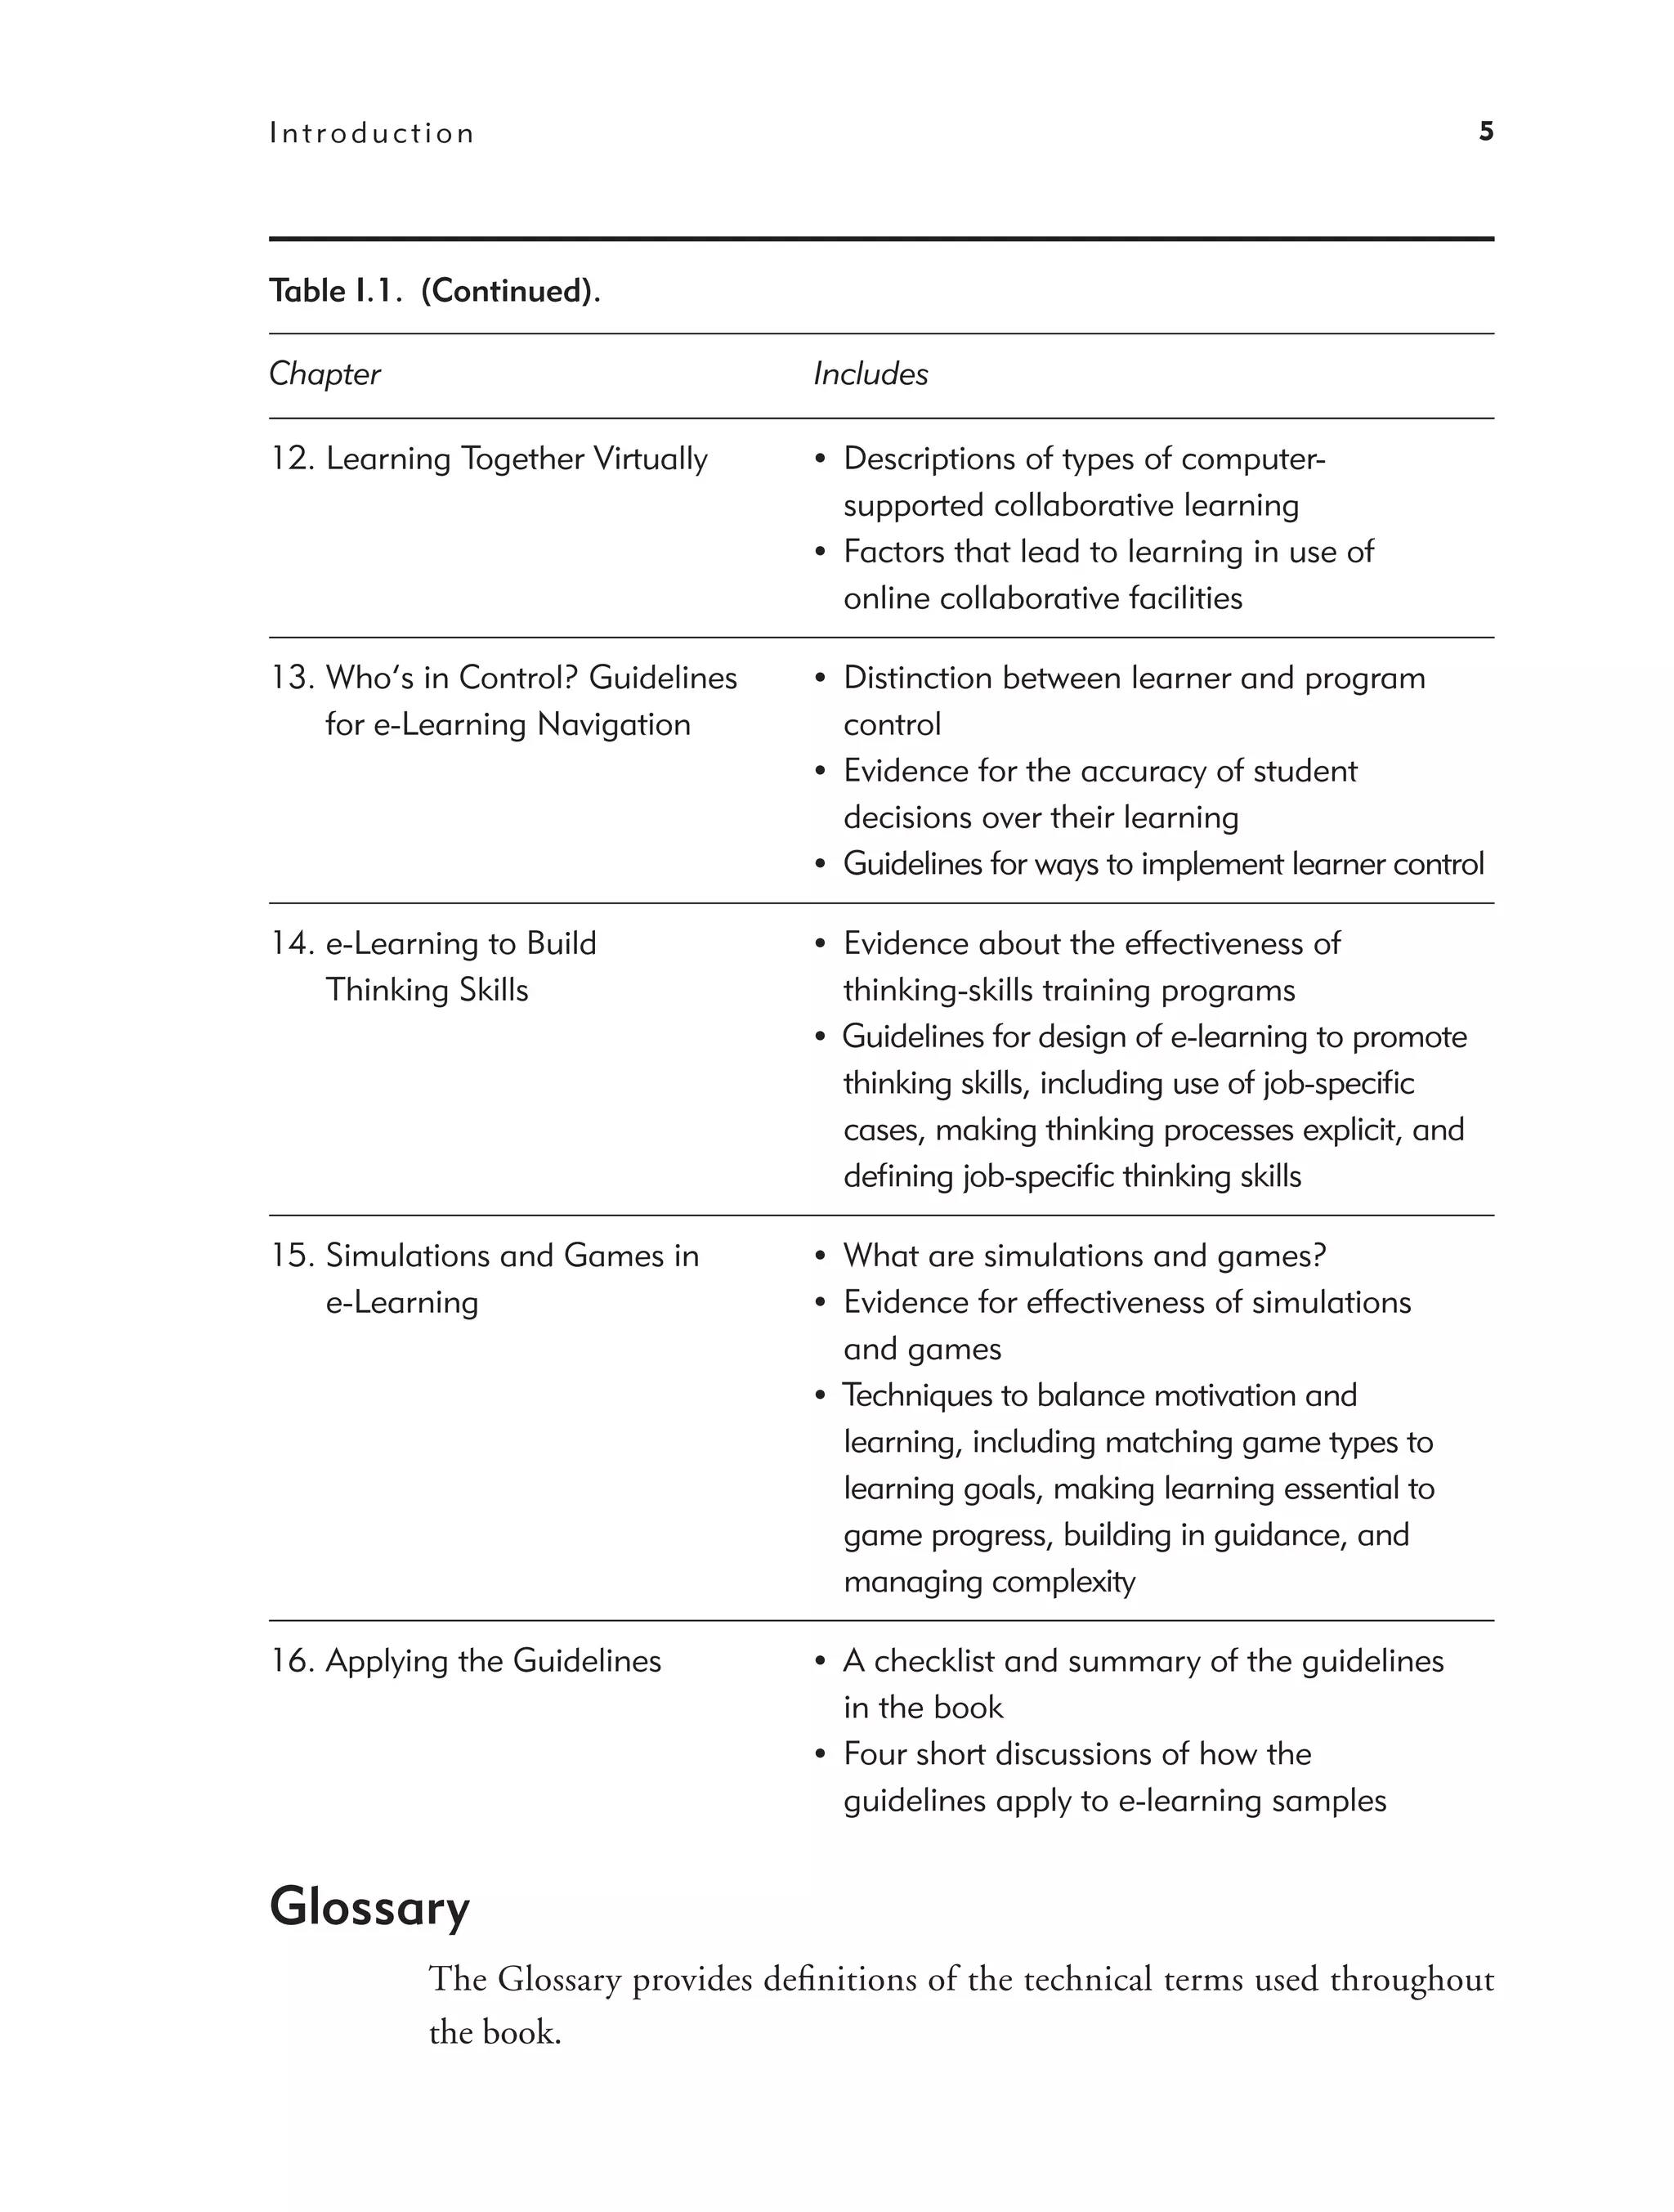
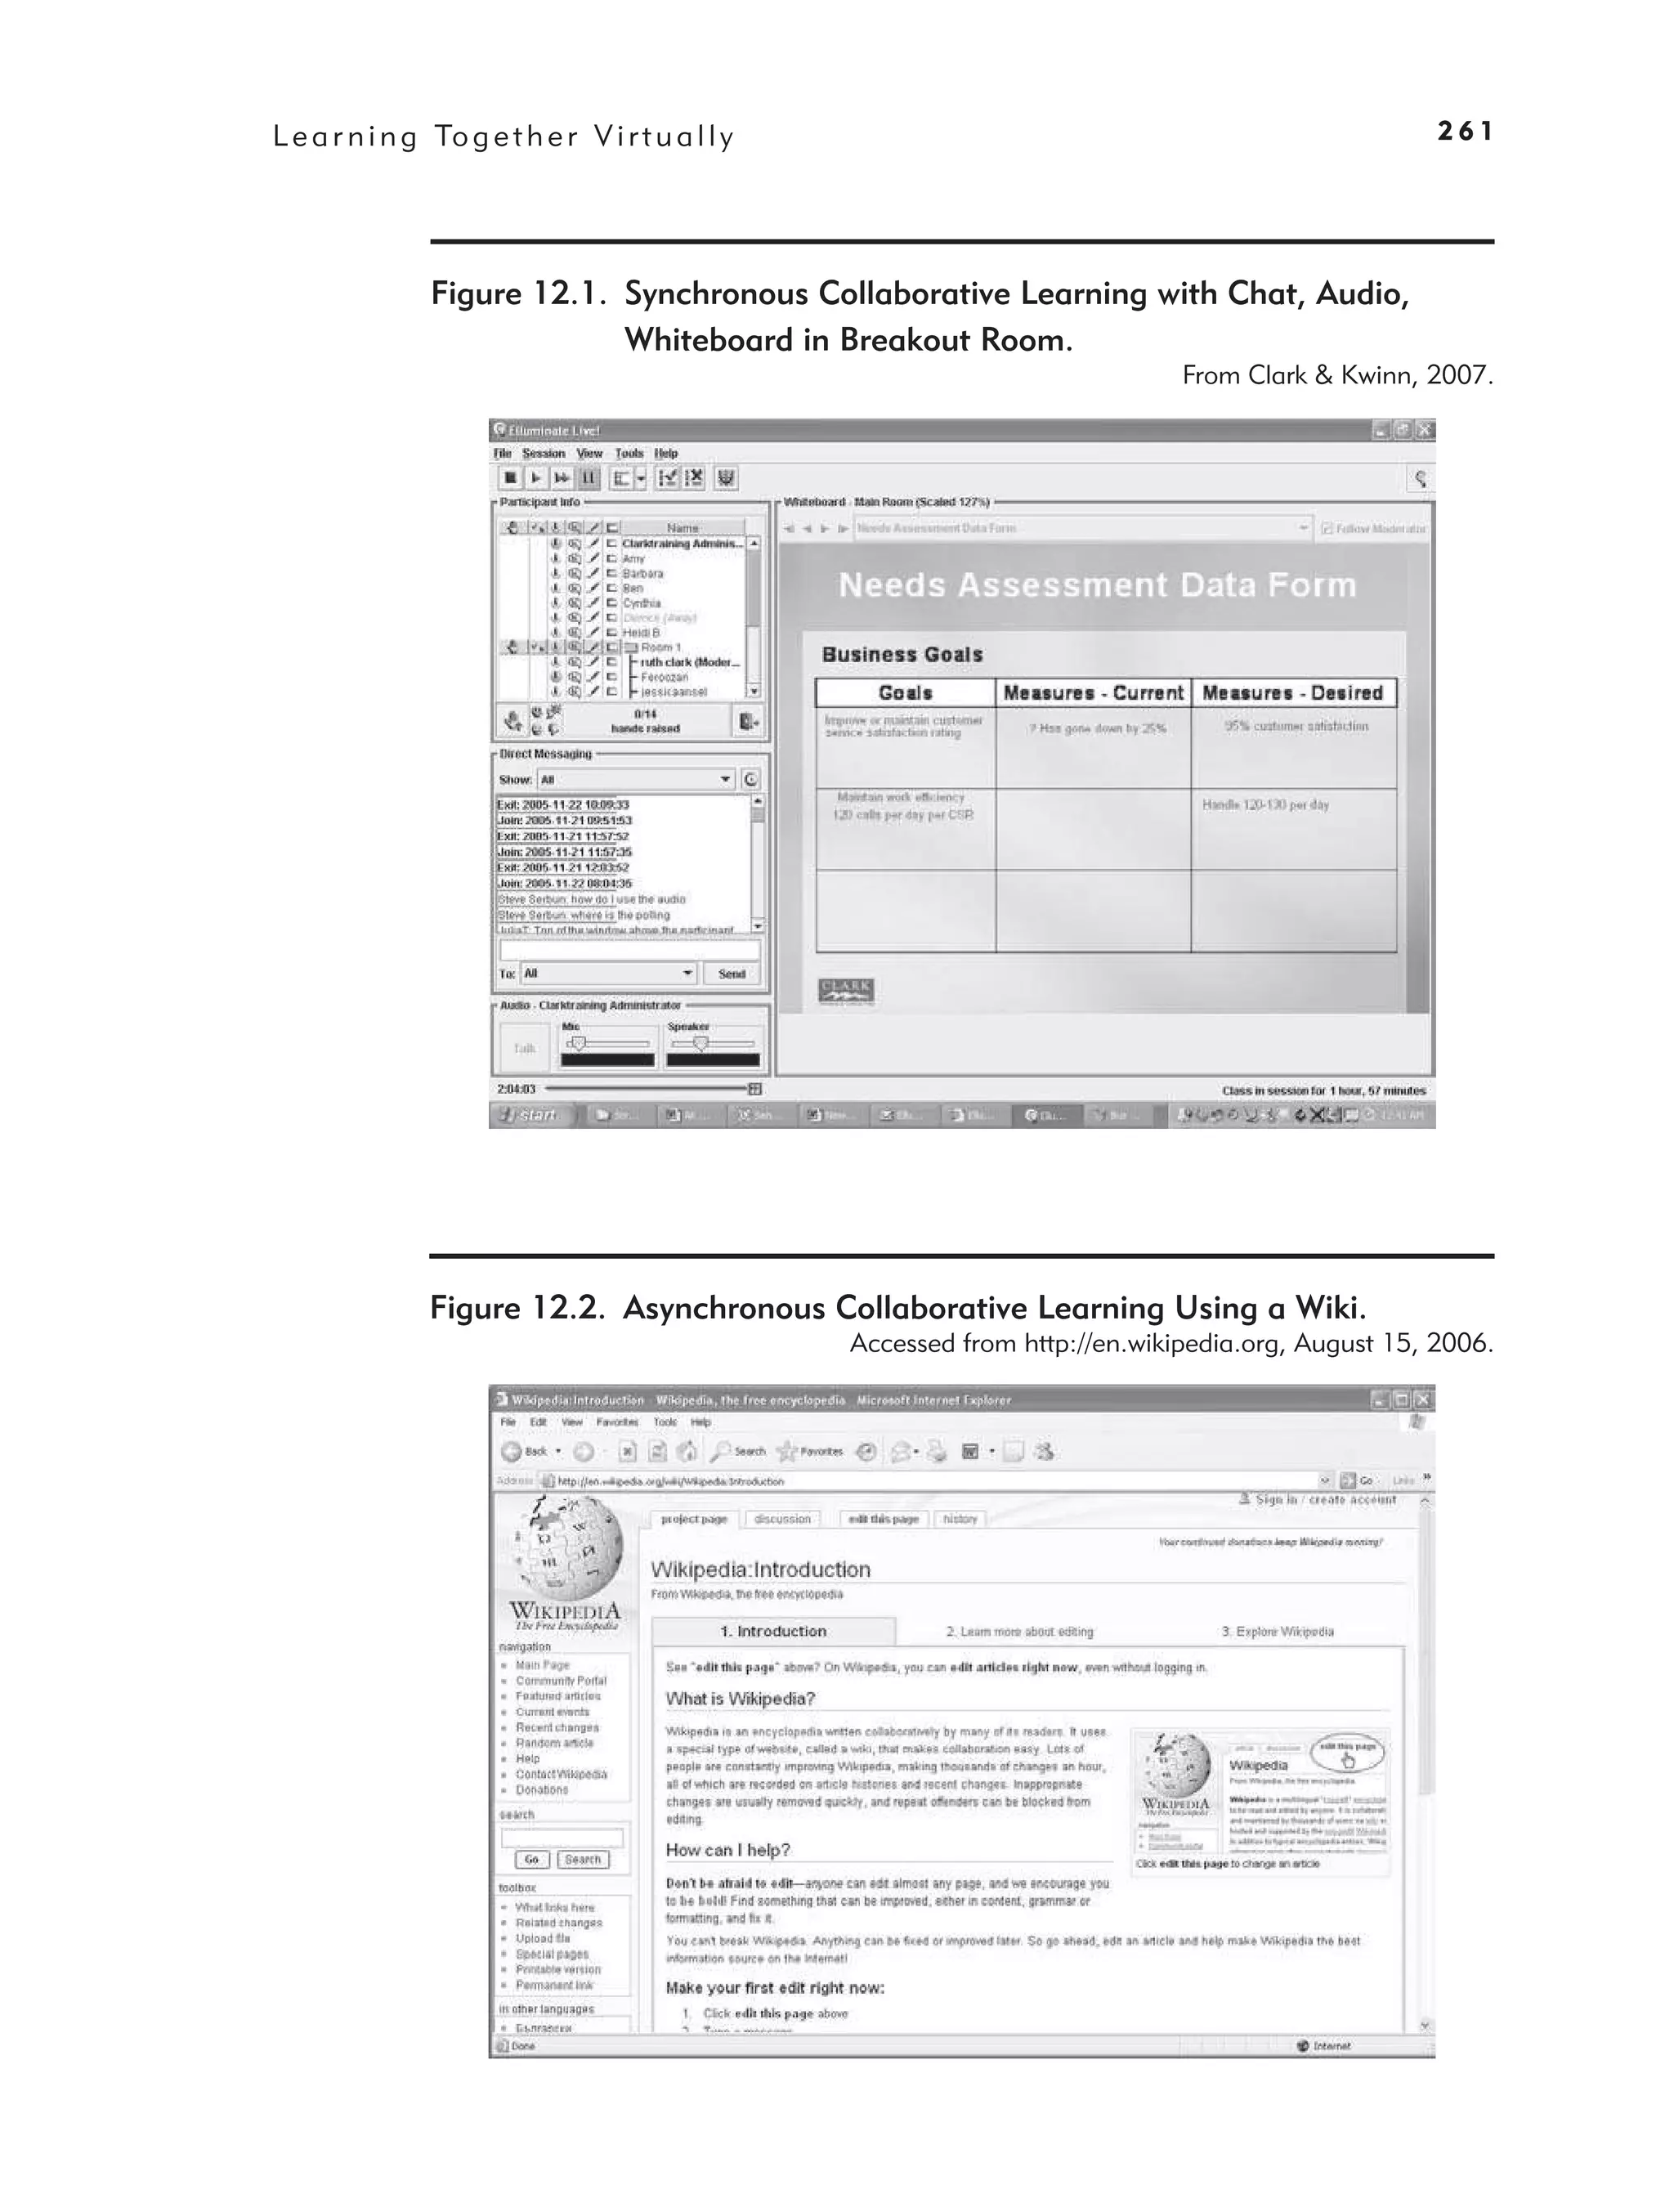
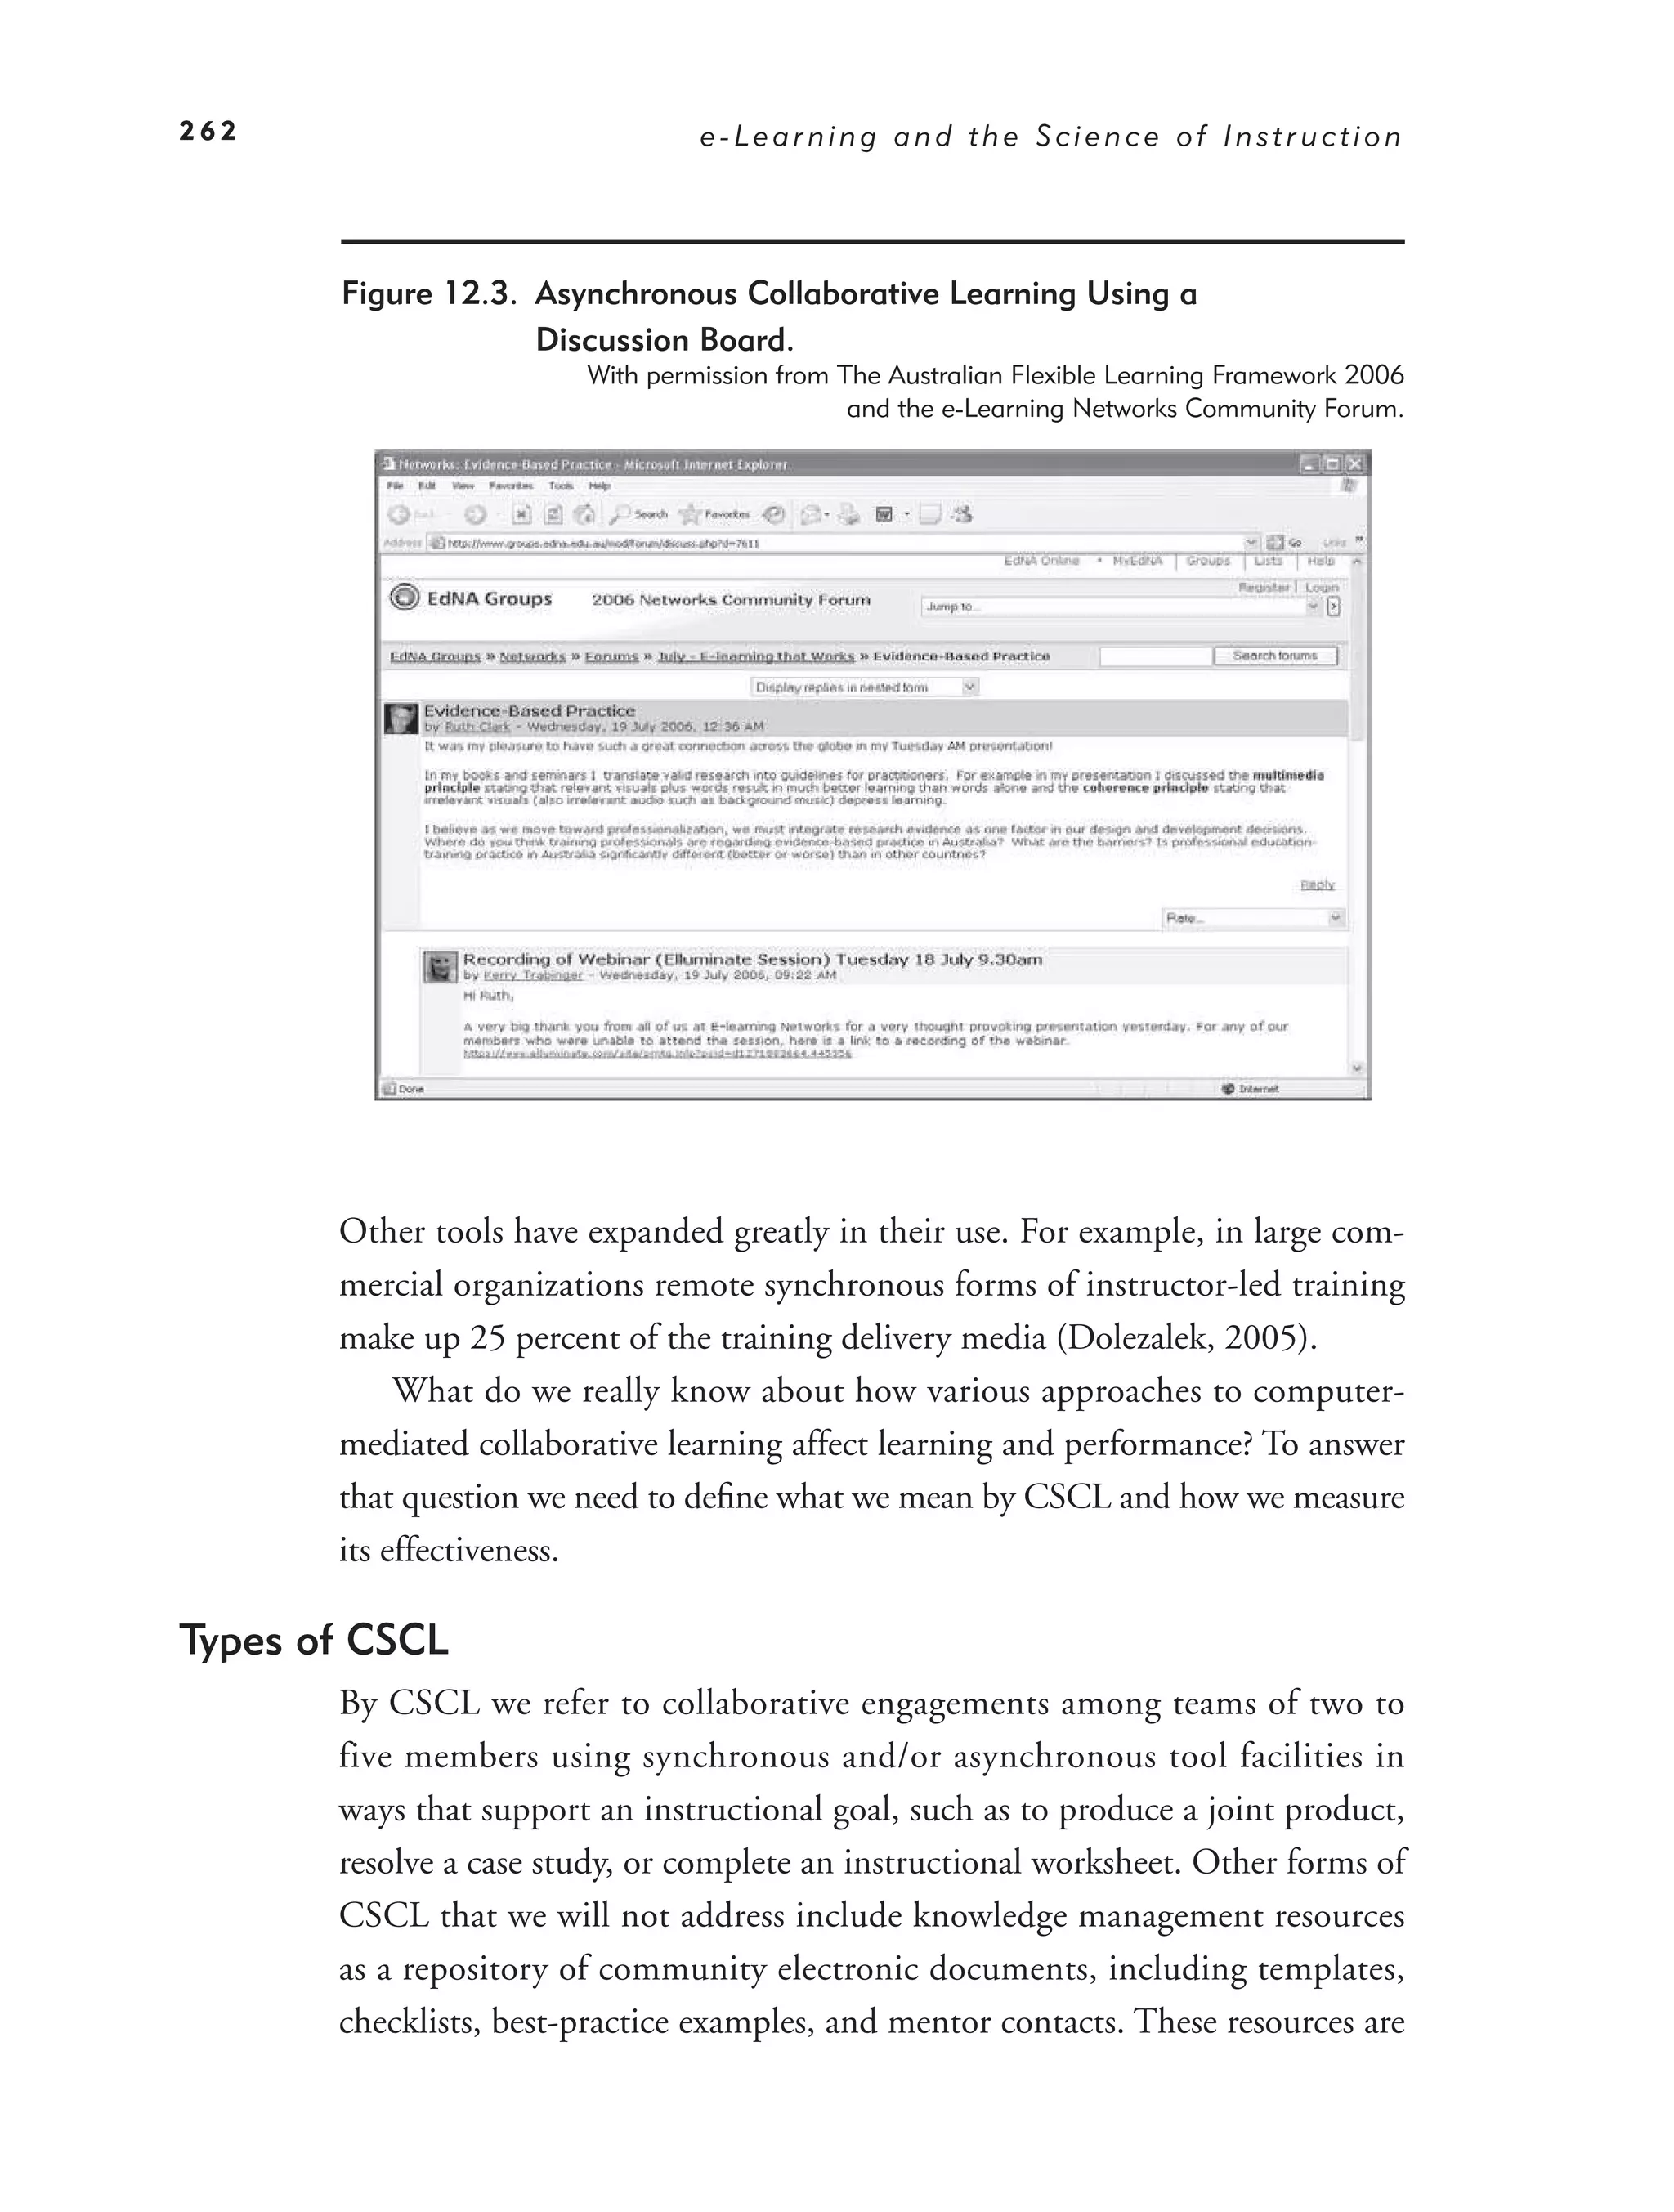
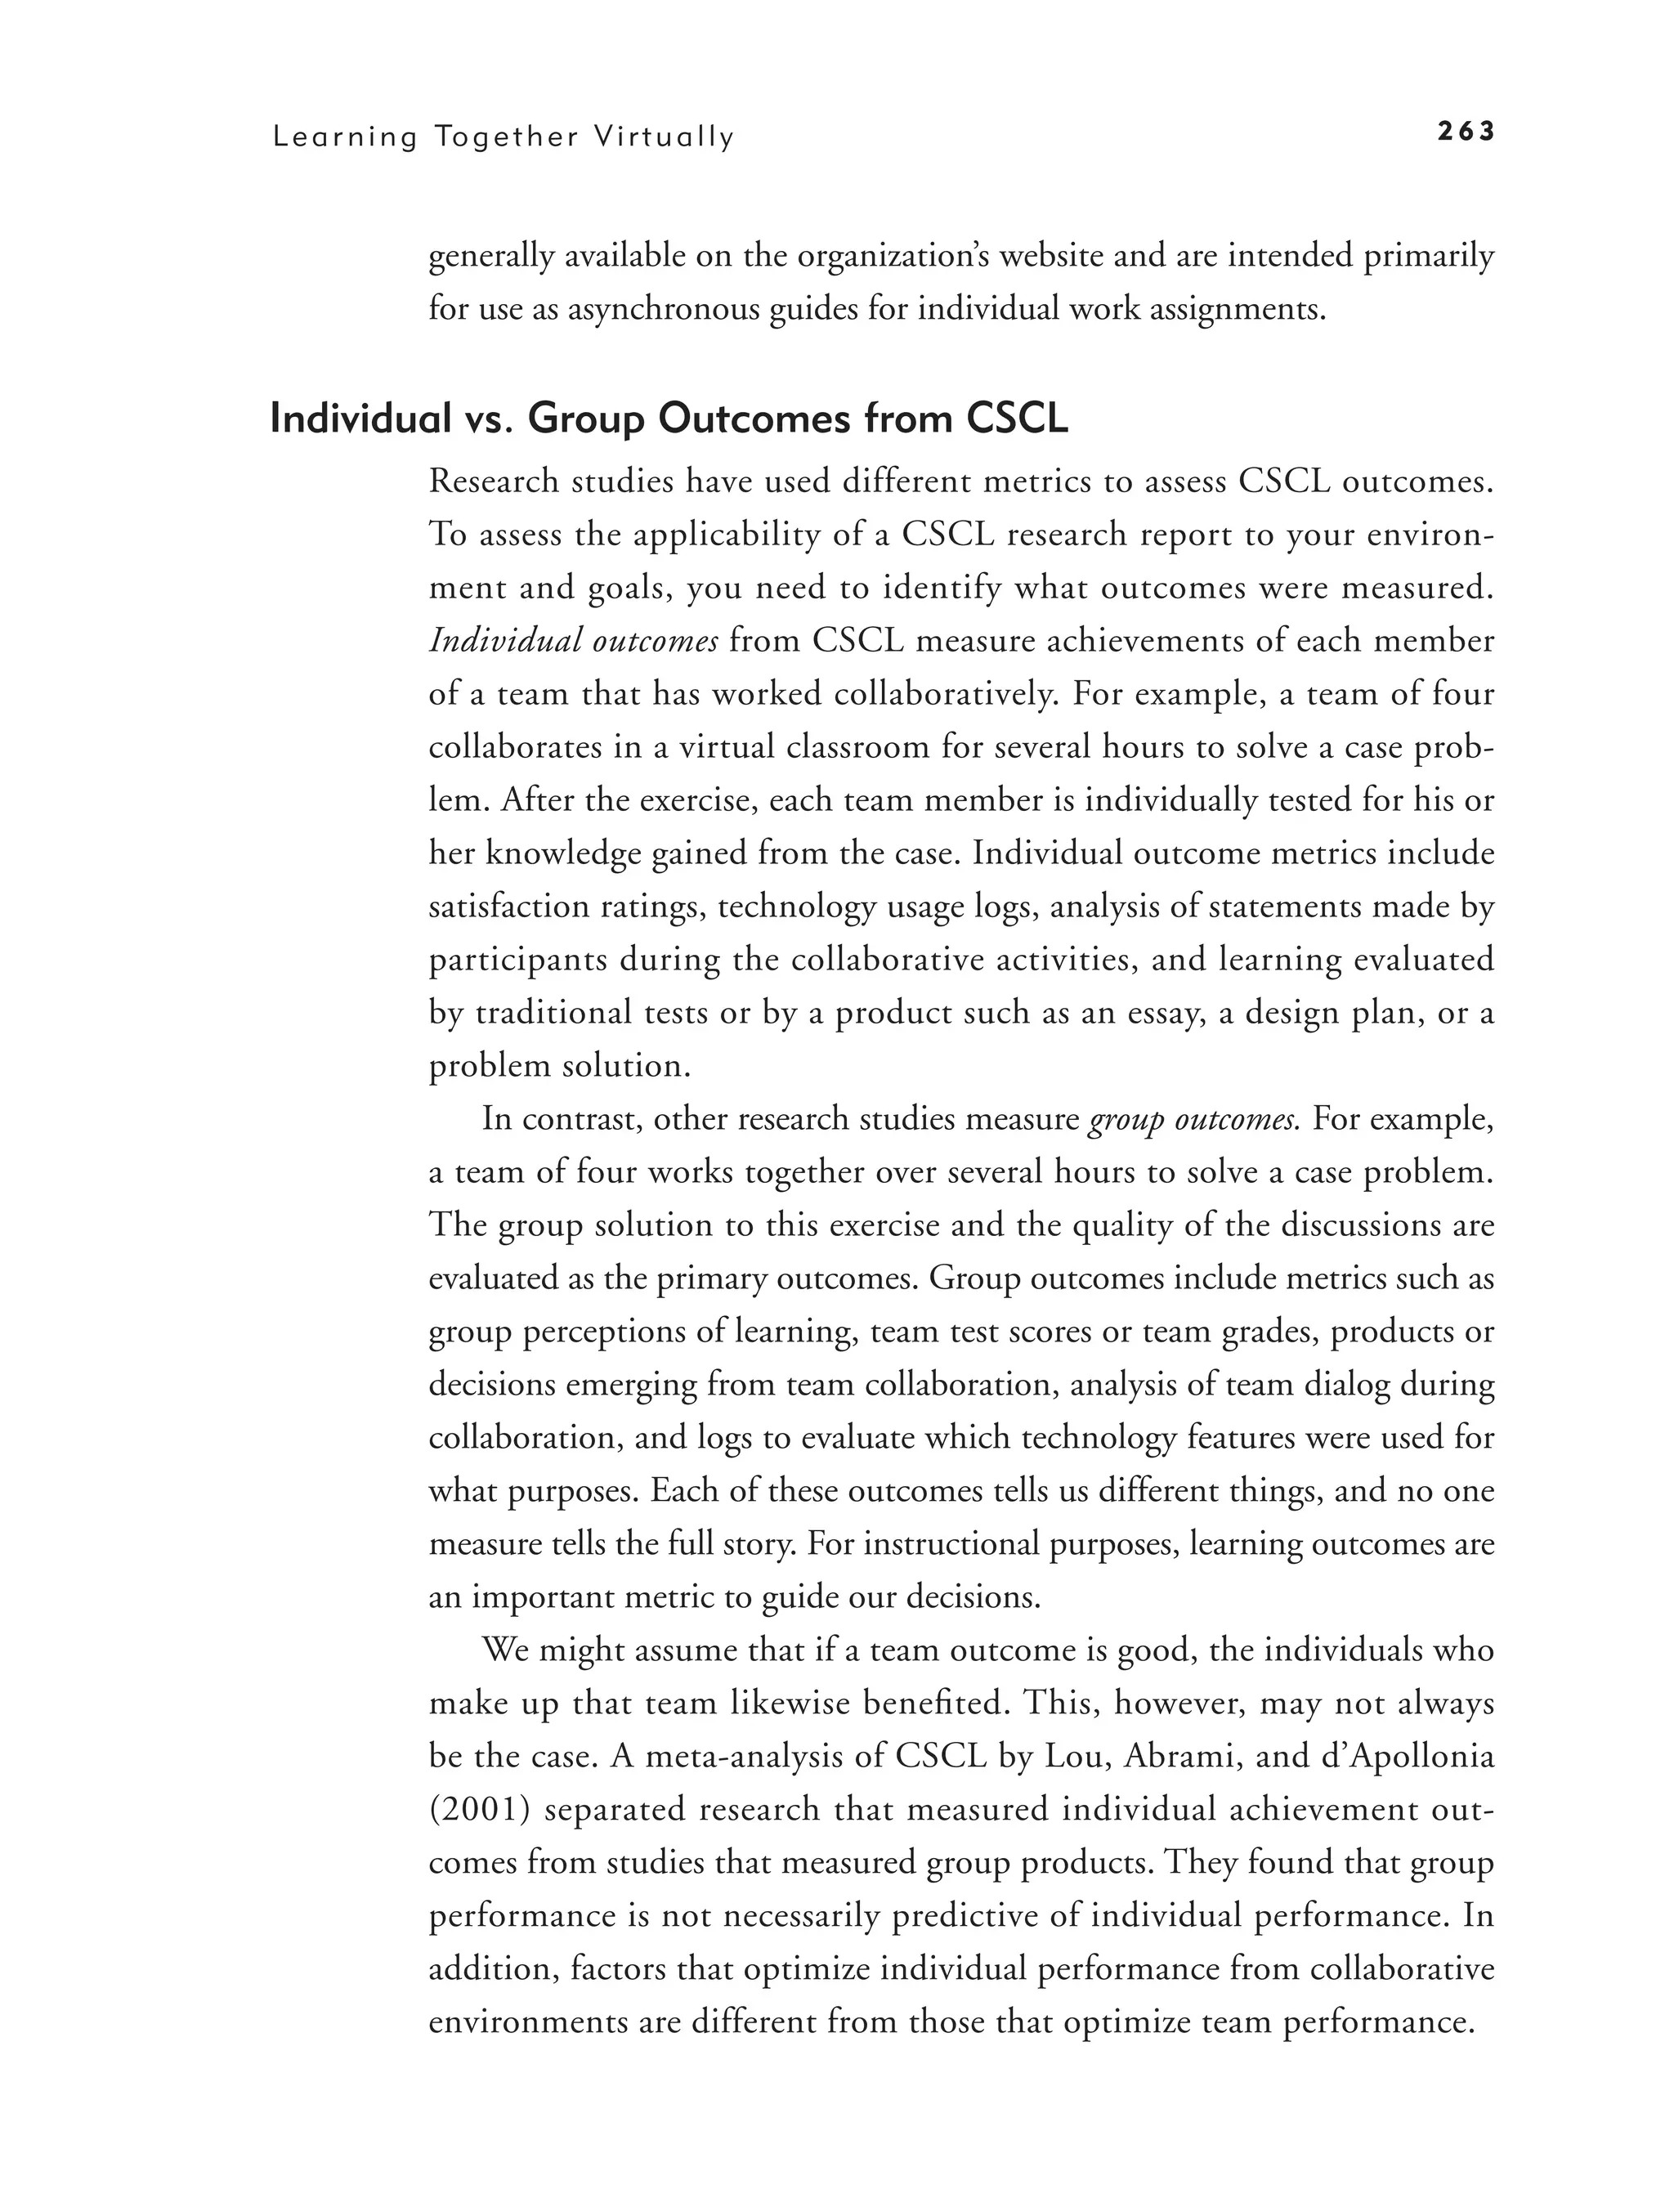
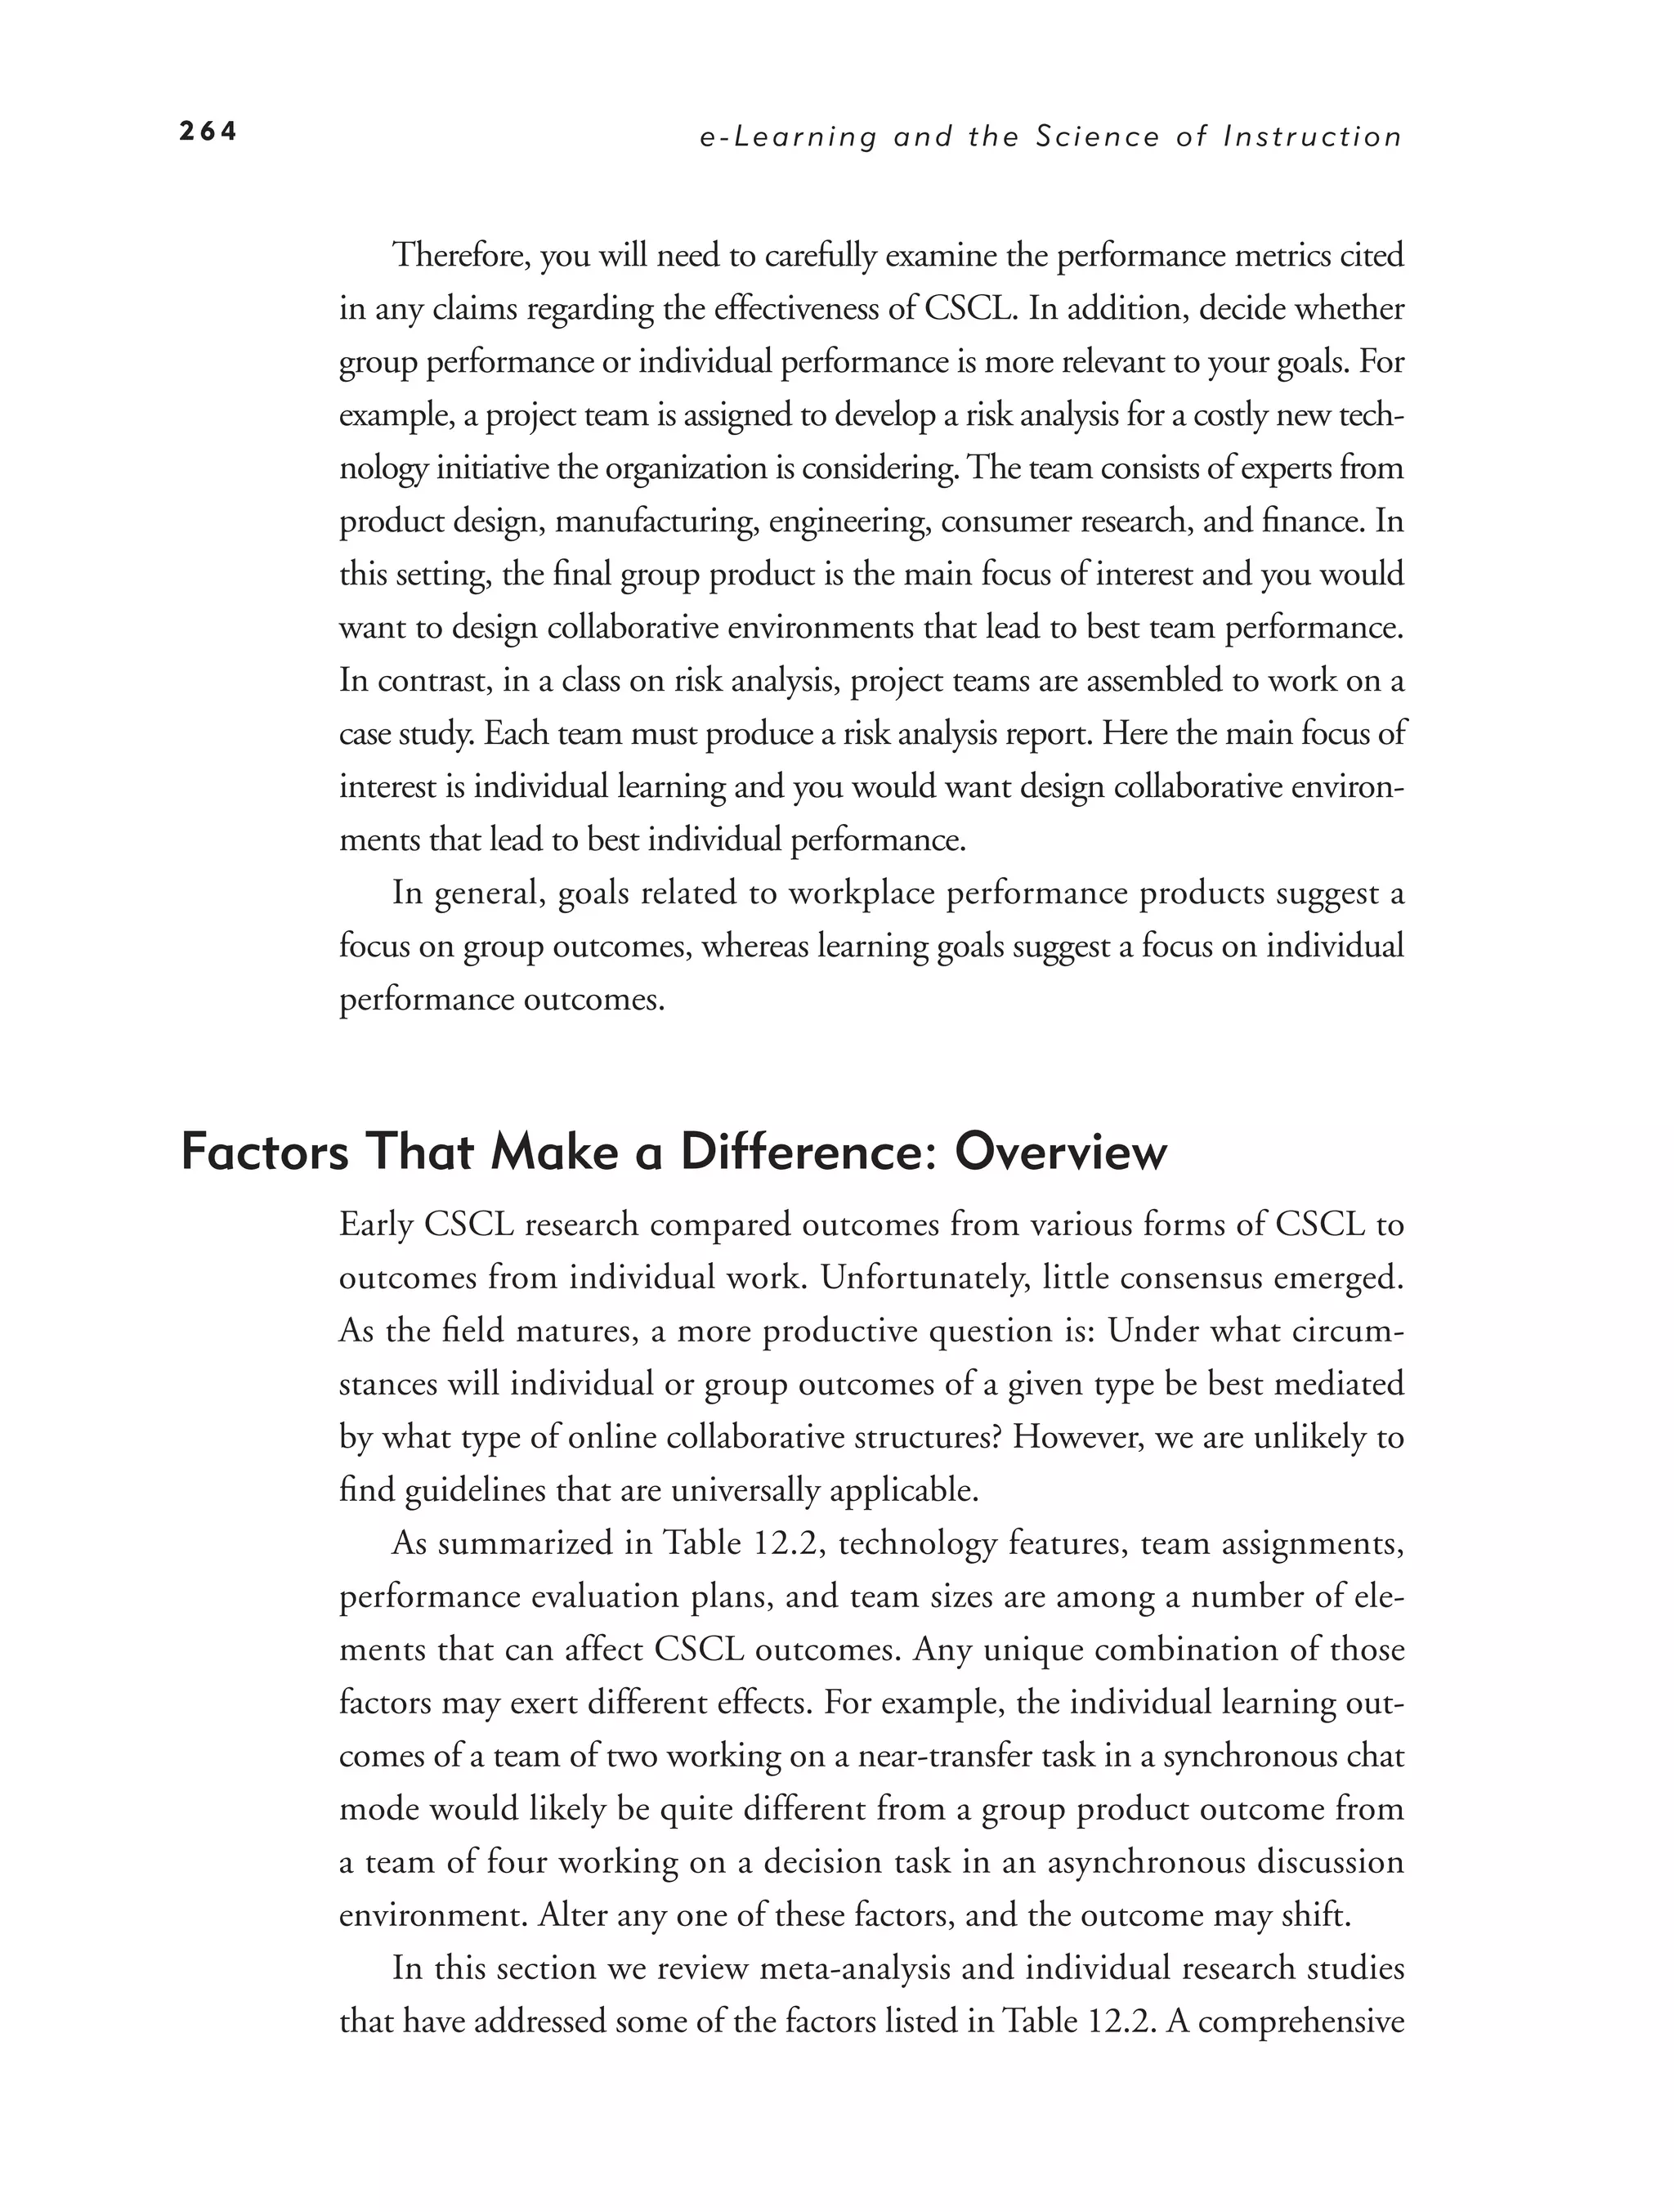
12. Learning Together Virtually • Descriptions of types of computer-
supported collaborative learning
• Factors that lead to learning in use of
online collaborative facilities
13. Who’s in Control? Guidelines • Distinction between learner and program
for e-Learning Navigation control
• Evidence for the accuracy of student
decisions over their learning
• Guidelines for ways to implement learner control
14. e-Learning to Build • Evidence about the effectiveness of
Thinking Skills thinking-skills training programs
• Guidelines for design of e-learning to promote
thinking skills, including use of job-specific
cases, making thinking processes explicit, and
defining job-specific thinking skills
15. Simulations and Games in • What are simulations and games?
e-Learning • Evidence for effectiveness of simulations
and games
• Techniques to balance motivation and
learning, including matching game types to
learning goals, making learning essential to
game progress, building in guidance, and
managing complexity
16. Applying the Guidelines • A checklist and summary of the guidelines
in the book
• Four short discussions of how the
guidelines apply to e-learning samples
Glossary
The Glossary provides definitions of the technical terms used throughout
the book.
23.
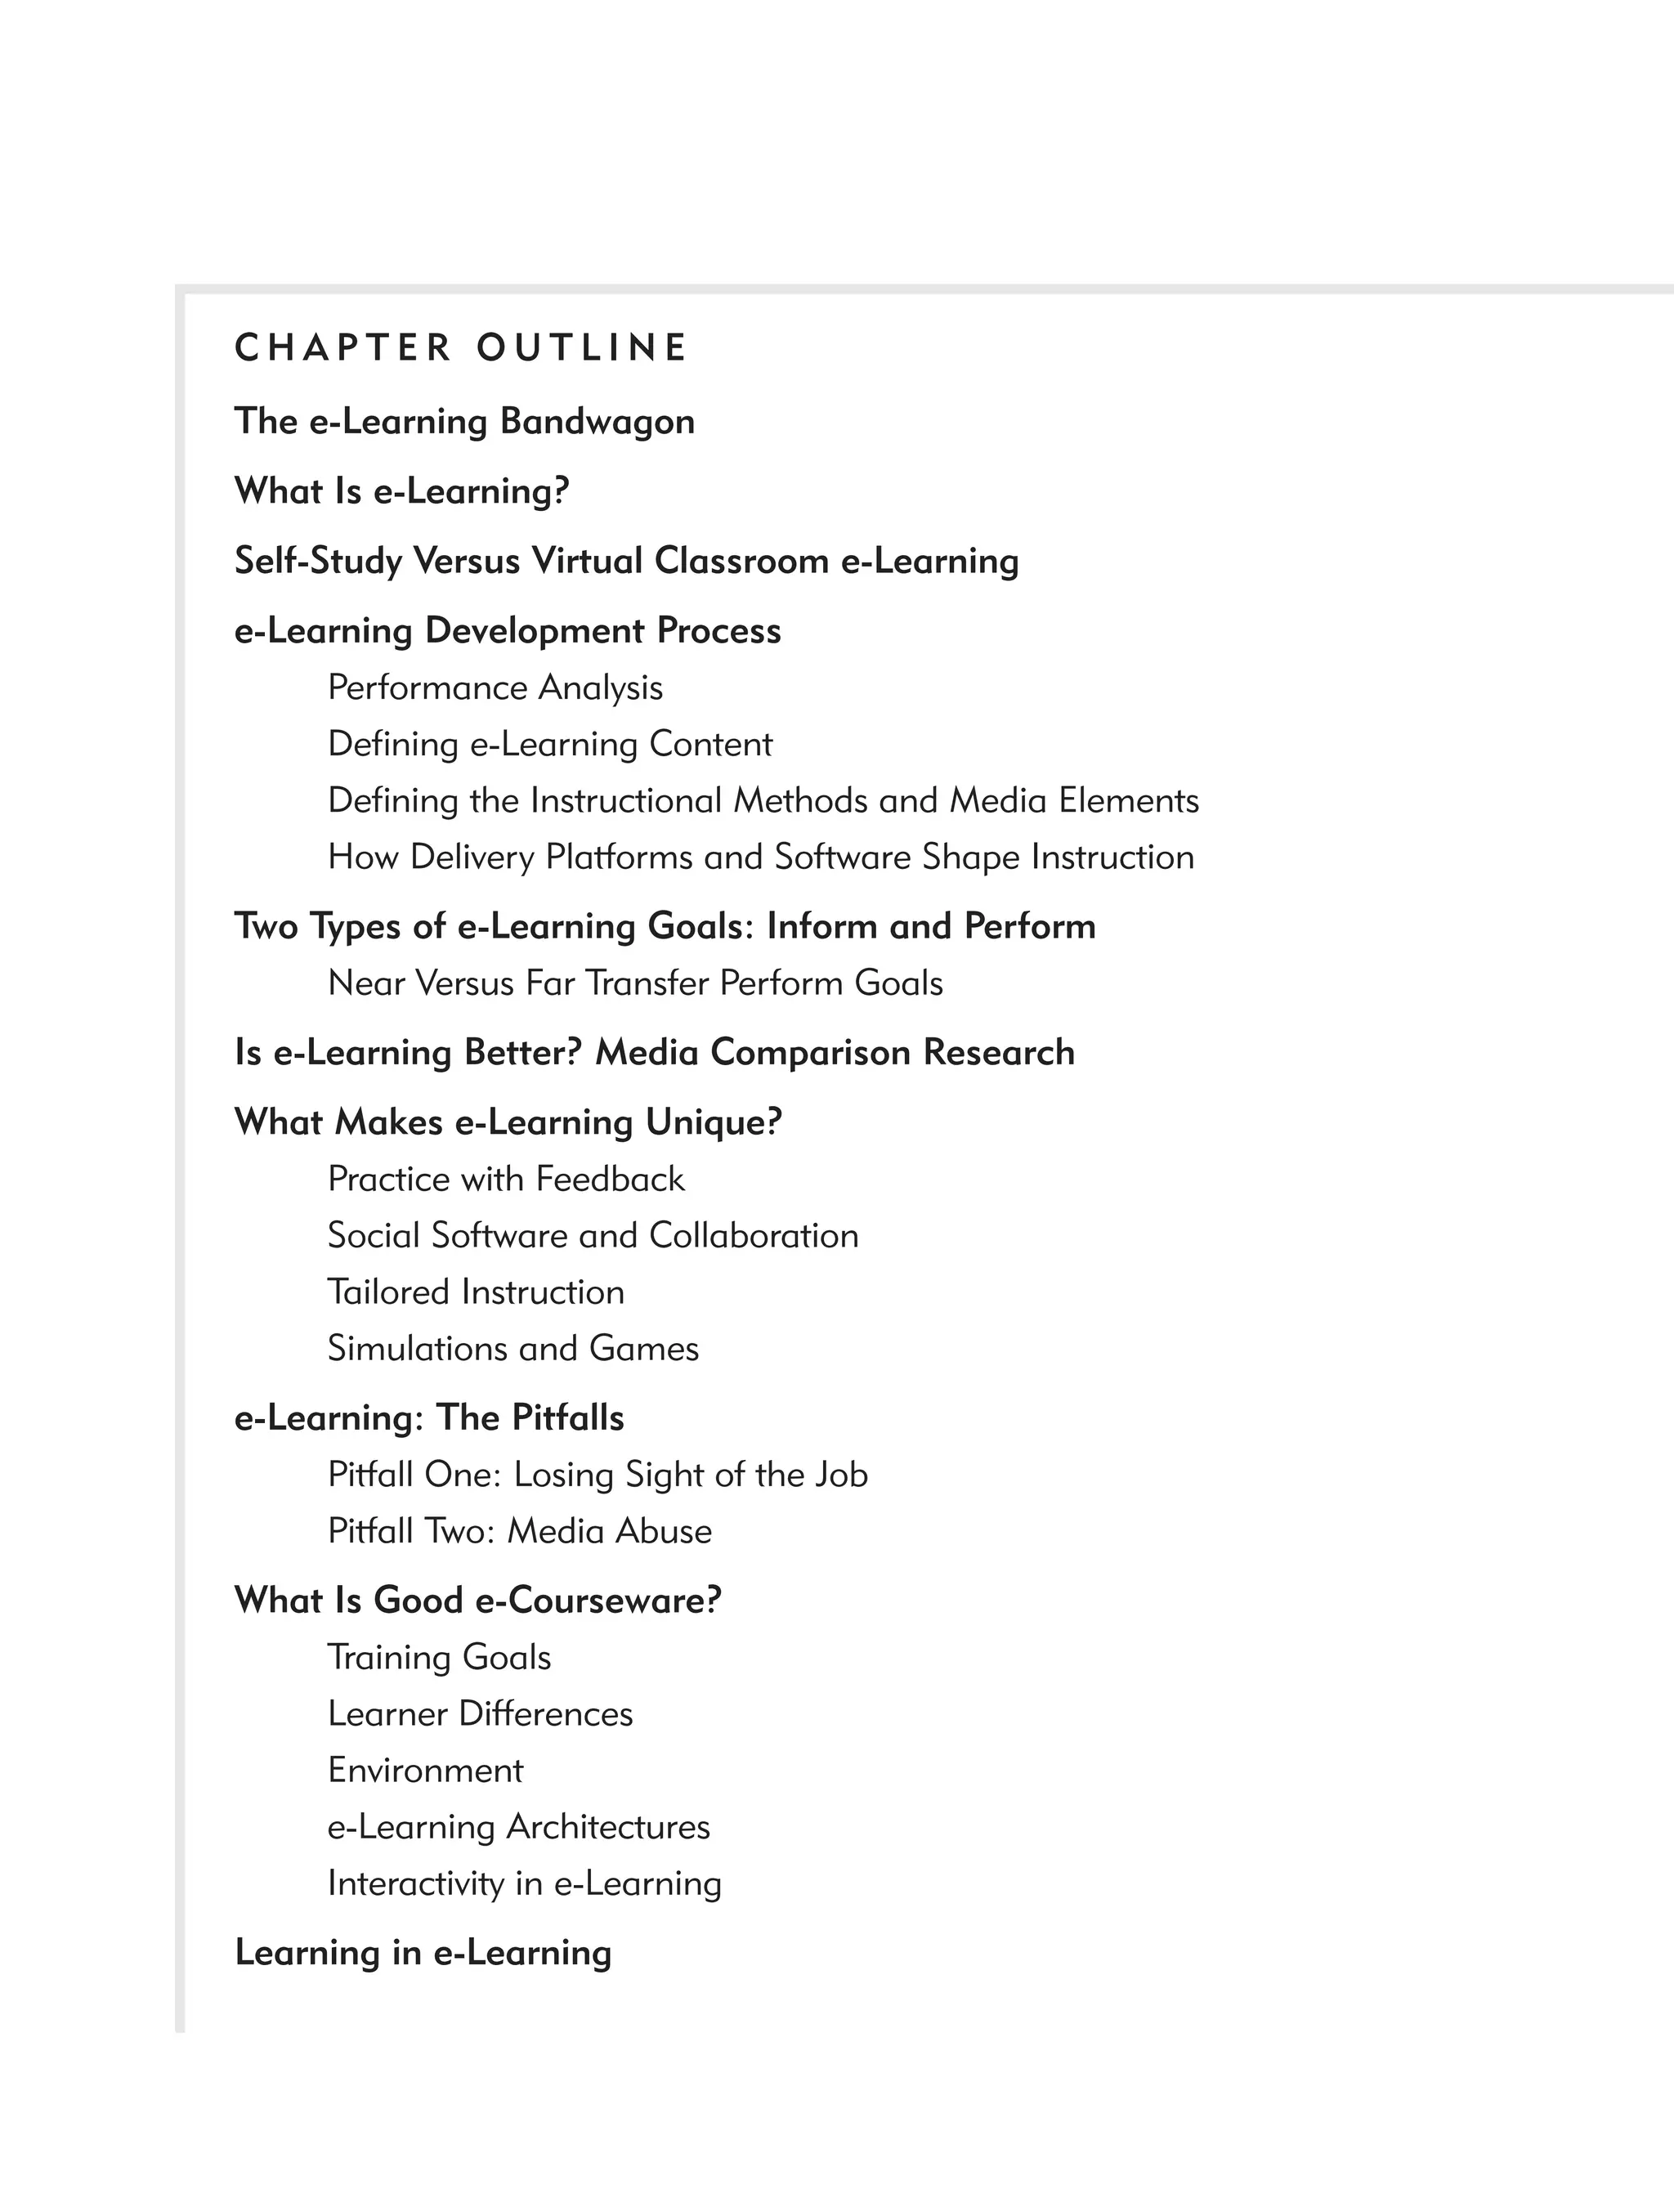
CHAPTER OUTLINE
The e-LearningBandwagon
What Is e-Learning?
Self-Study Versus Virtual Classroom e-Learning
e-Learning Development Process
Performance Analysis
Defining e-Learning Content
Defining the Instructional Methods and Media Elements
How Delivery Platforms and Software Shape Instruction
Two Types of e-Learning Goals: Inform and Perform
Near Versus Far Transfer Perform Goals
Is e-Learning Better? Media Comparison Research
What Makes e-Learning Unique?
Practice with Feedback
Social Software and Collaboration
Tailored Instruction
Simulations and Games
e-Learning: The Pitfalls
Pitfall One: Losing Sight of the Job
Pitfall Two: Media Abuse
What Is Good e-Courseware?
Training Goals
Learner Differences
Environment
e-Learning Architectures
Interactivity in e-Learning
Learning in e-Learning
24.
1
e-Learning
PROMISE AND PITFALLS
WH AT ’ S N E W I N T H I S C H A P T E R ?
I N THIS CHAPTER we define e-learning as training delivered on a
computer (including CD-ROM, Internet, or intranet) that is designed
to support individual learning or organizational performance goals. We
include e-courses developed primarily to provide information (inform
courses), as well as those designed to build specific job-related skills (per-
form courses).
Since our first edition, synchronous forms of e-learning, also called vir-
tual classrooms, have assumed a large and growing share of online training
courseware. Therefore we expanded this edition to illustrate how our guide-
lines apply to virtual classrooms.
Instructional methods that support rather than defeat human learning
processes are an essential ingredient of all good e-learning courseware. The
best methods will depend on the goals of the training (for example, to inform
7
25.
8 e-Learning and the Science of Instruction
or to perform); the learners’ related skills; and various environmental factors,
including technological, cultural, and pragmatic constraints. We distinguish
among three design architectures for e-learning: receptive, directive, and
guided discovery.
The e-Learning Bandwagon
In our first edition, we asked whether the proliferating cyber courses of the
late 20th Century were harbingers of a new age in learning or just another
overstatement of the expectations that had surrounded nearly everything
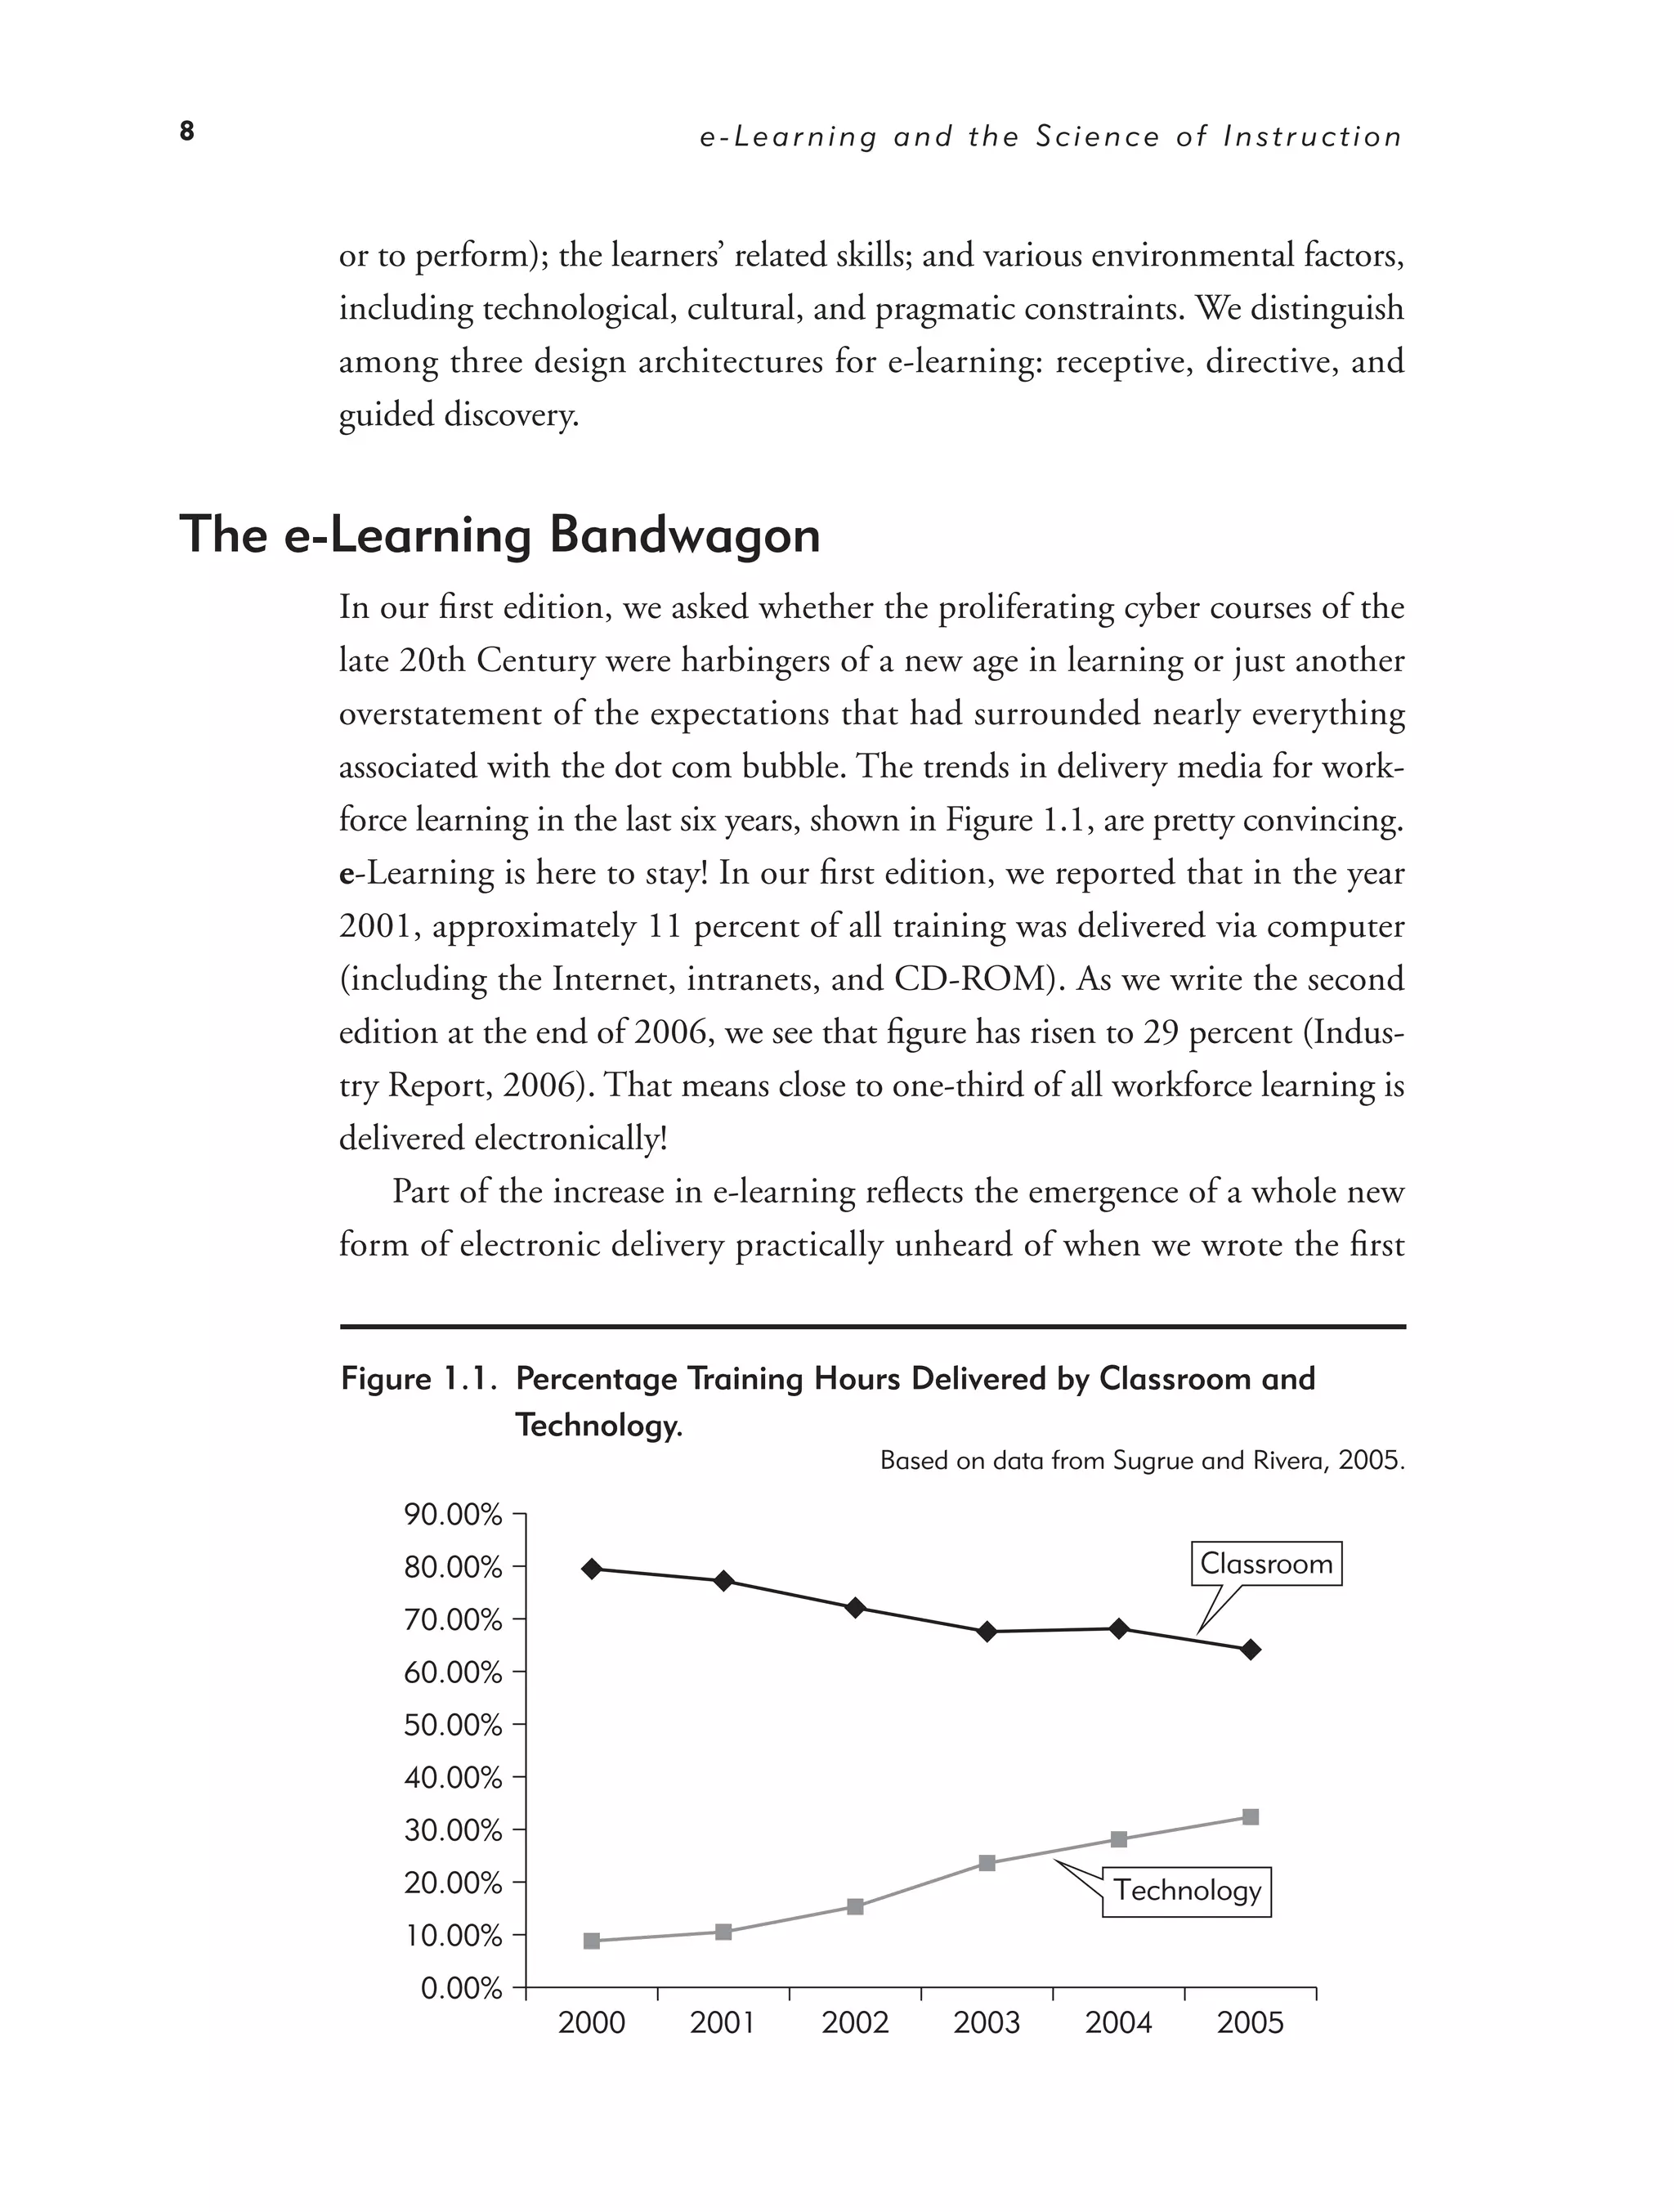
associated with the dot com bubble. The trends in delivery media for work-
force learning in the last six years, shown in Figure 1.1, are pretty convincing.
e-Learning is here to stay! In our first edition, we reported that in the year
2001, approximately 11 percent of all training was delivered via computer
(including the Internet, intranets, and CD-ROM). As we write the second
edition at the end of 2006, we see that figure has risen to 29 percent (Indus-
try Report, 2006). That means close to one-third of all workforce learning is
delivered electronically!
Part of the increase in e-learning reflects the emergence of a whole new
form of electronic delivery practically unheard of when we wrote the first
Figure 1.1. Percentage Training Hours Delivered by Classroom and
Technology.
Based on data from Sugrue and Rivera, 2005.
90.00%
80.00% Classroom
70.00%
60.00%
50.00%
40.00%
30.00%
20.00% Technology
10.00%
0.00%
2000 2001 2002 2003 2004 2005
26.
e - Le a r n i n g : Pr o m i s e a n d Pi t f a l l s 9
edition: the virtual classroom. In 2003, the first data on use of virtual class-
rooms reported 3 percent of all training hours were delivered via synchronous
e-learning (Sugrue & Rivera, 2005). In just a few short years, that number
has grown to 15 percent! The lure of travel savings and rapid deployment of
training has made the virtual classroom a popular alternative to asynchronous
e-learning. However, it remains to be seen how the mix of synchronous and
asynchronous forms of e-learning will balance out. For example, in 2006,
self-study asynchronous forms of e-learning rose from 7 percent in 2005 to
15 percent of all delivery hours (Industry Report, 2006). What is certain is
that e-learning of all types is growing as a dominant delivery medium for
workforce learning.
e-Learning is used across the board to support diverse organizational train-
ing goals. The training requirements that make heaviest use of e-learning
include profession or industry-specific training at 74 percent, compli-
ance training at 68 percent, and desktop application training at 66 percent
(Industry Report, 2006). Some training areas relying less on online learning
include sales, customer service, executive development, and interpersonal skills
training. These training goals have interpersonal skills as a common element
that is perceived to benefit most from face-to-face classroom instruction.
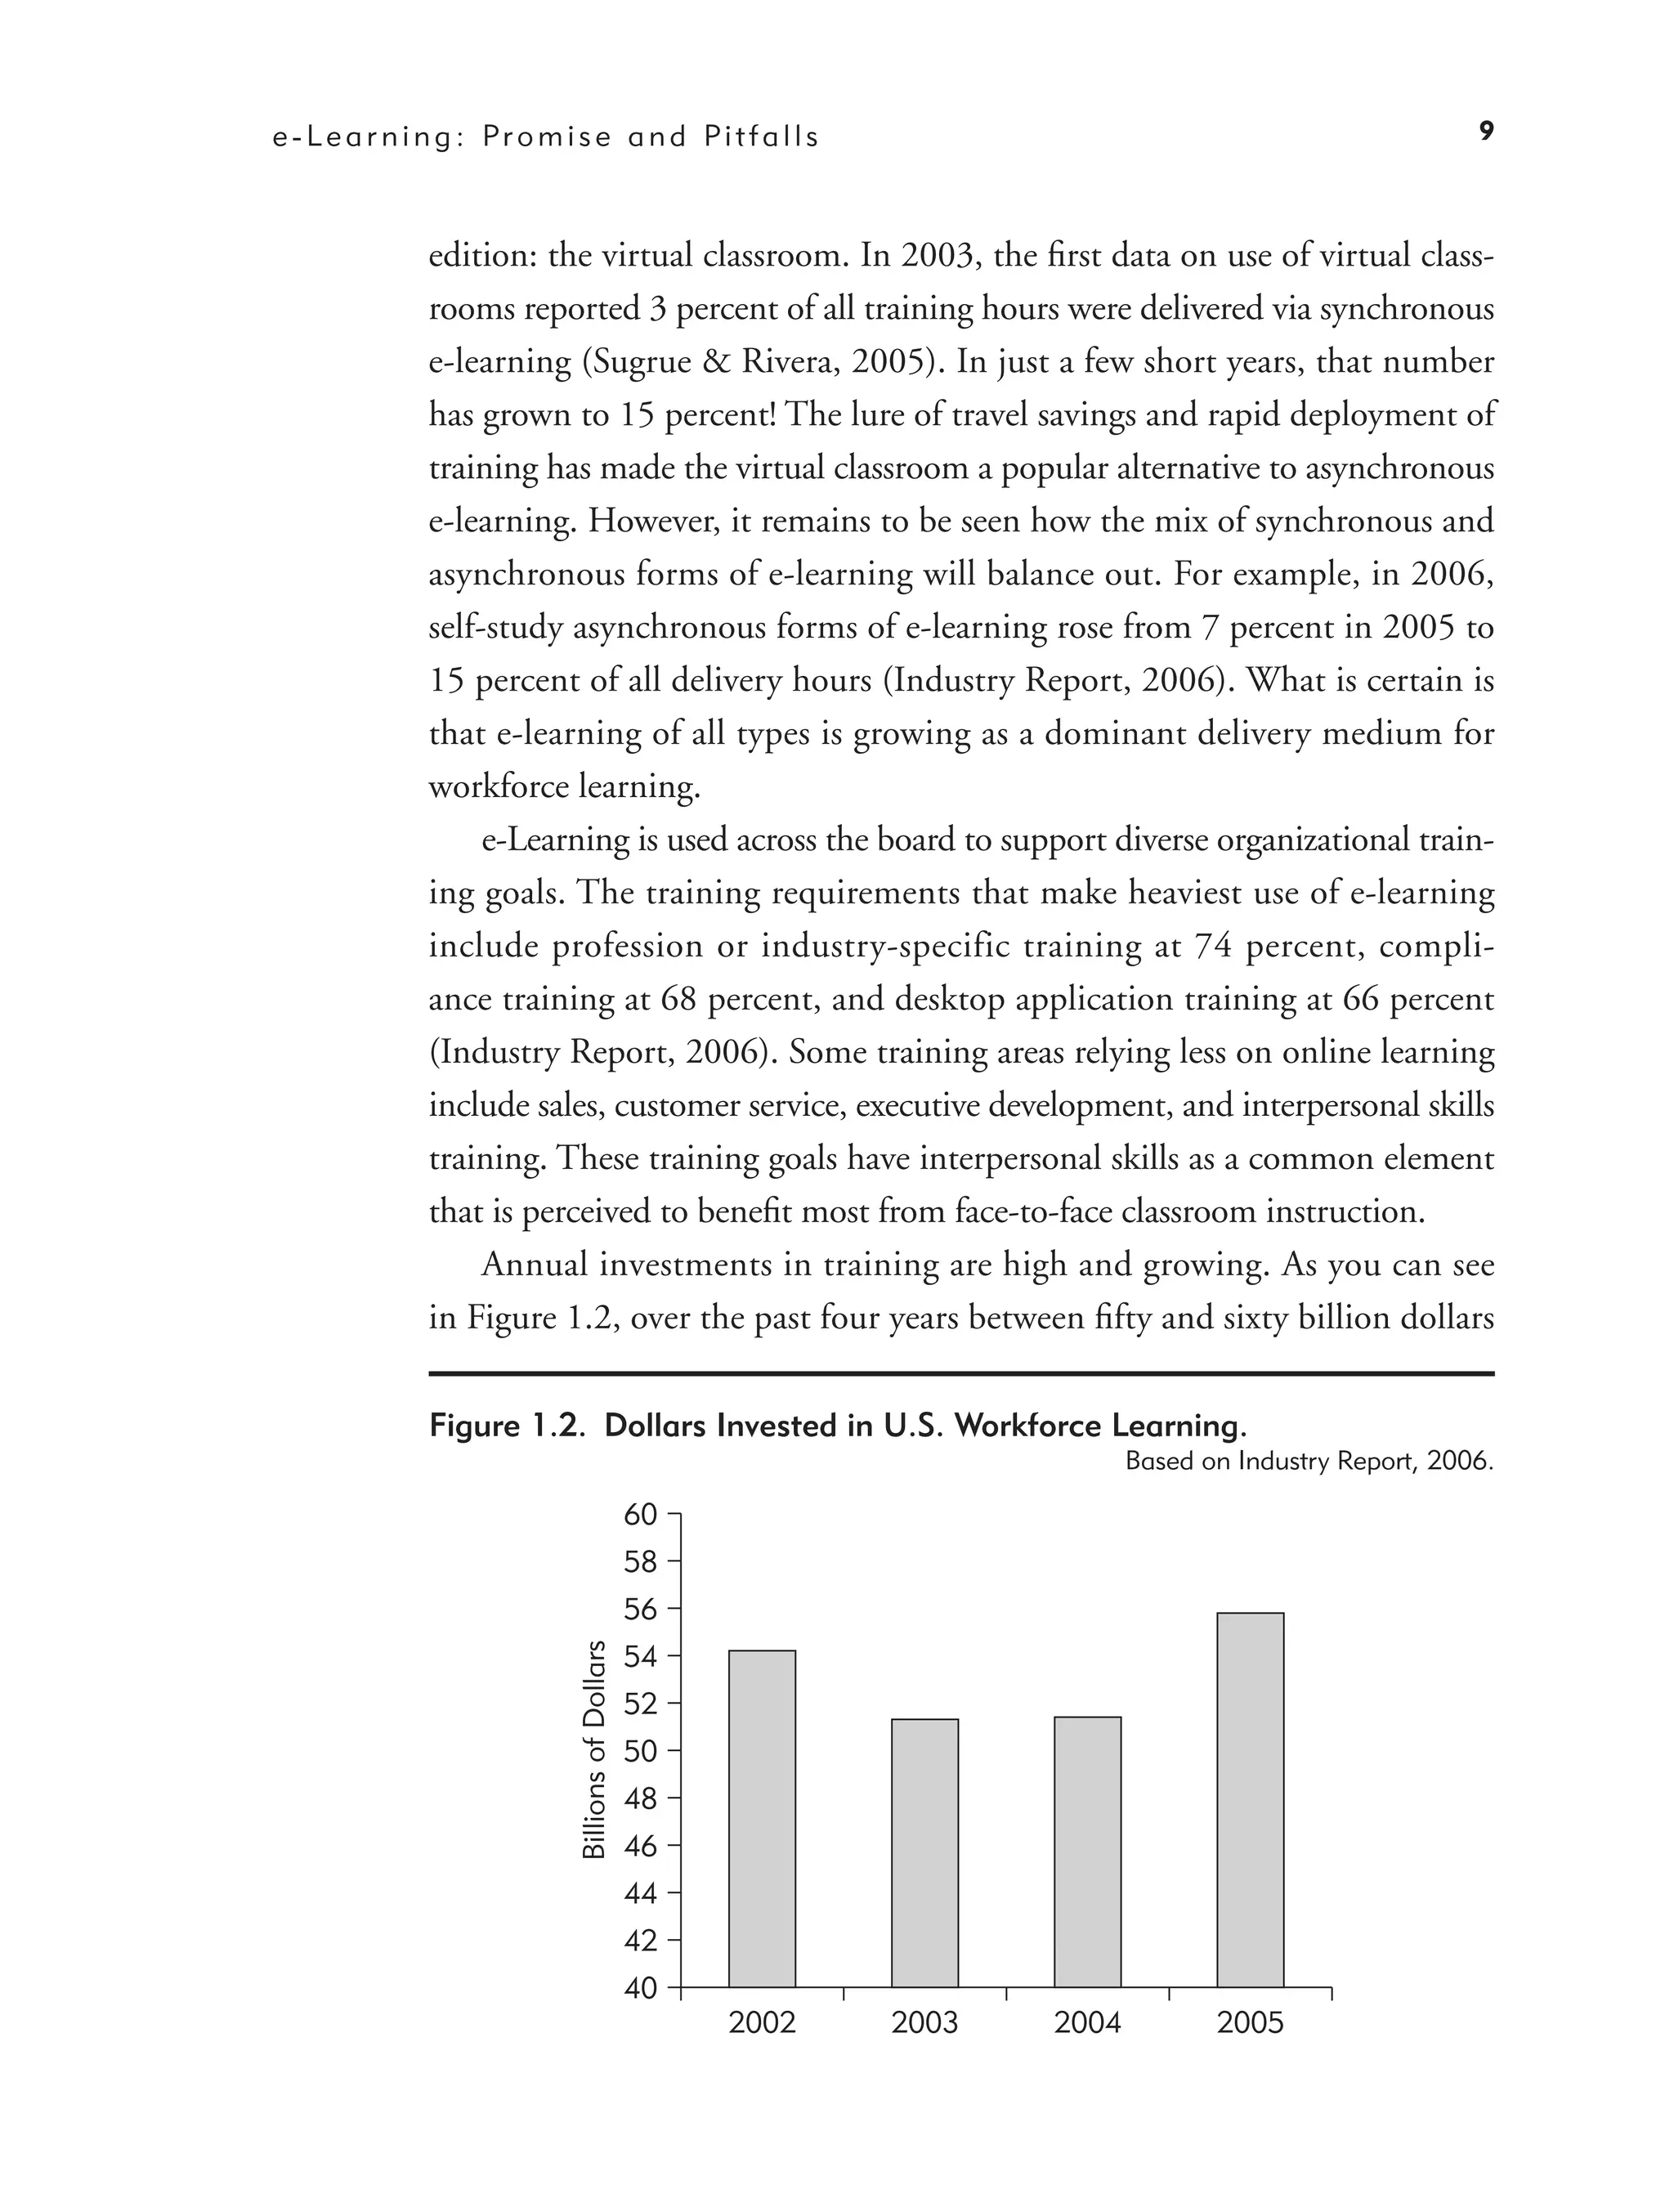
Annual investments in training are high and growing. As you can see
in Figure 1.2, over the past four years between fifty and sixty billion dollars
Figure 1.2. Dollars Invested in U.S. Workforce Learning.
Based on Industry Report, 2006.
60
58
56
Billions of Dollars
54
52
50
48
46
44
42
40
2002 2003 2004 2005
27.
10 e-Learning and the Science of Instruction
were spent on training workers in corporate and governmental organiza-
tions in the United States (Industry Report, 2006). And these figures don’t
include the most expensive element of training, the salary time and lost
opportunity costs of those taking training. Organizations are turning to
e-learning to save training time and travel costs associated with traditional
face-to-face learning. However, cost savings are only an illusion when
e-learning does not effectively build knowledge and skills linked to desired
job outcomes. Does e-learning offer a potential opportunity to cost-
effectively build the skills required for the knowledge-based economy of
this century? Part of the answer will depend on the quality of the instruc-
tion embedded in the e-learning products you are designing, building, or
selecting today.
What Is e-Learning?
We define e-learning as instruction delivered on a computer by way of
CD-ROM, Internet, or intranet with the following features:
• Includes content relevant to the learning objective
• Uses instructional methods such as examples and practice to help
learning
• Uses media elements such as words and pictures to deliver the content
and methods
• May be instructor-led (synchronous e-learning) or designed for self-
paced individual study (asynchronous e-learning)
• Builds new knowledge and skills linked to individual learning goals
or to improved organizational performance
As you can see, this definition has several elements concerning the what,
how, and why of e-learning.
What. e-Learning courses include both content (that is, information)
and instructional methods (that is, techniques) that help people learn
the content.
28.
e - Le a r n i n g : Pr o m i s e a n d Pi t f a l l s 11
How. e-Learning courses are delivered via computer using words in the
form of spoken or printed text and pictures, such as illustrations, pho-
tos, animation, or video. Some forms of e-learning (asynchronous) are
designed for individual self-study. New e-learning formats called virtual
classrooms or synchronous e-learning are designed for real-time instruc-
tor-led training. Both formats may support asynchronous collaboration
with others through tools such as wikis, discussion boards, and email.
Why. e-Learning courses are intended to help learners reach personal
learning objectives or perform their jobs in ways that improve the
bottom-line goals of the organization.
In short, the “e” in e-learning refers to the “how”: the course is digitized so
it can be stored in electronic form. The “learning” in e-learning refers to the
“what”: the course includes content and ways to help people learn it; and
the “why” refers to the purpose: to help individuals achieve educational goals
or to help organizations build skills related to improved job performance.
Our definition indicates that the goal of e-learning is to build job-
transferable knowledge and skills linked to organizational performance or
to help individuals achieve personal learning goals. Although the guidelines
we present throughout the book do apply to lessons designed for educa-
tional or general interest learning goals, our emphasis is on instructional
programs that are built or purchased for workforce learning.
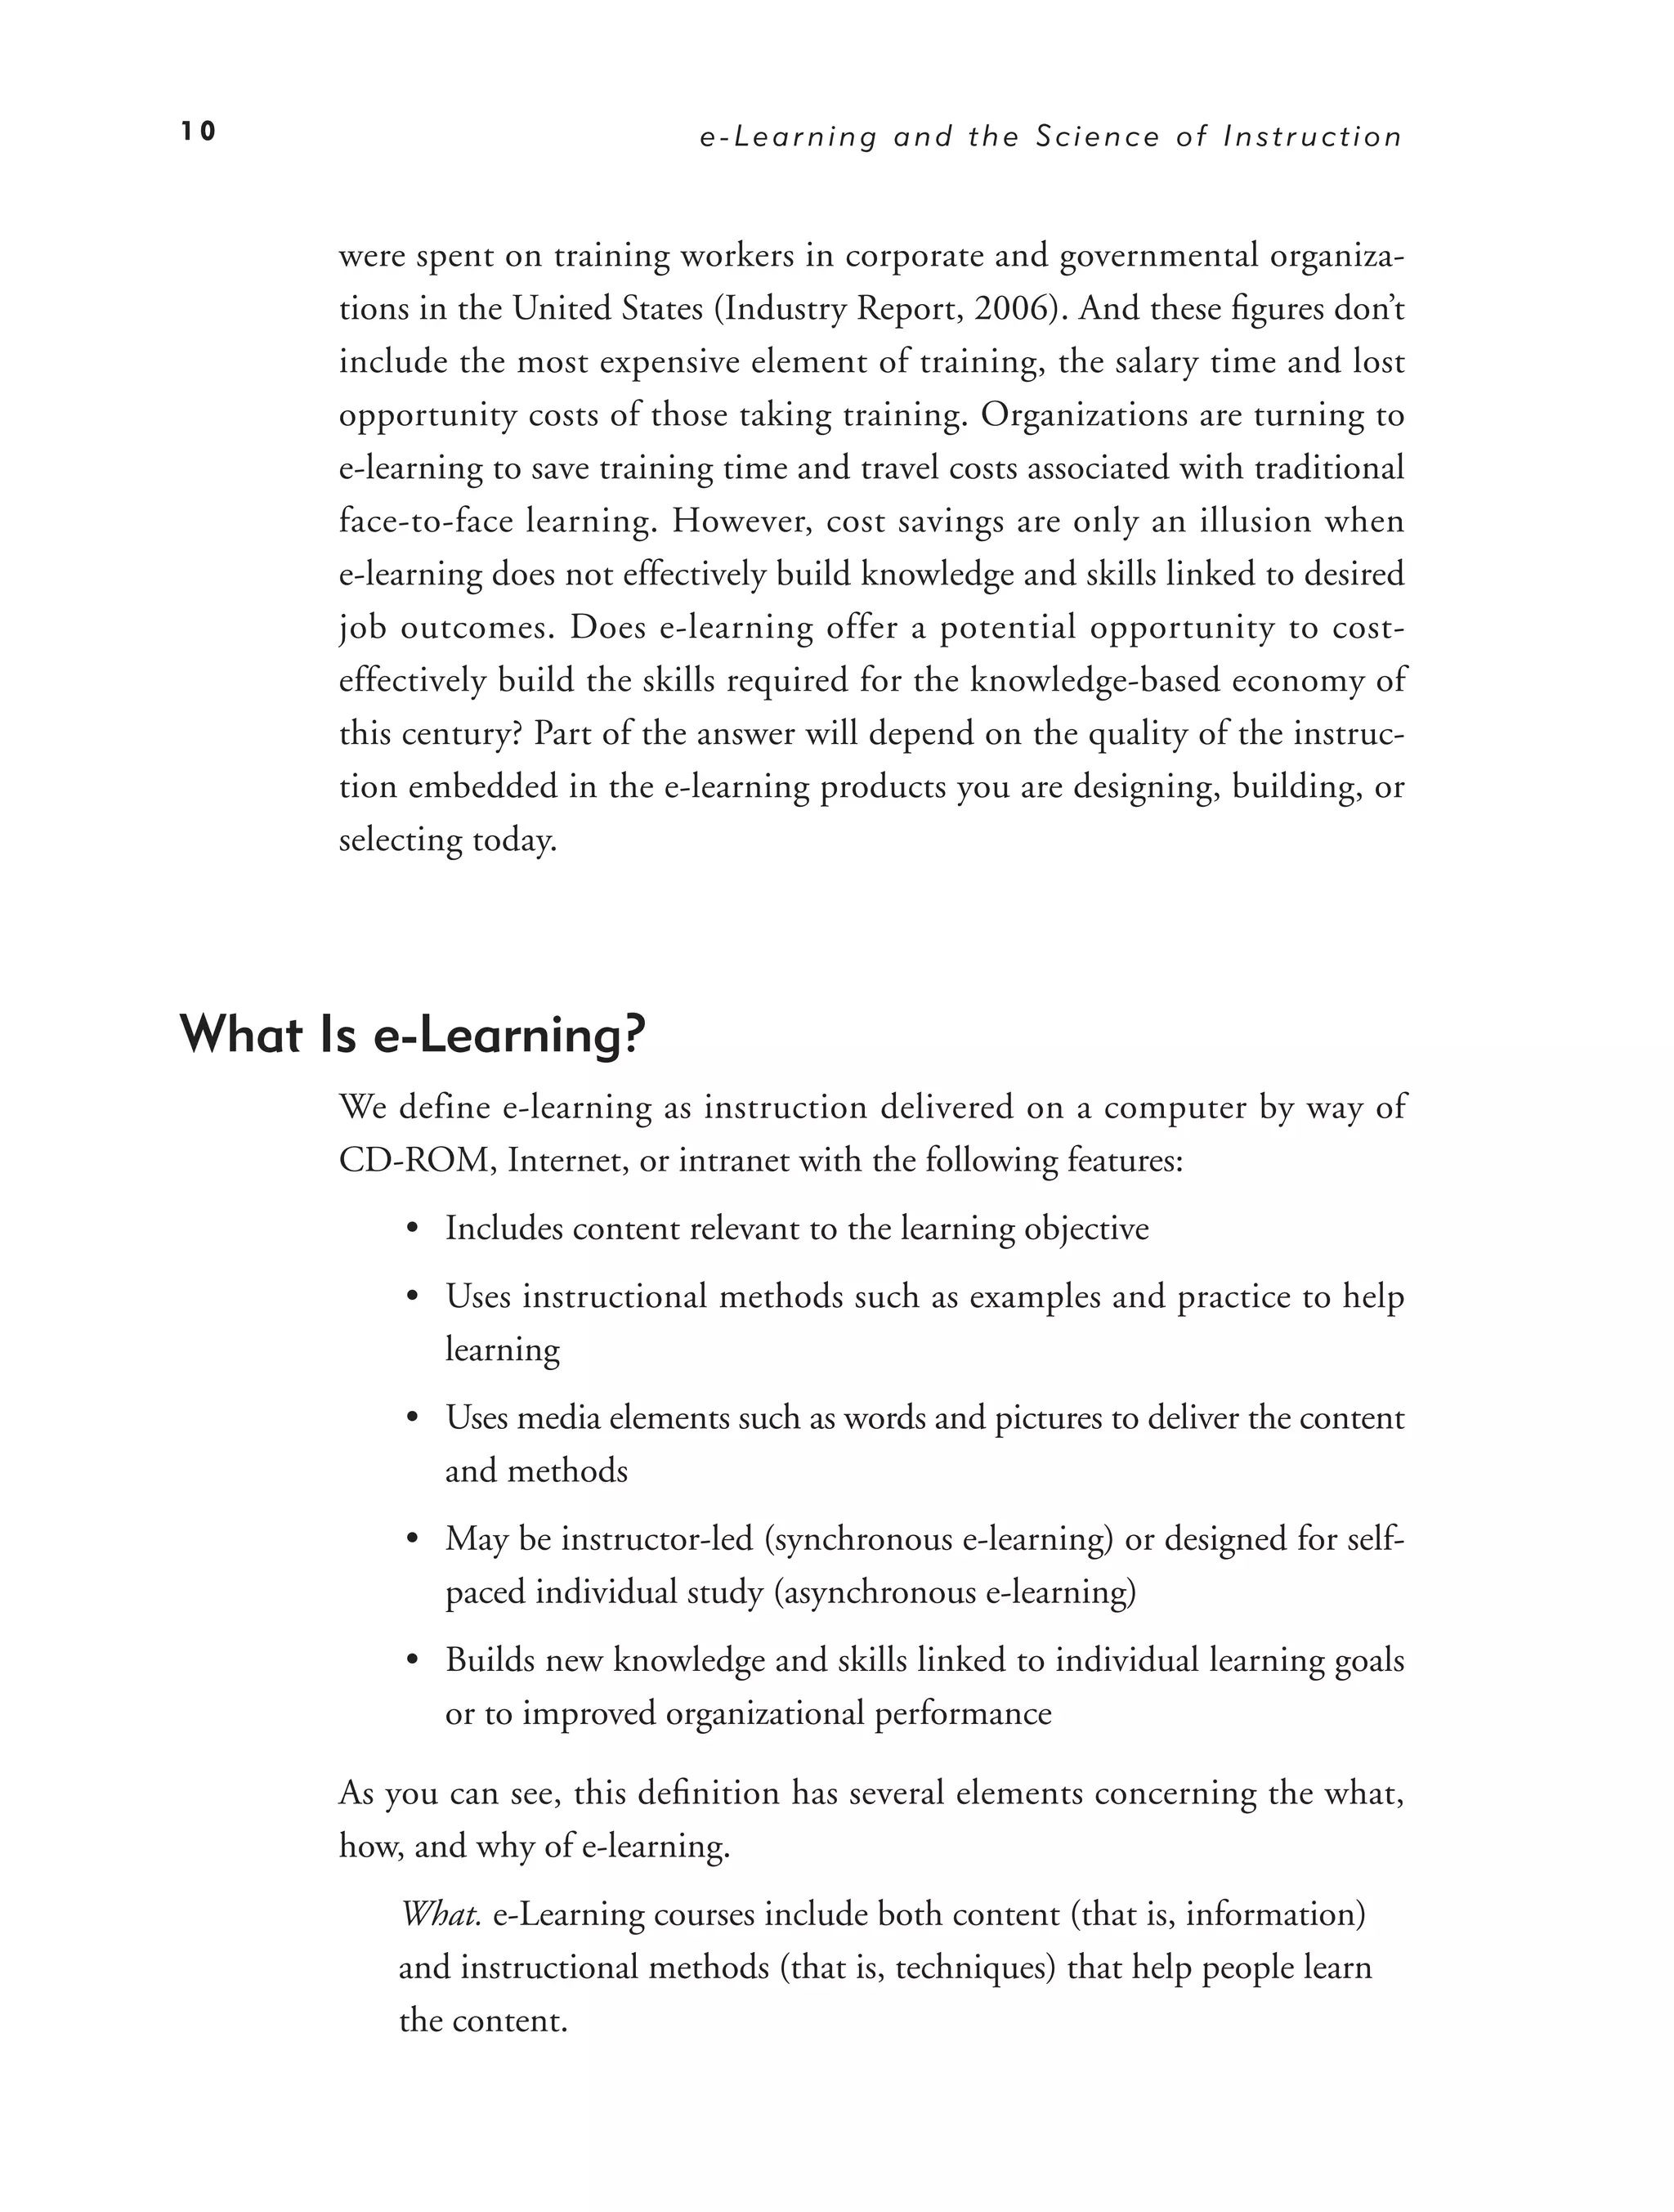
Self-Study Versus Virtual Classroom e-Learning
Our first edition focused exclusively on self-study forms of e-learning, also
called asynchronous e-learning. Figure 1.3 shows a screen shot from an
asynchronous course on How to Construct Formulas in Excel. Asynchronous
courses are designed to be taken by individuals at their own time and pace.
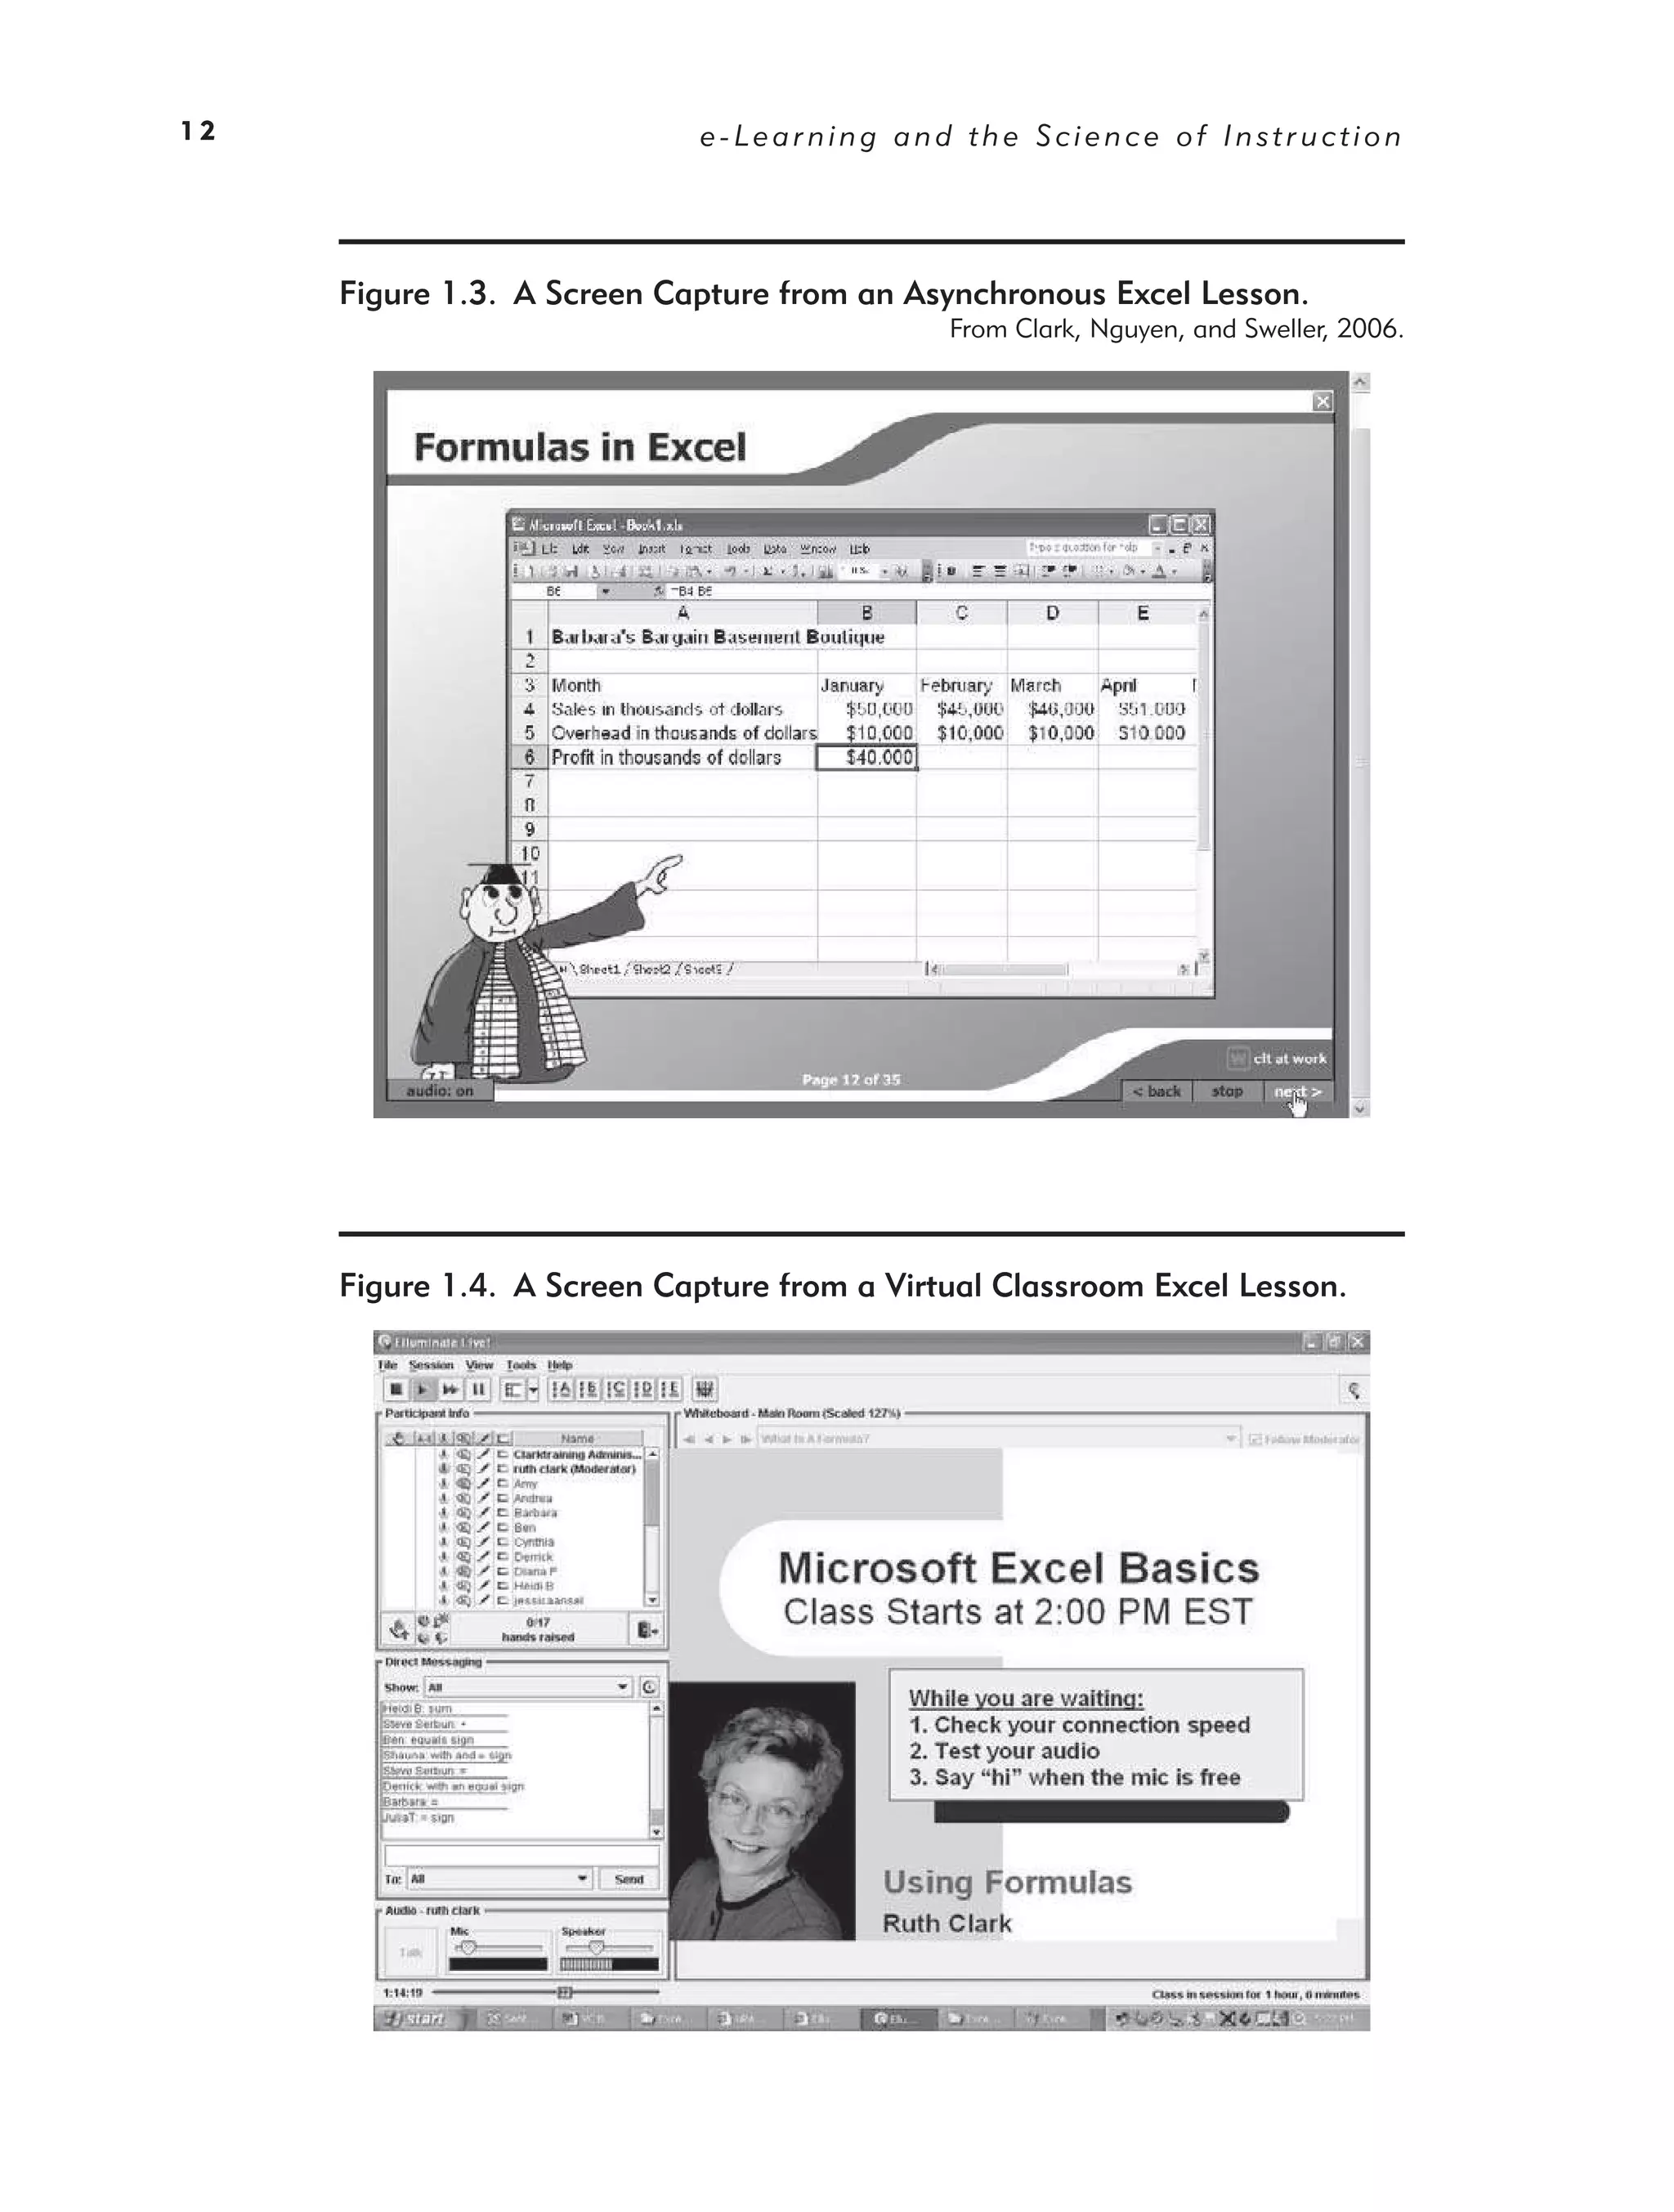
In contrast, Figure 1.4 shows a screen shot from a virtual classroom course
on How to Construct Formulas in Excel.
Take a close look at Figure 1.4 if you are new to the virtual classroom.
From WebEx to Live Meetings, most virtual classroom tools incorporate
similar functions, although the screen interfaces may differ. Figure 1.4 shows
a screen capture from Elluminate virtual classroom software. The largest
29.
12 e-Learning and the Science of Instruction
Figure 1.3. A Screen Capture from an Asynchronous Excel Lesson.
From Clark, Nguyen, and Sweller, 2006.
Figure 1.4. A Screen Capture from a Virtual Classroom Excel Lesson.
30.
e - Le a r n i n g : Pr o m i s e a n d Pi t f a l l s 13
portion of the screen is devoted to the whiteboard on which the instructor
can project slides. To the upper left of the whiteboard is the participant
window showing the names of everyone attending the session. Below the
participant window is a chat box in which everyone can type text messages.
At the bottom left is an audio control box used by instructors or partici-
pants when they want to speak. The instructor and class participants wear
headsets with microphones, allowing them to speak and to hear what others
are saying.
Clark and Kwinn (2007) characterize virtual classroom technology as a hybrid
tool, one that incorporates some features of both asynchronous e-learning and
instructor-led face-to-face classrooms. Like asynchronous e-learning, the virtual
classroom relies on screen real estate to communicate content and instructional
methods. Also like asynchronous e-learning, virtual classrooms benefit from
frequent learner interactions to sustain attention and promote learning. Like
face-to-face classrooms, virtual classrooms are instructor-led. Therefore, presenta-
tion rates are not controlled by learners as in most asynchronous e-learning. In
addition, opportunities for social presence are higher in the virtual classroom than
in asynchronous e-learning, since virtual classrooms are typically designed for
group learning, while asynchronous e-learning is typically designed for individual
self-study.
e-Learning Development Process
We saw in Figure 1.2 that training investments in business and industry are
nearing $60 billion! To get a return on investment, all training initiatives,
including e-learning, must improve job performances that lead to achieve-
ment of organizational operational goals. Operational goals are bottom-
line indicators of organizational success, such as increase in market share,
decrease in product flaws or errors, increase in customer satisfaction, or fewer
accidents, to name but a few. Unless some analysis and planning accom-
panies any e-learning project, any return on investment is likely to be by
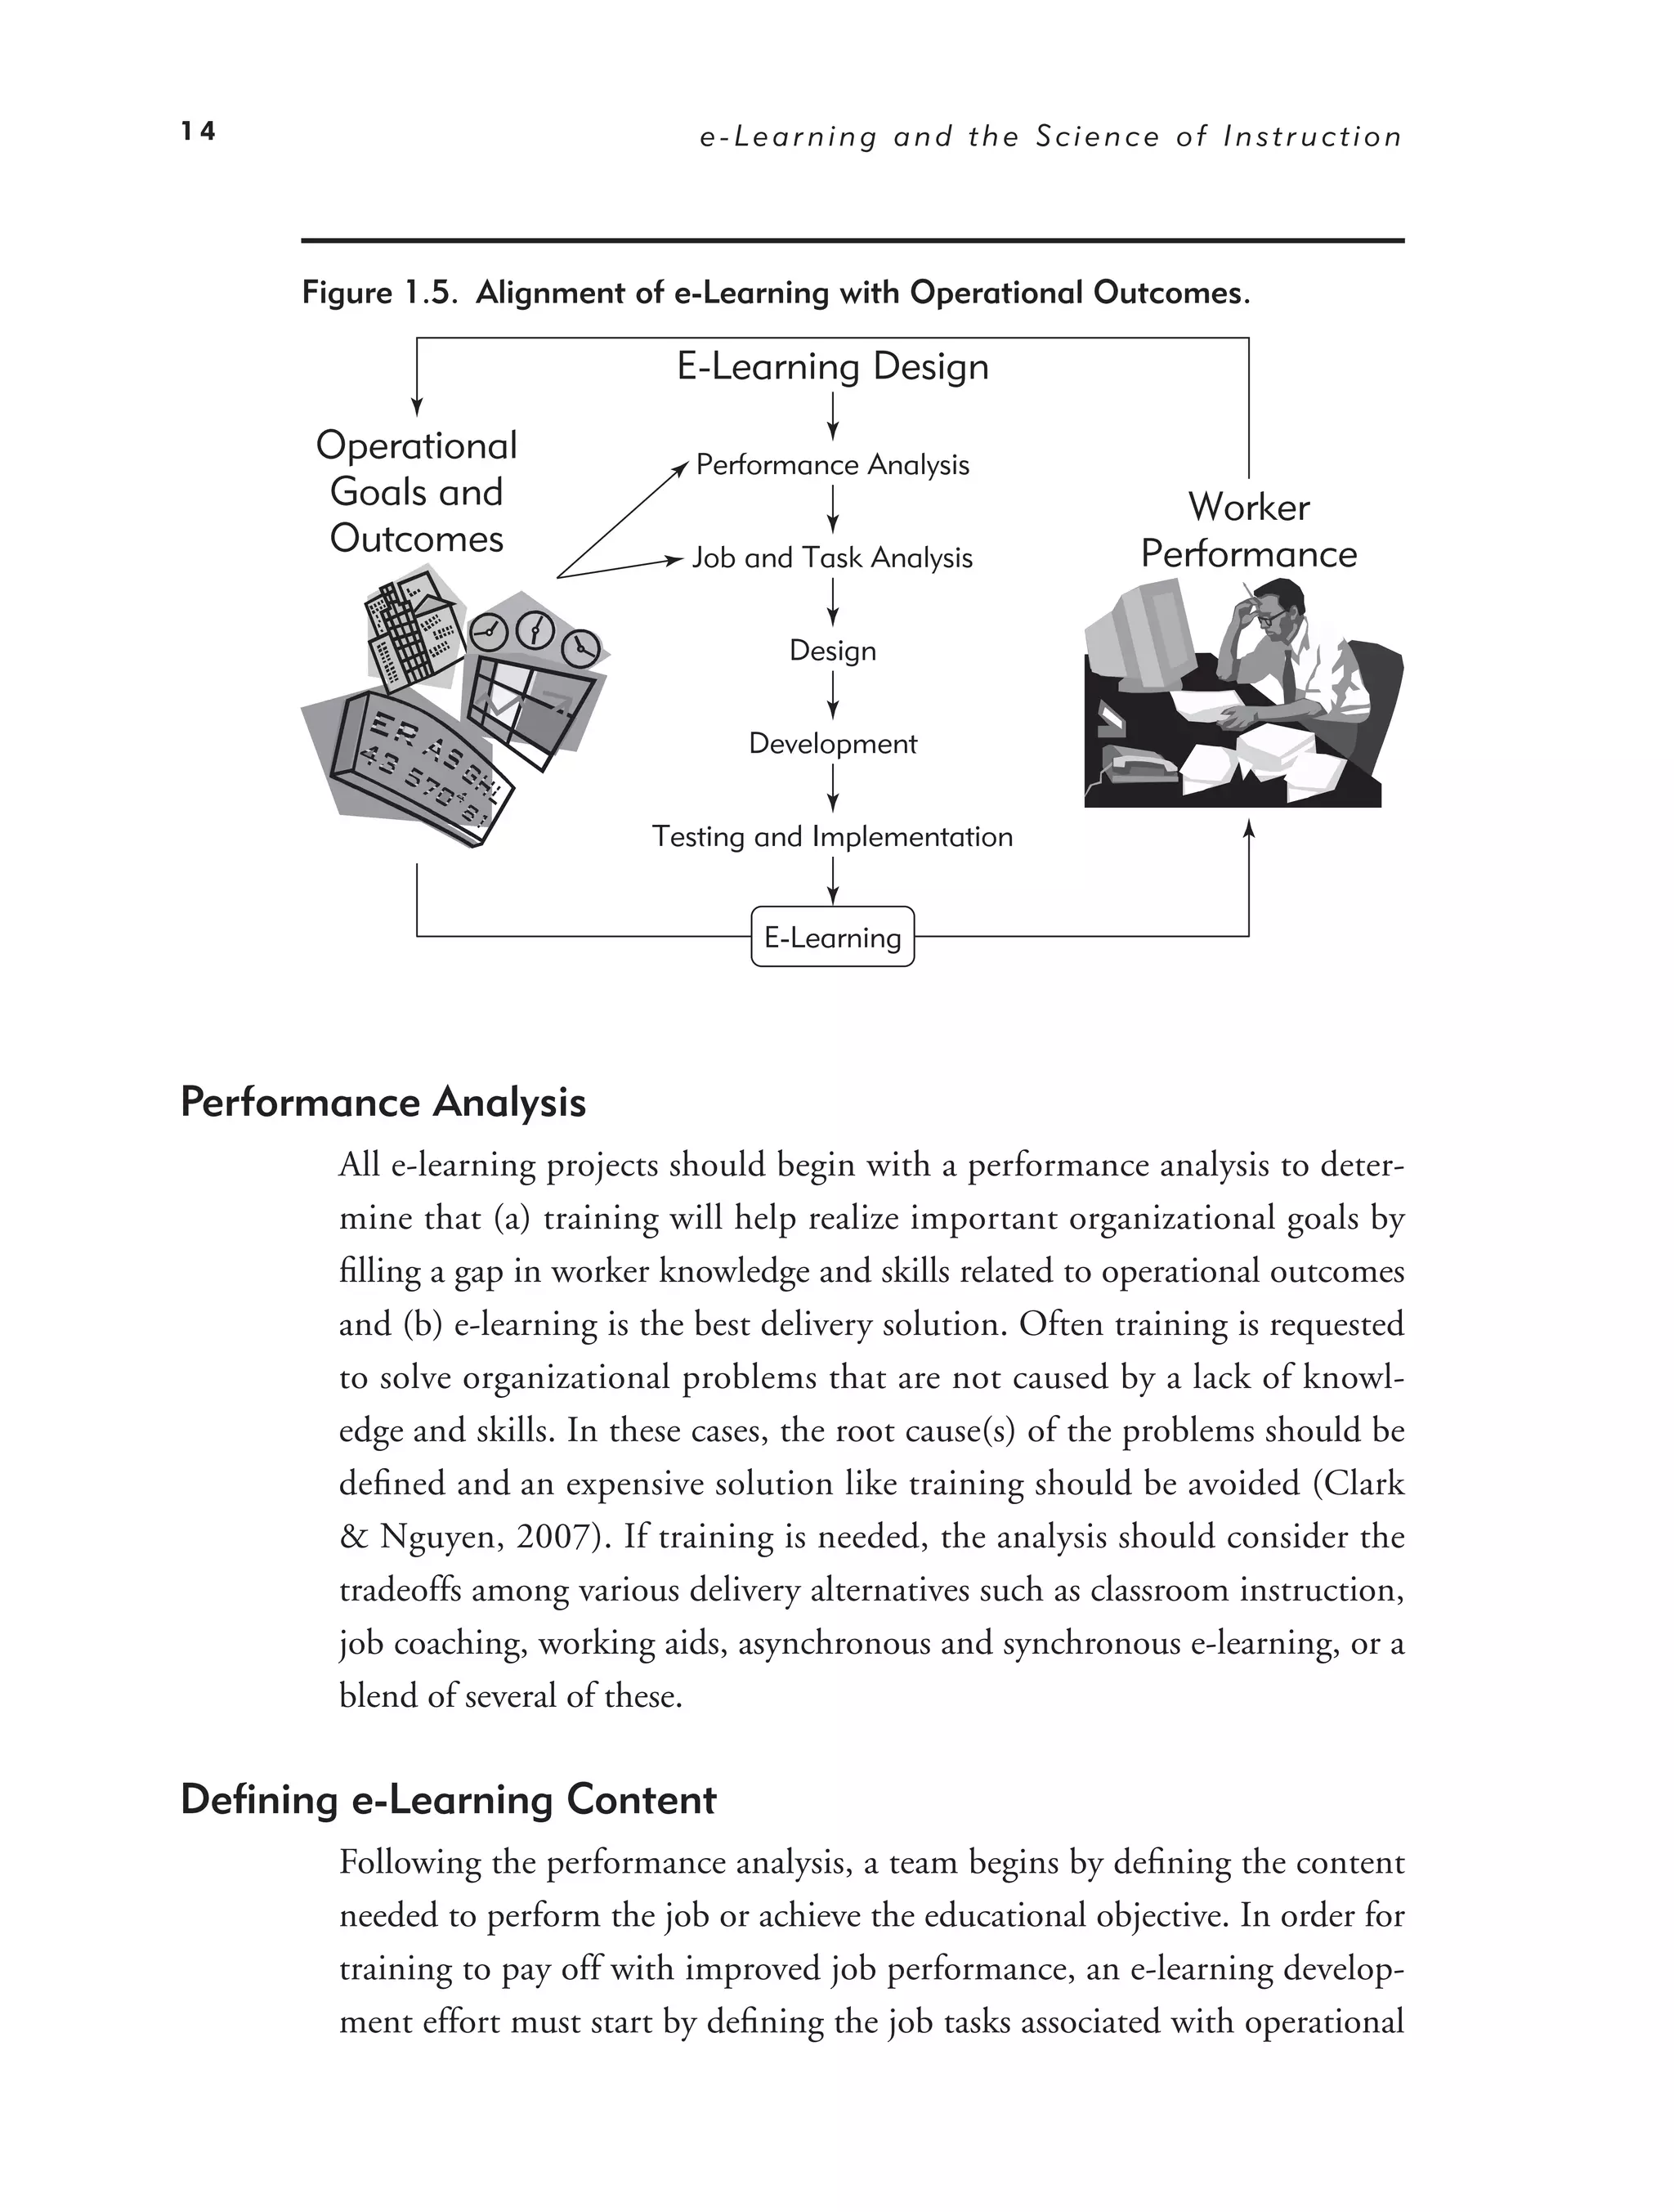
chance alone. In Figure 1.5 we summarize a systematic process for e-learning
projects. Since there are many good books on e-learning development, we
provide only a brief overview here.
31.
14 e-Learning and the Science of Instruction
Figure 1.5. Alignment of e-Learning with Operational Outcomes.
E-Learning Design
Operational Performance Analysis
Goals and Worker
Outcomes Job and Task Analysis Performance
Design
Development
Testing and Implementation
E-Learning
Performance Analysis
All e-learning projects should begin with a performance analysis to deter-
mine that (a) training will help realize important organizational goals by
filling a gap in worker knowledge and skills related to operational outcomes
and (b) e-learning is the best delivery solution. Often training is requested
to solve organizational problems that are not caused by a lack of knowl-
edge and skills. In these cases, the root cause(s) of the problems should be
defined and an expensive solution like training should be avoided (Clark
& Nguyen, 2007). If training is needed, the analysis should consider the
tradeoffs among various delivery alternatives such as classroom instruction,
job coaching, working aids, asynchronous and synchronous e-learning, or a
blend of several of these.
Defining e-Learning Content
Following the performance analysis, a team begins by defining the content
needed to perform the job or achieve the educational objective. In order for
training to pay off with improved job performance, an e-learning develop-
ment effort must start by defining the job tasks associated with operational
32.
e - Le a r n i n g : Pr o m i s e a n d Pi t f a l l s 15
goals and the knowledge needed to perform these tasks. The e-learning
development team observes and interviews people who are expert at a job to
define the job skills and knowledge. For courseware developed for broader
educational purposes, rather than a job analysis, the development team con-
ducts a content analysis to define the major topics and related subtopics to
be included.
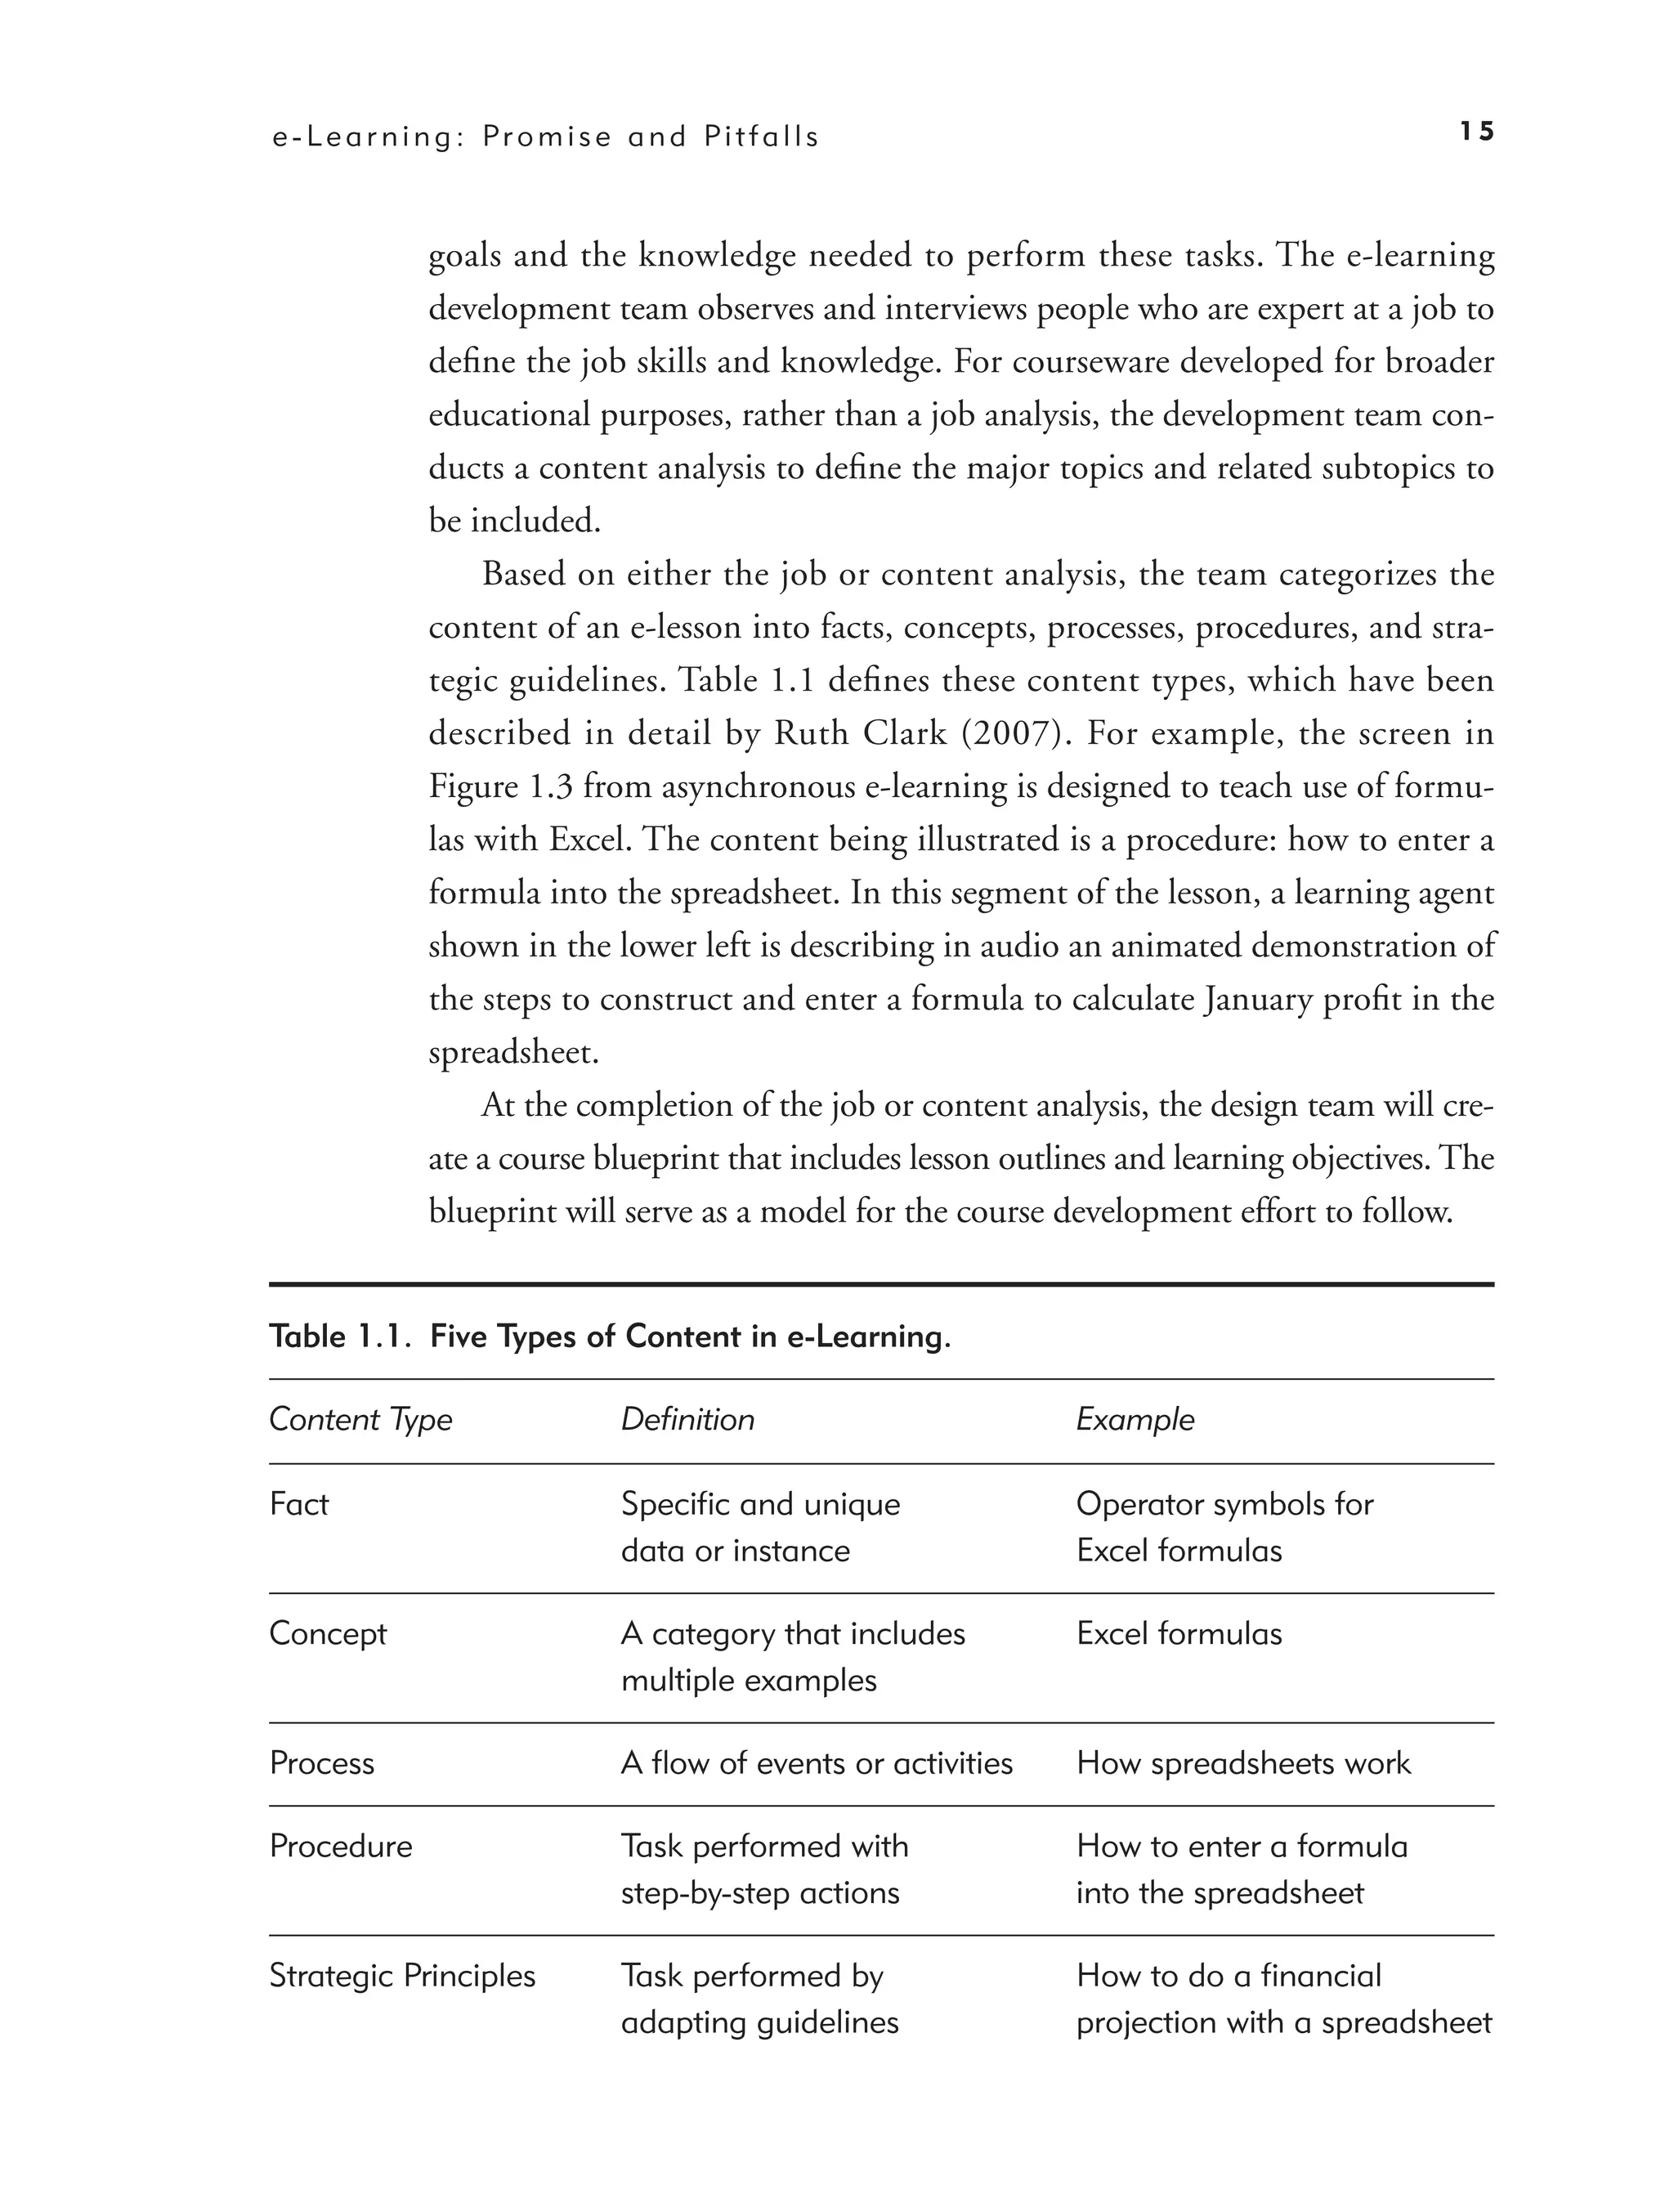
Based on either the job or content analysis, the team categorizes the
content of an e-lesson into facts, concepts, processes, procedures, and stra-
tegic guidelines. Table 1.1 defines these content types, which have been
described in detail by Ruth Clark (2007). For example, the screen in
Figure 1.3 from asynchronous e-learning is designed to teach use of formu-
las with Excel. The content being illustrated is a procedure: how to enter a
formula into the spreadsheet. In this segment of the lesson, a learning agent
shown in the lower left is describing in audio an animated demonstration of
the steps to construct and enter a formula to calculate January profit in the
spreadsheet.
At the completion of the job or content analysis, the design team will cre-
ate a course blueprint that includes lesson outlines and learning objectives. The
blueprint will serve as a model for the course development effort to follow.
Table 1.1. Five Types of Content in e-Learning.
Content Type Definition Example
Fact Specific and unique Operator symbols for
data or instance Excel formulas
Concept A category that includes Excel formulas
multiple examples
Process A flow of events or activities How spreadsheets work
Procedure Task performed with How to enter a formula
step-by-step actions into the spreadsheet
Strategic Principles Task performed by How to do a financial
adapting guidelines projection with a spreadsheet
33.
16 e-Learning and the Science of Instruction
Defining the Instructional Methods and Media Elements
Instructional methods support the learning of the content. Instruc-
tional methods include techniques such as examples, practice exercises,
and feedback. In our example screen shown in Figure 1.3 , the main
instructional method is a demonstration. We define media elements as
the audio and visual techniques used to present words and illustrations.
Media elements include text, narration, music, still graphics, photo-
graphs, and animation. In the Excel course, audio narration presents the
words of the learning agent and an animated graphic illustrates the steps
of the demonstration. One of our fundamental tenets is that, to be effec-
tive, instructional methods and the media elements that deliver them
must guide learners to effectively process and assimilate new knowledge
and skills.
How Delivery Platforms and Software Shape Instruction
e-Learning, as we use the term, includes training delivered via CD-ROM,
intranets, and the Internet. In our first edition, we reported that approxi-
mately 40 percent of computer-delivered training used CD-ROM, while
22 percent used the Internet and 30 percent used intranets (Galvin, 2001).
In the intervening five years, upgrades in organizations’ networks in combi-
nation with the advantages of networked delivery make Inter- and intranet
solutions the predominant distribution choice at close to 90 percent of all
e-learning (Sugrue & Rivera, 2005).
Your choice of delivery platform and software can influence which
instructional methods and media elements can be included in the course-
ware. For example, limitations in bandwidth, no sound cards, or lack of
headsets may limit the use of some media elements such as audio and video.
Most of the major virtual classroom tools support audio and brief video
clips. As we will see in later chapters, lack of audio is a constraint that will
negatively impact the instructional quality of your e-learning courseware. In
contrast, simple graphics are often as useful or better for learning than more
complex visuals such as animations and video.
34.
e - Le a r n i n g : Pr o m i s e a n d Pi t f a l l s 17
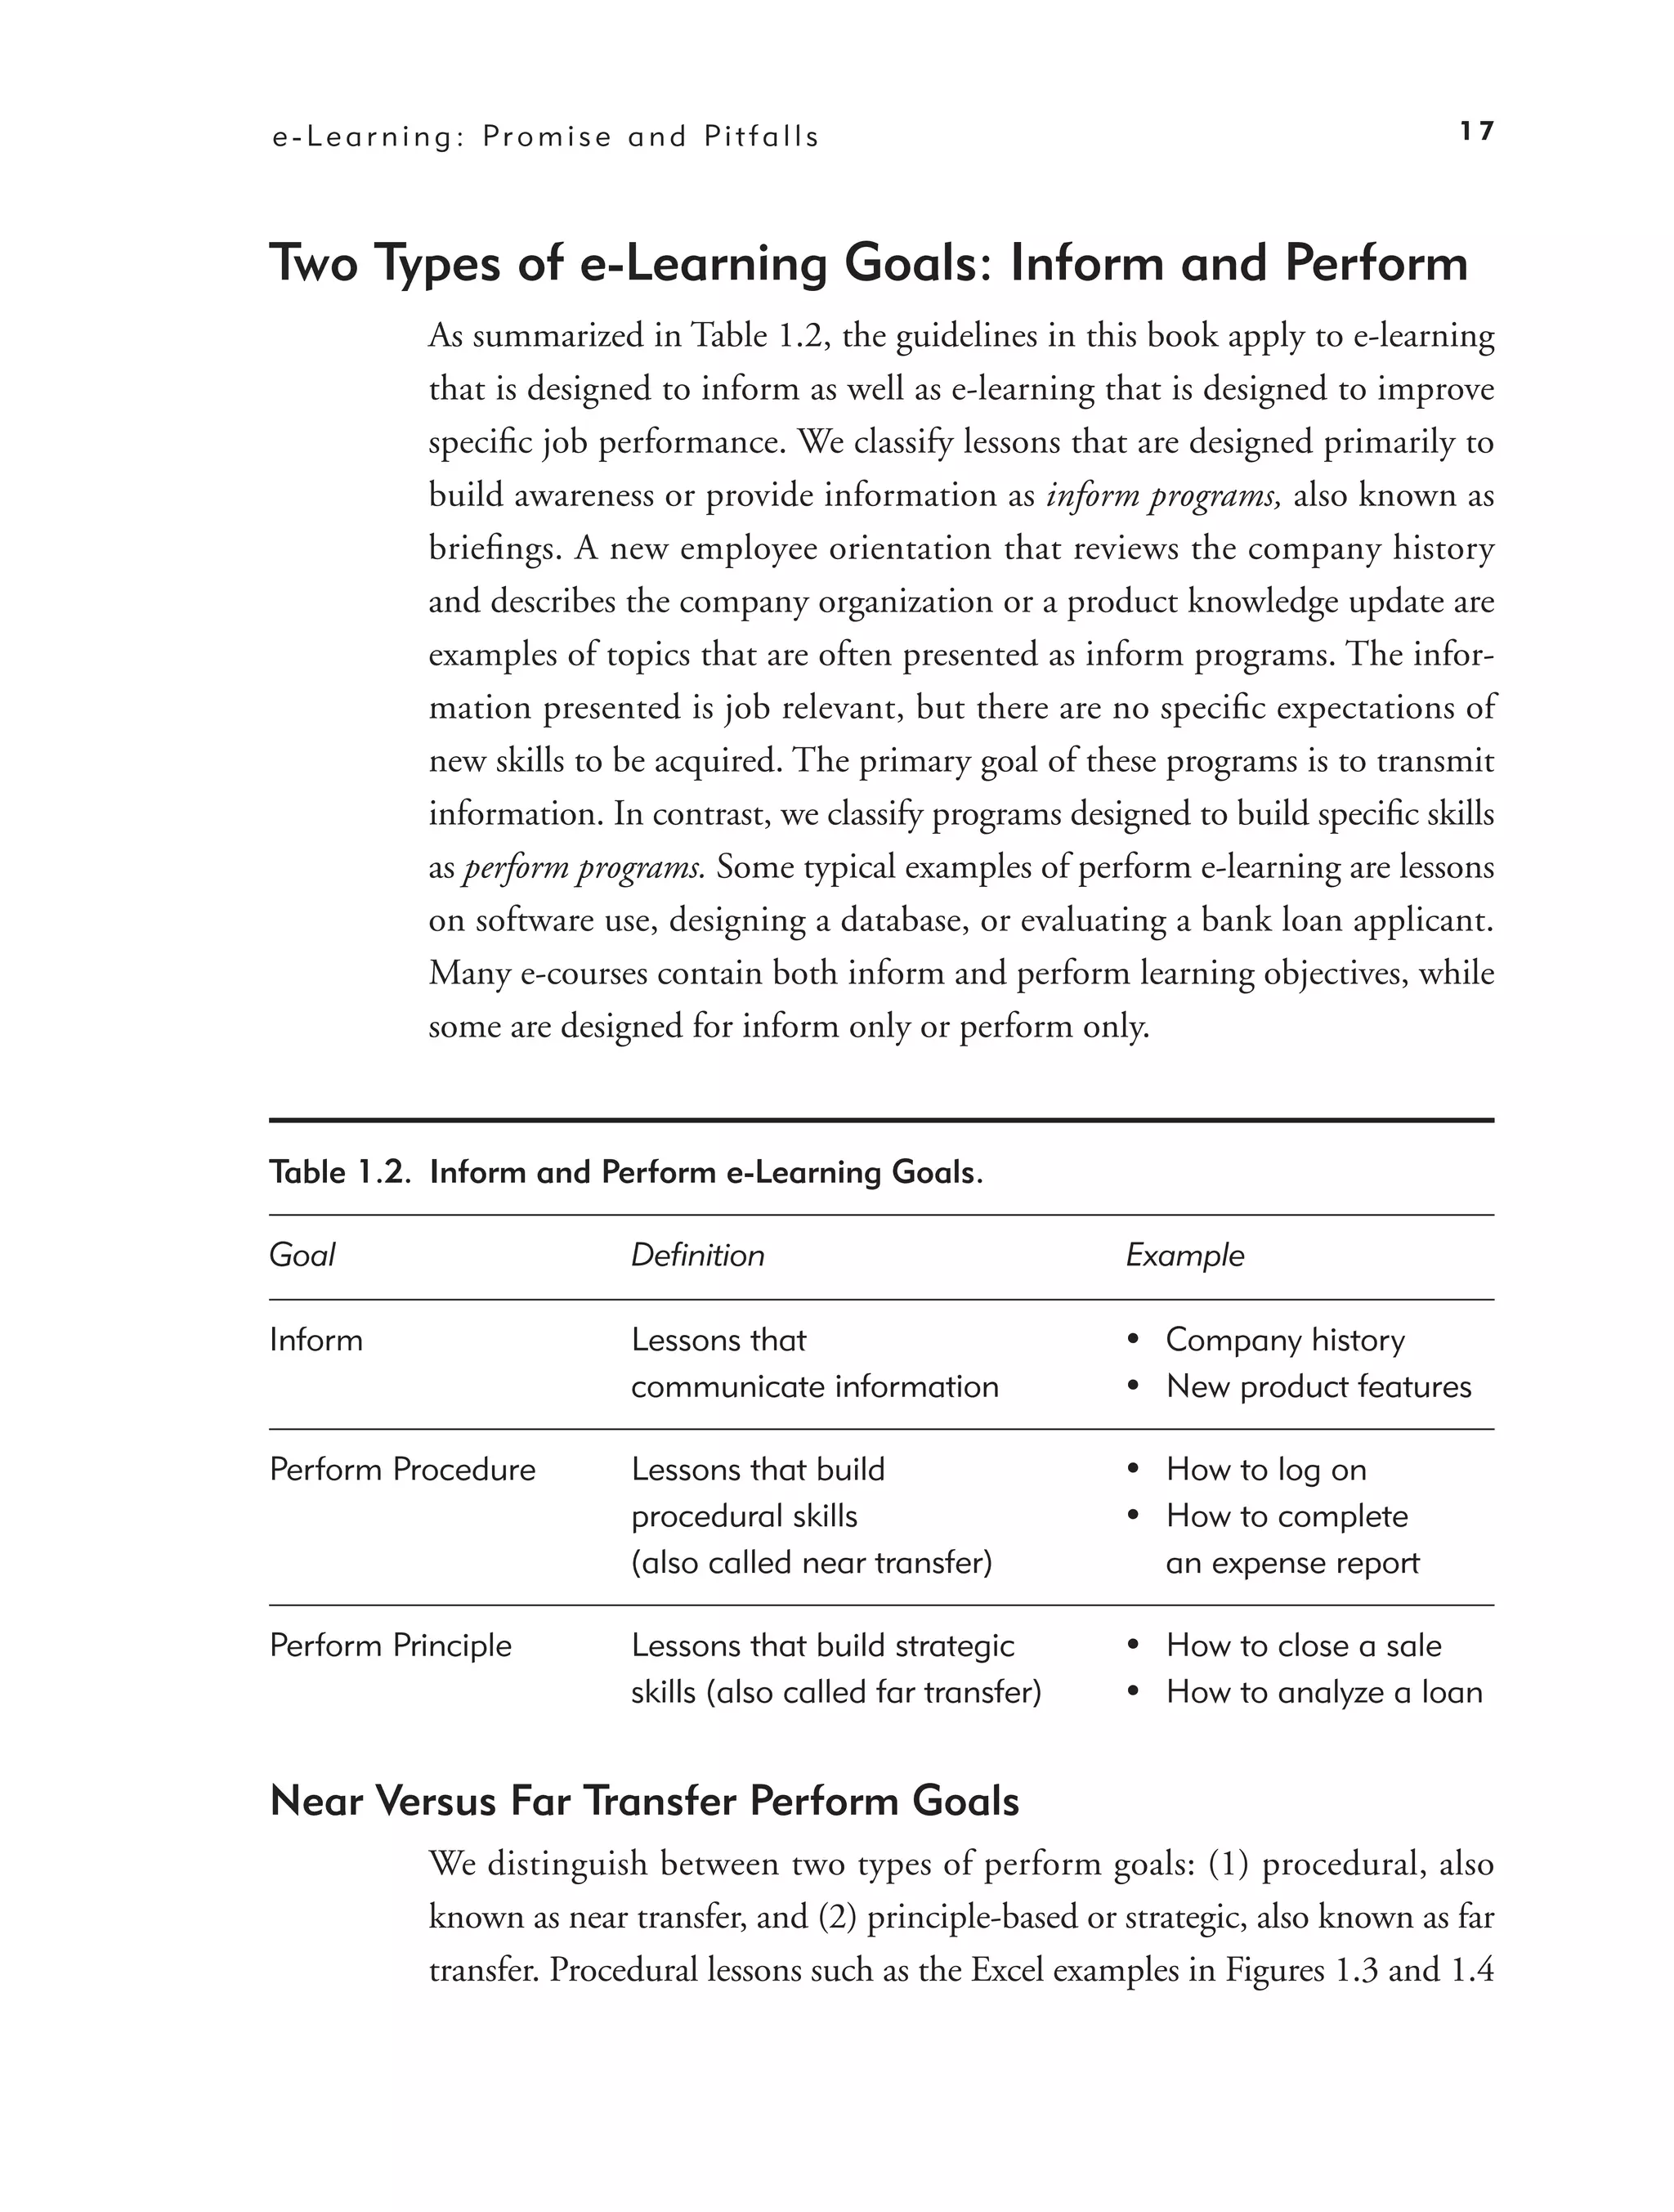
Two Types of e-Learning Goals: Inform and Perform
As summarized in Table 1.2, the guidelines in this book apply to e-learning
that is designed to inform as well as e-learning that is designed to improve
specific job performance. We classify lessons that are designed primarily to
build awareness or provide information as inform programs, also known as
briefings. A new employee orientation that reviews the company history
and describes the company organization or a product knowledge update are
examples of topics that are often presented as inform programs. The infor-
mation presented is job relevant, but there are no specific expectations of
new skills to be acquired. The primary goal of these programs is to transmit
information. In contrast, we classify programs designed to build specific skills
as perform programs. Some typical examples of perform e-learning are lessons
on software use, designing a database, or evaluating a bank loan applicant.
Many e-courses contain both inform and perform learning objectives, while
some are designed for inform only or perform only.
Table 1.2. Inform and Perform e-Learning Goals.
Goal Definition Example
Inform Lessons that • Company history
communicate information • New product features
Perform Procedure Lessons that build • How to log on
procedural skills • How to complete
(also called near transfer) an expense report
Perform Principle Lessons that build strategic • How to close a sale
skills (also called far transfer) • How to analyze a loan
Near Versus Far Transfer Perform Goals
We distinguish between two types of perform goals: (1) procedural, also
known as near transfer, and (2) principle-based or strategic, also known as far
transfer. Procedural lessons such as the Excel examples in Figures 1.3 and 1.4
35.
18 e-Learning and the Science of Instruction
are designed to teach step-by-step tasks, which are performed more or less
the same way each time. Most computer-skills training falls into this cat-
egory. This type of training is called near transfer because the steps learned
in the training are identical or very similar to the steps required in the job
environment. Thus the transfer from training to application is near.
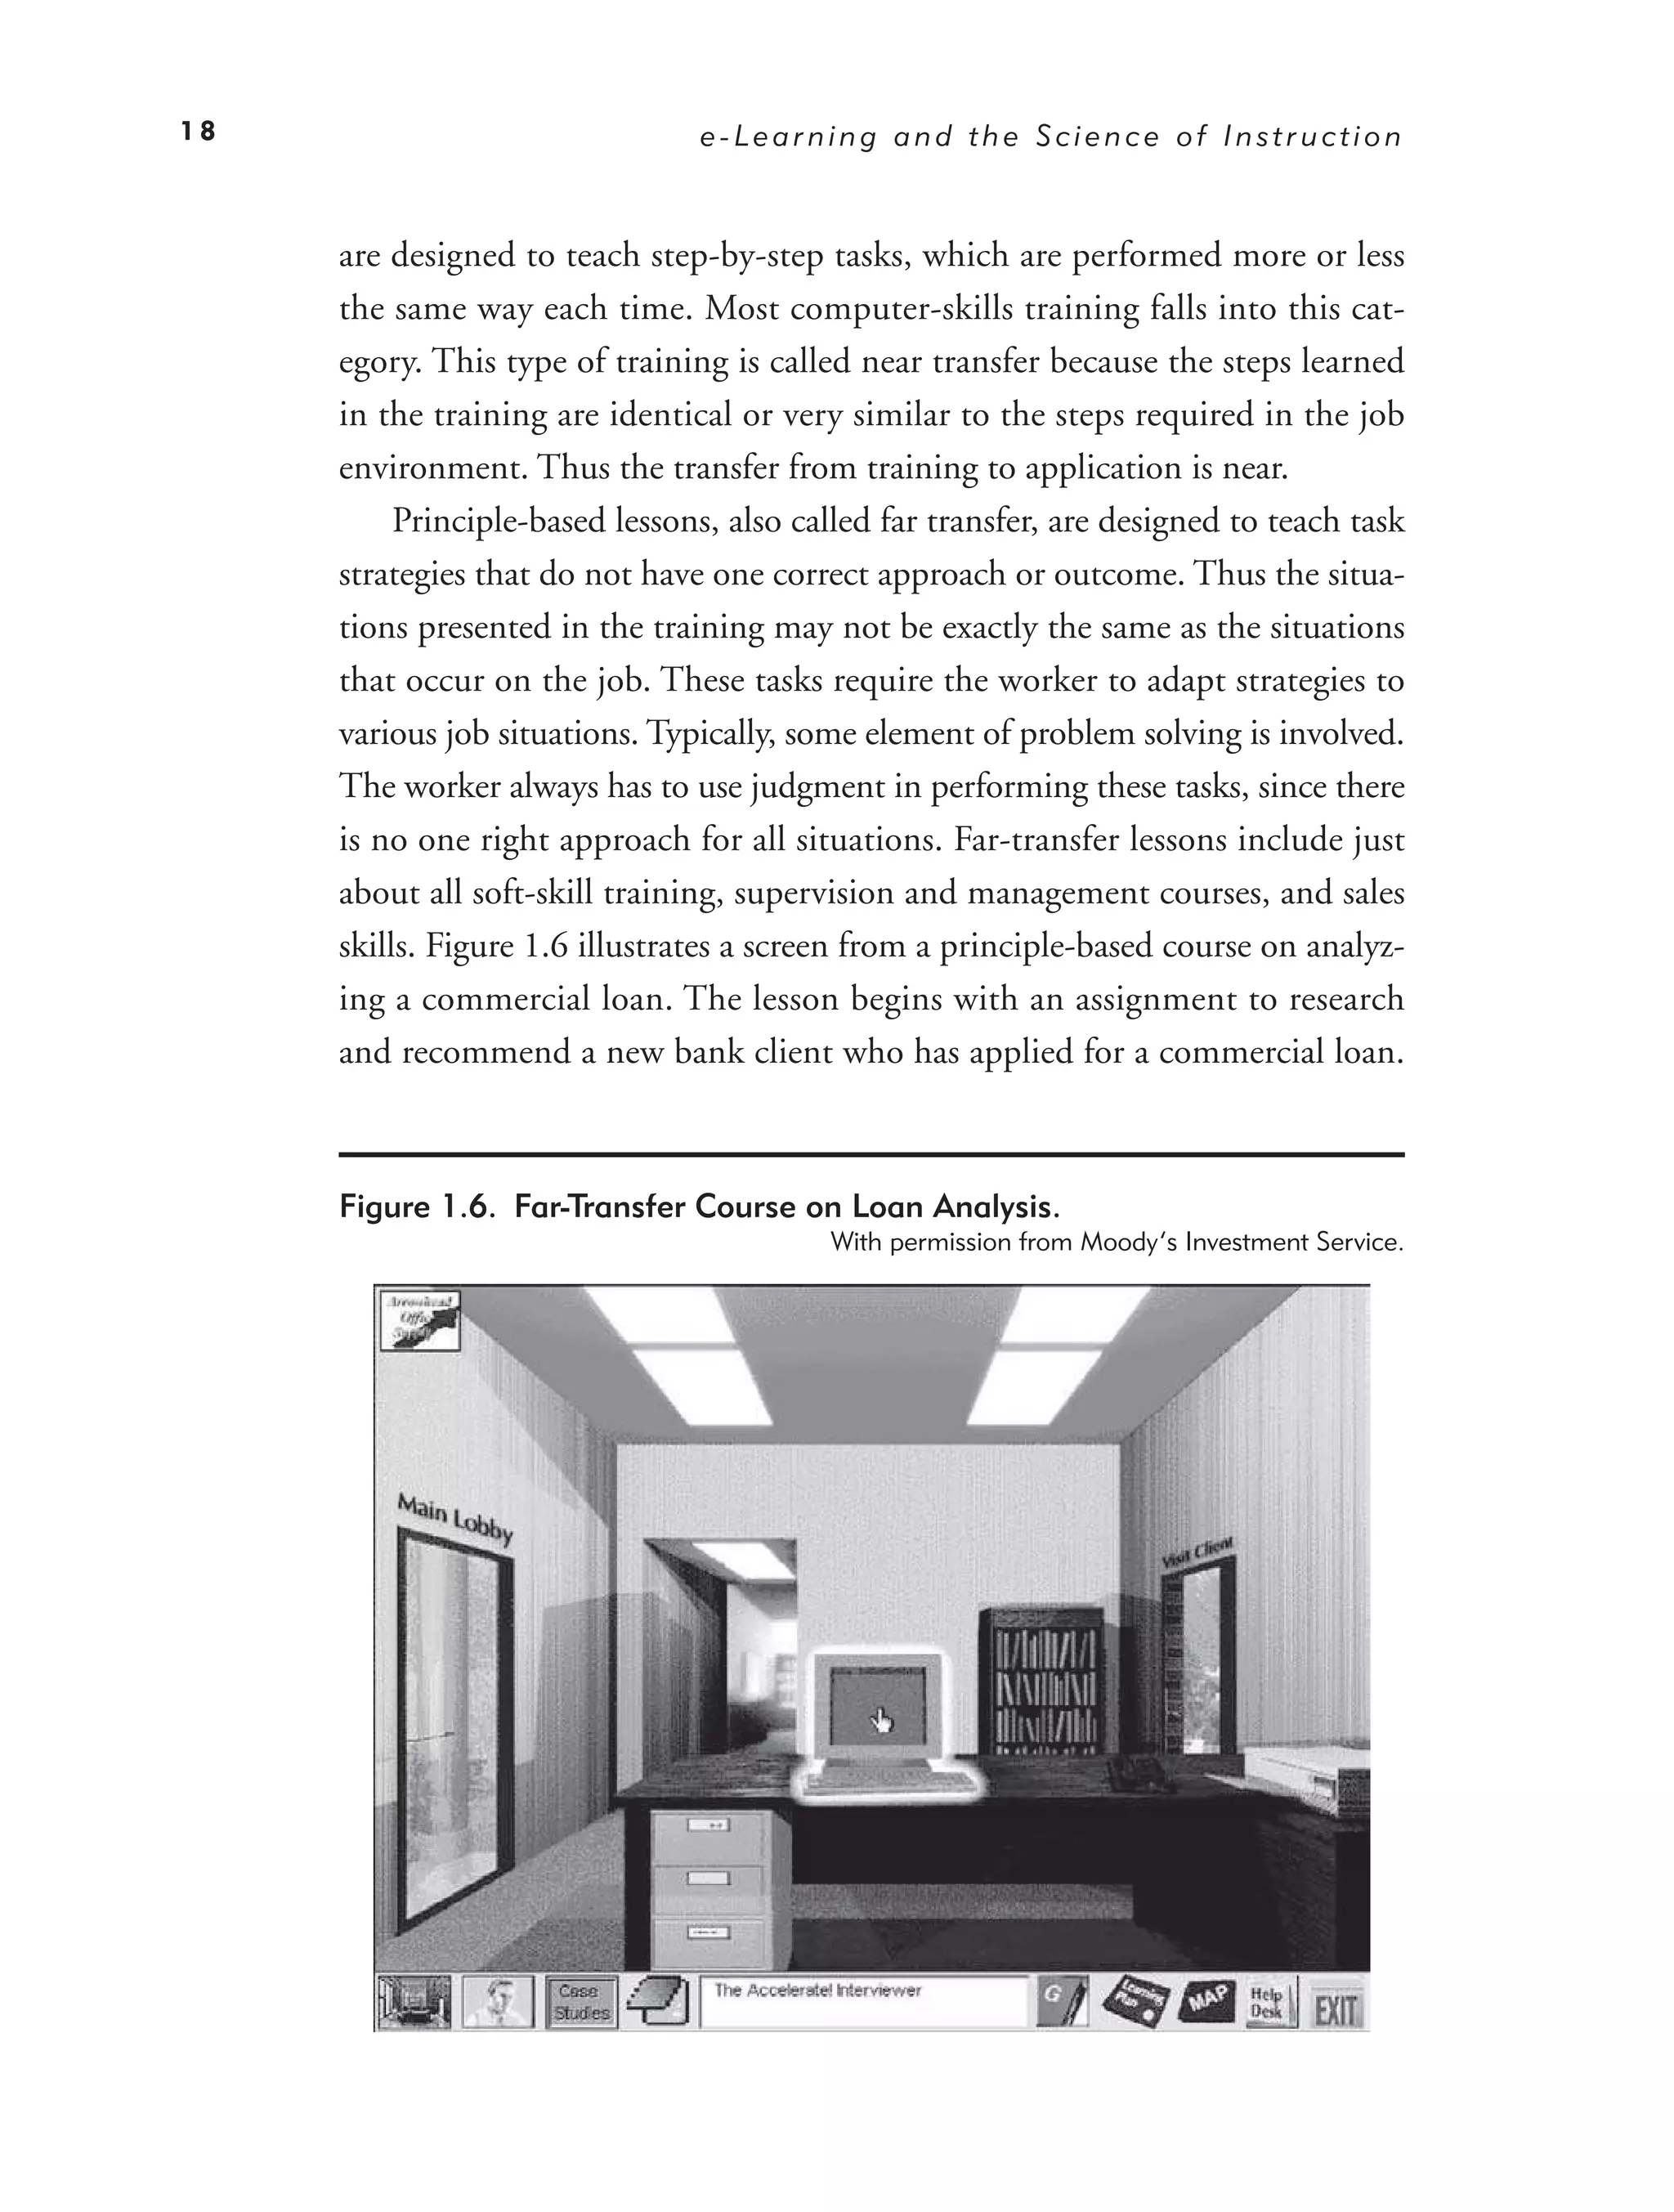
Principle-based lessons, also called far transfer, are designed to teach task
strategies that do not have one correct approach or outcome. Thus the situa-
tions presented in the training may not be exactly the same as the situations
that occur on the job. These tasks require the worker to adapt strategies to
various job situations. Typically, some element of problem solving is involved.
The worker always has to use judgment in performing these tasks, since there
is no one right approach for all situations. Far-transfer lessons include just
about all soft-skill training, supervision and management courses, and sales
skills. Figure 1.6 illustrates a screen from a principle-based course on analyz-
ing a commercial loan. The lesson begins with an assignment to research
and recommend a new bank client who has applied for a commercial loan.
Figure 1.6. Far-Transfer Course on Loan Analysis.
With permission from Moody’s Investment Service.
36.
e - Le a r n i n g : Pr o m i s e a n d Pi t f a l l s 19
The learner has access to data from the various office resources shown in the
interface, including the computer, fax machine, telephone, and books. Since
the worker will always have to use judgment in applying training guidelines
to the job, we say that the transfer from training to job is far.
Is e-Learning Better? Media Comparison Research
Contrary to the impression left by recent reports on the use and benefits
of e-learning, much of what we are seeing under the e-learning label is not
new. Training delivered on a computer, known as computer-based train-
ing or CBT, has been around for more than thirty years. Early examples
delivered over mainframe computers were primarily text on a screen with
interspersed questions—electronic versions of behaviorist psychologist
B.F. Skinner’s teaching machine. The computer program evaluated answers
to the multiple-choice questions, and prewritten feedback was matched to
the learner responses. The main application of these early e-lessons was train-
ing in the use of mainframe computer systems. As technology has evolved,
acquiring greater capability to deliver true multimedia, the courseware has
become more elaborate in terms of realistic graphics, audio, color, animation,
and complex simulations. But as you will see, greater complexity of media
does not necessarily ensure more learning.
Each new wave of instructional delivery technology (starting with film
in the 1920s) spawned optimistic predictions of massive improvements in
learning. For example, in 1947 the U.S. Army conducted one of the first
media comparisons with the hypothesis that film teaches better than class-
room instructors (see box for details). Yet after fifty years of research attempt-
ing to demonstrate that the latest media are better, the outcomes have not
supported the media superiority view.
T H E F I R S T M E D I A C O M PA RIS O N S TUDY
In 1947 the U.S. Army conducted research to demonstrate that instruction delivered
by film resulted in better learning outcomes than traditional classroom or paper-based
versions. Three versions of a lesson on how to read a micrometer were developed.
37.
20 e-Learning and the Science of Instruction
The film version included a narrated demonstration of how to read the micrometer.
A second version was taught in a classroom. The instructor used the same script
and included a demonstration using actual equipment, along with still slide pic-
tures. A third version was a self-study paper lesson in which the text used the same
words as the film, along with pictures with arrows to indicate movement. Learners
were randomly assigned to a version and after the training session they were tested
to see whether they could read the micrometer. Which group learned more? There
were no differences in learning among the three groups (Hall & Cushing, 1947).
With few exceptions, the hundreds of media comparison studies have
shown no differences in learning (Clark, 1994; Dillon & Gabbard, 1998).
Since our first edition, there have been two new major reports synthesizing
research on the effectiveness of online learning. A report by Bernard et al.
(2004) integrating research studies that compared outcomes from electronic
distance education to outcomes from traditional classroom instruction
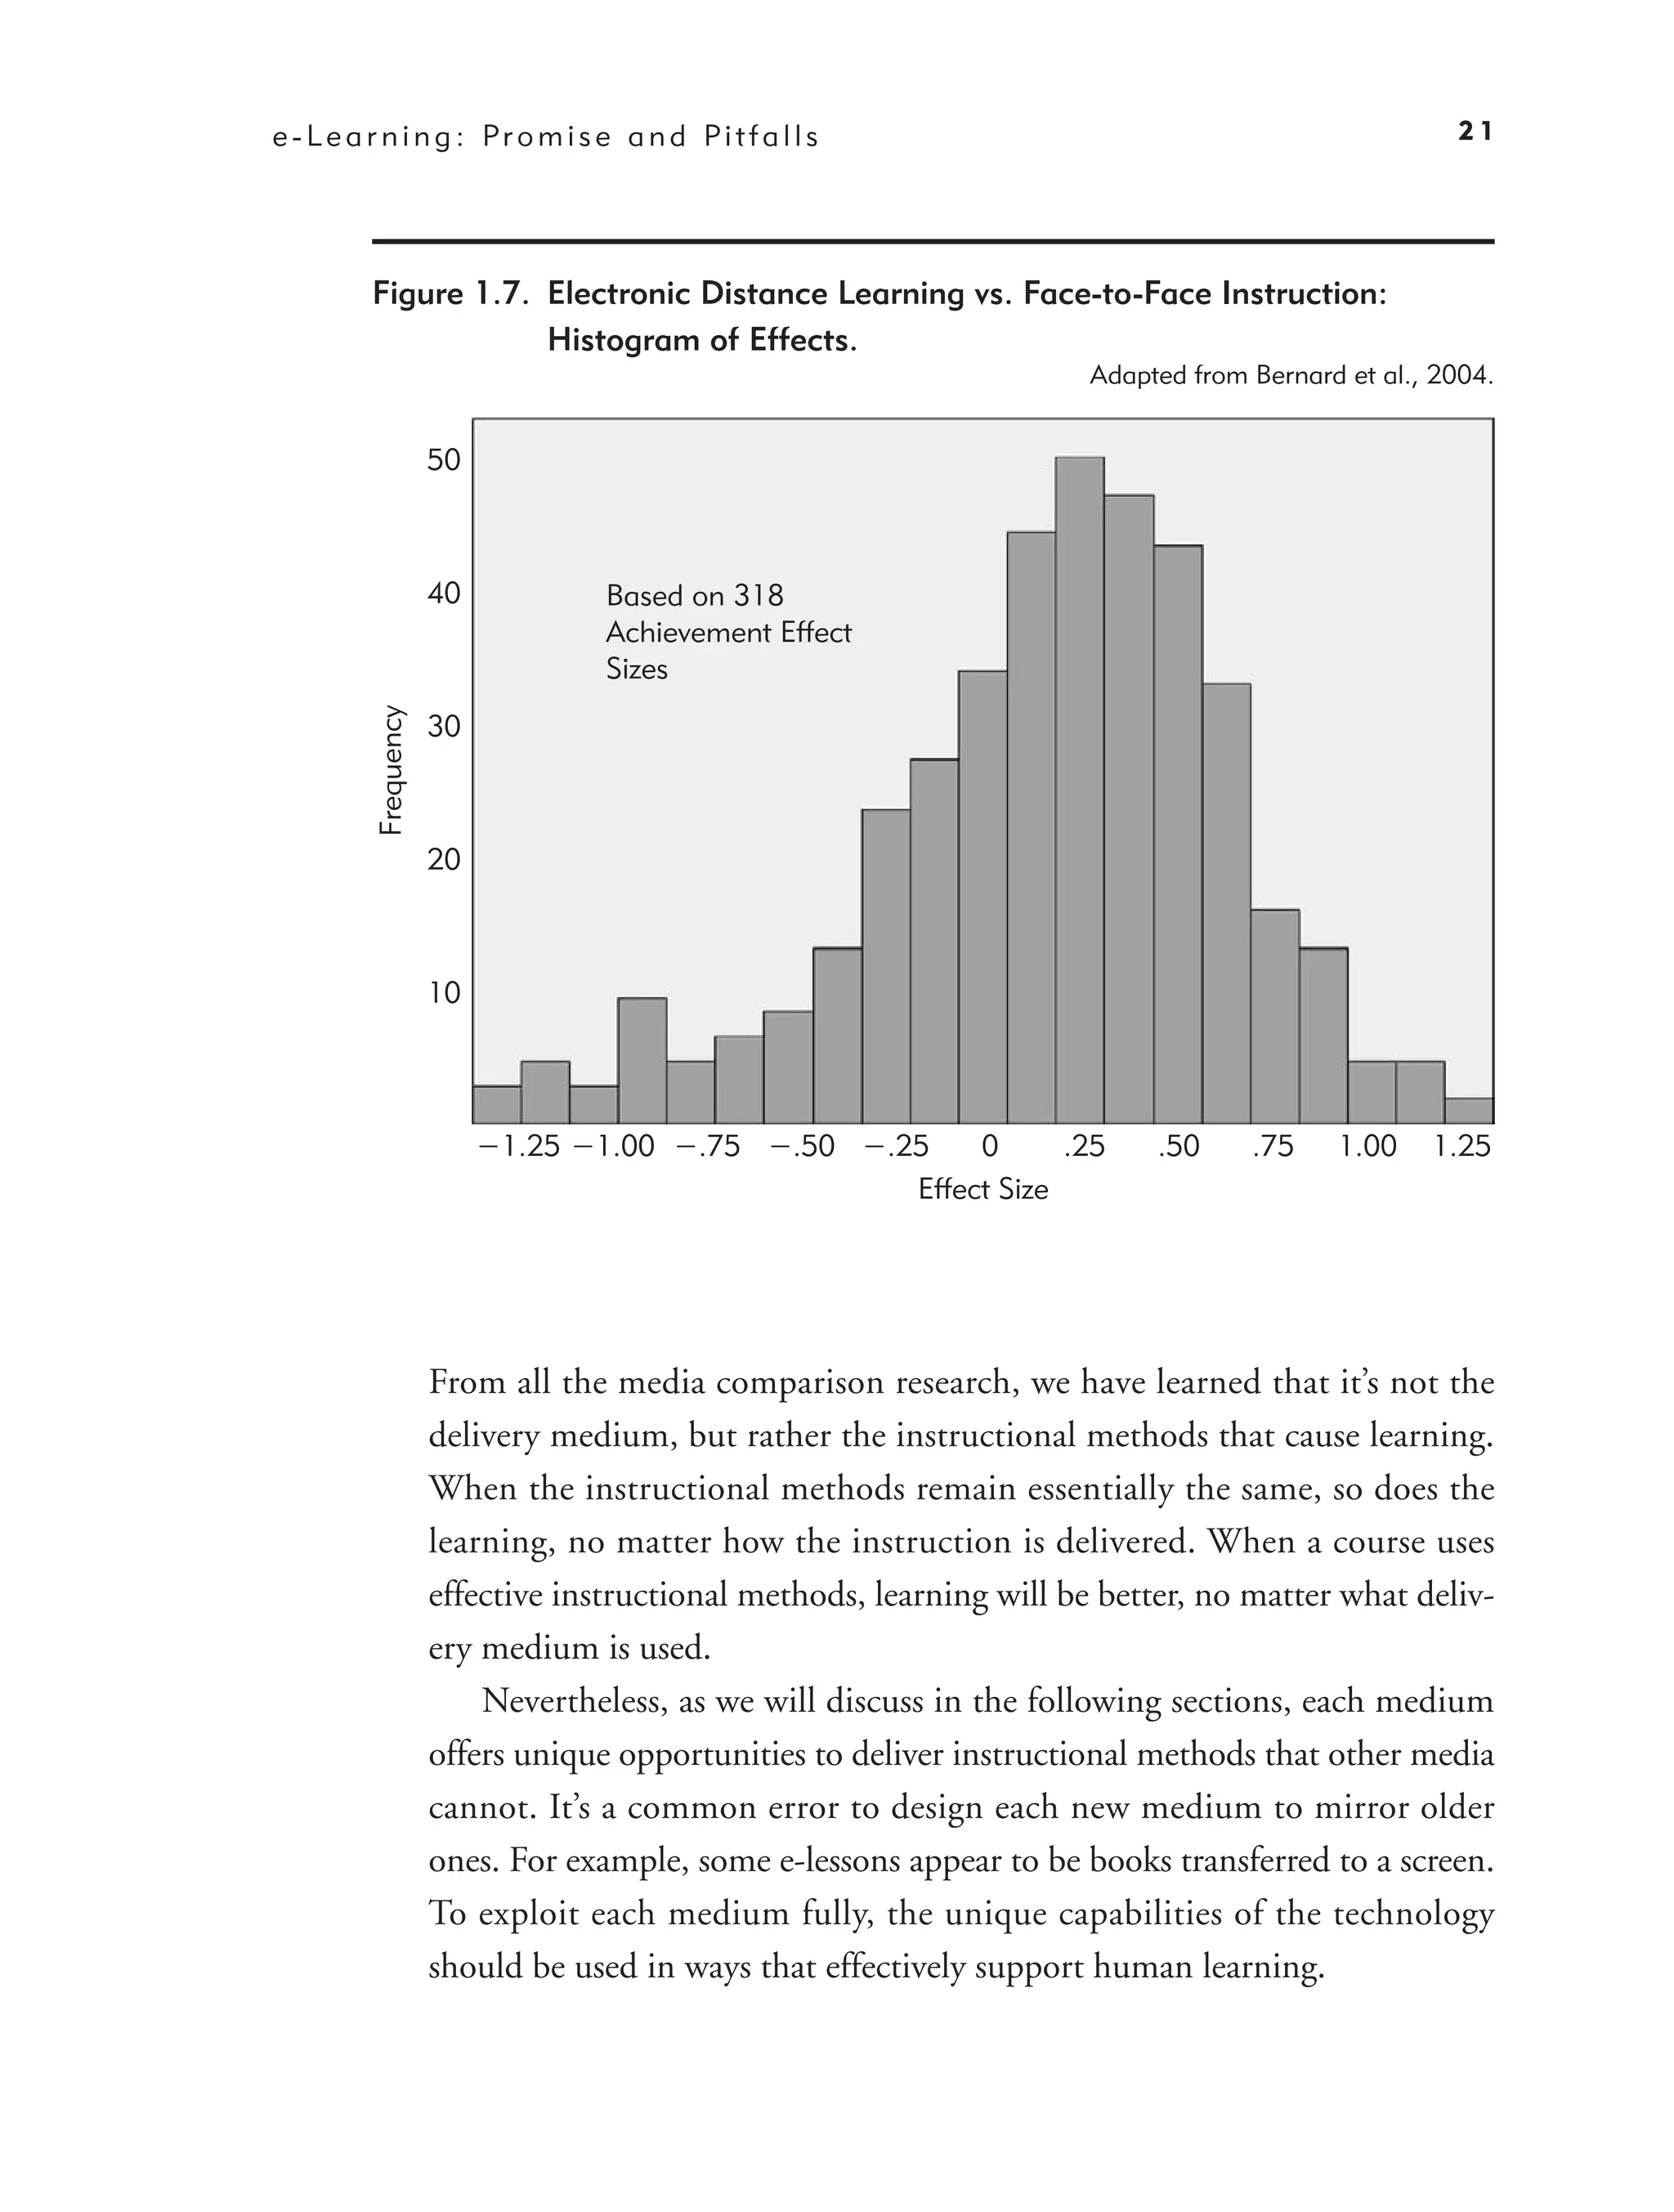
yielded the achievement effect sizes shown in Figure 1.7. (See Chapter 2
for information on effect sizes.) As you can see, the majority of effect sizes
are close to zero, indicating no practical differences in learning between
face-to-face and electronic distance learning. However, the bars at either
end of the histogram show that some distance learning courses were much
more effective than classroom courses and vice versa. A review of online
learning by Tallent-Runnels et al. (2006) concurs. The research team con-
cludes that:
“Overwhelming evidence has shown that learning in an online
environment can be as effective as that in traditional classrooms.
Second, students’ learning in the online environment is affected by
the quality of online instruction. Not surprisingly, students in well-
designed and well-implemented online courses learned significantly
more, and more effectively, than those in online courses where
teaching and learning activities were not carefully planned and
where the delivery and accessibility were impeded by technology
problems.” (p. 116)
38.
e - Le a r n i n g : Pr o m i s e a n d Pi t f a l l s 21
Figure 1.7. Electronic Distance Learning vs. Face-to-Face Instruction:
Histogram of Effects.
Adapted from Bernard et al., 2004.
50
40 Based on 318
Achievement Effect
Sizes
Frequency
30
20
10
1.25 1.00 .75 .50 .25 0 .25 .50 .75 1.00 1.25
Effect Size
From all the media comparison research, we have learned that it’s not the
delivery medium, but rather the instructional methods that cause learning.
When the instructional methods remain essentially the same, so does the
learning, no matter how the instruction is delivered. When a course uses
effective instructional methods, learning will be better, no matter what deliv-
ery medium is used.
Nevertheless, as we will discuss in the following sections, each medium
offers unique opportunities to deliver instructional methods that other media
cannot. It’s a common error to design each new medium to mirror older
ones. For example, some e-lessons appear to be books transferred to a screen.
To exploit each medium fully, the unique capabilities of the technology
should be used in ways that effectively support human learning.
39.
22 e-Learning and the Science of Instruction
What Makes e-Learning Unique?
Can we conclude from the media comparison research that all media are
equivalent? Not quite. Not all media can deliver all instructional methods. For
example, the capability of a paper document to deliver audio or animation
is quite limited. Four potentially valuable instructional methods unique to
e-learning are (1) practice with automated tailored feedback, (2) integration
of collaboration with self-study, (3) dynamic adjustment of instruction based
on learning, and (4) use of simulation and games.
Practice with Feedback
In the Excel courses illustrated in Figures 1.3 and 1.4, the learner has oppor-
tunities to practice the steps to input a formula into the spreadsheet. The
asynchronous course includes a simulation that directs learners to construct
and enter the correct formula to achieve an assigned calculation. If an incor-
rect formula is used, the program gives automated feedback telling the
learner his or her answer is wrong, providing a hint and asking the learner to
try again. Prior to this hands-on practice, the learners have seen an animated,
narrated demonstration of the steps required to input a formula. Similar
instructional methods are used in the virtual classroom version. Here, the
instructor provides a demonstration by sharing an Excel spreadsheet from
the desktop. Following the demonstration, the instructor assigns learners
calculations using the shared application. What is unique in asynchronous
e-learning is that the learner’s actions taken in the simulation are evaluated
by a program that responds with hints or feedback supporting immediate
correction of errors. In synchronous e-learning, the instructor reviews stu-
dent answers and gives feedback, as in a traditional face-to-face classroom.
Chapter 11 in this book describes what to look for in effectively designed
practice in e-learning.
Social Software and Collaboration
The first CBT lessons were for solo learning. There was little or no interac-
tion with others. But the power of the Internet erases that limitation. In the
virtual classroom participants communicate in real time through text chat or
40.
e - Le a r n i n g : Pr o m i s e a n d Pi t f a l l s 23
audio. In both virtual classrooms and asynchronous e-learning, learners can
collaborate at independent times by email and discussion boards. With the
emergence of synchronous e-learning as well as social software such as wikis
and blogs, we anticipate a growing trend in leveraging collaborative tools for
learning.
We do have evidence that, under the right conditions, learning and
working together can result in better outcomes than learning and working
by oneself. Unfortunately, we do not yet have sufficient research to specify
all of the conditions required to optimize collaborative learning facilities.
Chapter 13 reviews the research we do have and provides limited guidelines
for ways to harness the collaborative facilities of the Internet for learning
purposes.
Tailored Instruction
e-Learning is the only technology-based delivery vehicle that can make
ongoing dynamic adjustments to the instructional path based on learners’
responses. For example, if the learner makes errors on a practice problem of
intermediate complexity, the program can offer either an easier problem or a
similar problem accompanied by increased instructional help. This tailoring
of instruction based on learning progress is called adaptive instruction. Adap-
tive instruction can be implemented in asynchronous e-learning and is most
beneficial when training time and costs can be saved by tailoring lessons to
individual requirements.
Simulations and Games
In Figure 1.6 we introduce a course that is based on a simulated case study
for learning an effective process to analyze and recommend funding for a
commercial loan applicant. After receiving a new commercial loan to evalu-
ate, the learners can access the various objects in the office such as the fax,
computer, or telephone. They can also visit the loan applicant to conduct
an interview. Once the learners have collected sufficient data, they indicate
whether the loan is approved or denied. Thus, a new loan agent can expe-
rience in a short time a number of real-world loan situations in the safety
of a controlled environment. The bank loan course illustrates the power of
41.
24 e-Learning and the Science of Instruction
simulation in which realistic job problems are compressed into a short time-
frame. The motivational appeal of online games has prompted great interest
in constructing learning games based on software simulations. However, not
all games are equally effective. In Chapter 15, we summarize evidence and
guidelines for use of simulations and games in e-learning.
e-Learning: The Pitfalls
Despite these impressive capabilities of computer-delivered instruction, we see
two common barriers to the realization of the potential of online learning.
These are: (1) losing sight of the job, leading to transfer failure, and (2) media
abuse, leading to over or under use of technology in ways that defeat learning.
Pitfall One: Losing Sight of the Job
To design powerful learning environments whose lessons both transfer to
the workplace and improve the performance of the organization is not easy,
no matter whether planned for classroom or multimedia delivery. To teach
higher-order problem-solving skills like the ones illustrated in the bank loan
program (Figure 1.6), the designer must first define what those skills are.
Research on expertise shows that these skills are job-specific. In other words,
the knowledge base underlying a physician is different from one that makes
a programmer. There is no one set of skills that support expertise across the
diverse contemporary workforce.
Whether planning for near- or far-transfer learning, a detailed job and task
analysis is a prerequisite and a labor-intensive process. e-Lessons that bypass
the job analysis process run the risk of presenting knowledge and techniques
out of context. As you will see in Chapters 10 and 11, lack of job context
risks transfer failure. In the end, teaching knowledge and skills that do not
result in job performance changes will not yield a return on investment.
Pitfall Two: Media Abuse
Sometimes “technophiles” use all of the technology features available to
them and in so doing overload learners’ processing capabilities. For exam-
ple, they may decide to include audio in the form of music and narration,
42.
e - Le a r n i n g : Pr o m i s e a n d Pi t f a l l s 25
on-screen text, and animated visuals in an online simulation. As you will
read in Chapter 2, humans have limited capacity to absorb information and
over-enthusiastic use of software features can depress learning. In contrast,
“technostics” tend to ignore media capabilities. For example, books may
be transferred to screens, resulting in page turner e-learning. Alternatively,
face-to-face classrooms may be converted to virtual classrooms with no
modifications to take advantages of the features of the technology. Unlike
face-to-face events, however, in e-learning classes, the learner can easily
minimize the application or exit the session to engage in more productive or
motivating activities. In this book we advocate a balance between the tech-
nophile and technostic approaches in which you apply research evidence on
how to use technology features in ways that promote learning.
What Is Good e-Courseware?
A central question for our book is, “What does good courseware look like?”
Throughout the book we recommend specific features to look for or to design
into your e-learning. However, you will need to adapt our recommendations
based on four main considerations—the goal of your training, the prior knowl-
edge of your learners, the environment in which you will deploy your training,
and the instructional architectures you use in your e-learning lessons.
Training Goals
The goals or intended outcomes of your e-learning will influence which guide-
lines are most appropriate for you to consider. Earlier in this chapter we made
distinctions among three types of training designed to inform the student, to
perform procedures, and to perform strategic tasks. For inform e-lessons, apply
the guidelines in Chapters 3 through 9 regarding the best use of media ele-
ments, including visuals, narration, and text to present information. To train for
procedural skills, apply these guidelines and add to them relevant suggestions
regarding the design of examples and practice sessions in Chapters 10 and 11.
If, however, your goal is to develop strategic or far-transfer skills, you will want
to apply the guidelines from all the chapters, including Chapter 14 on teaching
problem-solving skills and Chapter 15 on games and simulations.
43.
26 e-Learning and the Science of Instruction
Learner Differences
In addition to selecting or designing courseware specific to the type of out-
come desired, lessons should include instructional methods appropriate
to the learner’s characteristics. While various individual differences such
as learning styles have received the attention of the training community,
research has proven that the learner’s prior knowledge of the course content
exerts the most influence on learning. Learners with little prior knowledge
will benefit from different instructional methods than will learners who are
relatively experienced.
For the most part, the guidelines we provide in this book are based on
research conducted with adult learners who were new to the course content.
If your target audience has greater background knowledge in the course con-
tent, some of these guidelines may be less applicable. For example, Chapter 5
suggests that if you explain graphics with audio narration rather than text,
you reduce the mental workload required of the learner and thereby increase
learning. However, if your learners are experienced regarding the skills you
are teaching, overload is not as likely and they will probably learn effectively
from text or audio.
Environment
A third factor that affects e-learning is the environment—including such
issues as technical constraints of the delivery platform, network, and software,
cultural factors in institutions such as the acceptance of and routine familiar-
ity with technology, and pragmatic constraints related to budget, time, and
management expectations. In this book we focus on what works best from a
psychological perspective, but we recognize that you will have to adapt our
guidelines to your own unique set of environmental factors.
e-Learning Architectures
Although all e-learning is delivered on a computer, different courses reflect
different assumptions of learning, which we introduce here and describe
in detail in Chapter 2. During the past one hundred years, three views of
learning have evolved, and you will see each view is reflected in courses
44.
e - Le a r n i n g : Pr o m i s e a n d Pi t f a l l s 27
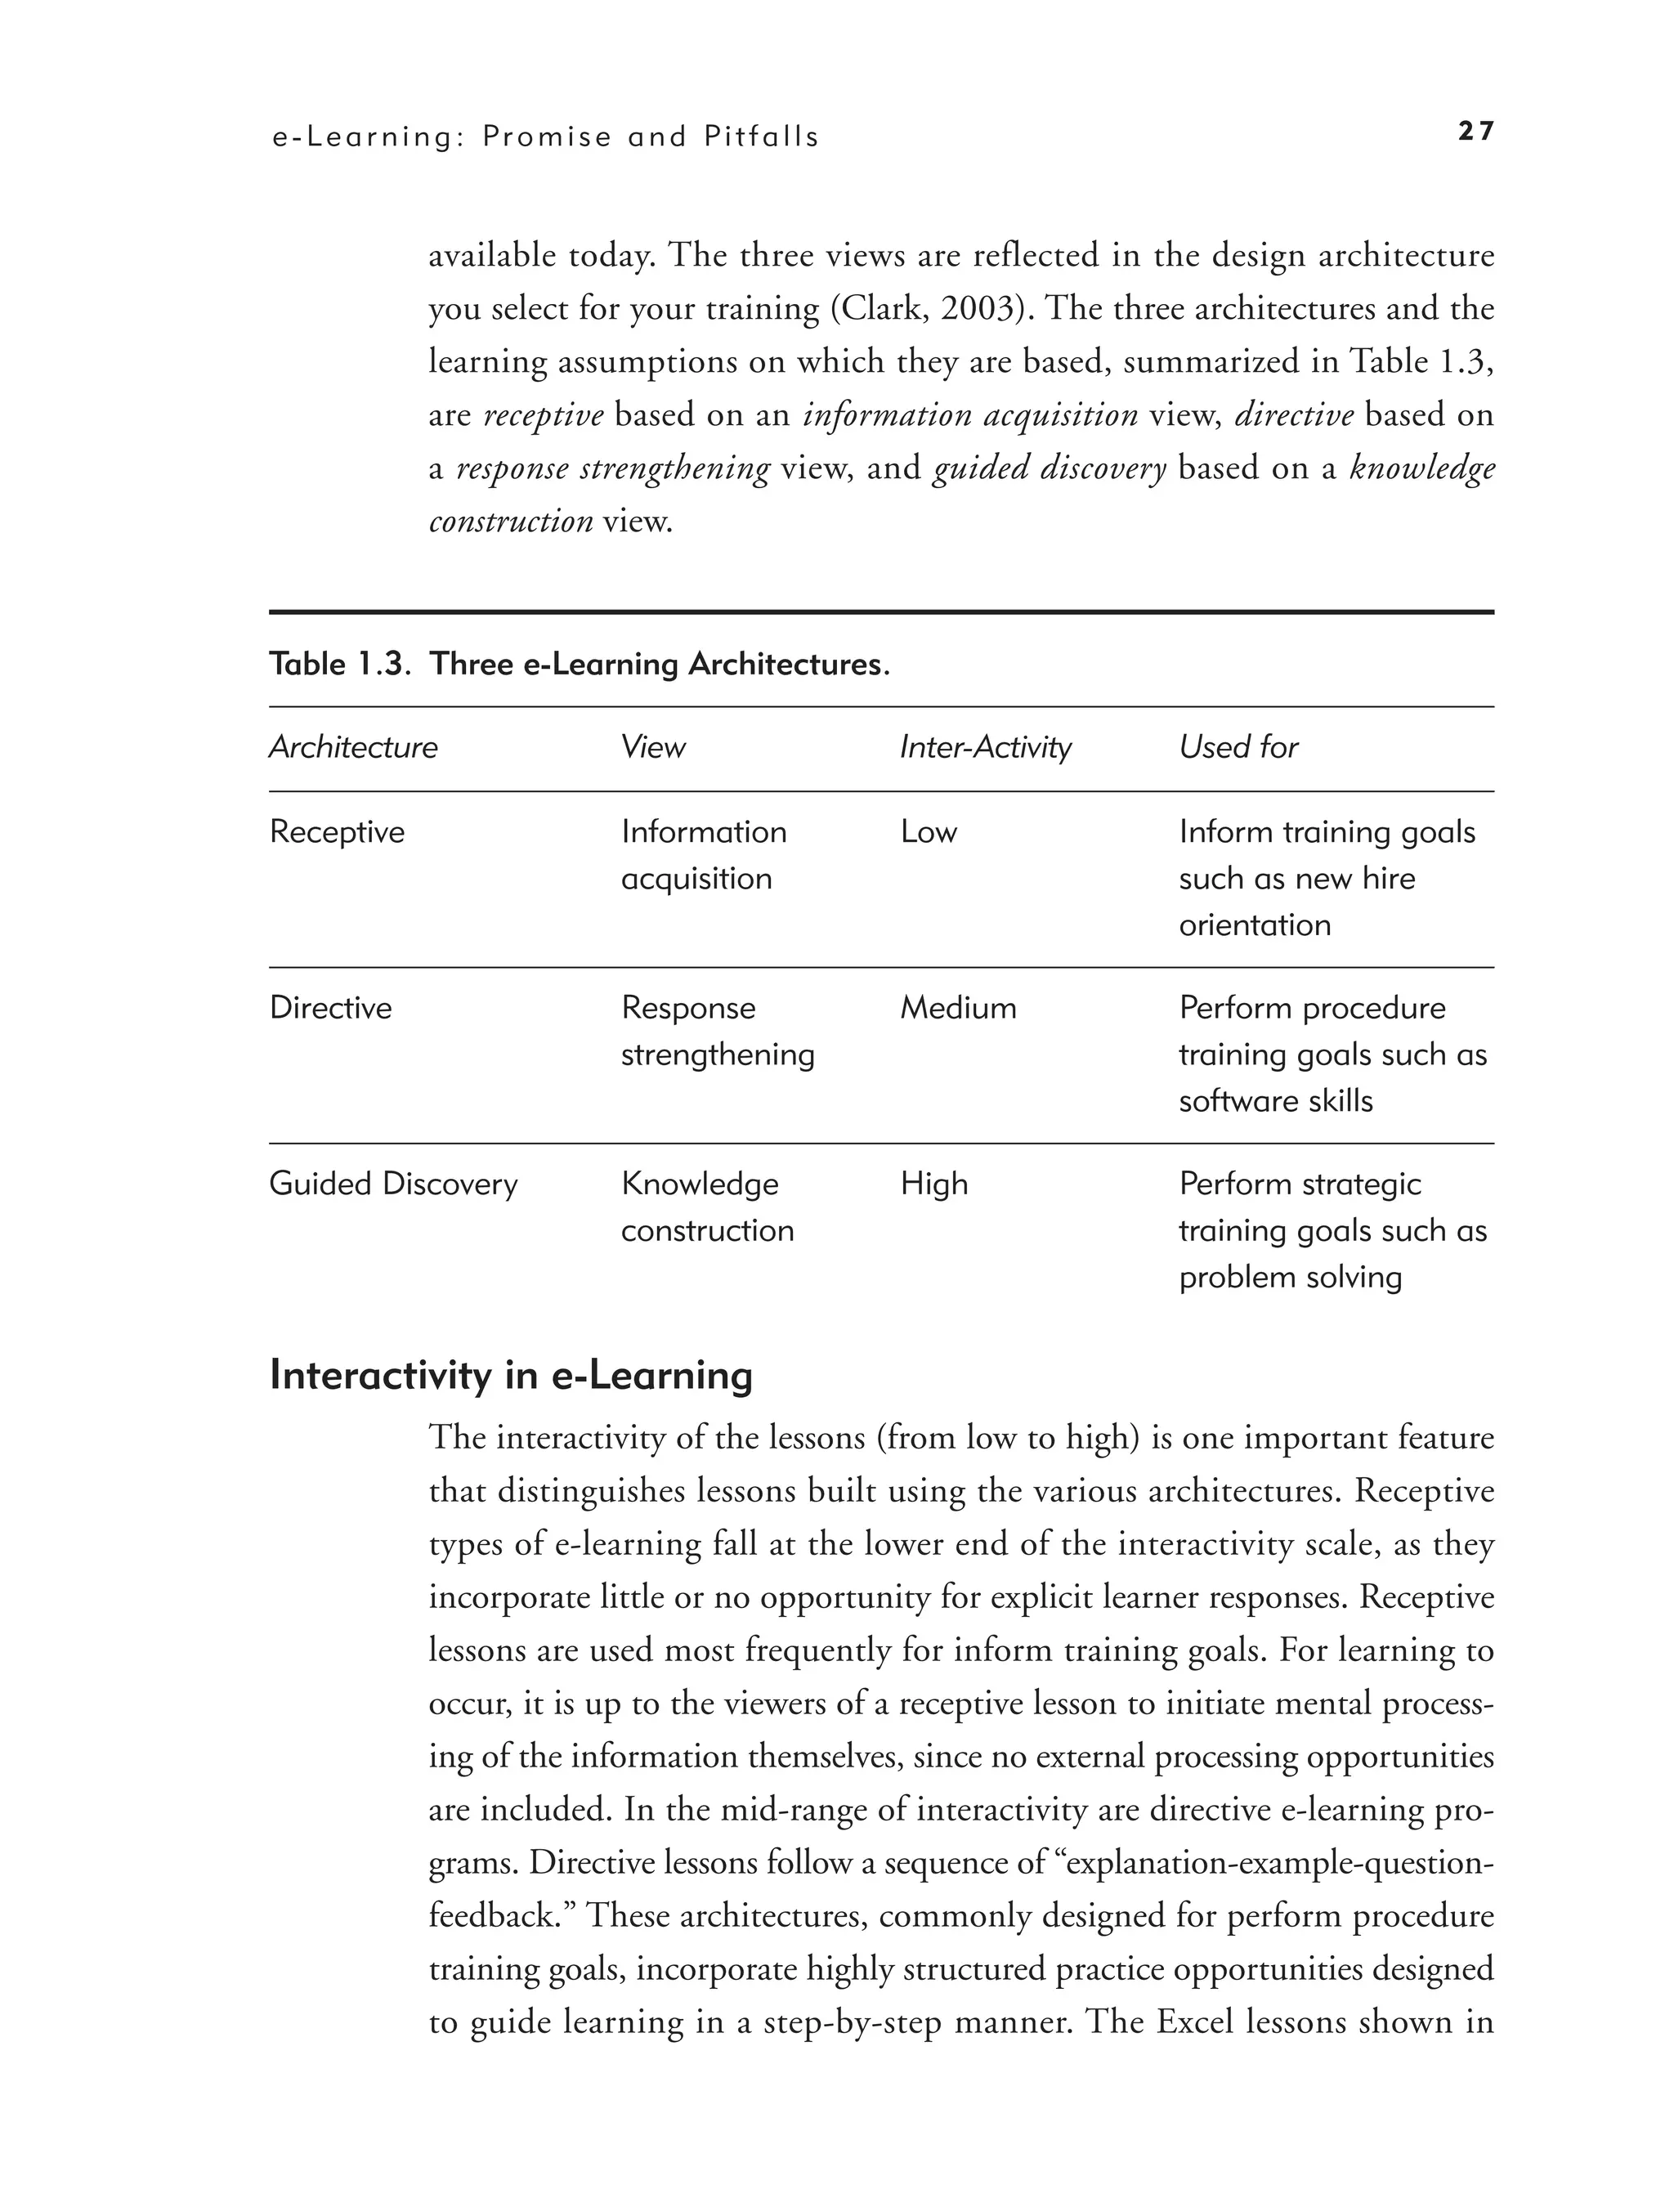
available today. The three views are reflected in the design architecture
you select for your training (Clark, 2003). The three architectures and the
learning assumptions on which they are based, summarized in Table 1.3,
are receptive based on an information acquisition view, directive based on
a response strengthening view, and guided discovery based on a knowledge
construction view.
Table 1.3. Three e-Learning Architectures.
Architecture View Inter-Activity Used for
Receptive Information Low Inform training goals
acquisition such as new hire
orientation
Directive Response Medium Perform procedure
strengthening training goals such as
software skills
Guided Discovery Knowledge High Perform strategic
construction training goals such as
problem solving
Interactivity in e-Learning
The interactivity of the lessons (from low to high) is one important feature
that distinguishes lessons built using the various architectures. Receptive
types of e-learning fall at the lower end of the interactivity scale, as they
incorporate little or no opportunity for explicit learner responses. Receptive
lessons are used most frequently for inform training goals. For learning to
occur, it is up to the viewers of a receptive lesson to initiate mental process-
ing of the information themselves, since no external processing opportunities
are included. In the mid-range of interactivity are directive e-learning pro-
grams. Directive lessons follow a sequence of “explanation-example-question-
feedback.” These architectures, commonly designed for perform procedure
training goals, incorporate highly structured practice opportunities designed
to guide learning in a step-by-step manner. The Excel lessons shown in
45.
28 e-Learning and the Science of Instruction
Figures 1.3 and 1.4 apply the directive architecture. Guided discovery forms
of e-learning, including simulations and games, fall in the high interactivity
range of the continuum. For example, Figure 1.6 shows the interface for a
guided discovery course in which the learner is constantly engaged by click-
ing on various on-screen objects that provide data or activities related to
commercial bank loan analysis.
Learning is possible from any of these three architectures if learners
engage in active knowledge construction. In receptive courses, it will be
up to the learner to actively process the content provided. In directive and
guided discovery architectures, knowledge construction is overtly promoted
by the interactions built into the lessons. In the next chapter we describe
more about the psychological processes needed for learning and how instruc-
tional methods in these architectures can support or defeat those processes.
Learning in e-Learning
The challenge in e-learning, as in any learning program, is to build lessons
in ways that are compatible with human learning processes. To be effective,
instructional methods must support these processes. That is, they must foster
the psychological events necessary for learning. While the computer tech-
nology for delivery of e-learning is upgraded weekly, the human side of the
equation—the neurological infrastructure underlying the learning process—
is very old and designed for change only over evolutionary time spans. In
fact, technology can easily deliver more sensory data than the human nervous
system can process. To the extent that audio and visual elements in a lesson
interfere with human cognition, learning will be depressed.
We know a lot about how learning occurs. Over the past twenty years,
hundreds of research studies on cognitive learning processes and methods that
support them have been published. Much of this new knowledge remains inac-
cessible to those who are producing or evaluating online learning because it
has been distributed primarily within the research community. This book fills
the gap by summarizing research-based answers to questions that multimedia
producers and consumers ask about what to look for in effective e-learning.
46.
e - Le a r n i n g : Pr o m i s e a n d Pi t f a l l s 29
COMING NEXT
Since instructional methods must support the psychological processes of
learning, the next chapter summarizes those processes. We include an over-
view of our current understanding of the human learning system and the
processes involved in building knowledge and skills in learners. We provide
several examples of how instructional methods used in e-lessons support cog-
nitive processes. In addition, we present some guidelines to help you under-
stand and evaluate research evidence presented throughout the book.
Suggested Readings
Clark, R.C. (2000). Four architectures of learning. Performance Improvement,
39(10), 31–37.
Clark, R.C., & Kwinn, A. (2007). The new virtual classroom: Evidence-based
guidelines for synchronous e-learning. San Francisco, CA: Pfeiffer.
Mayer, R.E. (Ed.). (2005). The Cambridge handbook of multimedia learning.
New York: Cambridge University Press.
47.
CHAPTER OUTLINE
How DoPeople Learn?
Three Metaphors for Learning
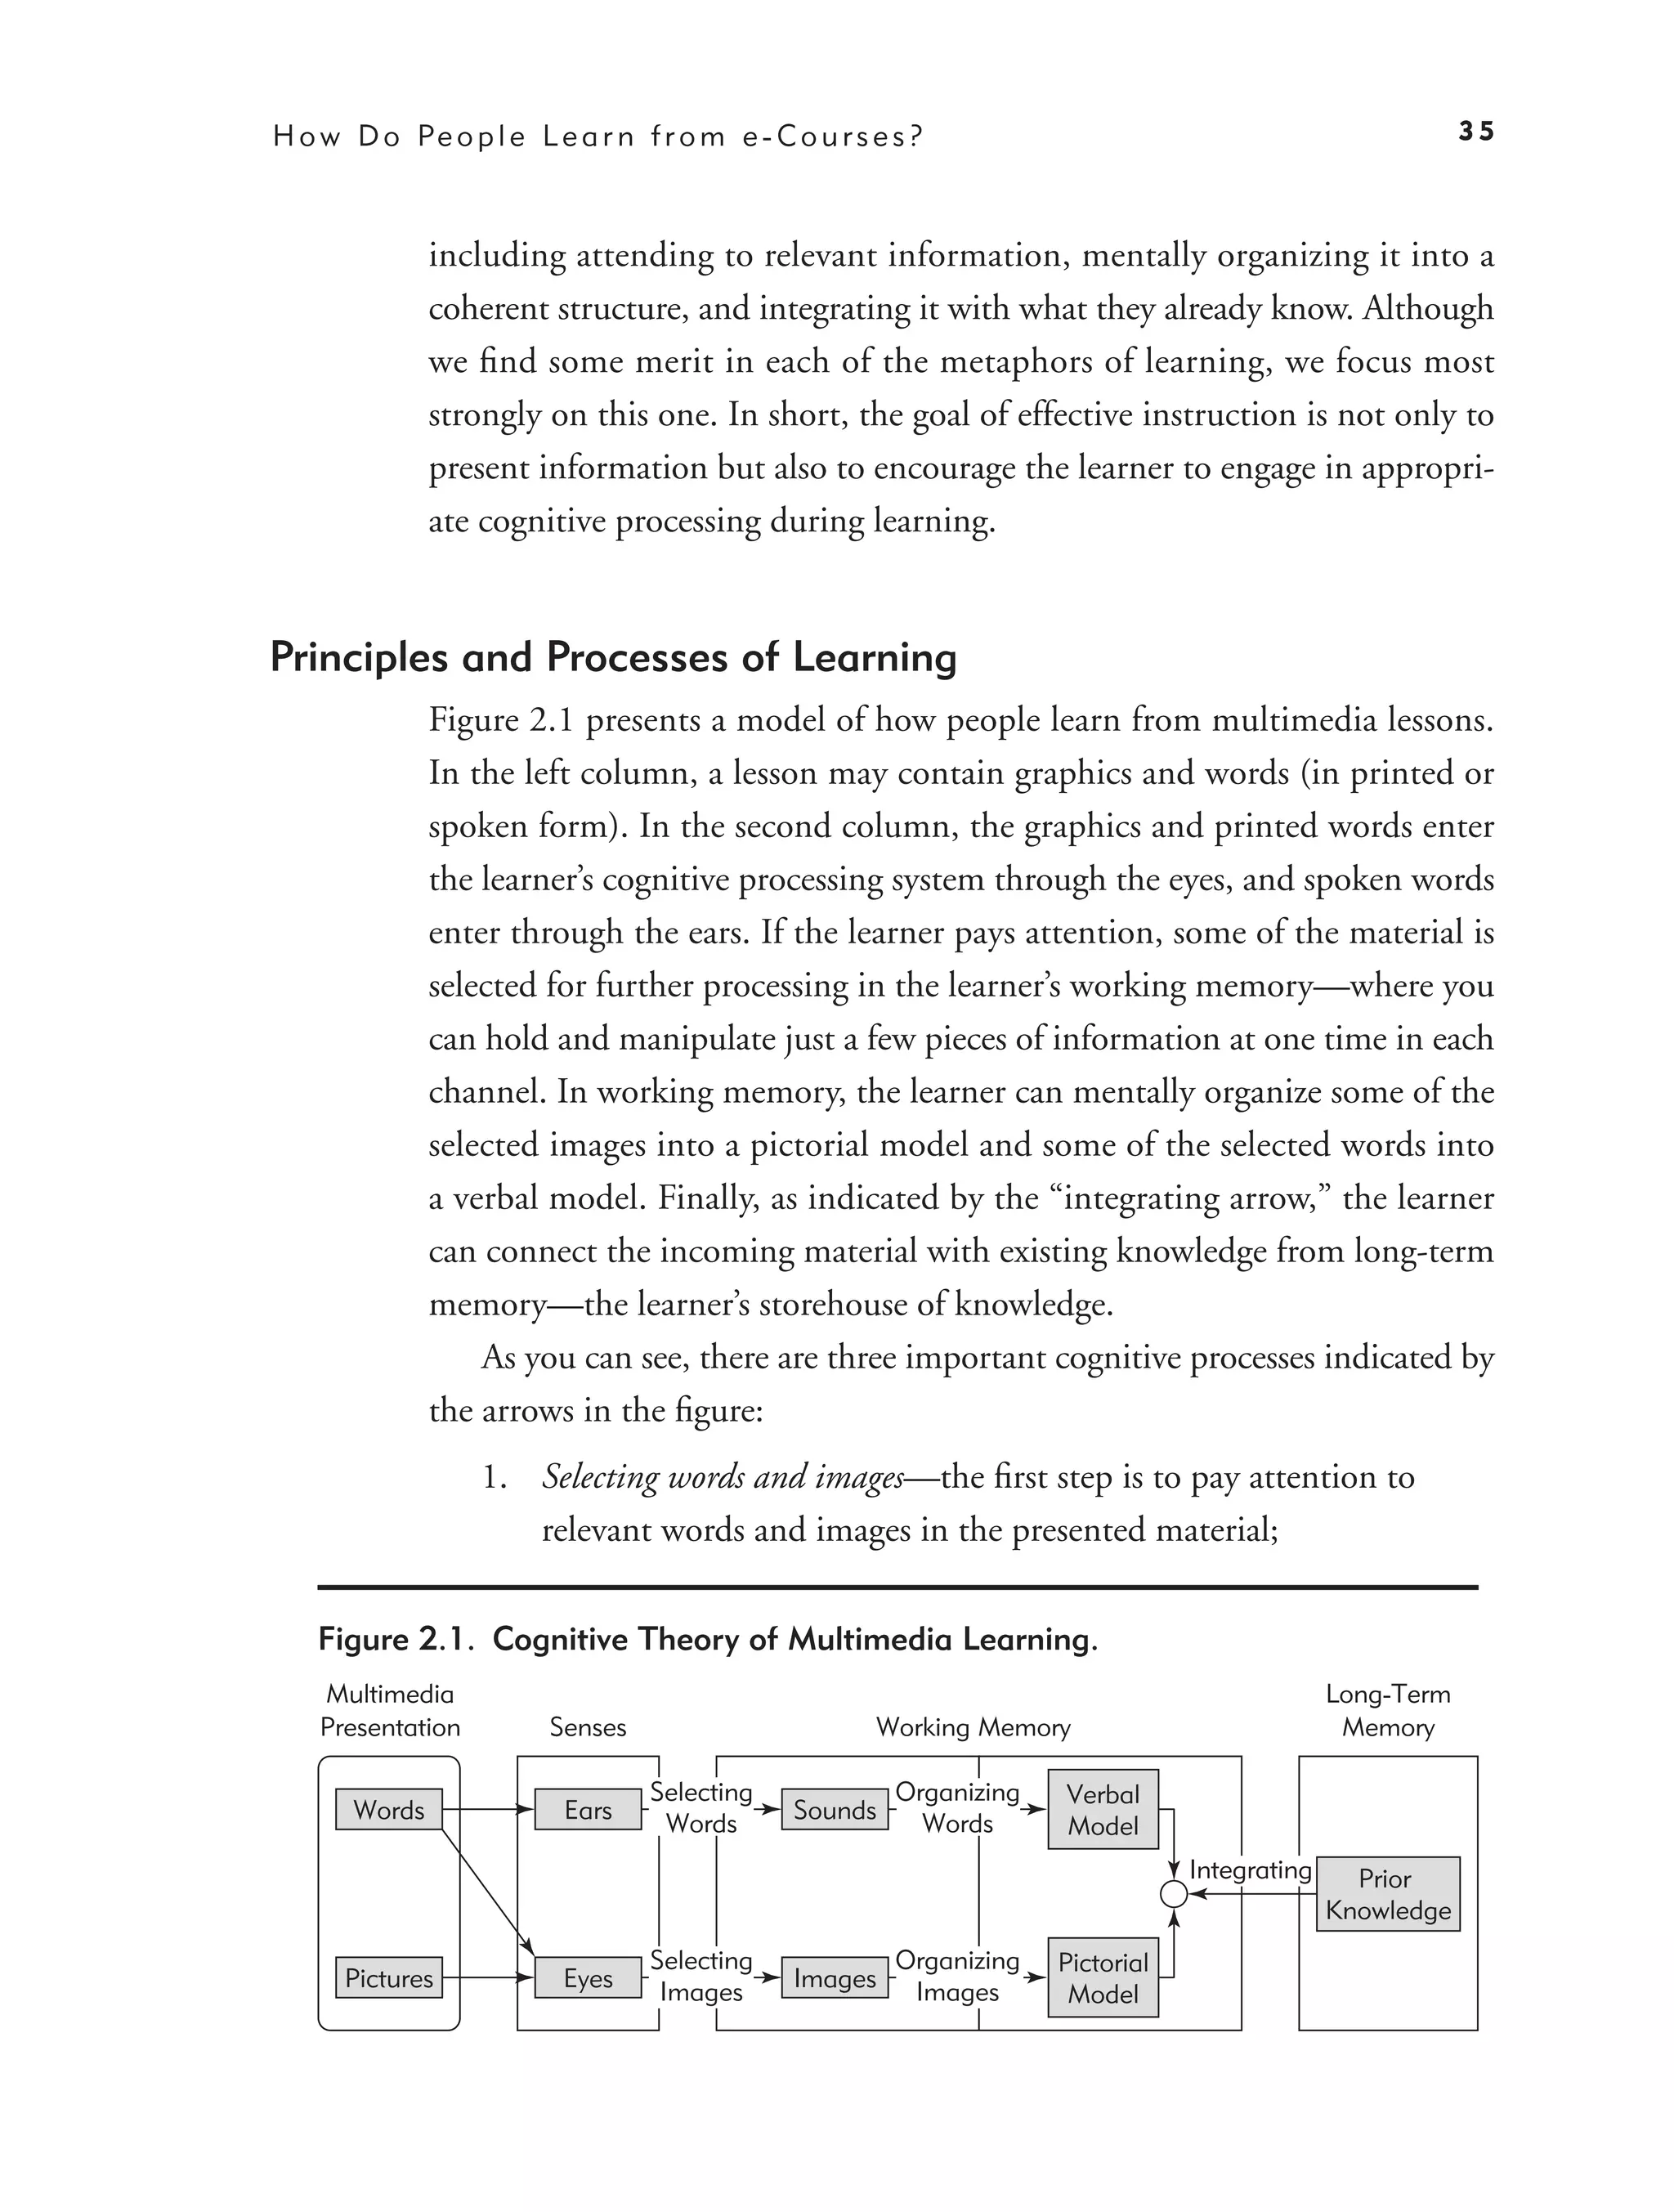
Principles and Processes of Learning
Managing Limited Cognitive Resources During Learning
How Do e-Lessons Affect Human Learning?
Methods for Directing Selection of Important Information
Methods for Managing Limited Capacity in Working Memory
Methods for Integration
Methods for Retrieval and Transfer
Summary of Learning Processes
What Is Good Research?
Informal Studies
Controlled Studies
Clinical Trials
How Can You Identify Relevant Research?
How Do You Interpret Research Statistics?
What We Don’t Know About Learning
48.
2
How Do PeopleLearn
from e-Courses?
W H AT ’ S N E W I N T H I S C H A P T E R ?
F ROM LAS VEGAS-STYLE MEDIA with games and glitz at one
extreme to page turners consisting of text on screens at the other, many
e-learning courses ignore human cognitive processes and as a result do not
optimize learning. In writing this book, we were guided by two fundamental
assumptions: the design of e-learning courses should be based on a cogni-
tive theory of how people learn and on scientifically valid research studies.
In other words, e-learning courses should be constructed in light of how
the mind learns and experimental evidence concerning e-learning features
that promote best learning. In this chapter we describe the memory systems
and processes involved in learning. We have added new information on
recent advances in human learning. We also summarize important features
of experimental studies to help you interpret the relevance and applicability
31
49.
32 e-Learning and the Science of Instruction
of research to your work. We have added new material concerning the value
of experimental research evidence in education.
DE S I GN D I L E M M A : YO U DEC IDE
Suppose you are in charge of the training department at Thrifty Savings and Loan.
Your boss, the HR director, asks you to develop a series of e-learning courses to
be delivered via the corporate intranet: “With the recent merger, we need more
cost-effective ways to deliver training to the local branches. We need to create both
self-study lessons as well as virtual classroom sessions. By using technology we can
save money and also make learning fun. My kids really enjoy playing games online
and surfing the web! Let’s showcase our training to upper management by using
the cutting edge of learning technology.”
Your director of human resources is espousing what can be called a technology-
centered approach to e-learning. For her, e-learning courses should take advantage
of powerful, cutting-edge technologies, such as video, games, blogs, or animations
available on the web. In taking a technology-centered approach, she is basing her
decisions about how to design e-learning courses on the capabilities afforded by
new technologies.
Your intuition is that something is wrong with the technology-centered approach.
You remember reading about the disappointing history of educational technol-
ogy (Cuban, 1986). In every era, strong claims have been made for the educa-
tional value of hot new technologies, but the reality somehow has never lived up
to expectations. You wonder why there have been so many failures in the field of
educational technology. Perhaps expectations have been unrealistic? Today, many
of the same old claims about revolutionizing learning can be heard again, this
time applied to online games, simulations, or to the Web-2. You decide it’s time to
take a learner-centered approach, in which technology is adjusted to fit in with the
way that people learn. But you wonder if there is a learning theory with sufficient
detail to guide practical decisions in e-learning design. And even if there is a useful
theory, is there any evidence to guide decisions that may stem from a theory?
Based on your own experience or intuition, which of the following options would
you select?
50.
H o wD o Pe o p l e L e a r n f r o m e - C o u r s e s ? 33
A. Online applications such as games, simulations, and blogs are engaging
and should be a central feature of all new e-learning initiatives.
B. Online applications such as games, simulations, and blogs may interfere
with human learning processes and should be avoided.
C. We don’t know enough about human learning to make specific recom-
mendations about how to use new technology features.
D. Not sure which options are correct.
How Do People Learn?
Let’s begin our review of what works in e-learning with a summary of how
learning happens in any instructional setting.
Three Metaphors for Learning
Place a check mark next to your favorite description of how learning works:
Learning involves strengthening correct responses and weakening
incorrect responses.
Learning involves adding new information to your memory.
Learning involves making sense of the presented material by attending
to relevant information, mentally reorganizing it, and connecting it
with what you already know.
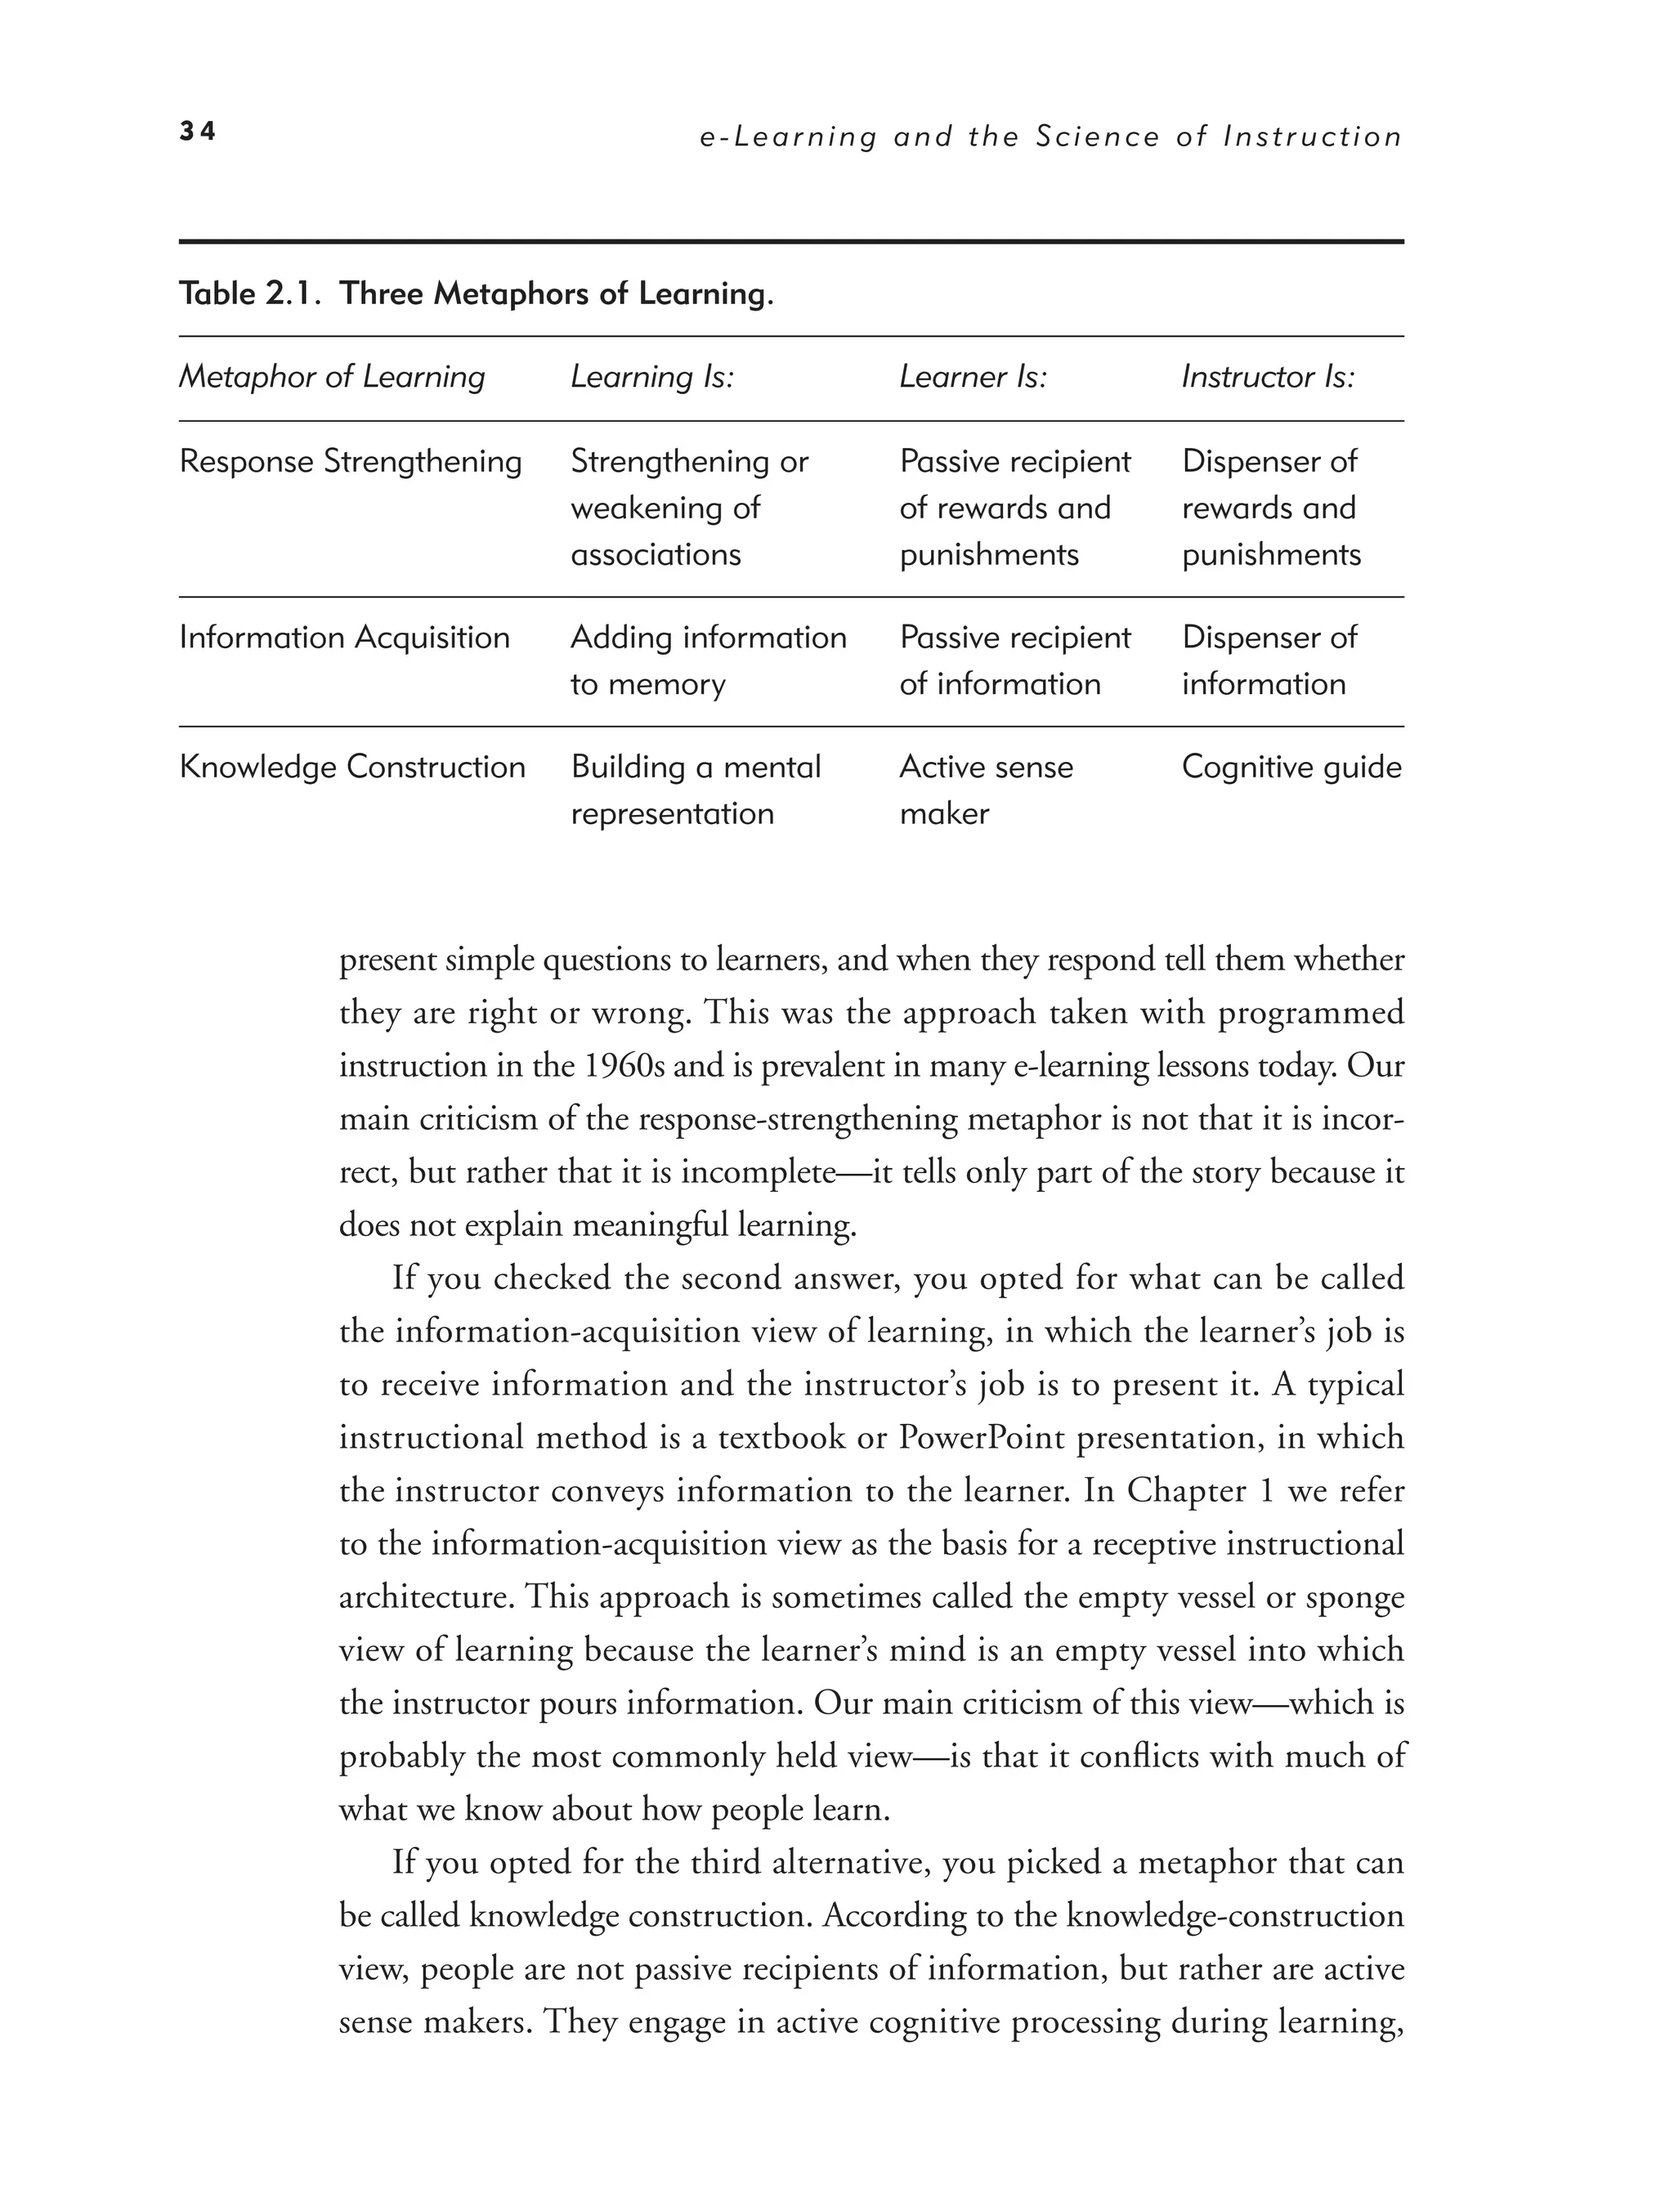
Each of these answers reflects one of the three major metaphors of learning that
learning psychologists have developed during the past one hundred years, as
summarized in Table 2.1 (Mayer, in press). Your personal view of how learning
works can affect your decisions about how to design instructional programs.
If you checked the first answer, you opted for what can be called the
response-strengthening view of learning. The learner is a passive recipient of
rewards or punishments, and the teacher is a dispenser of rewards (which serve
to strengthen a response) and punishments (which serve to weaken a response).
In Chapter 1 we referred to training based on a response-strengthening view
as a directive instructional architecture. A typical instructional method is to
51.
34 e-Learning and the Science of Instruction
Table 2.1. Three Metaphors of Learning.
Metaphor of Learning Learning Is: Learner Is: Instructor Is:
Response Strengthening Strengthening or Passive recipient Dispenser of
weakening of of rewards and rewards and
associations punishments punishments
Information Acquisition Adding information Passive recipient Dispenser of
to memory of information information
Knowledge Construction Building a mental Active sense Cognitive guide
representation maker
present simple questions to learners, and when they respond tell them whether
they are right or wrong. This was the approach taken with programmed
instruction in the 1960s and is prevalent in many e-learning lessons today. Our
main criticism of the response-strengthening metaphor is not that it is incor-
rect, but rather that it is incomplete—it tells only part of the story because it
does not explain meaningful learning.
If you checked the second answer, you opted for what can be called
the information-acquisition view of learning, in which the learner’s job is
to receive information and the instructor’s job is to present it. A typical
instructional method is a textbook or PowerPoint presentation, in which
the instructor conveys information to the learner. In Chapter 1 we refer
to the information-acquisition view as the basis for a receptive instructional
architecture. This approach is sometimes called the empty vessel or sponge
view of learning because the learner’s mind is an empty vessel into which
the instructor pours information. Our main criticism of this view—which is
probably the most commonly held view—is that it conflicts with much of
what we know about how people learn.
If you opted for the third alternative, you picked a metaphor that can
be called knowledge construction. According to the knowledge-construction
view, people are not passive recipients of information, but rather are active
sense makers. They engage in active cognitive processing during learning,
52.
H o wD o Pe o p l e L e a r n f r o m e - C o u r s e s ? 35
including attending to relevant information, mentally organizing it into a
coherent structure, and integrating it with what they already know. Although
we find some merit in each of the metaphors of learning, we focus most
strongly on this one. In short, the goal of effective instruction is not only to
present information but also to encourage the learner to engage in appropri-
ate cognitive processing during learning.
Principles and Processes of Learning
Figure 2.1 presents a model of how people learn from multimedia lessons.
In the left column, a lesson may contain graphics and words (in printed or
spoken form). In the second column, the graphics and printed words enter
the learner’s cognitive processing system through the eyes, and spoken words
enter through the ears. If the learner pays attention, some of the material is
selected for further processing in the learner’s working memory—where you
can hold and manipulate just a few pieces of information at one time in each
channel. In working memory, the learner can mentally organize some of the
selected images into a pictorial model and some of the selected words into
a verbal model. Finally, as indicated by the “integrating arrow,” the learner
can connect the incoming material with existing knowledge from long-term
memory—the learner’s storehouse of knowledge.
As you can see, there are three important cognitive processes indicated by
the arrows in the figure:
1. Selecting words and images—the first step is to pay attention to
relevant words and images in the presented material;
Figure 2.1. Cognitive Theory of Multimedia Learning.
Multimedia Long-Term
Presentation Senses Working Memory Memory
Selecting Organizing Verbal
Words Ears Words Sounds Words Model
Integrating Prior
Knowledge
Selecting Organizing Pictorial
Pictures Eyes Images
Images Images Model
53.
36 e-Learning and the Science of Instruction
2. Organizing words and images—the second step is to mentally orga-
nize the selected material in coherent verbal and pictorial representa-
tions; and
3. Integrating—the final step is to integrate incoming verbal and
pictorial representations with each other and with existing
knowledge.
Meaningful learning occurs when the learner appropriately engages in all of
these processes.
This learning model reflects four principles from research in cognitive
science:
1. Dual channels—people have separate channels for processing visual/
pictorial material and auditory/verbal material;
2. Limited capacity—people can actively process only a few pieces of
information in each channel at one time;
3. Active processing—learning occurs when people engage in appro-
priate cognitive processing during learning, such as attending to
relevant material, organizing the material into a coherent structure,
and integrating it with what they already know; and
4. Transfer—new knowledge and skills must be retrieved from long-
term memory during performance.
Managing Limited Cognitive Resources During Learning
The challenge for the learner is to carry out these processes within the con-
straints of severe limits on how much processing can occur in each channel
at one time. You may recall the expression: “Seven plus or minus two.” This
refers to the capacity limits of working memory. Let’s explore three kinds of
demands on cognitive processing capacity:
1. Extraneous processing—is cognitive processing that does not support
the instructional objective and is created by poor instructional layout;
2. Essential processing—is cognitive processing aimed at mentally
representing the core material (consisting mainly of selecting the
54.
H o wD o Pe o p l e L e a r n f r o m e - C o u r s e s ? 37
relevant material) and is created by the inherent complexity of the
material; and
3. Generative processing—is cognitive processing aimed at deeper
understanding of the core material (consisting mainly of organizing
and integrating) and is created by the motivation of the learner to
make sense of the material.
The challenge for instructional designers is to create learning environments
that minimize extraneous cognitive processing, manage essential processing,
and foster generative processing.
How Do e-Lessons Affect Human Learning?
If you are involved in designing or selecting instructional materials, your
decisions should be guided by an accurate understanding of how learning
works. Throughout the book, you will see many references to cognitive learn-
ing theory, as described in the previous section. Cognitive learning theory
explains how mental processes transform information received by the eyes
and ears into knowledge and skills in human memory.
Instructional methods in e-lessons must guide the learner’s transformation
of words and pictures in the lesson through working memory so that they are
incorporated into the existing knowledge in long-term memory. These events
rely on the following processes:
1. Selection of the important information in the lesson;
2. Management of the limited capacity in working memory to allow
the rehearsal needed for learning;
3. Integration of auditory and visual sensory information in working
memory with existing knowledge in long-term memory by way of
rehearsal in working memory; and
4. Retrieval of new knowledge and skills from long-term memory into
working memory when needed later.
In the following sections, we elaborate on these processes and provide exam-
ples of how instructional methods in e-learning can support or inhibit them.
55.
38 e-Learning and the Science of Instruction
Methods for Directing Selection of Important Information
Our cognitive systems have limited capacity. Since there are too many sources
of information competing for this limited capacity, the learner must select
those that best match his or her goals. We know this selection process can
be guided by instructional methods that direct the learner’s attention. For
example, multimedia designers may use an arrow or color to draw the eye to
important text or visual information, as shown in Figure 2.2.
Figure 2.2. Visual Cues Help Learners Attend to Important Elements
of the Lesson.
The e-Learning and the Science of Instruction CD.
Methods for Managing Limited Capacity in Working Memory
Working memory must be free to rehearse the new information provided in
the lesson. When the limited capacity of working memory becomes filled,
processing becomes inefficient. Learning slows and frustration grows. For
example, most of us find multiplying numbers like 968 by 89 in our heads
to be a challenging task. This is because we need to hold the intermediate
products of our calculations in working memory storage and continue to
56.
H o wD o Pe o p l e L e a r n f r o m e - C o u r s e s ? 39
multiply the next set of numbers in the working memory processor. It is very
difficult for working memory to hold even limited amounts of information
and process effectively at the same time.
Therefore, instructional methods that overload working memory make
learning more difficult. The burden imposed on working memory in the form
of information that must be held plus information that must be processed is
referred to as cognitive load. Methods that reduce cognitive load foster learning
by freeing working memory capacity for learning. In the past ten years, we’ve
learned a lot about ways to reduce cognitive load in instructional materials.
Many of the guidelines we present in Chapters 4 through 12 are effective
because they reduce or manage load. For example, the coherence principle
described in Chapter 7 states that better learning results when e-lessons mini-
mize irrelevant visuals, omit background music and environmental sounds,
and use succinct text. In other words, less is more. This is because, by using a
minimalist approach that avoids overloading working memory, greater capac-
ity can be devoted to rehearsal processes, leading to learning.
Methods for Integration
Working memory integrates the words and pictures in a lesson into a uni-
fied structure and further integrates these ideas with existing knowledge in
long-term memory. The integration of words and pictures is made easier by
lessons that present the verbal and visual information together rather than
separated. For example, Figure 2.3 illustrates two screens from two versions of
a lesson on lightning formation in which the text is placed next to the graphic
(Version A) or is placed at the bottom of the screen (Version B). Version A,
the integrated version, resulted in better learning than Version B. Chapter 4
summarizes the contiguity principle of instruction that recommends present-
ing pictures and words close together on the screen.
Once the words and pictures are consolidated into a coherent structure
in working memory, they must be further integrated into existing knowledge
structures in long-term memory. This requires active processing in work-
ing memory. e-Lessons that include practice exercises and worked examples
stimulate the integration of new knowledge into prior knowledge. For exam-
ple, a practice assignment asks sales representatives to review new product
H o wD o Pe o p l e L e a r n f r o m e - C o u r s e s ? 41
Methods for Retrieval and Transfer
It is not sufficient to simply add new knowledge to long-term memory. For
success in training, those new knowledge structures must be encoded into
long-term memory in a way that allows them to be easily retrieved when
needed on the job. Retrieval of new skills is essential for transfer of training.
Without retrieval, all the other psychological processes are meaningless, since
it does us little good to have knowledge stored in long-term memory that
cannot be applied later.
For successful transfer, e-lessons must incorporate the context of the job in
the examples and practice exercises so the new knowledge stored in long-term
memory contains good retrieval hooks. For example, one multimedia exercise
asks technicians to play a Jeopardy™ game in which they recall facts about a
new software system. A better alternative exercise gives an equipment failure
scenario and asks technicians to select a troubleshooting action based on facts
about a new software system. The Jeopardy™ game exercise might be perceived
as fun, but it risks storing facts in memory without a job context. These facts,
lacking the contextual hooks needed for retrieval, often fail to transfer. In con-
trast, the troubleshooting exercise asks technicians to apply the new facts to a
job-realistic situation. Chapters 10 and 11 on examples and practice in e-learn-
ing provide a number of guidelines with samples of ways multimedia lessons
can build transferable knowledge in long-term memory.
Summary of Learning Processes
In summary, learning from e-lessons relies on four key processes:
• First, the learner must focus on key graphics and words in the lesson
to select what will be processed.
• Second, the learner must rehearse this information in working mem-
ory to organize and integrate it with existing knowledge in long-term
memory.
• Third, in order to do the integration work, limited working memory
capacity must not be overloaded. Lessons should apply cognitive load
reduction techniques, especially when learners are novices to the new
knowledge and skills.
59.
42 e-Learning and the Science of Instruction
• Fourth, new knowledge stored in long-term memory must be retrieved
back on the job. We call this process transfer of learning. To support
transfer, e-lessons must provide a job context during learning that will
create new memories containing job-relevant retrieval hooks.
All of these processes require an active learner—one who selects and processes
new information effectively to achieve the learning goals. The design of the
e-lesson can support active processing or it can inhibit it, depending on what
kinds of instructional methods are used. For example, a lesson that follows a
Las Vegas approach to learning by including heavy doses of glitz may overload
learners, making it difficult to process information in working memory. At the
opposite extreme, lessons that use only text fail to exploit the use of relevant
graphics, which are proven to increase learning (see Chapter 3).
All of our recommendations are based on high-quality research. But what
constitutes “good” research? We address this question in the next section.
What Is Good Research?
We recommend that e-learning courses incorporate methods that are based
on high-quality research. We favor evidence-based practice—the idea that
instructional techniques should be based on research findings and research-
based theory. Shavelson and Towne (2002, p. 1) eloquently summarize the
argument for evidence-based practice in education: “One cannot expect
reform efforts in education to have significant effects without research-based
knowledge to guide them.”
Certainly, it is easier to base courses on the design recommendations
of experts, but it’s always worthwhile to ask, “Yes, but does it work?” Until
fairly recently, there was not much of a research base concerning the design
of e-learning environments. However, as we sit down to write the second edi-
tion of this book, we are finding a useful and growing base of research (for
example, Clark & Lyons, 2004; Clark, Nguyen, & Sweller, 2006; Jonassen,
2004; Mayer, 2001a, 2005a; Sweller, 1999). Our goal is not to review
every e-learning study, but rather to summarize some exemplary studies
60.
H o wD o Pe o p l e L e a r n f r o m e - C o u r s e s ? 43
that represent the best-established findings. In this section, we want to help
you recognize high-quality research in your role as a consumer or designer of
e-learning courseware. Table 2.2 summarizes three roads to research—informal
studies, controlled studies, and clinical trials.
Table 2.2. Three Types of Research.
Research Type Definition Example
Informal Studies Conclusions based on e-Lesson revisions are
feedback from and based on evaluation sheets
observations of students completed during pilot test.
Controlled Studies Conclusions based on Learning from two identical
outcome comparisons of lessons (one with and one
randomly assigned without music) is compared
participants to groups with in a laboratory setting.
different treatments
Clinical Trials Conclusions based on A particular e-learning
outcomes of lessons taken program is selected based on
in actual learning settings outcomes from two hundred
supervisors.
Informal Studies
Informal studies (or observational studies) involve observing people as they
learn or asking them about their learning. For example, we might develop an
e-learning course and ask people what they like and don’t like about it. Based
on this feedback, we can adjust some features of the course. The process
of making changes based on learner feedback is called formative evaluation.
Alternatively, we can use the feedback along with post-test learning data to
summarize the positive and negative features of the course. The process of
making an end-of-project evaluation is called summative evaluation. Although
informal studies can play a useful role in course development, they do not
meet the high scientific standards we have set for the science of instruction.
61.
44 e-Learning and the Science of Instruction
Controlled Studies
Controlled studies (or experimental studies) involve comparing the learning
process and/or outcomes of two or more groups of learners. In measuring
the learning process and/or outcomes (which can be called the dependent
measures), we recommend measuring how deeply people have learned. This
can be accomplished by asking them to apply what was taught to new situa-
tions, rather than simply asking them to recall lesson content. In setting up
the groups, we recommend keeping all the conditions the same except for
one variable (which can be called the independent variable). For example,
we can compare a group that receives an e-learning course that has back-
ground music to an identical course that lacks the music. The learners must
be equivalent in the two groups—a feat that is best ensured by randomly
assigning people to the groups. This is a controlled study because all features
of the learning situation are the same (that is, controlled) except for the
feature being studied (that is, the independent variable, which in this case is
background music).
In an analysis of research methods in education, Phye, Robinson, and
Levin (2005) conclude that experimental research methods offer the stron-
gest evidence that student learning is caused by a particular educational inter-
vention. Large-scale application of the experimental method to research with
humans has been one of the greatest scientific achievements of the 20th Cen-
tury. This is our preferred research method for the purposes of this book.
Clinical Trials
Clinical trials (or controlled field testing) involve comparing the learning
process and outcome of people who learn from a targeted e-learning course
versus people who learn from some other venue (such as a different e-learning
course). Clinical trials use the experimental method, as described previously,
but do so by examining whether the e-learning course works in the field,
that is, in the real-world context for which it was intended. Clinical trials are
useful because they evaluate outcomes in real-world contexts. However, the
results are limited by the many extraneous variables that can impact learning
in the field. Mosteller and Boruch (2002) have shown that clinical trials have
been used successfully in medical research and argue that clinical trials can
also be useful in determining the impact of educational programs on learning.
62.
H o wD o Pe o p l e L e a r n f r o m e - C o u r s e s ? 45
Although we believe that clinical trials are an important component in the
development of effective e-learning courses, our focus in this book is on more
basic design principles that are best discovered in controlled studies.
How Can You Identify Relevant Research?
You might wonder how we selected the research we include in this book or
how you could determine whether a given research study is applicable to
your design decisions. The following list summarizes five questions to con-
sider when reading research studies:
1. How similar are the learners in the research study to your learners?
Research conducted on children may be limited in its applicability
to adult populations. More relevant studies use subjects of college
age or beyond.
2. Are the conclusions based on an experimental research design?
Look for subjects randomly assigned to test and control groups.
3. Are the experimental results replicated? Look for reports of research
in which conclusions are drawn from a number of studies that
essentially replicate the results. The Review of Educational Research
and Educational Psychology Review are good sources, as are hand-
books such as the Cambridge Handbook of Multimedia Learning
(Mayer, 2005a), the Handbook of Research on Educational Com-
munications and Technology (Jonassen, 2004), and the Handbook of
Educational Psychology (Alexander & Winne, 2006).
4. Is learning measured by tests that measure application? Research
that measures outcomes with recall tests may not apply to work-
force learning goals in which the learning outcomes must be
application, not recall, of new knowledge and skills.
5. Does the data analysis reflect practical significance as well as sta-
tistical significance? With a large sample size, even small learning
differences may have statistical significance yet may not justify
the expense of implementing the test method. Look for statistical
significance of .05 or less and effect sizes of .5 or more. (See our
explanation of effect sizes in the paragraphs to follow.)
63.
46 e-Learning and the Science of Instruction
All of these questions relate to the applicability of the research to your
learning audience and desired outcomes or the confidence you can put in the
results based on the validity of the study. Throughout this book we report
the results of statistical tests of the research we summarize. Therefore, we
briefly summarize how to interpret those tests in the next section.
How Do You Interpret Research Statistics?
Suppose you read a study comparing two groups of students—a test group
and a control group. The control group received a basic multimedia lesson
that explains content with graphics and audio narration. We call this the
no-music group. The test group received the same lesson with background
music added to the narration. We call this the music group. Suppose the
no-music group averaged 90 percent correct on a test of the material and
the music group averaged 80 percent on the same test. Averages are also
called means (for example, 90 percent versus 80 percent). Also suppose the
scores were not very spread out, so most of the no-music students scored
close to 90 and most of the music students scored close to 80. Standard devi-
ation tells you how spread out the scores are, or how much variation there
is in the results. Powerful instructional methods should yield high averages
and low standard deviations. In other words, high scores are achieved and
nearly all learners score close to the average so that there is high consistency
in outcomes among the learners.
As illustrated in Figure 2.4, let’s suppose the standard deviation is 10
for the no-music group and 10 for the music group. Based on these means
and standard deviations, can we conclude that background music hurts
learning? Generally, when the difference between the score averages is high
(90 percent versus 80 percent in our example) and the standard deviations
are low (10 percent in our example), the difference is real. However, to
accurately decide that issue requires statistical tests. Two common statisti-
cal measures associated with research studies we present in this book are
probability and effect size. As you read research, look for results in which
the probability is less than .05 (p < .05) and show an effect size of .5 or
greater.
64.
H o wD o Pe o p l e L e a r n f r o m e - C o u r s e s ? 47
Figure 2.4. Standard Deviation and Effect Size from Two Lessons.
Standard Deviation (SD) 10
Effect Size 1
90 80
Effect Size 1
Number of Students
10
Lesson Without
Music
Average 90%
Lesson with
Music
Average 80%
SD 10
80 90 100
Test Scores
P R O B A B I L I T Y A N D EF F EC T S IZ E:
D ETA I L S
Some statistical tests yield a measure of probability such as p < .05 (which is read,
“probability less than point oh five”). In the case of our background music study,
this means that there is less than a 5 percent chance that the difference between
90 percent and 80 percent does NOT reflect a real difference between the two
groups. In other words, there is a 95 percent chance that the difference in scores is
real—not just a chance result. Thus we can conclude that the difference between
the groups is statistically significant. In general, when the probability is less than .05,
researchers conclude that the difference is real, that is, statistically significant.
EFFECT SIZE: HOW BIG IS THE DIFFERENCE IN
PRACTIC AL TERMS?
Even if music has a statistically significant effect, we might want to know how strong
the effect is in practical terms. We could just subtract one mean score from the other,
yielding a difference of 10 in our music study. However, to tell whether 10 is a big dif-
ference, we can divide this number by the standard deviation of the control group (or of
65.
48 e-Learning and the Science of Instruction
both groups pooled together). This tells us how many standard deviations one group is
more than the other and is called effect size (ES). In this case, the ES is 1, which is gen-
erally regarded as a strong effect. What this means is that an individual learner in the
control group would have a 1 standard deviation increase (10 points in our example) if
he or she were to study with a lesson that omitted music. If the ES had been .5 in our
example, an individual learner in the control group would have a .5 standard deviation
increase. When the ES is less than .2, the practical impact of the experimental treat-
ment is a bit too small to worry about, an ES of .5 is moderate, and when it climbs
to .8 or above, it is large enough to get very excited about (Cohen, 1988).
What We Don’t Know About Learning
The study of learning has a long history in psychology, but until recently
most of the research involved contrived tasks in laboratory settings such as
how hungry rats learned to run a maze or how humans learned a list of words.
Within the last twenty-five years, however, learning researchers have broad-
ened their scope to include more complex kinds of learning tasks, including
e-learning. What is needed is more high-quality research that is methodologi-
cally rigorous, theoretically based, and grounded in realistic e-learning situa-
tions. In short, we need research-based principles of e-learning (Mayer, 2001,
2005a). This book provides you with a progress report on research-based prin-
ciples that are consistent with the current state of research in e-learning.
DE S I GN D I L EM M A : RES O LVED
Your HR director wanted to launch an e-learning program with popular new tech-
nological features such as games, simulations, and animations. However, you were
concerned that an unbalanced focus on technology would be counter productive.
We considered the following options:
A. Online applications such as games, simulations, and blogs are engaging
and should be a central feature of all new e-learning initiatives.
66.
H o wD o Pe o p l e L e a r n f r o m e - C o u r s e s ? 49
B. Online applications such as games, simulations, and blogs may interfere
with human learning processes and should be avoided.
C. We don’t know enough about human learning to make specific
recommendations about how to use new technology features.
D. Not sure which options are correct.
Based on the evidence in this chapter, we believe that the right question is NOT
whether popular online features such as games or simulations are good or bad
ideas. Instead, we recommend that you take a learner-centered approach and
consider how all technology features from graphics to games can be used in ways
that support cognitive processes of selection, rehearsal, load management, and
retrieval. In this book we will address all major technology features from a learner-
centered perspective.
A week later you stop by the HR director’s office for a follow-up meeting. You
make your case: “Using the corporate intranet for learning is not the same as using
the Internet for entertainment or reference. We really need to shape the media to
our purposes, not vice versa! It’s going to cost a lot to develop this training and even
more for the employees to take it. Can we risk spending that money on materials
that violate research-proven principles for learning? Let’s use e-learning as an oppor-
tunity to improve the quality of the training we have been providing by factoring in
evidence of what works!”
W H AT T O LO O K F O R I N e - L E A R N I N G
At the end of the remaining chapters, you will find in this section a checklist of
things to look for in effective e-lessons. The checklists summarize teaching methods
that support cognitive processes required for learning and have been proven to be
valid through controlled research studies. In Chapter 16, as well as on the CD, we
present a checklist that combines the guidelines from all of the chapters along with
some sample e-learning course reviews.
67.
50 e-Learning and the Science of Instruction
ON e-LEARNING AND THE SCIENCE OF
INSTRUCTION CD
In this new edition, we add examples of multimedia instruction that apply and fail to
apply our guidelines. With the help of Alan Koenig, a doctoral student at Arizona State
University, we have designed and programmed two sample lessons on how to construct
a database. The example lesson applies most of our guidelines, while the counter-
example lesson violates most of them. At the end of each chapter, we write specific
commentary on how the example and counter-example relate to the guidelines of that
chapter.
COMING NEXT
Two fundamental tools you have for teaching are visuals and words. Is there
a value to using both visuals and words? In Chapter 3 we look at evidence
regarding the instructional value of graphics and consider whether some types
of graphics are more effective than others.
Suggested Readings
Alexander, P.A., & Winne, P.H. (Eds.). (2006). Handbook of educational
psychology (2nd ed.). Mahwah, NJ: Lawrence Erlbaum.
Clark, R., Nguyen, F., & Sweller, J. (2006). Efficiency in learning. San
Francisco, CA: Pfeiffer.
Jonassen, D.H. (Ed.). (2004). Handbook of research on educational communi-
cations and technology (2nd ed.). Mahwah, NJ: Lawrence Erlbaum.
Mayer, R.E. (2001). Multimedia learning. New York: Cambridge University
Press.
Mayer, R.E. (Ed.). (2005). The Cambridge handbook of multimedia learning.
New York: Cambridge University Press.
68.
H o wD o Pe o p l e L e a r n f r o m e - C o u r s e s ? 51
Mayer, R.E. (in press). Learning and instruction (2nd ed.) Upper Saddle
River, NJ: Pearson Merrill Prentice Hall.
Phye, G.D., Robinson, D.H., & Levin, J. (Eds.). (2005). Empirical methods
for evaluating educational interventions. San Diego, CA: Elsevier.
Shavelson, R.J., & Towne, L. (Eds.). (2002). Scientific research in education.
Washington, DC: National Academy Press.
69.
CHAPTER OUTLINE
Do VisualsMake a Difference?
Multimedia Principle: Include Both Words and Graphics
Select Graphics That Support Learning
Some Ways to Use Graphics to Promote Learning
Graphics to Teach Content Types
Graphics as Topic Organizers
Graphics to Show Relationships
Graphics as Lesson Interfaces
Psychological Reasons for the Multimedia Principle
Evidence for Using Words and Pictures
The Multimedia Principle Works Best for Novices
Should You Change Static Illustrations into Animations?
What We Don’t Know About Visuals
70.
3
Applying the Multimedia
Principle
US E W O R D S A N D G R A P H I C S R AT H E R
THAN WORDS ALONE
W H AT ’ S N E W I N T H I S C H A P T E R ?
I N THE FIRST EDITION we summarized evidence for learning gains
that result from combining text and relevant graphics in e-lessons. In the
past few years, we have seen a growing body of research focusing on the types
of visuals that best promote learning. For example, studies are comparing
learning from animated and from static visuals. Flash animations are popu-
lar additions to contemporary e-learning courses. How effective are these
animations? In addition, we have growing evidence that well-designed visuals
and text can particularly benefit learners with less experience in the lesson
content.
53
71.
54 e-Learning and the Science of Instruction
DE S I GN D I L E M M A : YO U DEC IDE
The new vice president of corporate learning and performance is anxious to get
started with the company’s new e-learning initiative. She wants to show results
quickly to offset upper management’s impression that e-learning development
is so slow that, by the time it’s released, it’s already out-of-date. She has com-
mitted to an asynchronous lesson on building databases to be ready in the next
month. “After all,” she says to Matt, the project lead, “we already have the
content from our current instructor-led course, so let’s quickly convert it into
e-learning!”
Ben, the project programmer, works quickly putting the classroom lecture notes
into HTML. He proudly shows the team his first-draft storyboards, such as the one
shown in Figure 3.1.
Figure 3.1. A Screen from Ben’s First Draft of the Database Course.
Reshmi, one of the course designers, reacts negatively: “Hey, Ben, it’s great
that you got a draft together quickly since we don’t have much development time.
But this looks pretty boring to me! In e-learning the computer screen is our main
72.
A p pl y i n g t h e M u l t i m e d i a Pr i n c i p l e 55
connection with the students, and screens filled with text will turn them off
right away. We need this first project to be engaging. We need to add graph-
ics and animations!” “Yeah,” Ben replies, “graphics are great, but we don’t
have a graphic artist, so I’ll have to download some clip art. And that will add
development time. Finding clip art about databases won’t be that easy!” “Clip
art is cheesy,” Reshmi replies. “Let’s contract with an artist to create some
custom Flash animations for us so we can really show what e-learning can do.”
Matt, the project manager, jumps in: “It will take time to get a contract set up
and get the artist up-to-speed—time we don’t have. Let’s just start simple on
this first project by going with mostly text with some clip art here and there to
add interest. We can try for a graphic artist on future projects. After all, basi-
cally our goal is to explain about databases, and we can do that effectively
with words.” Based on your own experience or intuition, which of the following
options is correct:
A. Matt is right. Learning will be just as effective from good textual
explanations as from text plus graphics.
B. Ben is right. Adding clip art to a few screens will make the lesson more
interesting.
C. Reshmi is right. Customized visuals including animations to illustrate the
content will add appeal and improve learning.
D. Not sure which options are correct.
Do Visuals Make a Difference?
In training, it is customary to use words—either in printed or spoken
form—as the main vehicle for conveying information. Words are quick
and inexpensive to produce. The question is whether there is any return
on investment for supplementing words with pictures—either static graph-
ics such as drawings or photos, or dynamic graphics such as animation or
video. In particular, do people learn more deeply from words and graphics
than from words alone? This is the issue we want to explore with you in
this chapter.
73.
56 e-Learning and the Science of Instruction
M U LT I M E D I A P R I N C I P L E
Include Both Words and Graphics
Based on cognitive theory and research evidence, we recommend that
e-learning courses include words and graphics, rather than words alone. By
words, we mean printed text (that is, words printed on the screen that people
read) or spoken text (that is, words presented as speech that people listen to
through earphones or speakers). By graphics, we mean static illustrations
such as drawings, charts, graphs, maps, or photos, and dynamic graphics such
as animation or video. We use the term “multimedia presentation” to refer
to any presentation that contains both words and graphics. For example, if
you are given an instructional message that is presented in words alone, such
as shown in Figure 3.1, we recommend you convert it into a multimedia
presentation consisting of words and pictures, such as shown in Figure 3.2.
As you complete the job and content analysis, you should visualize how the
instructional message can be communicated using both words and relevant
pictures.
Figure 3.2. A Revision of Figure 3.1 with Visuals Added.
AUDIO: Entity relationship diagrams dictate how the tables in the database relate to one
another. These relationships govern how the database searches for data when running
a query. In our case, a “one-to-many” relationship exists between the Rentals table and
the Customers and Movies tables. Let’s take a closer look at what this means.
74.
A p pl y i n g t h e M u l t i m e d i a Pr i n c i p l e 57
The rationale for our recommendation is that people are more likely to
understand material when they can engage in active learning—that is, when
they engage in relevant cognitive processing such as attending to the relevant
material in the lesson, mentally organizing the material into a coherent
cognitive representation, and mentally integrating the material with their exist-
ing knowledge. Multimedia presentations can encourage learners to engage in
active learning by mentally representing the material in words and in pictures
and by mentally making connections between the pictorial and verbal represen-
tations. In contrast, presenting words alone may encourage learners—especially
those with less experience or expertise—to engage in shallow learning, such as
not connecting the words with other knowledge.
There are many examples of e-learning environments that contain window
after window of text and more text. Some may even have graphics that deco-
rate the page, but do not help you understand the text. For example, Figure 3.3
from a military course on ammunition presents scrolling text and a picture of
a general as a decorative element. As you can see, the general graphic does not
support the text, but rather simply serves to fill screen space.
Figure 3.3. A Decorative Graphic That Does Not Improve Learning.
75.
58 e-Learning and the Science of Instruction
Select Graphics That Support Learning
Instead of presenting words alone, we recommend presenting words and
graphics. However, not all kinds of graphics are equally helpful. For example,
let’s consider several possible functions of graphics:
1. Decorative graphics serve to decorate the page without enhancing
the message of the lesson, such as a photo or a video of a person
riding a bicycle in a lesson on how bicycle tire pumps work;
2. Representational graphics portray a single element, such as a photo
of the bicycle tire pump along with a caption, “bicycle tire pump”;
3. Relational graphics portray a quantitative relation among two or
more variables, such as a line graph showing the relation between
years of age on the x-axis and probability of being in a bicycle
accident on the y-axis;
4. Organizational graphics depict the relations among elements, such
as a diagram of a bicycle tire pump with each part labeled or a
matrix giving a definition and example of each of three different
kinds of pumps;
5. Transformational graphics depict changes in an object over time,
such as a video showing how to fix a flat tire, or a series of annotated
frames showing steps in how a bicycle tire pump works; and
6. Interpretive graphics illustrate invisible relationships such as an
animation of the bicycle pump that includes small dots to show the
flow of air into and out of the pump.
Based on this analysis, we recommend that you minimize graphics that
decorate the page (called decorative graphics) or simply represent a single
object (called representational graphics), and that you incorporate graphics that
help the learner understand the material (called transformational and inter-
pretive graphics) or organize the material (called organizational graphics). For
example, Table 3.1 is an organizational graphic that gives the name, definition,
and example of six functions of graphics in the form of a matrix. When the
text describes a quantitative relationship, then a relational graphic is warranted;
and when the text describes changes over time, then a transformational graphic
is warranted.
76.
A p pl y i n g t h e M u l t i m e d i a Pr i n c i p l e 59
Table 3.1. An Organizational Graphic of Graphic Types.
Adapted from Clark and Lyons, 2004.
Graphic Type Description Examples
Decorative Visuals added for aesthetic 1. The general in Figure 3.3
appeal or for humor 2. A person riding a bicycle in
a lesson on how a bicycle
pump works
3. Baseball-related icons as a
game theme in a lesson on
product knowledge
Representational Visuals that illustrate the 1. The sample tables in Figure 3.2
appearance of an object 2. A photograph of equipment
in a maintenance lesson
3. A screen capture in a com-
puter application lesson
Organizational Visuals that show 1. A matrix such as this table
qualitative relationships 2. A concept map
among content 3. A tree diagram
Relational Visuals that summarize 1. A bar graph or pie chart
quantitative relationships 2. A map with circles of
different sizes representing
location and strength of
earthquakes
Transformational Visuals that illustrate 1. An animated demonstration
changes in time or over of a computer procedure
space 2. A video of how volcanoes erupt
3. A time-lapse animation of
seed germination
Interpretive Visuals that make 1. Drawings of molecular
intangible phenomena structures
visible and concrete 2. A series of diagrams with
arrows that illustrate the flow
of blood through the heart
3. Pictures that show how data is
transformed and transmitted
through the Internet
77.
60 e-Learning and the Science of Instruction
In Chapter 2, we summarized the dual channels principle that learners have
separate channels for processing visual material and auditory material. We see the
job of an instructional professional as not just to present information—such as
presenting text that contains everything the learner needs to know—but rather
to leverage both channels in ways that enable the learner to make sense out of
the material. Providing relevant graphics with text is a proven method of foster-
ing deeper cognitive processing in learners. In short, learning is facilitated when
the graphics and text work together to communicate the instructional message.
Some Ways to Use Graphics to Promote Learning
Helping you determine how to create the best types of graphics to meet your
instructional goals requires a book topic in itself. In fact, just such a book
is Graphics for Learning by Ruth Colvin Clark and Chopeta Lyons. Here we
offer just a few examples of the ways to use graphics that serve instructional
rather than decorative roles: to teach content types, as topic organizers, and
as lesson interfaces.
Graphics to Teach Content Types
Clark (2007) has identified five different kinds of content: fact, concept, pro-
cess, procedure, and principle. Table 3.2 briefly describes each content type
and lists graphic types commonly used to teach specific lesson content such as
facts, concepts, processes, procedures, and principles.
Since 63 percent of computer-systems training is delivered by e-learning
(Industry Report, 2006), many e-learning graphics are screen captures. A screen
capture is a graphic that is a replication of an actual software screen. For exam-
ple, Figure 3.4 is a screen capture from a synchronous e-learning class on Excel.
At this point in the lesson, the instructor uses application sharing features of the
virtual classroom to demonstrate how to use formulas in Excel. Another content
type that profits from graphic support is process. A process is a step-by-step
description of how a system works, including business, scientific, and mechani-
cal systems. Process information is effectively visualized with a series of static
frames or, in some cases, animations. Figure 3.5 is a screen from an animated
graphic showing how the AIDS virus infects cells.
78.
A p pl y i n g t h e M u l t i m e d i a Pr i n c i p l e 61
Table 3.2. Graphics to Teach Content Types.
Adapted from Clark, 2007.
Content Useful Graphic
Type Description Types Example
Facts Unique and isolated Representational A screen capture of a
information such as Organizational spreadsheet, as in
specific application Figure 3.4
screens, forms, or A table of parts’ names
product data and specifications
Concepts Groups of objects, Representational Diagrams of database
events, or symbols Organizational tables as in Figure 3.2
designated by a Interpretive A tree diagram of
single name biological species
Three Excel formulas
to illustrate
formatting rules
Process A description of how Transformational Animations of how the
something works Interpretive heart pumps blood
Relational Still diagrams to
illustrate how a
bicycle pump works
An animation showing
how a virus invades
a cell as in Figure 3.5
Procedure A series of steps Transformational An animated illustration
resulting in of how to use a
completion of spreadsheet as
a task in Figure 3.4
A diagram with arrows
showing how to
install a printer cable
Principle Guidelines that result Transformational A video showing two
in completion of a Interpretive effective sales approaches
task; cause-and-effect An animation showing
relationships genes passing from
parents to offspring
79.
62 e-Learning and the Science of Instruction
Figure 3.4. A Transformation Visual of an Excel Screen Projected
Through Application Sharing in Synchronous e-Learning.
Figure 3.5. A Transformational Graphic Illustrating Process of
AIDS Infection.
With permission of Roche, Basel, Switzerland.
www.roche-hiv.com/front.cfm
80.
A p pl y i n g t h e M u l t i m e d i a Pr i n c i p l e 63
Graphics as Topic Organizers
In addition to illustrating specific content types, graphics such as topic maps
can serve an organizational function by showing relationships among topics
in a lesson. For example, Figure 3.6 shows a screen with a series of coach-
ing topics mapped in the left-hand bar, including where to coach, when to
coach, how long to coach, and so on. When the mouse is placed over each
of the topics in the graphic organizer, a different illustration appears on the
right side of the screen. In this example, the topic of formal and informal
coaching sessions is reinforced with text and photographs.
Figure 3.6. An Organizational Graphic on Coaching Topics.
Graphics to Show Relationships
Graphics in the form of dynamic and static graphs can make invisible phe-
nomena visible and show relationships. Imagine an e-learning lesson to teach
fast-food workers safe cooking and food-handling practices. An animated line
graph with numbers on the vertical axis and time on the horizontal axis illus-
trates changes in bacterial growth in food cooked at different temperatures or
81.
64 e-Learning and the Science of Instruction
handled in safe and unsafe ways. The lesson includes an interactive simulation
in which the learner adjusts the cooking temperature and sees the impact on
a dynamic line graph called a “germ meter.” A geographic map can illustrate
population density by adding a small red dot to represent five thousand indi-
viduals. If made interactive, the map could include a slider bar that accessed
different time periods, allowing the viewer to see population shifts over time.
Graphics as Lesson Interfaces
Finally, courses designed using a guided discovery approach often use a graphi-
cal interface as a backdrop to present case studies. For jobs that are conducted
in office settings, a generic office like the one shown in Figure 3.7 illustrates a
number of resources for the learner to use while working on a simulated job
assignment. In this lesson, bank loan agents can use the computer, telephone, fax
machine, and bookshelf to research a commercial loan application. For additional
information on the use of graphics in instruction, see Clark and Lyons (2004).
Figure 3.7. The Graphic Interface Provides Resources for Researching a
Bank Loan Applicant.
With permission from Moody’s Investment Service.
82.
A p pl y i n g t h e M u l t i m e d i a Pr i n c i p l e 65
Psychological Reasons for the Multimedia Principle
Perhaps the single greatest human invention is language, and the single great-
est modification of this invention is printed language. Words allow us to
communicate effectively, and printed words allow us to communicate effec-
tively across miles and years. (So does recorded speech, by the way, which
is yet another modification of the great invention of language.) Therefore,
it makes sense to use words when we provide training or instruction. For
thousands of years, the main format for education has been words—first in
spoken form and more recently in printed form. Words are also the most
efficient and effective way of producing e-learning because words can convey
a lot of information and are easier to produce than graphics.
This line of thinking is based on the information acquisition theory, in
which teaching consists of presenting information and learning consists of
acquiring information, as summarized in the middle of Table 2.1. Informa-
tion can be delivered in many forms—such as printed words, spoken words,
illustrations, photos, graphs, animation, video, and narration. Over the years,
it has become clear that words are an efficient and effective method for pre-
senting information, so based on this view, in most situations instruction
should involve simply presenting words. According to the information acqui-
sition theory, the format of the information (for example, words versus pic-
tures) does not matter, as long as the information is delivered to the learner.
In our opinion, the information acquisition theory is based on an inad-
equate conception of how people learn. Instead, we favor a knowledge con-
struction theory in which learning is seen as a process of active sense-making
and teaching is seen as an attempt to foster appropriate cognitive process-
ing in the learner, as summarized in the bottom of Table 2.1. According to
this learning metaphor, it is not good enough to deliver information to the
learner; instructors must also guide the learner’s cognitive processing during
learning, thereby enabling and encouraging learners to actively process the
information. An important part of active processing is to mentally construct
pictorial and verbal representations of the material and to mentally connect
them. This goal is more likely to be achieved with multimedia lessons with
both words and corresponding pictures that depict the same to-be-learned
content. Adding relevant graphics to words can be a powerful way to help
83.
66 e-Learning and the Science of Instruction
learners engage in active learning. Overall, your view of the cognitive stages
of learning (as summarized in Table 2.1) can influence your decisions about
how to design instruction (Mayer, 2003).
Evidence for Using Words and Pictures
There is consistent evidence that people learn more deeply from words and
pictures than from words alone, at least for some simple instructional situa-
tions. In eleven different studies, researchers compared the test performance
of students who learned from animation and narration versus narration
alone or from text and illustrations versus text alone (Mayer, 1989b; Mayer
& Anderson, 1991, 1992; Mayer, Bove, Bryman, Mars, & Tapangco, 1996;
Mayer & Gallini, 1990; Moreno & Mayer, 1999b, 2002b). The lessons
taught scientific and mechanical processes, including how lightning works,
how a car’s braking system works, how pumps work, and how electrical gen-
erators work. For example, in one study students read an accurate verbal
description of how a bicycle pump works (as shown in Figure 3.8), while
others read the same verbal description and viewed a diagram depicting the
same steps (as shown in Figure 3.9).
Figure 3.8. How a Bicycle Pump Works Explained with Words Alone.
How a Bicycle Pump Works
“As the rod is pulled out, air passes through the piston
and fills the area between the piston and the outlet valve.
As the rod is pushed in, the inlet valve closes and the
piston forces air through the outlet valve.”
In all eleven comparisons, students who received a multimedia lesson
consisting of words and pictures performed better on a subsequent transfer
test than students who received the same information in words alone. Across
the eleven studies, people who learned from words and graphics produced
between 55 percent to 121 percent more correct solutions to transfer prob-
lems than people who learned from words alone. Across all studies, a median
percentage gain of 89 percent was achieved with an effect size of 1.50. Recall
84.
A p pl y i n g t h e M u l t i m e d i a Pr i n c i p l e 67
Figure 3.9. How a Bicycle Pump Works Explained with Words and Graphics.
Handle
As the rod is pulled out,
As the rod is pushed in,
air passes through the piston
Piston
Inlet valve the inlet valve closes
Outlet valve
Hose
and fills the area between the and the piston forces air
piston and the outlet valve. through the outlet valve.
from our discussion in Chapter 2 that effect sizes over .8 are considered large.
Figure 3.10 shows a result from one of these experiments.
Figure 3.10. Learning Is Better from Words Plus Graphics Than from
Words Alone.
Adapted from Mayer, 2001a.
100
Percent Correct on Transfer Test
80 Words Graphics
60
Words Alone
40
20
0
85.
68 e-Learning and the Science of Instruction
We call this finding the multimedia effect—people learn more deeply
from words and graphics than from words alone. In a recent review, Fletcher
and Tobias (2005, p. 128) concluded: “The multimedia principle, which
suggests that learning and understanding are enhanced by adding pictures to
text rather than presenting text alone, appears to be well supported by find-
ings from empirical research.” The multimedia effect is the starting point
for our discussion of best instructional methods for e-learning because it
establishes the potential for multimedia lessons to improve human learning.
Complementary results come from research on graphic advance organiz-
ers—pictorial material presented at the start of a lesson intended to help the
learner understand the material (Mayer, 1989b). For example, in one study
(Mayer, 1983) students read a lesson on how radar works and then answered
questions. Students performed much better on the test if they saw a graphic
representation of the steps in radar (as a ball being thrown, bouncing off an
object, and returning to the source) before the lesson was presented. In this
lesson, using a ball bouncing off a wall served as an interpretive graphic to
illustrate the invisible phenomenon of radar.
In a related study involving interactive multimedia, Moreno and Mayer
(1999b) developed a mathematics computer game intended to teach students
how to add and subtract signed numbers (such as 2 3 ____). Some stu-
dents learned from drill-and-practice problems, whereas others worked on
the same problems, but as feedback also saw a bunny hop along a number
line to represent each problem (such as starting at 2, turning to face the left,
hopping backward three steps, and landing on 5). Students learned better
with symbols and graphics than from symbols alone.
In the remainder of this section, we consider two addition research ques-
tions, concerning for whom the multimedia principle works (novices versus
experts) and where the multimedia principle works (static illustrations
versus animations).
The Multimedia Principle Works Best for Novices
Does the multimedia principle apply equally to all learners? There is increas-
ing evidence that our recommendation to use words and graphics is particu-
larly important for learners who have low knowledge of the domain (whom
86.
A p pl y i n g t h e M u l t i m e d i a Pr i n c i p l e 69
we can call novices), rather than learners who have high knowledge of the
domain (whom we can call experts). For example, in a series of three experi-
ments involving lessons on brakes, pumps, and generators, Mayer and Gallini
(1990) reported novices learned better from text and illustrations (such as
shown in Figure 3.9) than from words alone (such as shown in Figure 3.8),
but experts learned equally well from either condition. Apparently, the more
experienced learners are able to create their own mental images as they read
the text about how the pump works, for example, whereas the less experienced
learners need help in relating the text to a useful pictorial representation.
In a related study, Ollershaw, Aidman, and Kidd (1997) presented text
lessons on how pumps work to learners who had low or high knowledge of
the domain. Low-knowledge learners benefited greatly when animation was
added to the text, whereas high-knowledge learners did not. These and related
results (Kalyuga, Chandler, & Sweller, 1998, 2000; Mayer & Gallini, 1990;
Ollerenshaw, Aidman, & Kidd, 1997) led Kalyuga, Ayres, Chandler, and
Sweller (2003) and Kalyuga (2005) to propose the expertise reversal effect—
the idea that instructional supports that help low-knowledge learners may
not help (and may even hurt) high-knowledge learners. Overall, we recom-
mend that you be sensitive to the level of prior knowledge of your learners, so
that you can provide needed supports—such as multimedia instruction—to
low-knowledge learners. If you are working on a course for a less advanced
group of learners—beginning trainees, for example—you should be espe-
cially careful to supplement text-based instruction with coordinated graphics.
If you have a more advanced group of learners—such as medical residents or
engineers experienced in the topic you are presenting—they may be able to
learn well mainly from text or even mainly from graphics.
Should You Change Static Illustrations
into Animations?
If it is important to add graphics to words, is it better to use animations or
static illustrations? Flash animations are currently very popular additions to
many e-learning lessons. At first glance, you might think that animations
are best because they are an active medium that can depict changes and
87.
70 e-Learning and the Science of Instruction
movement. Similarly, you might think that static illustrations are a poorer
choice because they are a passive medium that cannot depict changes and
movement in as much detail as animations can. In spite of these impres-
sions, a number of research studies have failed to find that animations are
more effective than a series of static frames depicting the same material
(Betrancourt, 2005; Hegarty, Kriz, & Cate, 2003; Mayer, Hegarty, Mayer, &
Campbell, 2005; Tversky, Morrison, & Betrancourt, 2002).
Let’s consider two ways to use multimedia to explain how lightning
storms develop—a paper-based lesson of a series of static illustrations with
printed text (as shown in Figure 3.11) or a computer-based lesson of nar-
rated animations in which the words are spoken and the transitions between
frames are animated. On a transfer test, students in the paper group per-
formed 32 percent better than students in the computer group, yielding an
effect size of .55 (Mayer, Hegarty, Mayer, & Campbell, 2005). In four such
comparisons—involving lessons on lightning, ocean waves, hydraulic brakes,
and toilet tanks—the illustrations-and-text group always performed better
than the animation-and-narration group, yielding a median effect size of .57.
Presumably, the so-called passive medium of illustrations and text actually
allowed for active processing because the learners had to mentally animate
the changes from one frame to the next and learners were able to control the
order and pace of their processing. In contrast, the so-called active medium
of animations and narration may foster passive learning because the learners
did not have to mentally animate and could not control the pace and order of
the presentation. In addition, animation may overload the learners’ working
memory because the images are so rich in detail and are so transitory that they
must be held in memory. In contrast, a series of static frames does not impose
extra cognitive load because the learners can always review a previous frame.
In spite of these results, there may be some content that is particularly
suited to animation or video rather than static frames of illustrations or photos,
such as descriptions of how to perform a motor skill. For example, ChanLin
(1998) reported that animation was more effective than static diagrams in
helping students learn to make paper flowers through paper folding. Addition-
ally, animations can serve an interpretive function when designed with special
effects that reveal relationships not otherwise visible. Hegarty (2004) suggests
72 e-Learning and the Science of Instruction
that “dynamic displays can distort reality in various ways, such as slowing down
some processes and speeding up others, showing an object or phenomenon
from different or changing viewpoints, augmenting the display with cues to
draw viewers’ attention to the most relevant parts, or having moving objects
leave a trace or wake” (p. 345). A time-lapse video of seed germination or a
slow-motion video of hummingbirds in flight are two examples of how special
effects can make phenomena visible.
Animations can cost more to develop than static diagrams, so it makes
sense to use a series of static frames as our default graphic. Overall, our rec-
ommendation is to use static illustrations unless there is a compelling instruc-
tional rationale for animation. In particular, when you have an explanative
illustration, we recommend presenting a series of static frames to depict the
various states of the system rather than a lock-step animation.
What We Don’t Know About Visuals
We have good evidence that relevant visuals promote learning. Now it’s time
to find out more about what types of visuals are most effective for differ-
ent learners and instructional goals. Some of the unresolved issues around
graphics include:
A. When is an animation more effective than a static graphic?
B. Most of our research data measures learning immediately after tak-
ing the lesson. We need more information on the effectiveness of
visuals for longer-term learning.
C. Explanatory visuals can be time-consuming to produce and require
an investment in graphic design resources. When are such invest-
ments warranted? What are the cost benefits for creating customized
visuals to illustrate technical content?
D. Do polished color visuals improve learning and motivation more
than simpler formats? Many of the visuals used in experiments are
relatively simple line drawings like the one shown in Figure 3.9.
Some commercial e-learning programs use highly realistic and
detailed visuals, such as the one shown in Figure 3.7. What are the
90.
A p pl y i n g t h e M u l t i m e d i a Pr i n c i p l e 73
tradeoffs in learning and in motivation between simple line draw-
ings and highly polished art? Consistent with earlier research, Ricer,
Filak, and Short (2005) found that medical students showed no dif-
ference in learning or subjective rating of lessons on cancer screen-
ing whether the lesson used static black-and-white figures or slides
containing animated computer-generated graphics. We need more
research on how the surface features of a visual rendering affect
learning and motivation.
D ES I GN D I L E M M A : RES O LVED
In our chapter introduction, you considered the following options for use of graphics
in the database course:
A. Matt is right. Learning will be just as effective from good textual
explanations as from text plus graphics.
B. Ben is right. Adding clip art to a few screens will make the lesson more
interesting.
C. Reshmi is right. Customized visuals, including animations to illustrate the
content, will add appeal and improve learning.
D. Not sure which options are correct.
Based on the evidence we presented in this chapter, we believe that Reshmi is on
the right track. e-Learning is a visual medium and relevant graphics will add appeal
and improve learning. However, animations are not likely to add much value in
this situation. Learning will be as effective with static graphics to illustrate database
concepts. Ben’s idea to add decorative graphics in the form of clip art will most likely
not contribute to learning and, in fact, as we will see in Chapter 7, may even detract
from learning. We recommend that the team engage a graphic designer to create
a few simple but functional visuals to support the lesson concepts—including visuals
that serve organizational, transformational, and interpretive functions. Even if a few
extra days are required, the improvement in instructional quality and appeal is worth
the investment.
91.
74 e-Learning and the Science of Instruction
W H AT T O LO O K F O R I N e - L E A R N I N G
Graphics and text are used to present instructional content.
Graphics are relevant to the instructional purpose, rather than decorative.
Representative graphics are used to illustrate concrete facts, concepts, and
their parts.
Animations are limited and used to illustrate content that cannot as readily
be shown with a series of static visuals.
Organizational graphics are used to show relationships among ideas or les-
son topics or where the parts are located within a whole structure.
Relational graphics are used to show quantitative relationships among
variables.
Transformational graphics, such as a video showing how to operate equip-
ment, are used to show changes over time.
Interpretive graphics, such as a series of static frames, are used to explain
how a system works or to make invisible phenomena visible.
Graphics are used as a lesson interface for case studies.
ON e-LEARNING AND THE SCIENCE OF
INSTRUCTION CD
You can compare the visuals in our example database lesson with our counter-
example. You will notice that in the example version most of the screens include
relevant visuals that illustrate the concepts and steps involved in constructing a
database. In contrast, the counter-example is either missing relevant visuals or uses
decorative visuals that do not contribute to learning.
COMING NEXT
In this chapter we have seen that learning is improved by the use of relevant
graphics combined with words to present instructional content. In the next
chapter, we will build on this principle by examining the contiguity principle
that addresses the best ways to position graphics and related text on the screen.
92.
A p pl y i n g t h e M u l t i m e d i a Pr i n c i p l e 75
Suggested Readings
Clark, R.C., & Lyons, C. (2004). Graphics for learning. San Francisco, CA:
Pfeiffer.
Fletcher, J.D., & Tobias, S. (2005). The multimedia principle. In R.E. Mayer
(Ed.), The Cambridge handbook of multimedia learning (pp. 117–134).
New York: Cambridge University Press.
Mayer, R.E. (1989b). Systematic thinking fostered by illustrations in scien-
tific text. Journal of Educational Psychology, 81, 240–246.
Mayer, R.E., & Anderson, R.B. (1992). The instructive animation: Helping
students build connections between words and pictures in multimedia
learning. Journal of Educational Psychology, 84, 444–452.
Mayer, R.E., & Anderson, R.B. (1991). Animations need narrations: An
experimental test of a dual-processing system in working memory. Journal
of Educational Psychology, 90, 312–320.
Mayer, R.E., & Gallini, J.K. (1990). When is an illustration worth ten thou-
sand words? Journal of Educational Psychology, 88, 64–73.
Mayer, R. E., Hegarty, M., Mayer, S., & Campbell, J. (2005). When static
media promote active learning: Annotated illustrations versus narrated
animations in multimedia instruction. Journal of Experimental Psychology:
Applied, 11, 256–265.
Robinson, D.H. (2002). Spatial text adjuncts and learning. Educational
Psychology Review, 14(1).
93.
CHAPTER OUTLINE
Contiguity Principle1: Place Printed Words Near Corresponding
Graphics
Violations of Contiguity Principle 1
Separation of Text and Graphics on Scrolling Screens
Separation of Feedback from Questions or Responses
Covering Lesson Screens with Linked Windows
Presenting Exercise Directions Separate from the Exercise
Displaying Captions at the Bottom of Screens
Using a Legend to Indicate the Parts of a Graphic
Contiguity Principle 2: Synchronize Spoken Words with Corresponding
Graphics
Violations of Contiguity Principle 2
Separation of Graphics and Narration Through Icons
Separation of Graphics and Narration in a Continuous Presentation
Psychological Reasons for the Contiguity Principle
Evidence for Presenting Printed Words Near Corresponding Graphics
Evidence for Presenting Spoken Words at the Same Time as
Corresponding Graphics
What We Don’t Know About Contiguity
94.
4
Applying the Contiguity
Principle
ALIGNWORDS TO CORRESPONDING GRAPHICS
W H AT ’ S N E W I N T H I S C H A P T E R ?
S OMETIMES IN e-LEARNING that uses on-screen text to explain
graphics, a scrolling screen reveals the text, followed by the graphic fur-
ther down the screen. Alternatively, often a storyboard template will place
all of the text into a box at the bottom of the screen. The result is a physical
separation of the text and the graphic. Alternatively, audio narration may be
presented before or after the graphics it describes. In this chapter we sum-
marize the empirical evidence for learning gains resulting from presenting
text and graphics in an integrated fashion, compared to the same informa-
tion presented separately. The psychological advantage of integrating text and
graphics results from a reduced need to search for which parts of a graphic
77
95.
78 e-Learning and the Science of Instruction
correspond to which words, which allows the user to devote limited cognitive
resources to understanding the materials.
In our new edition, we retain an emphasis on the need to embed printed
words near the graphic they describe—which constitutes contiguity of
printed words and graphics on the screen. A new topic in this chapter focuses
on the benefits of coordinating spoken words and graphics so that the learner
can look at the part of the graphic that is being described by spoken words.
In short, a new form of contiguity involves concurrently listening to spoken
words while viewing the corresponding material in a graphic—which consti-
tutes contiguity of spoken words and graphics in time.
DE S I GN D I L EM M A : YO U DEC IDE
The e-learning design team is reviewing storyboards for their course on design-
ing databases. To accommodate different learning styles, they have decided to
include both text and audio options in the lessons. To apply the multimedia prin-
ciple discussed in Chapter 3, Ben has added some simple but relevant visuals to
illustrate the concepts. For example, to show the value of databases, he plans a
demonstration in which he asks learners to find information in different sections of
a spreadsheet. As shown in Figure 4.1, he gives directions in text on one screen (A)
and asks learners to view the spreadsheet containing the answers on the following
screen (B).
In reviewing the screens, Reshmi feels that the text directions and the visuals
should be on the same screen. “I recall reading an article that mentioned research
proving that it is better to place text close to a relevant graphic,” she comments.
“That’s a good idea in many situations,” Ben replies. “However, we need to make
the graphics large so they can view an entire spreadsheet for this demonstration.
There is no room for the text and the graphic on the same screen!” Based on your
own experience or intuition, which of the following options is best:
A. Ben is right. For visibility, he needs to use most of the screen real estate
for the visual. The text directions should be placed on the preceding
screen.
96.
A p pl y i n g t h e C o n t i g u i t y Pr i n c i p l e 79
Figure 4.1. Ben’s First Draft Storyboards.
The previous owner kept track of all customer
and movie rental information using an Excel
spreadsheet. How difficult would it be for Sally
to find out how many people from the 85479
Zip code rented action movies between February
and April of 2003?
Show Spreadsheet
Screen A
Screen B
B. Reshmi is right. Learning is more efficient when visuals and text are
integrated. The text directions should be placed on the same screen as
the visual
C. Both ideas could be accommodated by placing text directions in a rollover
box on the spreadsheet activated by the mouse.
D. Not sure which option is best.
97.
80 e-Learning and the Science of Instruction
CONTIGUITY PRINCIPLE 1
Place Printed Words Near Corresponding Graphics
The first version of the contiguity principle involves the need to coordi-
nate printed words and graphics. In this chapter, we focus on the idea that
on-screen words should be placed near the parts of the on-screen graph-
ics to which they refer. We recommend that corresponding graphics and
printed words be placed near each other on the screen (that is, contiguous
in space).
In designing or selecting e-learning courseware, consider how on-screen text
is integrated with on-screen graphics. In particular, when printed words refer to
parts of on-screen graphics, make sure the printed words are placed next to the
part of a graphic to which they refer. For example, when the graphic is a diagram
showing the parts of an object, the printed names of the parts should be placed
near the corresponding parts of the diagram, using a pointing line to connect the
name to the part. Similarly, when a lesson presents words that describe actions
(or states) depicted in the series of still frames, make sure that text describing
an action (or state) is placed near the corresponding part of the graphic, using a
pointing line to connect the text with the graphic.
When there is too much text to fit on the screen, the text describing each
action or state can appear as a small pop-up message that appears when the
mouse touches the corresponding portion of the graphic. This technique is
called a mouse-over or rollover. For example, Figure 4.2 shows an application
screen that uses the rollover technique. When learners place their cursors over
different sections of the application screen, a text caption appears that explains
that section. In Figure 4.2 the mouse has rolled over section 1 and the text
window below it appears as long as the mouse remains in that area of the
screen. Rollovers are transient. The text box disappears when the cursor moves
to a different location on the screen.
Violations of Contiguity Principle 1
Violations of the contiguity principle are all too common. The following list
gives some of the most common violations (although there are more) of this
principle that are frequently seen in e-learning courseware:
98.
A p pl y i n g t h e C o n t i g u i t y Pr i n c i p l e 81
Figure 4.2. A Screen Rollover Integrates Text Below Section 1 of Graphic.
From Clark and Lyons, 2004.
• In a scrolling window, graphics and corresponding printed text are
separated, one before the other, and partially obscured because of
scrolling screens.
• Feedback is displayed on a separate screen from the practice or question.
• Links leading to an on-screen reference appear in a second browser
window that covers the related information on the initial screen (that is,
printed text is in one window and graphics are in another window).
• Directions to complete practice exercises are placed on a separate screen
from the application screen in which the directions are to be followed.
• All text is placed at the bottom of the screen away from graphics.
• Key elements in a graphic are numbered, and a legend at the bottom
of the screen includes the name for each numbered element.
Separation of Text and Graphics on Scrolling Screens
Sometimes scrolling screens are poorly designed so that text is presented first
and the visual illustration appears further down the screen, as illustrated in
99.
82 e-Learning and the Science of Instruction
Figure 4.3. Text and Graphic Separated on Scrolling Screen.
Screen A
Screen B
Figure 4.3. As the user scrolls down to view the graphic, the text is no longer
visible and vice versa. This is a common problem we see in many courses that
use scrolling screens to present instructional content. This problem can be
remedied by integrating text and visuals on a scrolling screen, as shown in
Figure 4.4. Alternatively, fixed screen displays can be used when it is impor-
tant to see the text and graphic together. On a fixed screen, the graphic can
fill the screen, and text boxes can be placed over the graphic near the ele-
ment of the screen being described. Another remedy to the scrolling screen
problem is to use text boxes that pop up over graphics when the graphic is
touched by the cursor (as shown in Figure 4.2).
100.
A p pl y i n g t h e C o n t i g u i t y Pr i n c i p l e 83
Figure 4.4. Text and Graphic Visible Together on a Scrolling Screen.
Separation of Feedback from Questions or Responses
Another common violation of the contiguity principle is feedback placed on a
screen separate from the question or from the learner’s answers. This requires
the learner to page back and forth between the question and the feedback, add-
ing cognitive load to learning. For example, in Figure 4.5 from our database
counter-example on the CD, a multiple-select question (not shown) requires
the learner to review the spreadsheet and select appropriate items. When the
learner clicks “done” he or she is routed to Feedback A screen that shows the
correct answer. In order to compare his or her answer with the correct answer,
the learner must page back to the question screen. A better solution is shown
in the Feedback B screen. In this screen, the learner’s answers (in black box)
have been carried over from the question screen and placed next to the correct
answer, allowing a quick and easy comparison without paging back.
Covering Lesson Screens with Linked Windows
The use of links to lead to adjunct information is common in e-learning.
However, when the linked information covers related information on the
primary screen, this practice can create a problem. For example, a link of
101.
84 e-Learning and the Science of Instruction
Figure 4.5. Ineffective (A) and Effective (B) Placement of Feedback.
From the e-Learning and the Science of Instruction CD.
an application screen leads to a window containing a job aid. Having access
to reference material is a good idea for memory support. However, if the
resulting window covers the graphic example that it describes, the contiguity
principle is violated. A better solution is to link to a window that is small,
can be moved around on the main screen, and/or can be printed.
Presenting Exercise Directions Separate from the Exercise
Another common violation of the contiguity principle is presenting exercise
directions in text separated from the screens on which the actions are to
102.
A p pl y i n g t h e C o n t i g u i t y Pr i n c i p l e 85
be taken. For example, in Figure 4.6 we see textual directions for a case study
from an Excel e-learning lesson. When moving to the spreadsheet on the
next screen, the learner no longer has access to the directions. A better alter-
native is to put the step-by-step directions in a box that can be minimized on
the application screen.
Figure 4.6. Separating Exercise Directions from Application Screen Adds
Extraneous Memory Load.
Displaying Captions at the Bottom of Screens
For consistency, many e-learning designs place all text in a box at the bottom
of the screen, such as the frame shown in Figure 4.7A. The problem with this
layout is that the learner needs to scan back and forth between the words at
the bottom of the screen and the part of the graphic they describe. A better
arrangement is to relocate the text closer to the visual as well as to insert lines
to connect the text and visual, as shown in Figure 4.7B.
Using a Legend to Indicate the Parts of a Graphic
Suppose you wanted students to learn about the parts in a piece of equip-
ment. You could show them an illustration in which each equipment part
103.
86 e-Learning and the Science of Instruction
Figure 4.7. Text Placed at Bottom of Screen (A) vs. Next to Visual (B)
(A) (B)
is numbered, and a legend below the illustration describes each one. The
problem with this layout is that the learner must scan between the number
and the legend—which creates wasted cognitive processing. A more efficient
design would place the name and part description in a separate box near the
corresponding part on the visual. The text could be placed in a rollover box
or in a fixed display on the screen.
CONTIGUITY PRINCIPLE 2
Synchronize Spoken Words with
Corresponding Graphics
Another version of the contiguity principle deals with the need to coordinate
spoken words and graphics. In this section, we focus on the idea that spoken
words (narration) that describe an event should play at the same time as the
graphic (animation or video) is depicting the event. In short, we recommend
that corresponding graphics and spoken words be presented at the same time
(that is, contiguous—next to each other—in time).
When e-learning courseware contains narration and corresponding graphics
(animation or video), you should consider how spoken words are integrated
with on-screen graphics. In particular, when spoken words describe actions that
104.
A p pl y i n g t h e C o n t i g u i t y Pr i n c i p l e 87
are depicted in the on-screen graphics, make sure the corresponding spoken
words and graphics are presented at the same time. For example, when the
graphic is an animation showing the steps in a process, the narration describing
a particular step should be presented at the same time that the step is shown
on the screen. When the graphic is a video showing how to perform a task,
the narration describing each step should be presented at the same time as the
action shown on the screen.
Violations of Contiguity Principle 2
Violations of the contiguity principle include the following:
• A link to audio is indicated by one icon and a link to video is indi-
cated by another icon.
• A segment provides a narrated introduction followed by animation
or video.
Separation of Graphics and Narration Through Icons
Suppose you click on “How the Heart Works” in an online encyclopedia, and
two buttons appear—a speaker button indicating that you can listen to a short
narration about the four steps in the heart cycle—and a movie button indicat-
ing that you can watch a short animation, as illustrated in Figure 4.8. You click
on the speaker button and listen to a description of the four steps in the heart
cycle. Then you click on the movie button and watch a narration showing the
four steps in the heart cycle. You might think this is an excellent presentation
because you can select which mode of presentation you prefer. You might like
the idea that you listen to the explanation first and then watch, or vice versa,
thereby giving you two complementary exposures to the same material.
What’s wrong with this situation? The problem is that when a lesson
separates corresponding words and graphics, learners experience a heavier
load on working memory—leaving less capacity for deep learning. Con-
sider the learner’s cognitive processing during learning when a narration is
followed by an animation. After listening to the narration, the learner needs
to hold all the relevant words in working memory and then match up each
segment with the corresponding segment of the animation. However, having
to hold so much information in working memory can be overwhelming, so
105.
88 e-Learning and the Science of Instruction
Figure 4.8. Narration Is Presented Separately from Animation.
How the Heart Works
How the Heart Works How the Heart Works
Narration:
The heart pumps blood
in a 2 cycle process. First,
the ventricles contract…
the learner may not be able to engage in other cognitive processes needed
for deep learning. This is the type of load we called extraneous processing in
Chapter 2. Extraneous processing refers to mental load that does not contrib-
ute to learning. Therefore, we recommend that you avoid e-learning lessons
that present narration and graphics separately.
Separation of Graphics and Narration
in a Continuous Presentation
Even when a lesson presents graphics and narration as a continuous unit, a
lesson may be designed so that an introduction is presented as a brief narra-
tion that is followed by graphics, such as an animation, video, or series of still
frames depicting the same material. For example, consider a multimedia pre-
sentation on “How the Heart Works” that begins with a narrator describing
106.
A p pl y i n g t h e C o n t i g u i t y Pr i n c i p l e 89
the four steps in the heart cycle, followed by four still frames depicting the
four steps in the heart cycle.
At first glance, you might like this arrangement because you get a gen-
eral orientation in words before you inspect a graphic. Yet, like the previous
scenario, this situation can create cognitive overload because the learner has
to mentally hold the words in working memory until the graphic appears—
thereby creating a form of extraneous cognitive processing. To overcome this
problem, we recommend presenting the narration at the same time the static
frames are presented. In this situation, the learner can more easily make men-
tal connections between corresponding words and graphics.
Psychological Reasons for the Contiguity Principle
As we have reviewed in the examples shown in the previous sections, it is
not unusual to see (a) corresponding printed text and graphics physically
separated in e-lessons or (b) corresponding narration and graphics presented
at different times in e-lessons. The physical separation may occur because
of vertical placement of printed text and graphics (one on top of the other),
which separates them when the screen is scrolled, or by placing related infor-
mation on separate fixed screen displays. The temporal separation may occur
because a narrated introduction precedes a graphic or because graphics and
narration are accessed through clicking on different icons.
Some designers separate words and pictures because they haven’t stopped
to think about whether it’s an effective way to present information. Others
reason that presenting the same material in two different places on the page
or at two different times allows learners to choose the format that best suits
their needs or even to experience the same information in two different ways.
We recommend against separating words and pictures, even for environments
with high traffic and low bandwidth, because it is not based on an accurate
understanding of how people learn. Rather than being copy machines that
record incoming information, humans are sense-makers who try to see the
meaningful relations between words and pictures. When words and pictures
are separated from one another on the screen or in time, people must use
their scarce cognitive resources just to match them up. This creates what
107.
90 e-Learning and the Science of Instruction
can be called extraneous processing—cognitive processing that is unrelated to
the instructional goal. When learners use their limited cognitive capacity for
extraneous processing, they have less capacity to use to mentally organize and
integrate the material.
In contrast, when words and pictures are integrated, people can hold
them together in their working memories and therefore make meaningful
connections between them. This act of mentally connecting correspond-
ing words and pictures is an important part of the sense-making process
that leads to meaningful learning. As we saw in Chapter 2, it is in working
memory that the related incoming information is organized and integrated
with existing knowledge in long-term memory. When the learner has to do
the added work of coordinating corresponding words and visual components
that are separated on the screen or in time, the limited capacity of work-
ing memory is taxed—leading to cognitive overload. Ayres and Chandler
(2005) argue that putting corresponding words and pictures far apart from
each other (or presenting them at different times) creates what they call split
attention, which forces the learner to use limited working memory capac-
ity to coordinate the multiple sources of information. You should avoid
instructional designs that cause split attention because they force the learner
to waste precious cognitive processing on trying to coordinate two disparate
sources of information.
Evidence for Presenting Printed Words Near
Corresponding Graphics
Our first recommendation—presenting corresponding printed text and
graphics near each other on the screen—is not only based on cognitive the-
ory, but it is also based on several relevant research studies (Mayer, 1989b;
Mayer, Steinhoff, Bower, & Mars, 1995; Moreno & Mayer, 1999a). In five
different tests involving lessons on lightning formation and how cars’ brak-
ing systems work, learners received printed text and illustrations containing
several frames (or on-screen text with animation). For one group of learn-
ers (integrated group), text was placed near the part of the illustration that
A p pl y i n g t h e C o n t i g u i t y Pr i n c i p l e 93
Evidence for Presenting Spoken Words at the Same
Time as Corresponding Graphics
Our second recommendation—presenting corresponding speech and graphics
at the same time—is also based on research evidence (Mayer & Anderson,
1991, 1992; Mayer & Sims, 1994; Mayer, Moreno, Boire, & Vagge, 1999).
In one experiment, some students (integrated group) viewed a 30-second nar-
rated animation that explained how a bicycle tire pump works, in which the
spoken words described the actions taking place on the screen. For example,
when the narrator’s voice said, “… the inlet valve opens …,” the animation on
the screen showed the inlet valve moving from the closed to the open position.
Other students (separated group) listened to the entire narration and then
watched the entire animation (or vice versa). On a subsequent transfer test, the
integrated group generated 50 percent more solutions than did the separated
group, yielding an effect size greater than 1, which is considered large.
Overall, across eight different experimental comparisons involving pumps,
brakes, lightning, and lungs, students who received integrated presentations
generated 60 percent more solutions on a transfer test than did students
who received a separated presentation. The median effect size across all eight
experiments was 1.30, which is considered a large effect in practical terms.
Figure 4.11 summarizes the results from one such experiment. Research by
Baggett (1984) and Baggett and Ehrenfeucht (1983) shows that learners expe-
rience difficulty in learning from a narrated video, even when corresponding
words and graphics are separated by a few seconds. As you can see, when you
have a narrated animation, narrated video, or even a narrated series of still
frames, there is consistent evidence that people learn best when the words
describing an element or event are spoken at the same time that the anima-
tion (or video or illustration) depicts the element or event on the screen.
What We Don’t Know About Contiguity
Overall, our goal is to reduce the need for learners to engage in extraneous
processing by helping them see the connection between corresponding words
and graphics. Two techniques we explored in this chapter are (1) to present
111.
94 e-Learning and the Science of Instruction
Figure 4.11. Learning Is Better from Integrated Audio and Graphics
Than from Separated Audio and Graphics.
Adapted from Mayer and Anderson, 1991.
100
Percent Correct on Transfer Test
80 Integrated audio and
graphics
60
Separated audio and
graphics
40
20
0
printed words near the part of the graphic they refer to and (2) to present
spoken text at the same time as the portion of graphic they refer to. Some
unresolved issues concern:
A. How much detail should be in the graphics and in the words?
B. When it is better to use printed words and when is it better to use
spoken words?
C. How does the conversational style of the words affect learning?
D. How do characteristics of the voice affect learning with spoken words?
These issues are addressed in Chapters 5, 7, and 8.
DE S I GN D I L E M M A : RES O LVED
Ben and Reshmi are debating the best placement of text in the database lesson.
Some alternatives raised were:
A. Ben is right. For visibility, he needs to use most of the screen real estate for
the visual. The text directions should fall on the preceding screen.
112.
A p pl y i n g t h e C o n t i g u i t y Pr i n c i p l e 95
B. Reshmi is right. Learning is more efficient when visuals and text are inte-
grated. The text directions should be placed on the same screen as the visual.
C. Both ideas could be accommodated by placing text directions in a rollover
box on the spreadsheet activated by the mouse.
D. Not sure which option is best.
We recommend Option B for most situations. Although rollovers can be a useful
way to ensure contiguity between visuals and text, rollovers are transient, with the
information disappearing when the cursor is moved. In the case of text that will be
referred to over time, such as directions for an exercise, a more permanent display
that integrates text and graphic will impose less mental load on learners.
W H AT T O LO O K F O R I N e - L E A R N I N G
Screens that place printed text next to the portion of the graphic it describes
Feedback that appears on the same screen as the question and
responses
Directions that appear on the same screen in which the steps are to be applied
Linked information does not obscure related information on the primary
screen
Text placed next to or within graphics, rather than below them
Legend callouts are embedded within the graphic, rather than separated
from it
Narrated graphics in which corresponding words and graphics are presented
at the same time
ON e-LEARNING AND THE SCIENCE OF
INSTRUCTION CD
Our database counter-example includes a number of violations of contiguity. For example,
on Screen 6, text directions for an exercise require viewing a spreadsheet.
113.
96 e-Learning and the Science of Instruction
However, the learner must click on a button to view the spreadsheet. While viewing the
spreadsheet, the text directions are not visible. A similar break in contiguity is seen on
Screen 17, in which the text describes a table that can only be viewed separately from
the text. On Screen 20, the learner can respond to a multiple-select practice exercise.
The correct answers appear on the next screen, requiring the learners to page back to
compare the correct answers with their responses. These contiguity problems are cor-
rected in the example lesson.
COMING NEXT
In this chapter, we have seen the importance of (a) the on-screen layout of
printed text and graphics and (b) the coordination of corresponding narra-
tion and graphics. Next we will consider the benefits of presenting words
in audio narration rather than in on-screen text. We know that audio adds
considerably to file sizes and requires the use of sound cards and sometimes
headsets. Does the use of audio add anything to learning? In the next chapter
we examine the modality principle, which addresses this issue.
Suggested Readings
Ayres, P., & Sweller, J. (2005). The split-attention principle in multimedia
learning. In R.E. Mayer (Ed.), Cambridge handbook of multimedia learn-
ing (pp. 135–146). New York: Cambridge University Press.
Mayer, R.E. (1989b). Systematic thinking fostered by illustrations in scien-
tific text. Journal of Educational Psychology, 81, 240–246.
Mayer, R.E. (2005b). Principles for reducing extraneous processing in multi-
media learning: Coherence, signaling, redundancy, spatial contiguity, and
temporal contiguity. In R.E. Mayer (Ed.), Cambridge handbook of multi-
media learning (pp. 183–200). New York: Cambridge University Press.
Mayer, R.E., & Anderson, R.B. (1991). Animations need narrations: An
experimental test of a dual-coding hypothesis. Journal of Educational
Psychology, 83, 484–490.
114.
A p pl y i n g t h e C o n t i g u i t y Pr i n c i p l e 97
Mayer, R.E., & Anderson, R.B. (1992). The instructive animation: Helping
students build connections between words and pictures in multimedia
learning. Journal of Educational Psychology, 84, 444–452.
Mayer, R.E., Steinhoff, K., Bower, G.,& Mars, R. (1995). A generative the-
ory of textbook design: Using annotated illustrations to foster meaningful
learning of science text. Educational Technology Research and Development,
43, 31–43.
Moreno, R., & Mayer, R.E. (1999a). Cognitive principles of multimedia
learning: The role of modality and contiguity. Journal of Educational
Psychology, 91, 358–368.
115.
CHAPTER OUTLINE
Modality Principle:Present Words as Speech, Rather Than
On-Screen Text
Limitations to the Modality Principle
Psychological Reasons for the Modality Principle
Evidence for Using Spoken Rather Than Printed Text
Recent Reviews of Research on the Modality Effect
When the Modality Principle Applies
What We Don’t Know About Modality
116.
5
Applying the Modality
Principle
PR E S E N T W O R D S A S A U D I O N A R R AT I O N , R AT H E R
THAN ON-SCREEN TEXT
W H AT ’ S N E W I N T H I S C H A P T E R ?
T HE MODALITY PRINCIPLE has the most research support of any
of the principles described in this book. Technical constraints on the use
of audio in e-learning may lead consumers or designers of e-learning to rely
on text to present content and describe visuals. However, when it’s feasible
to use audio, there is considerable evidence that presenting words in audio,
rather than on-screen text, results in significant learning gains. In this chapter,
we summarize the empirical evidence for learning gains that result from using
audio rather than on-screen text to describe graphics. To moderate this guide-
line, we also describe a number of situations in which memory limitations
99
117.
100 e-Learning and the Science of Instruction
require the use of text rather than audio. The psychological advantage of using
audio results from the incoming information being split across two separate
cognitive channels—words in the auditory channel and pictures in the visual
channel—rather than concentrating both words and pictures in the visual
channel. What is new in this chapter is an update to the evidence reported
in the previous edition, including recent reviews of research on the modal-
ity principle. Overall, there continues to be strong and consistent support
for using narration rather than on-screen text to describe graphics, especially
when the material is complex or is presented at a fast pace.
DE S I GN D I L E M M A : YO U DEC IDE
Now that they have agreed on the value of adding relevant visuals, as described in
Chapter 3, the database design team has bogged down in discussions about how
best to explain those graphics. Reshmi, the instructional designer, believes that
providing words in text, as shown in Figure 5.1, allows learners to move at their
own pace rather than have to wait for audio to play. “Besides that,” she adds, “we
must meet 508 compliance to accommodate learners with hearing loss. We must
provide words in text!” Matt, the project leader, also prefers using text, since file
sizes will be smaller and the team can save time and expense on audio recording.
However, Michael, a graduate student in multimedia learning who is interning from
the local university, disagrees strongly: “In our class last semester, the professor
went on and on about the benefits of audio. You are losing a big learning opportu-
nity if you rely on text alone!” Based on your experience or intuition, which option(s)
do you select:
A. Reshmi and Matt are right. The advantages of explaining on-screen
graphics with text outweigh the disadvantages.
B. Michael is right. Learning is much better when words are presented in
audio narration.
C. Everyone can be accommodated by providing words in both text and
audio.
D. Not sure which options are correct.
118.
A p pl y i n g t h e M o d a l i t y Pr i n c i p l e 101
Figure 5.1. Visual Described by On-Screen Text.
MODALITY PRINCIPLE
Present Words as Speech, Rather Than
On-Screen Text
Suppose you are presenting a verbal explanation along with an animation,
video, or series of still frames. Does it matter whether the words in your
multimedia presentation are represented as printed text (that is, as on-screen
text) or as spoken text (that is, as narration)? What do cognitive theory and
research evidence have to say about the modality of words in multimedia
presentations? You’ll get the answer to these questions in the next few sec-
tions of this chapter.
Based on cognitive theory and research evidence, we recommend that
you put words in spoken form rather than printed form whenever the
graphic (animation, video, or series of static frames) is the focus of the words
and both are presented simultaneously. Thus, we recommend that you avoid
119.
102 e-Learning and the Science of Instruction
e-learning courses that contain crucial multimedia presentations where all
words are in printed rather than spoken form.
The rationale for our recommendation is that learners may experience
an overload of their visual/pictorial channel when they must simultaneously
process graphics and the printed words that refer to them. If their eyes must
attend to the printed words, they cannot fully attend to the animation or
graphics—especially when the words and pictures are presented concurrently
and at a rapid pace. Since being able to attend to relevant words and pictures
is a crucial first step in learning, e-learning courses should be designed to
minimize the chances of overloading learners’ visual/pictorial channel.
Figure 5.2 illustrates a multimedia course delivered on CD-ROM that
effectively applies the modality principle. This section of the lesson is dem-
onstrating how to use a new online telephone management system. As the
Figure 5.2. Audio Explains the Animated Demonstration of the
Telephone System.
Audio: While Bill is talking to Don, Susan calls with a question. Bill knows
that Susan needs to talk to Sally in the Art Department and decides to
transfer her while he is talking to Don.
120.
A p pl y i n g t h e M o d a l i t y Pr i n c i p l e 103
animation illustrates the steps on the computer screen, the audio describes the
actions of the user. Another good example is seen in Figure 5.3 from our data-
base sample lesson on the CD. Audio narration describes the visual illustration
of database table relationships. In both of these examples, the visuals are rela-
tively complex; therefore, using audio allows the learner to focus on the visual
while listening to the explanation.
Figure 5.3. Visual Described by Audio Narration.
Narration: Entity relationship diagrams dictate how the tables in the
database relate to one another. These relationships govern how the
database searches for data when running a query. In our case, a
one-to-many relationship exists between the rentals table and the
customers and movies tables.
Limitations to the Modality Principle
When simultaneously presenting words and the graphics explained by the
words, use spoken rather than printed text as a way of reducing the demands
on visual processing. We recognize that in some cases it may not be prac-
tical to implement the modality principle, because the creation of sound
may involve technical demands that the learning environment cannot meet
(such as bandwidth, sound cards, headsets, and so on). Using sound also may
121.
104 e-Learning and the Science of Instruction
add unreasonable expense or may make it more difficult to update rapidly
changing information. We also recognize that the recommendation is lim-
ited to those situations in which the words and graphics are simultaneously
presented, and thus does not apply when words are presented without any
concurrent picture or other visual input.
Additionally, there are times when the words should remain available to
the learner for memory support. For example, a mathematical formula may
be part of an audio explanation of an animated demonstration, but because
of its complexity, it should remain visible as on-screen text. Key words that
identify the steps of a procedure may be presented by on-screen text and
highlighted (thus used as an organizer) as each step is illustrated in the ani-
mation and discussed in the audio. Another common example involves the
directions to a practice exercise. Thus, we see in Figure 5.4 (from an Excel
virtual classroom session) that the instructor narration throughout most of
the program is suspended when the learner comes to the practice screen.
Instead, the directions to the practice remain in text in the box on the spread-
sheet for reference as the learners complete the exercise.
Figure 5.4. Practice Directions Provided in On-Screen Text in Virtual
Classroom Session.
Operators: Assignment 1
In direct message window, write
Text Directions
.
Format: the formula for February profit per
Start with employee assuming 10
employees.
122.
A p pl y i n g t h e M o d a l i t y Pr i n c i p l e 105
One advantage to virtual classrooms is the use of instructor speech to describe
graphics projected on the whiteboard or through application sharing. In virtual
classroom sessions, participants hear the instructor either through telephone
conferencing or through their computers via voice-over-IP. However, virtual
classroom facilitators should be careful to place text on their slides for instruc-
tional elements such as practice directions, memory support, and technical
terms.
Psychological Reasons for the Modality Principle
If the purpose of the instructional program is to present information as effi-
ciently as possible, then it does not matter whether you present graphics with
printed text or graphics with spoken text. In both cases, identical pictures and
words are presented, so it does not matter whether the words are presented as
printed text or spoken text. This approach to multimedia design is suggested
by the information acquisition view of learning—the idea that the instructor’s
job is to present information and the learner’s job is to acquire information.
Following this view, the rationale for using on-screen text is that it is generally
easier to produce printed text rather than spoken text and that it accomplishes
the same job—that is, it presents the same information.
The trouble with the information acquisition view is that it conflicts with
much of the research evidence concerning how people learn. This book is
based on the idea that the instructional professional’s job is not only to pres-
ent information, but also to present it in a way that is consistent with how
people learn. Thus, we adopt the cognitive theory of multimedia learning,
in which learning depends both on the information that is presented and on
the cognitive processes used by the learner during learning.
Multimedia lessons that present words as on-screen text can conflict
with the way the human mind works. According to the cognitive theory of
learning—which we use as the basis for our recommendations—people have
separate information processing channels for visual/pictorial processing and
for auditory/verbal processing. When learners are given concurrent graphics
and on-screen text, both must be initially processed in the visual/picto-
rial channel. The capacity of each channel is limited, so the graphics and
123.
106 e-Learning and the Science of Instruction
their explanatory on-screen text must compete for the same limited visual
attention. When the eyes are engaged with on-screen text, they cannot simul-
taneously be looking at the graphics; when the eyes are engaged with the
graphics, they cannot be looking at the on-screen text. Thus, even though
the information is presented, learners may not be able to adequately attend
to all of it because their visual channels become overloaded.
In contrast, we can reduce this load on the visual channel by presenting
the verbal explanation as speech. Thus, the verbal material enters the cogni-
tive system through the ears and is processed in the auditory/verbal channel.
At the same time, the graphics enter the cognitive system through the eyes
and are processed in the visual/pictorial channel. In this way neither channel
is overloaded, but both words and pictures are processed.
The case for presenting verbal explanations of graphics as speech is
summarized in Figures 5.5 and 5.6. Figure 5.5 shows how graphics and
on-screen text can overwhelm the visual channel, and Figure 5.6 shows how
graphics and speech can distribute the processing between the visual and
auditory channels. This analysis also explains why the case for presenting
words as speech only applies to situations in which words and pictures are
presented simultaneously. As you can see in Figure 5.5, there would be no
overload in the visual channel if words were presented as on-screen text but
there were no concurrent graphics that required the learner’s simultaneous
attention.
Figure 5.5. Overloading of Visual Channel with Presentation of Written
Text and Graphics.
Adapted from Mayer, 2001a.
Multimedia Memory Systems
Sensory Memory Working Memory
Printed
Phonetic
Words Ears
Processing
Pictures Visual
Eyes
Processing
124.
A p pl y i n g t h e M o d a l i t y Pr i n c i p l e 107
Figure 5.6. Balancing Content Across Visual and Auditory Channels
with Presentation of Narration and Graphics.
Adapted from Mayer, 2001a.
Multimedia Memory Systems
Sensory Memory Working Memory
Spoken
Phonetic
Words Ears
Processing
Pictures Visual
Eyes
Processing
Evidence for Using Spoken Rather Than Printed Text
Do students learn more deeply from graphics with speech (for example, nar-
rated animation) than from graphics with on-screen text (for example, anima-
tion with on-screen text blocks), as suggested by cognitive theory? Researchers
have examined this question in several different ways, and the results consis-
tently support our recommendation. Let’s consider several recent studies that
compare multimedia lessons containing animation with concurrent narration
versus animation with concurrent on-screen text, in which the words in the
narration and on-screen text are identical. Some of the multimedia lessons
present an explanation of how lightning forms, how a car’s braking system
works, or how an electric motor works (Craig, Gholson, & Driscoll, 2002;
Mayer, Dow, & Mayer, 2003; Mayer & Moreno, 1998; Moreno & Mayer,
1999a). Others are embedded in an interactive game intended to teach botany
(Moreno, Mayer, Spires, & Lester, 2001; Moreno & Mayer, 2002b), and a final
set are part of a virtual reality training episode concerning the operation of an
aircraft fuel system (O’Neil, Mayer, Herl, Niemi, Olin, & Thurman, 2000).
For example, in one study (Moreno & Mayer, 1999a), students viewed an
animation depicting the steps in lightning formation along with concurrent nar-
ration (Figure 5.7) or concurrent on-screen text captions (Figure 5.8). The words
in the narration and the on-screen text were identical and they were presented
at the same point in the animation. On a subsequent test in which students had
to solve transfer problems about lightning, the animation-with-narration group
125.
108 e-Learning and the Science of Instruction
Figure 5.7. Screens from Lightning Lesson Explained with Audio
Narration.
From Moreno and Mayer, 1999a.
“The charge results from the collision of the cloud’s “The negatively charged particles fall to the bottom
rising water droplets against heavier, falling pieces of the cloud, and most of the positively charged
of ice.” particles rise to the top.”
“A stepped leader of negative charges moves “A positively charged leader travels up from such
downward in a series of steps. It nears the ground.” objects as trees and buildings.”
“The two leaders generally meet about 165-feet “Negatively charged particles then rush from the
above the ground.” cloud to the ground along the path created by the
leaders. It is not very bright.”
“As the leader stroke nears the ground, it induces an “This upward motion of the current is the return
opposite charge, so positively charged particles stroke. It produces the bright light that people
from the ground rush upward along the same path.” notice as a flash of lightning.”
126.
A p pl y i n g t h e M o d a l i t y Pr i n c i p l e 109
Figure 5.8. Screens from Lightning Lesson Explained with
On-Screen Text.
From Moreno and Mayer, 1999a.
The negatively charged particles fall
The charge results from the collision
to the bottom of the cloud, and most
of the cloud’s rising water droplets
of the positively charged particles
against heavier, falling pieces of ice.
rise to the top.
A stepped leader of negative
A positively charged leader
charges moves downward in a
travels up from such objects
series of steps. It nears the
as trees and buildings.
ground.
Negatively charged particles
The two leaders generally then rush from the cloud to the
meet about 165-feet above ground along the path created
the ground. by the leaders. It is not very
bright.
As the leader stroke nears the
ground, it induces an opposite This upward motion of the
charge, so positively charged current is the return stroke.
particles from the ground rush It produces the bright light
upward along the same path. that people notice as a flash
of lightning.
127.
110 e-Learning and the Science of Instruction
produced more than twice as many solutions to the problems as compared to
the animation-with-text group, yielding an effect size greater than 1. The results
are summarized in Figure 5.9. We refer to this finding as the modality effect—
people learn more deeply from multimedia lessons when words explaining concur-
rent graphics are presented as speech rather than as on-screen text.
Figure 5.9. Better Learning When Visuals Are Explained with Audio
Narration.
From Moreno and Mayer, 1999a.
100
Percent Correct on Transfer Test
80
Graphics
60
Narration
40 Graphics
Onscreen Text
20
0
In a more interactive environment aimed at explaining how an electric motor
works, students could click on various questions and for each see a short
animated answer, along with narration or printed text delivered by a charac-
ter named Dr. Phyz (Mayer, Dow, & Mayer, 2003). In the frame on the right
side of the top screen in Figure 5.10, suppose the student clicks the question,
“What happens when the motor is in the start position?” As a result, the
students in the animation-with-text group see an animation along with on-
screen text, as exemplified in the Response B frame on the bottom right side
of Figure 5.10. In contrast, students in the animation-with-narration group
see the same animation and hear the same words in spoken form as narration,
as in the Response A frame on the bottom left side of Figure 5.10. Students
who received narration generated 29 percent more solutions on a subsequent
problem-solving transfer test, yielding an effect size of .85.
In a related study on the modality effect involving paper-based printed
materials, Mousavi, Low, and Sweller (1995) presented worked-out examples
128.
A p pl y i n g t h e M o d a l i t y Pr i n c i p l e 111
Figure 5.10. Responses to Questions in Audio Narration (A) or in On-Screen Text (B).
From Mayer, Dow, and Mayer, 2003.
Select a Question
Response A Response B
“When the motor is switched on, electronics flow from the
negative terminal of the batter through the yellow wire and
through the red wire to the positive terminal of the battery”
of geometry problems, described with a concurrent oral explanation or
described with the same explanation printed on the page. When the words
were spoken rather than printed, students performed much better on subse-
quent problem-solving tests involving geometry problems.
Recent Reviews of Research on the Modality Effect
In a recent review of research on modality, Mayer ( 2005c) identified
twenty-one experimental comparisons of learning from printed text
and graphics versus learning from narration and graphics, based on published
research articles. The lessons included topics in mathematics, electrical engi-
neering, environmental science, and aircraft maintenance, as well as explana-
tions of how brakes work, how lightning storms develop, and how an electric
129.
112 e-Learning and the Science of Instruction
motor works. In each of the twenty-one comparisons, there was a modality
effect in which students who received narration and graphics performed bet-
ter on solving transfer problems than did students who received on-screen
text and graphics. The median effect size was .97, which is considered a
large effect. Based on the growing evidence for the modality effect, we feel
confident in recommending the use of spoken rather than printed words in
multimedia messages containing graphics with related descriptive words.
In a somewhat more lenient review that included both published arti-
cles and unpublished sources (such as conference papers and theses) and a
variety of learning measures, Ginns (2005) found forty-three experimental
tests of the modality principle. Overall, there was strong evidence for the
modality effect, yielding an average effect size of .72, which is considered
moderate to large. Importantly, the positive effect of auditory modality
was stronger for more complex material than for less complex material,
and for computer-controlled pacing than for learner-controlled pacing.
Apparently, in situations that are more likely to require heavy amounts of
essential cognitive processing to comprehend the material—for example,
lessons with complex material or fast pacing—it is particularly impor-
tant to use instructional designs that minimize the need for extraneous
processing.
When the Modality Principle Applies
Does the modality principle mean that you should never use printed text? The
simple answer to this question is: Of course not. We do not intend for you to
use our recommendations as unbending rules that must be rigidly applied in
all situations. Instead, we encourage you to apply our principles in ways that
are consistent with the way that the human mind works—that is, consistent
with the cognitive theory of multimedia learning rather than the information
delivery theory. As noted earlier, the modality principle applies in situations
in which you present graphics and their verbal commentary at the same time,
and particularly when the material is complex and presented at a rapid con-
tinuous pace. If the material is familiar to the learner or the learner has control
over the pacing of the material, the modality principle becomes less important.
130.
A p pl y i n g t h e M o d a l i t y Pr i n c i p l e 113
As we noted previously, in some cases words should remain available to the
learner over time. When you present technical terms, list key steps in a pro-
cedure, or are giving directions to a practice exercise, it is important to pres-
ent words in writing for reference support. When the learner is not a native
speaker of the language of instruction or is extremely unfamiliar with the
material, it may be appropriate to present printed text. Further, if you present
only printed words on the screen (without any corresponding graphic) then
the modality principle does not apply. Finally, in some situations people may
learn better when you present both printed and spoken words. We describe
these situations in the next chapter on the redundancy principle.
What We Don’t Know About Modality
Overall, our goal in applying the modality principle is to reduce the
cognitive load in the learner’s visual/pictorial channel (through the eyes)
by off-loading some of the cognitive processing onto the auditory/verbal
channel (through the ears). Some unresolved issues concern:
A. When is it helpful to put printed words on the screen with a con-
current graphic?
B. Is it helpful to put concise summaries or labels for key components
on the screen as printed words?
C. When it is not feasible to provide audio, how can we eliminate any
negative effects of on-screen text?
D. Do the negative effects of on-screen text decline over the course of
long-term training?
D ES I GN D I L E M M A : RES O LVED
The database design team was in a quandary about use of text and audio in their
course. The options presented were:
A. Reshmi and Matt are right. There are many advantages to communicating
words as on-screen text.
131.
114 e-Learning and the Science of Instruction
B. Michael is right. Learning is much better when words are presented in
audio narration.
C. Everyone can be accommodated by providing words in both text and audio.
D. Not sure which options are correct.
We recommend that audio narration will promote better learning on screens that
include important and detailed graphics, as shown in Figure 5.3. Therefore we select
Option B. Although Option C might seem like a good compromise, as we will see in
the next chapter, using both text and audio to explain a graphic can be problematic.
Some elements in the database lesson should be presented as text, especially direc-
tions and feedback for practice exercises.
W H AT T O LO O K F O R I N e - L E A R N I N G
Use of audio narration to explain on-screen graphics or animations
Use of text for information that learners will need as reference, such as
technical terms or directions to practice exercises
ON e-LEARNING AND THE SCIENCE OF
INSTRUCTION CD
You will note that in our example lesson, the default option for screens with graphics
is audio. However, practice scenarios, directions, and feedback remain as on-screen
text to allow learners to review these at their own pace. In our counter-example, we
have violated the modality principle by using on-screen text to explain important
visuals, such as the example shown in Figure 5.1.
COMING NEXT
In this chapter we have seen that learning is improved when graphics or
animations presented in e-lessons are explained using audio narration rather
than on-screen text. What would be the impact of including both text and
132.
A p pl y i n g t h e M o d a l i t y Pr i n c i p l e 115
narration? In other words, would learning be improved if narration were
used to read on-screen text? We will address this issue in the next chapter.
Suggested Readings
Ginns, P. (2005). Meta-analysis of the modality effect. Learning and Instruction,
15, 313–331.
Low, R., & Sweller, J. (2005). The modality effect in multimedia learning.
In R.E. Mayer (Ed.), The Cambridge handbook of multimedia learning
(pp. 147–158). New York: Cambridge University Press.
Mayer, R.E. (2005c). Principles for managing essential processing in
multimedia learning: Segmenting, pretraining, and modality principles.
In R.E. Mayer (Ed.), The Cambridge handbook of multimedia learning
(pp. 147–158). New York: Cambridge University Press.
Mayer, R.E., & Moreno, R. (1998). A split-attention effect in multimedia
learning: Evidence for dual processing systems in working memory.
Journal of Educational Psychology, 90, 312–320.
Moreno, R., & Mayer, R.E. (1999a). Cognitive principles of multimedia
learning: The role of modality and contiguity. Journal of Educational
Psychology, 91, 358–368.
Mousavi, S., Low, R., & Sweller, J. (1995). Reducing cognitive load by
mixing auditory and visual presentation modes. Journal of Educational
Psychology, 87, 319–334.
133.
CHAPTER OUTLINE
Redundancy Principle1: Do Not Add On-Screen Text to
Narrated Graphics
Psychological Reasons for the Redundancy Principle
Evidence for Omitting Redundant On-Screen Text
Redundancy Principle 2: Consider Adding On-Screen Text to
Narration in Special Situations
Psychological Reasons for Exceptions to the Redundancy Principle
Evidence for Including Redundant On-Screen Text
What We Don’t Know About Redundancy
134.
6
Applying the Redundancy
Principle
EXPLAIN VISUALS WITH WORDS IN AUDIO
O R T E X T: N O T B O T H
W H AT ’ S N E W I N T H I S C H A P T E R
S OME e-LEARNING DESCRIBES graphics using words in both
on-screen text and audio narration in which the audio repeats the text. We
call this technique redundant on-screen text because the printed text (on-screen
text) is redundant with the spoken text (narration or audio). In this chapter, we
summarize empirical evidence that people learn better from concurrent graph-
ics and audio than from concurrent graphics, audio, and on-screen text. In this
chapter we update research and theory that has appeared since the previous
edition of this book, but the overall message remains the same: In general, do
not add printed text to a narrated graphic. The psychological advantage of pre-
senting words in audio alone is that you avoid overloading the visual channel
117
135.
118 e-Learning and the Science of Instruction
of working memory. There are also certain situations that benefit from the
use of redundant on-screen text. We describe those here as well.
DE S I GN D I L E M M A : YO U DEC IDE
Now that the database e-learning design team has decided to add relevant visu-
als, as described in Chapter 3, their focus is on how best to explain those visuals.
Reshmi, the instructional designer, recommends explaining visuals with a combi-
nation of text and audio: “I’ve reviewed the latest storyboards and I’m concerned.
We know some people have visual learning styles and some are auditory learners
so we need to accommodate both. Also 508 compliance requires us to accommo-
date learners who have visual and hearing deficits, so we have to provide words in
a visual format with on-screen text and also in an auditory format with narration
of that text. That way we cover all our bases!” Figure 6.1 shows one of Reshmi’s
revised storyboards. Charlene, the graphic artist who has been contracted to help
with visuals, protests: “We’ve discussed this issue before and we decided to go with
Figure 6.1. Visual Described by On-Screen Text and Narration.
From e-Learning and the Science of Instruction CD.
Audio: “Entity relationship diagrams dictate how the tables in the database
relate to one another. These relationships govern how the database
searches for data when running a query. In our case, a one-to-many
relationship exists between the rentals table and the customers and
movies tables.”
136.
A p pl y i n g t h e Re d u n d a n c y Pr i n c i p l e 119
audio narration to describe the visuals. I’ve designed large visuals and there is no
screen real estate reserved for lengthy text passages!” Based on your experience or
intuition, which options are best:
A. Communicate words in both on-screen text and audio narration to
accommodate different learning styles and to meet 508 compliance.
B. Explain visuals with audio alone to promote best learning per the
modality principle described in Chapter 5.
C. Let the learner select either audio or text as part of the course introduction.
D. Not sure which options are correct.
REDUNDANC Y PRINCIPLE 1
Do Not Add On-Screen Text to Narrated Graphics
If you are planning a multimedia program consisting of graphics (such as
animation, video, or even static pictures or photos) explained by narration,
should you also include on-screen text that duplicates the audio? We explore
this question in this section.
Based on research and theory in cognitive psychology, we recommend that
you avoid e-learning courses that contain redundant onscreen text presented
at the same time as onscreen graphics and narration. Our reason is that learn-
ers might pay so much attention to the printed words that they pay less atten-
tion to the accompanying graphics. When their eyes are on the printed words,
learners cannot be looking at the on-screen graphics. In addition, learners
may try to compare and reconcile on-screen text and the narration, which
requires cognitive processing extraneous to learning the content. For example,
Figure 6.2 shows a screen from a lesson on ammunition safety that uses video
to illustrate an explosion. Note that the on-screen text is the same as the nar-
ration, so we call it redundant on-screen text. In contrast, Figure 6.3 shows a
screen from an animated demonstration of how to use a new computerized
telephone system. The procedural steps are narrated with audio. Note the
absence of on-screen text that duplicates the narration.
137.
120 e-Learning and the Science of Instruction
Figure 6.2. Graphics Explained Using Identical Text and Audio Narration.
Audio: “This energy is used to do several possible things such as propel
something such as a bullet or an artillery projectile or burst open an
ammunition item containing a chemical filler.”
Figure 6.3. Graphics Explained Using Audio Alone.
Audio: While Bill is talking to Don, Susan calls with a question. Bill knows
that Susan needs to talk to Sally in the Art Department and decides to
transfer her while he is talking to Don.
138.
A p pl y i n g t h e Re d u n d a n c y Pr i n c i p l e 121
Psychological Reasons for the Redundancy Principle
There is a common belief that some people have visual learning styles, while
others have auditory learning styles. Therefore, it seems that words should
always be presented in both spoken and printed form so that learners can
choose the presentation format that best matches their learning preference.
We call this idea the learning styles hypothesis because it plays on the com-
mon sense argument that instruction should be flexible enough to support
different learning styles. Accommodating different learning styles may seem
appealing to e-learning designers who are fed up with the “one-size-fits-all”
approach and to clients who intuitively believe there are visual and auditory
learners.
The learning styles hypothesis is based on the information acquisition
theory of multimedia learning, which holds that learning consists of receiving
information. In our Design Dilemma section, the multimedia lesson illustrated
in Figure 6.1 provides three delivery routes for information—by pictures (in
the illustrations), by spoken words (in the narration), and by written words
(in the on-screen text). In contrast, you could drop the third route and describe
graphics with words in audio, but not with words both in audio and on-screen
text. According to the information acquisition theory, three ways of delivering
the same information is better than two, especially if one or two of the routes do
not work well for some learners. Therefore, the information acquisition theory
predicts that students will learn more deeply from multimedia presentations when
redundant on-screen text is included rather than excluded.
The learning styles view—and the information acquisition theory upon
which it is built—seems to make sense, but let’s look a little deeper. What’s
wrong with the information acquisition theory? Our major criticism is that
it makes unwarranted assumptions about how people learn. For example, it
assumes that people learn by adding information to memory, as if the mind
were an empty vessel that needs to be filled with incoming information. In
contrast, the cognitive theory of multimedia learning is based on the assump-
tions that (a) all people have separate channels for processing verbal and picto-
rial material, (b) each channel is limited in the amount of processing that can
take place at one time, and (c) learners actively attempt to build pictorial and
verbal models from the presented material and build connections between
139.
122 e-Learning and the Science of Instruction
them. These assumptions are consistent with theory and research in cognitive
science and represent a consensus view of how people learn.
According to the cognitive theory of multimedia, adding redundant on-
screen text to a multimedia presentation could overload the visual channel. For
example, Figure 6.4 summarizes the cognitive activities that occur for a presen-
tation containing animation, narration, and concurrent on-screen text. As you
can see, the animation enters the learner’s cognitive system through the eyes
and is processed in the visual/pictorial channel, whereas the narration enters
the learner’s cognitive system through the ears and is processed in the auditory/
verbal channel. However, the on-screen text also enters through the eyes and
must be processed (at least initially) in the visual/pictorial channel. Thus, the
limited cognitive resources in the visual channel must be shared in process-
ing both the animation and the printed text. If the pace of presentation is fast
and learners are unfamiliar with the material, learners may experience cognitive
overload in the visual/pictorial channel. As a result, some important aspects of
the animation may not be selected and organized into a mental representation.
Now consider what happens when only narration and animation are pre-
sented. The animation enters through the eyes and is processed in the visual/
pictorial channel, whereas the narration enters through the ears and is pro-
cessed in the auditory/verbal channel. The chances for overload are minimized,
so the learner is more able to engage in appropriate cognitive processing. Thus,
the cognitive theory of multimedia learning predicts that learners will learn
more deeply from multimedia presentations in which redundant on-screen text
is excluded rather than included.
Figure 6.4. Overloading of Visual Channel with Graphics Explained by
Words in Audio and Written Text.
Adapted from Mayer, 2001a.
Multimedia Memory Systems
Sensory Memory Working Memory
Narration
Phonetic
Ears
Printed Processing
Words
Visual
Pictures Eyes
Processing
140.
A p pl y i n g t h e Re d u n d a n c y Pr i n c i p l e 123
Mayer and Moreno (2003) and Mayer (2005b) describe another poten-
tial problem with adding redundant on-screen text. Learners may waste pre-
cious cognitive resources in trying to compare the printed words with the
spoken words as they are presented. We refer to this wasted cognitive pro-
cessing as extraneous cognitive processing. According to the cognitive theory of
multimedia learning, learners have limited cognitive capacity so, if they use
their cognitive capacity to reconcile printed and spoken text, they can’t use it
to make sense of the presentation.
Evidence for Omitting Redundant On-Screen Text
Several researchers have put these two competing predictions to a test. In
a recent set of studies (Craig, Gholson, & Driscoll, 2002; Mayer, Heiser,
& Lonn, 2001; Moreno & Mayer, 2002a), some students (non-redundant
group) viewed an animation and listened to a concurrent narration explain-
ing the formation of lightning. Other students (redundant group) received
the same multimedia presentation, but with concurrent, redundant on-screen
text. In this series of four comparisons, students in the non-redundant group
produced more solutions (ranging between 43 to 69 percent more) on a
problem-solving transfer test than did students in the redundant group.
The median effect size was greater than 1, which is considered to be large.
Figure 6.5 shows the results from one of these studies.
Figure 6.5. Better Learning When Visuals Are Explained by Audio Alone.
From Moreno and Mayer, 1999a.
100
Percent Correct on Transfer Test
80
Animation with
60 Narration
Animation with
40
Narration and
Redundant Text
20
0
141.
124 e-Learning and the Science of Instruction
Kalyuga, Chandler, and Sweller (1999, 2000) provide complemen-
tary evidence. One group (non-redundant) received training in solder-
ing (that is, techniques for joining metals) through the use of static
diagrams presented on a computer screen along with accompanying
speech, whereas another group (redundant group) received the same
training along with on-screen printed text duplicating the same words
as the audio. On a problem-solving transfer test involving troubleshoot-
ing, the non-redundant group outperformed the redundant group—
producing an effect size of .8 in one study and greater than 1 in another.
More recently, Kalyuga, Chandler, and Sweller (2004) found similar
results in three additional experiments involving technical trainees learn-
ing how to set controls on power machinery for cutting. In this case,
simply presenting the text after presenting the narration resulted in bet-
ter test performance than presenting them at the same time, yielding a
median effect size of .8.
Finally, Moreno and Mayer (2002b) also found a redundancy effect
within the context of an educational computer game, both when played
on a desktop computer and within a virtual reality version using a head-
mounted display. An on-screen agent explained the mechanics of plant
growth using speech or speech and on-screen text while an animation
was presented. Although students who received animation and narration
performed better on subsequent tests than did students who learned
with animation, narration, and on-screen text, the effect sizes were
much smaller—approximately .2, which is considered a small effect.
Perhaps students were better able to ignore some of the on-screen text
in the game environment, although it was still a mild detriment to
learning.
Mayer (2005b) refers to this result as a redundancy effect to reflect the
idea that adding redundant on-screen text to narrated graphics tends to hurt
learning. Overall, these kinds of results support the conclusion that, in some
cases, less is more. Because of the limited capacity of the human information
processing system, it can be better to present less material (graphics with
corresponding narration) than more material (graphics with corresponding
narration and printed text).
142.
A p pl y i n g t h e Re d u n d a n c y Pr i n c i p l e 125
REDUNDANC Y PRINCIPLE 2
Consider Adding On-Screen Text to Narration in
Special Situations
Are there any situations in which e-learning courses would be improved by
adding redundant on-screen text? Although we recommend omitting redun-
dant on-screen text in most e-learning programs, consider using it in special
situations that will not overload the learner’s visual information processing
system, such as when:
• There is no pictorial presentation (for example, when the screen
contains no animation, video, photos, graphics, illustrations, and
so on);
• There is ample opportunity to process the pictorial presentation (for
example, when the on-screen text and corresponding graphics are
presented sequentially or when the pace of presentation is sufficiently
slow); or
• The learner must exert much greater cognitive effort to compre-
hend spoken text than printed text (for example, for learners who
are not native speakers or who have specific learning disabilities, or
when the verbal material is long and complex or contains unfamil-
iar key words).
R E D U N D A N T O N - S C R E E N T E X T: W H E N
TO LOSE IT AND WHEN TO USE IT
Avoid narrating on-screen text when:
Words and pictures are presented simultaneously at a fast pace
Consider narrating on-screen text when:
There are no pictures
The learner has ample time to process the pictures and words
The learner is likely to have difficulty processing spoken words
143.
126 e-Learning and the Science of Instruction
Figure 6.6. When No Visuals Are Present, Content Can Be Presented
with Text and Redundant Narration.
From e-Learning and the Science of Instruction CD.
Audio: At the end of this lesson you will be able to distinguish between records
and fields in a database table, and between parent and child tables in a relational
database. You will be able to use primary and foreign keys to define relationships
between tables and to design a relational database from an existing flat-file
system.
For example, Figure 6.6 is an introductory screen that presents the learning
objectives of a multimedia lesson. Since there are no graphic illustrations,
narration of the objectives presented in text on the screen should not depress
learning. As described in Chapter 5, situations in which learners need to refer
to information over time (such as directions to exercises) are best presented
as text alone.
Psychological Reasons for Exceptions to the
Redundancy Principle
The major exceptions to the redundancy principle occur in special situa-
tions in which on-screen text either does not add to the learner’s processing
demands or actually diminishes them. For example, consider the situation in
144.
A p pl y i n g t h e Re d u n d a n c y Pr i n c i p l e 127
which an instructional presentation consists solely of spoken words with no
graphics—such as in a pod-cast. In this case, information enters through the
ears so the verbal channel is active, but the visual channel is not active. Now,
consider what happens in the learner’s cognitive system when you use redun-
dant on-screen text, for example, presented as text on a computer screen using
the same words as the narration. In this case, spoken words enter through the
ears and text words enter through the eyes, so neither channel is overloaded.
Using dual modes of presentation can be helpful when the spoken material
may be hard to process, or if seeing and hearing the words provides a benefit
(such as learning a technical subject or a foreign language).
Similarly, consider a situation in which the lesson is presented at a slow
pace or is under learner control. For example, presenting concurrent narra-
tion, on-screen text, and static graphics under learner control is less likely to
cause cognitive overload in the visual channel, because the learner has time
to process all of the incoming material. Similarly, printing unfamiliar techni-
cal terms on the screen may actually reduce cognitive processing because the
learner does not need to grapple with decoding the spoken words.
Evidence for Including Redundant On-Screen Text
In the previous section, we summarized research in which people learned less
about the process of lightning formation when the presentation included ani-
mation with redundant on-screen text than when the presentation included
animation with concurrent narration alone. In this section, we explore spe-
cial situations in which adding redundant on-screen text has been shown to
help learning.
Research shows that in certain situations learners generate approxi-
mately three times as many correct answers on a problem-solving transfer
test from presentations containing concurrent spoken and printed text than
from spoken text alone (Moreno & Mayer, 2002a). In these studies, there
were no graphics on the screen and thus the visual system was not overloaded.
In another study, the animation presentation was broken into a series of
sixteen short animation clips, with each clip preceded by a corresponding
sentence. Thus, the learner sees and hears a sentence, then views ten seconds
145.
128 e-Learning and the Science of Instruction
of animation corresponding to it, then sees and hears the next sentence, then
views ten seconds of corresponding animation, and so on. In this way, the
learner can view the animation without any interference from printed text.
In this situation, learners who received redundant on-screen text and spoken
text generated an average of 79 percent more correct answers on a problem-
solving test than learners who received only spoken text (Moreno & Mayer,
2002a). Of course, this choppy sequential presentation is somewhat unusual
and therefore is not likely to be applicable to most e-learning situations.
Based on the research and theory presented in this chapter, we offer the
redundancy principle: When the instructional message includes graphics,
explain the graphics with narration alone. Do not add redundant on-screen
text. When there is limited graphic information on the screen or when the
words are technical or the audience has language difficulties, consider the use
of redundant on-screen text. As described in Chapter 5, use on-screen text
without narration to present information that needs to be referenced over
time, such as directions to complete a practice exercise.
Overall, the theme of this chapter is that e-learning should not add
redundant on-screen text (that is, the same words that are being spoken)
when attending to the text could distract the learner from viewing important
graphics that are being presented at the same time. However, when spoken
text is presented alone (that is, without concurrent graphics), you can help
the learner process the words by providing concurrent printed text.
What We Don’t Know About Redundancy
Research is needed to determine the situations in which the redundancy
principle does not hold—including the kinds of learners, materials, and pre-
sentation methods that do not create a redundancy effect:
• Kinds of learners—Does adding redundant on-screen text to a nar-
rated graphic not hurt (or even help) non-native speakers or learners
with very low prior knowledge?
• Kinds of material—Does adding redundant on-screen text to a nar-
rated graphic not hurt (or even help) when the on-screen material is
technical terms, equations, or brief headings?
146.
A p pl y i n g t h e Re d u n d a n c y Pr i n c i p l e 129
• Kinds of presentation methods—Does adding redundant on-screen text
to a narrated graphic not hurt (or even help) when the presentation
pace is slow, when the presentation pace is under learner control,
when the narration precedes the on-screen text, or when the learner is
given pre-training in names and characteristics of the key concepts?
It would be particularly helpful to pinpoint situations in which some form
of redundancy helps learning.
D ES I GN D I L E M M A : RES OLVED
The database team members disagreed about how best to describe the visuals they
decided to add. To accommodate the modality principle described in Chapter 5,
they decided to use audio. But some team members wanted to also add on-screen
text to accommodate different learning styles and to meet 508 compliance. The
options were:
A. Communicate words in both on-screen text and audio narration to accom-
modate different learning styles and to give multiple learning opportunities.
B. Explain visuals with audio alone to promote best learning, per the
modality principle described in Chapter 5.
C. Let the learner select either audio or text as part of the course introduction.
D. Not sure which options are correct.
It’s a common misconception that learning is better from adding redundant
on-screen text to audio that describes visuals. However, we have reviewed evidence
in this chapter that learning is generally improved by using audio alone to describe
graphics. Therefore we select Option B. However, what about 508 compliance?
We recommend that your e-learning program default to audio describing visuals.
However, to accommodate learners who for various reasons may not be able to
access audio, offer an “audio off” button. When the “audio off” button is activated,
narration is replaced by on-screen text as shown in Figure 6.7. In this arrangement,
the learners receive words in audio narration as the default but can also access
words via text when audio is turned off. However, they do not have the option for
both audio narration and text.
147.
130 e-Learning and the Science of Instruction
Figure 6.7. Visual Explained by On-Screen Text When Audio Off Is
Selected.
From e-Learning and the Science of Instruction CD.
Primary Key Primary Key
Customers Table Movies Table
Customer Movie Movie Movie
ID First Last Address Zip ID Name Genre
001 Alex Jones 123 Wilson St. 85042 001 Under Water Drama
One-to-Many
002 The Flying Circus Action
002 Harriet Smith 478 Glenn Ave. 85043 Relationship
Foreign Key Foreign Key
One-to-Many
Rentals Table
Relationship
Customer Movie Rental Return
ID ID Date Date
002 003 2/11/2002 2/14/2002
002 007 3/20/2001 3/21/2001
Entity relationship diagrams dictate how the tables in the database relate to one another. These
relationships govern how the database searches for data when running a query. In our case, a
"One-to-Many Relationship" exists between the Rentals tables and the Customers and Movies
tables. Let's take a closer look at what this means.
W H AT T O LO O K F O R I N e - L E A R N I N G
Graphics are described by words presented in the form of audio narration,
not by concurrent narration and redundant text.
On-screen text can be narrated when the screens do not include graphics.
When language is challenging, words are presented as text.
ON e-LEARNING AND THE SCIENCE OF
INSTRUCTION CD
In our example lesson, you will see that the default version uses audio to describe
on-screen visuals. However, when you select audio off, on-screen text replaces
the narration. You are unable to access simultaneous on-screen text and audio. In the
counter-example, many screens with graphics violate the redundancy principle by
describing on-screen graphics with both on-screen text and audio narration, such as
the example shown in Figure 6.1.
148.
A p pl y i n g t h e Re d u n d a n c y Pr i n c i p l e 131
COMING NEXT
In the previous four chapters we have described a number of principles for
best use of text, audio, and graphics in e-learning. We have seen that the
appropriate use of these media elements can improve learning. However,
there are circumstances when too much of these elements can actually depress
learning. In the next chapter we review how to apply the coherence principle
to your e-learning decisions.
Suggested Readings
Mayer, R.E. (2005c). Principles for reducing extraneous processing in multi-
media learning: Coherence, signaling, redundancy, spatial contiguity, and
temporal contiguity. In R.E. Mayer (Ed.), The Cambridge handbook of multi-
media learning (pp. 183–200). New York: Cambridge University Press.
Mayer, R.E., Heiser, J., & Lonn, S. (2001). Cognitive constraints on
multimedia learning: When presenting more material results in less
understanding. Journal of Educational Psychology, 93, 187–198.
Moreno, R., & Mayer, R.E. (2002a). Verbal redundancy in multimedia
learning: When reading helps listening. Journal of Educational Psychology,
94, 151–163.
149.
CHAPTER OUTLINE
Coherence Principle1: Avoid e-Lessons with Extraneous Audio
Psychological Reasons to Avoid Extraneous Audio in e-Learning
Evidence for Omitting Extraneous Audio
Coherence Principle 2: Avoid e-Lessons with Extraneous Graphics
Psychological Reasons to Avoid Extraneous Graphics in e-Learning
Evidence for Omitting Extraneous Graphics
Coherence Principle 3: Avoid e-Lessons with Extraneous Words
Psychological Reasons to Avoid Extraneous Words in e-Learning
Evidence for Omitting Extraneous Words Added for Interest
Evidence for Omitting Extraneous Words Added to Expand on Key
Ideas
Evidence for Omitting Extraneous Words Added for Technical Depth
What We Don’t Know About Coherence
150.
7
Applying the Coherence
Principle
AD D I N G I N T E R E S T I N G M AT E R I A L C A N
HURT LEARNING
W H AT ’ S N E W I N T H I S C H A P T E R ?
P ERHAPS OUR SINGLE MOST IMPORTANT recommenda-
tion is to keep the lesson uncluttered. In short, according to the coherence
principle, you should avoid adding any material that does not support the
instructional goal. The coherence principle is important because it is commonly
violated, is straightforward to apply, and can have a strong impact on learn-
ing. Mayer and Moreno (2003) use the term weeding to refer to the need to
uproot any words, graphics, or sounds that are not central to the instructional
goal of the lesson. In spite of our calls for conciseness, you might be tempted
to embellish lessons in an effort to motivate learners. For example, in order to
counter high e-learning dropout rates, some designers attempt to spice up their
133
151.
134 e-Learning and the Science of Instruction
materials by adding entertaining or motivational elements such as dramatic sto-
ries, pictures, or background music. Our advice is: Don’t do it! In this chapter
we summarize the empirical evidence for excluding rather than including
extraneous information in the form of background sound, added text, and
added graphics. What is new in this chapter is some updating of the growing
research base, but the main conclusion remains the same: Adding interesting
but unnecessary material to e-learning can harm the learning process.
DE S I GN D I L E M M A : YO U DEC IDE
“This database lesson is pretty boring. We are dealing with the MTV and video
game generation here. They are used to high-intensity multimedia. But don’t worry!
I’ve added some really important information that everyone should know about
databases and I’ve energized the information with some visual effects. Take a look
at this example. On this screen (Figure 7.1), I’m giving them some key information
about privacy violations resulting from databases.”
Figure 7.1. A Screen to Add Interest to the Database Lesson.
From e-Learning and the Science of Instruction CD.
152.
A p pl y i n g t h e C o h e r e n c e Pr i n c i p l e 135
Ben, the team programmer, has challenged the idea of a simple e-learning pro-
gram—specially for younger learners. Reshmi, the instructional designer, agrees:
“Ben is right. We know that dropout rates from asynchronous e-learning are high.
By adding some interesting information about databases throughout the lesson, we
can hold everyone’s interest. In fact, I learned in an accelerated learning class that
soft background classical music helps people retain information better. Could we
add a soft instrumental to the narration?”
Matt, the project manager, interjects: “How much will the extra visual and audio
effects add to the budget and delay our timeline?” Shouldn’t we just stick to the
basics?” Based on your intuition or experience, which of the following options do
you choose:
A. Ben is correct. Adding some interesting words and visuals about databases
will improve interest and learning, especially among younger learners.
B. Reshmi is correct. Learning is better in the presence of soft music,
especially classical music.
C. Matt is right. Less is more for most learners.
D. Not sure who is correct.
The added sounds, graphics, and words, such as those in Figure 7.1, are
examples of seductive details, interesting but irrelevant material added to a
multimedia presentation in an effort to spice it up (Garner, Gillingham,
& White, 1989). The following three sections explore the merits of adding
extra sounds, pictures, and words that are intended to make multimedia
environments more interesting to the learner.
COHERENCE PRINCIPLE 1
Avoid e-Lessons with Extraneous Audio
First, consider the addition of background music and sounds to a narrated
animation. You can see an example of this type of treatment in our database
counter-example lesson on the CD. Is there any theoretical rationale for add-
ing or not adding music and sounds, and is there any research evidence?
These questions are addressed in this section.
153.
136 e-Learning and the Science of Instruction
Based on the psychology of learning and the research evidence summa-
rized in the following paragraphs, we recommend that you avoid e-learning
courseware that includes extraneous sounds in the form of background
music or environmental sounds. Like all recommendations in this book,
this one is limited. Recommendations should be applied based on an
understanding of how people learn from words and pictures rather than a
blind application of rules in all situations.
Background music and sounds may overload working memory, so they are
most dangerous in situations in which the learner may experience heavy cognitive
load, for example, when the material is unfamiliar, when the material is presented
at a rapid rate, or when the rate of presentation is not under learner control. More
research is needed to determine whether there are some situations in which the
advantages of extraneous sounds outweigh the disadvantages. At this point, our
recommendation is to avoid adding extraneous sounds, especially in situations in
which the learner is likely to experience heavy cognitive processing demands.
For example, Figure 7.2 shows a screen from a military multimedia lesson
on ammunition. As the lesson illustrates the different types of ammunition
Figure 7.2. Sounds of Explosion and Bullets Added to Narration
of On-Screen Text.
154.
A p pl y i n g t h e C o h e r e n c e Pr i n c i p l e 137
that workers may encounter, background sounds such as bullets flying,
bombs exploding, and tanks firing are included. These sounds are extraneous
to the points being presented and are likely to prove distracting. Figure 7.3
shows a screen from the same program that invites the learners to select the
type of background music they want to hear during the course introduction.
Again, the addition of extra sounds in the form of music is likely to depress
learning.
Figure 7.3. Learners Can Select Music During Course Introduction.
Psychological Reasons to Avoid Extraneous
Audio in e-Learning
For some learners, e-learning can seem boring, and you might be concerned
with reports that claim high dropout rates in e-learning (Svetcov, 2000).
Therefore, developers may feel compelled to spice up their materials to
arouse the learner’s interest. Similarly, consumers may feel that a “jazzier”
product is especially important for the new generation of learners raised
on high-intensity multimedia such as MTV and video games. This is the
155.
138 e-Learning and the Science of Instruction
premise underlying arousal theory, the idea that entertaining and interesting
embedded effects cause learners to become more emotionally aroused and
therefore they work harder to learn the material. In short, the premise is
that emotion (for example, arousal caused by emotion-grabbing elements)
affects cognition (for example, higher cognitive engagement). Arousal theory
predicts that students will learn more from multimedia presentations that
contain interesting sounds and music than from multimedia presentations
without interesting sounds and music.
Arousal theory seems to make sense, so is there anything wrong with
it? As early as 1913, Dewey argued that adding interesting adjuncts to an
otherwise boring lesson will not promote deep learning: “When things have
to be made interesting, it is because interest itself is wanting. Moreover, the
phrase is a misnomer. The thing, the object, is no more interesting than
it was before” (pp. 11–12). The theoretical rationale against adding music
and sounds to multimedia presentations is based on the cognitive theory of
multimedia learning, which assumes that working memory capacity is highly
limited. Background sounds can overload and disrupt the cognitive system,
so the narration and the extraneous sounds must compete for limited cogni-
tive resources in the auditory channel. When learners pay attention to sounds
and music, they are less able to pay attention to the narration describing the
relevant steps in the explanation. The cognitive theory of multimedia learn-
ing predicts that students will learn more deeply from multimedia presenta-
tions that do not contain interesting but extraneous sounds and music than
from multimedia presentations that do.
Evidence for Omitting Extraneous Audio
Can we point to any research that examines extraneous sounds in a multi-
media presentation? Moreno and Mayer (2000a) began with a three-minute
narrated animation explaining the process of lightning formation and a forty-
five-second narrated animation explaining how hydraulic braking systems
work. They created a music version of each by adding a musical loop to the
background. The music was an unobtrusive instrumental piece, played at
low volume that did not mask the narration nor make it less perceptually
156.
A p pl y i n g t h e C o h e r e n c e Pr i n c i p l e 139
discernable. Students who received the narrated animation remembered more
of the presented material and scored higher on solving transfer problems than
students who received the same narrated animation along with background
music. The differences were substantial—ranging from 20 to 67 percent bet-
ter scores without music—and consistent for both the lightning and brakes
presentations. Clearly, adding background music did not improve learning,
and in fact, substantially hurt learning.
Moreno and Mayer (2000a) also created a background sound version
of the lightning and brakes presentations by adding environmental sounds.
In the lightning presentation, the environmental sounds included the sound
of a gentle wind (presented when the animation depicted air moving from the
ocean to the land), a clinking sound (when the animation depicted the top
portion of cloud forming ice crystals), and a crackling sound (when the ani-
mation depicted charges traveling between ground and cloud). In the brakes
presentation, the environmental sounds included mechanical noises (when
the animation depicted the piston moving forward in the master cylinder)
and grinding sounds (when the animation depicted the brake shoe press-
ing against the brake drum). On the lightning presentation, students who
received the narrated animation without environmental sounds performed as
well on retention and transfer as students who received the narrated anima-
tion with environmental sounds; on the brakes presentation, students who
received narrated animation performed better on retention and transfer than
students who received the narrated animation with environmental sounds.
For both lightning and brakes presentations, when students received both
background music and environmental sounds, their retention and transfer perfor-
mance was much worse than when students received neither—ranging between
61 to 149 percent better performance without the extraneous sounds and music.
The average percentage gain from all the studies was 105 percent, with a very
high effect size of 1.66. Figure 7.4 shows a result from one of these studies.
Related evidence points to the mental toll that can be levied by extrane-
ous sounds. Kenz and Hugge (2002) compared learning from a seven-page
text read in a quiet environment with learning from reading the same text in
the presence of irrelevant conversational background speech. Recall of text
ideas was significantly better among those reading in a silent environment.
157.
140 e-Learning and the Science of Instruction
Figure 7.4. Learning Is Better When Sounds and Music Are Excluded.
Adapted from Mayer, 2001a.
100
Percent Correct on Transfer Test
Narrated Animation
80
Narrated Animation
60 with Sounds and Music
40
20
0
Ransdell and Gilroy (2001) compared the quality and efficiency of essay
writing in the presence of music (vocal and instrumental) with writing in a
quiet environment. They found that the quality of the essays was similar in
all conditions, but that those working in the presence of music required sig-
nificantly more time. To maintain quality, writers slow down their produc-
tion in the presence of background music. The research team recommends
that: “For all those college students who listen to music while they write on
a computer, the advice from this study is clear. One’s writing fluency is likely
to be disrupted by both vocal and instrumental music” (p. 147).
COHERENCE PRINCIPLE 2
Avoid e-Lessons with Extraneous Graphics
The previous section shows that learning is depressed when we add extrane-
ous sounds to a multimedia presentation, so perhaps we should try another
way to spice up our lessons, namely interspersing interesting video clips. For
example, in the database lesson we could insert some news video discuss-
ing recent database thefts from government agency computers. What is the
learning impact of adding related but not directly relevant pictures and video
clips to e-learning lessons?
158.
A p pl y i n g t h e C o h e r e n c e Pr i n c i p l e 141
Based on what we know about human learning and the evidence we
summarize next, we offer a second version of the coherence principle: Avoid
adding extraneous pictures. This recommendation does not mean that inter-
esting graphics are harmful in all situations. Rather, they are harmful to
the extent that they can interfere with the learner’s attempts to make sense
of the presented material. Extraneous graphics can be distracting and disrup-
tive of the learning process. In reviews of science and mathematics books,
most illustrations were found to be irrelevant to the main theme of the
accompanying lesson (Mayer, 1993; Mayer, Sims, & Tajika, 1995). In short,
when pictures are used only to decorate the page or screen, they are not
likely to improve learning. As an example of irrelevant graphics, Figure 7.5
shows a screen from a lesson on ammunition safety that includes extensive
video about the history of ammunition. Some of the information is quite
interesting but not related to the tasks involved in handling ammunition.
We recommend excluding this type of information.
Figure 7.5. Interesting But Unrelated Historical Information Should Be
Excluded.
159.
142 e-Learning and the Science of Instruction
Psychological Reasons to Avoid Extraneous
Graphics in e-Learning
Pictures—including color photos and action video clips—can make a multi-
media experience more interesting. This assertion flows from arousal theory—
the idea that students learn better when they are emotionally aroused. In this
case, photos or video segments are intended to evoke emotional responses in
learners, which in turn are intended to increase their level of cognitive engage-
ment in the learning task. Thus, pictures and video are emotion-grabbing
devices that make the learner more emotionally aroused, and therefore more
actively involved in learning the presented material. Arousal theory predicts
that adding interesting but extraneous pictures will promote better learning.
What’s wrong with this justification? The problem—outlined in the previ-
ous section—is that interest cannot be added to an otherwise boring lesson
like some kind of seasoning (Dewey, 1913). According to the cognitive theory
of multimedia learning, the learner is actively seeking to make sense of the
presented material. If the learner is successful in building a coherent mental
representation of the presented material, the learner experiences enjoyment.
However, adding extraneous pictures can interfere with the process of sense-
making because learners have a limited cognitive capacity for processing incom-
ing material. According to Harp and Mayer (1998), extraneous pictures (and
their text captions) can interfere with learning in three ways:
• Distraction—by guiding the learner’s limited attention away from the
relevant material and toward the irrelevant material;
• Disruption—by preventing the learner from building appropriate
links among pieces of relevant material because pieces of irrelevant
material are in the way; and
• Seduction—by priming inappropriate existing knowledge (suggested
by the added pictures), which is then used to organize the incoming
content.
Thus, adding interesting but unnecessary material—including sounds, pic-
tures, or words—to e-learning can harm the learning process by prevent-
ing the learner from processing the essential material. The cognitive theory
of multimedia learning, therefore, predicts that students will learn more
160.
A p pl y i n g t h e C o h e r e n c e Pr i n c i p l e 143
deeply from multimedia presentations that do not contain interesting but
extraneous photos, illustrations, or video.
Evidence for Omitting Extraneous Graphics
What happens when entertaining but irrelevant video clips are placed within
a narrated animation? Mayer, Heiser, and Lonn (2001) asked students to
view a three-minute narrated animation on lightning formation, like the one
described in the previous section. For some students, the narrated animation
contained six ten-second video clips intended to make the presentation more
entertaining, yielding a total presentation lasting four minutes. For example,
one video clip showed trees bending against strong winds, lightning striking
into the trees, an ambulance arriving along a path near the trees, and a vic-
tim being carried in a stretcher to the ambulance near a crowd of onlookers.
At the same time, the narrator said: “Statistics show that more people are
injured by lightning each year than by tornadoes and hurricanes combined.”
This video clip and corresponding narration were inserted right after the
narrated animation describing a stepped leader of negative charges moving
toward the ground. Thus, the narrated video was related to the general topic
of lightning strikes but was not intended to help explain the cause-and-effect
chain in lightning formation.
Students who received the lightning presentation without the inserted
video clips performed better on solving transfer problems than students who
received the lightning presentation with inserted video clips—producing
about 30 percent more solutions, which translated into an effect size of .86.
Mayer, Heiser, and Lonn (2001, p. 187) note that this result is an example
of “when presenting more material results in less understanding.”
Harp and Mayer (1997) found a similar pattern of results using a paper-
based medium. Some students were asked to read a 550-word, six-paragraph
passage containing six captioned illustrations. The passage described the cause-
and-effect sequence leading to lightning formation, and the captioned illus-
trations depicted the main steps (with captions that repeated the key events
from the passage). Each illustration was placed to the left of the paragraph it
depicted. Other students read the same illustrated passage, along with six color
pictures intended to spice up the presentation. Each picture was captioned and
161.
144 e-Learning and the Science of Instruction
was placed to the right of a paragraph to which it was related. For example,
next to the paragraph about warm moist air rising, there was a color photo of
an airplane being hit by lightning accompanied by the following text: “Metal
airplanes conduct lightning very well, but they sustain little damage because
the bolt, meeting no resistance, passes right through.” In another section of the
lesson, a photo of a burned uniform from a football player stuck by lightening
was included. Figure 7.6 shows an example of one of these visuals.
Figure 7.6. Interesting But Unrelated Graphics Added to Lightning Lesson.
Adapted from Harp and Mayer, 1998.
When flying through
updrafts, an airplane
ride can become
bumpy. Metal
airplanes conduct
lightning very well,
but they sustain
little damage
because the bolt
passes right
through.
Students who received the lightning passage without added color photos per-
formed better on retention and transfer tests than students who received the
lightning passage with color photos, generating about 52 percent more solu-
tions on the transfer test, which translates into an effect size greater than 1.
This is another example of how adding interesting but irrelevant graphics can
result in less learning from a multimedia presentation. In each of four follow-
up experiments, Harp and Mayer (1998) found that adding interesting but
irrelevant captioned illustrations to the lightning lesson tended to hurt student
performance on subsequent transfer tests, yielding effect sizes greater than 1.
For those who argue that these guidelines won’t apply to the new genera-
tion raised on high-intensity media, we should mention that all of the above
research was conducted with young adults. The subjects in these experiments
were college-aged students ranging in age from eighteen to twenty-two years.
162.
A p pl y i n g t h e C o h e r e n c e Pr i n c i p l e 145
Therefore we cannot agree that members of the younger generation are less
susceptive to mental overload as a result of intensive multimedia exposure.
More recently, Sanchez and Wiley (2006) found that adding irrelevant
illustrations to scientific text hurt learning, particularly for students who
have difficulty in processing information. (For example, if we read a short
list of words to these low-ability learners, they would make mistakes reciting
the words back to us.) Apparently, the low-ability students were more easily
overloaded by the extraneous material. In a follow-up study involving eye
tracking, low-ability students spent more time looking at irrelevant illustra-
tions than did high-working-memory students, indicating that extraneous
graphics can be particularly distracting for learners with low ability. Overall,
it appears that good design principles—such as the coherence principle—are
particularly important for the most at-risk learners.
An important implication of the coherence principle is that illustrations
should not be embellished to make them look more realistic than they need
to be. In some cases simple line drawings can be more effective than detailed
color drawings or photos (Butcher, 2006; Parkhurst & Dwyer, 1983). For
example, Butcher (2006) asked students to study a lesson on the human heart
that contained text and simple illustrations or text and detailed illustrations.
On subsequent tests of understanding of how the heart works, the students
who had learned with text and simple drawings performed better than those who
had learned with text and detailed drawings. During learning, students who stud-
ied text and simple illustrations made more integration inferences—indicating
an attempt to understand how the heart works—than did students who stud-
ied text and complex illustrations. Perhaps studying a simplified visual actually
promotes more mental processing by learners, who will fill in the visual gaps to
understand the meaning of the diagram. This research sounds a cautionary note
to those considering highly realistic learning or simulation interfaces.
COHERENCE PRINCIPLE 3
Avoid e-Lessons with Extraneous Words
So far we have tried and failed twice to improve a narrated animation by add-
ing a few pieces of interesting material, such as sounds or pictures. In this, our
163.
146 e-Learning and the Science of Instruction
third attempt, the database team considers adding some interesting text about
the history of databases, as shown in Figure 7.7. What is the learning impact of
adding extra words to a presentation? We answer this question in this section.
Figure 7.7. Text on History of Databases Added to Lesson.
From e-Learning and the Science of Instruction CD.
Our third version of the coherence principle recommends that you avoid
adding extraneous words to lessons. When the goal is to promote learning of
the target material—such as the workings of a cause-and-effect system—add-
ing interesting but extraneous words may result in poorer learning. Cute
little stories and interesting pieces of trivia may seem like harmless embel-
lishments, but the research reviewed in this chapter shows that such devices
may not produce the intended effects.
This guideline is helpful when limited screen real estate and bandwidth
suggest shorter rather than longer narrations. Rather than fully embellished
textual or narrative descriptions, stick to basic and concise descriptions of
the content. It also helps implement the modality principle effectively. By
keeping the narration on each screen concise, learners won’t become as frus-
trated waiting for lengthy audio segments to play. Figure 7.8 shows a screen
164.
A p pl y i n g t h e C o h e r e n c e Pr i n c i p l e 147
Figure 7.8. Extensive Text Elaborates on Database Concepts.
From e-Learning and the Science of Instruction CD.
To accomplish this, a new field must be added to the table to fuction as the table's Primary Key,
which means that none of the records in this field can ever be duplicated. In this what, each number
present in this field uniquely identifies one and only one customer. A Social Security Number is an
example of a primary key that a government database might use to uniquely identifies U.S. citizens.
Similarly, a primary key must be added to the Movies table as well so that each movie listed can
be uniquely identified. Now, both the Customers table and the Movies table are ready to be
linked (or related) to other tables in the database.
that includes a great deal of text added to provide detailed explanation of
the concept of a primary key in the database lesson. Compare this treatment
with the screen shown in Figure 7.9 that limits words to the essential points
and uses a relevant visual to illustrate the concept.
Figure 7.9 . Lean Text and Relevant Visual Explains Database Concepts.
From e-Learning and the Science of Instruction CD.
165.
148 e-Learning and the Science of Instruction
Psychological Reasons to Avoid Extraneous Words
in e-Learning
For the same reasons that extraneous sounds and graphics can be distracting,
adding extra words can interfere with the learning process. We address three
types of extraneous wording. First, additional words may be added for inter-
est. The extra words are related to the topic but are not relevant to the pri-
mary instructional goal. Second, extra words may be added to expand on the
key ideas of the lesson. A third purpose for extra words is to add technical
details that go beyond the key ideas of the lesson. Subject-matter experts like
to incorporate considerable amounts of technical information that expands
on the basics. We recommend against extraneous words added for interest, for
elaboration, or for technical depth.
Evidence for Omitting Extraneous Words Added
for Interest
Do students learn more deeply from a narrated animation when interest-
ing verbal information is added to the narration? To address this question,
Mayer, Heiser, and Lonn (2001) asked some students to view a three-min-
ute narrated animation about lightning formation, like the one described
in the previous section. Other students viewed the same three-minute pre-
sentation, but with six additional narration segments inserted at various
points. The narration segments were short and fit within the three-minute
presentation at points that otherwise were silent. For example, after saying
that water vapor forms a cloud, the narrator added: “On a warm cloudy
day, swimmers are sitting ducks for lightning.” Similarly, after saying that
electrical charges build in a cloud, the narrator added: “Golfers are vul-
nerable targets because they hold metal clubs, which are excellent conduc-
tors of electrical charge.” Students who received the lightning presentation
without additional narration segments performed better on transfer tests
than students who received the lightning presentation with added narration
segments—generating about 34 percent more solutions on the transfer test,
166.
A p pl y i n g t h e C o h e r e n c e Pr i n c i p l e 149
which translated into an effect size of .66. Again, these results show that
adding interesting but irrelevant material does not help learning, and in this
case even hurts learning.
Evidence for Omitting Extraneous Words Added
to Expand on Key Ideas
In a more extreme version of this research (Mayer, Bove, Bryman, Mars, &
Tapangco, 1996), students read the standard lightning passage like the one
described above (that is, with six hundred words and five captioned illustrations)
or a summary consisting of five captioned illustrations. The captions described
the main steps in the lightning formation, and the corresponding illustrations
depicted the main steps. Approximately eighty words—taken from the standard
passage—were used in the captioned illustrations. In three separate experiments,
students who read the summary performed better on tests of retention and
transfer than students who received the whole passage—in some cases, produc-
ing twice as many steps in the causal chain on the retention test and twice as
many solutions on the transfer test. Figure 7.10 shows results from one of the
experiments in this study. Mayer, Bove, Bryman, Mars, and Tapangco (1996,
p. 64) conclude that this research helps show “when less is more.”
Figure 7.10. Learning Is Better When Non-Essential Text Is Excluded.
Adapted from Mayer, 2001a.
100
Percent Correct on Transfer Test
80
Annotated Illustrations
60
Annotated
40 Illustrations with
Added Text
20
0
167.
150 e-Learning and the Science of Instruction
Evidence for Omitting Extraneous Words Added
for Technical Depth
In a more recent experiment, Mayer and Jackson (2005) compared learning
from a multimedia lesson on how ocean waves work in concise form with
one that included additional technical information. The embellished version
contained additional words and graphics about computational details, such
as how to apply formulas related to ocean waves. The versions with addi-
tional quantitative details depressed performance on a subsequent problem-
solving transfer test focusing on conceptual understanding—yielding effect
sizes of .69 for a computer-based lesson and .97 for a paper-based lesson.
Mayer and Jackson (2005, p. 13) conclude, “The added quantitative details
may have distracted the learner from constructing a qualitative model of the
process of ocean waves.”
In short, when tempted to add more words, ask yourself whether addi-
tional verbiage is really needed to achieve the instructional objectives. If not,
weed out extra words!
What We Don’t Know About Coherence
As you can see in this chapter, there is strong and consistent support for the
coherence effect. In the latest review, Mayer (in press) listed positive results for
eliminating extraneous materials in thirteen out of fourteen experiments, with a
median effect size near 1. In spite of this initial body of useful research evidence,
there is still much we do not know about the coherence principle. Much of the
research reported in this chapter deals with short lessons delivered in a controlled
lab environment. Does the coherence effect also apply to longer-term instruction
presented in an authentic learning environment, such as a training program? It
would be useful to determine whether students can learn to ignore irrelevant
material or whether lessons can be redesigned to highlight relevant material—a
technique that can be called signaling (Mautone & Mayer, 2001; Mayer, 2005b;
Mayer & Moreno, 2003). Signaling includes using headings, bold, italics, under-
lining, capital letters, larger font, color, white space, arrows, and related tech-
niques to draw the learner’s attention to specific parts of the display or page.
Preliminary research (Harp & Mayer, 1997; Mautone & Mayer, 2001) shows
168.
A p pl y i n g t h e C o h e r e n c e Pr i n c i p l e 151
that signaling can improve learning from multimedia lessons, but additional
research is needed.
In addition, we do not know much about how individual characteris-
tics of learners are related to the effectiveness of the coherence principle.
Most of the research reported in this chapter is based on learners who are
novices—that is, who lack prior knowledge in the domain of the lesson. Does
the coherence effect also apply to high-knowledge learners? Research on the
expertise reversal effect (Kalyuga, 2005) suggests that instructional design
techniques that are effective for beginners may not be effective for more expe-
rienced learners. For example, Mayer and Jackson (2005) found that add-
ing computational details hurt learning for beginners, but it is possible that
students who had extensive physics backgrounds might have benefited from
the added material. Similarly, research by Sanchez and Wiley (2006) provides
preliminary evidence that adding irrelevant material can be particularly dam-
aging for lower-ability learners. In short, research is needed to determine for
whom the coherence principle applies.
Finally, you should not interpret the coherence principle to mean that
lessons should be boring. There is ample evidence that students learn better
when they are interested in the material (Hidi & Renninger, 2006). How-
ever, the challenge for instructional professionals is to stimulate interest with-
out adding extraneous material that distracts from the cognitive objective
of the lesson. Is there a way to add interesting words or graphics that serve
to support the instructional goal while at the same time promote interest?
Research is needed on how to interest learners and at the same time be sensi-
tive to limits on their cognitive processing capacity.
D ES I GN D I L E M M A : RES O LVED
In an effort to accommodate younger learners used to high-intensity media, the
database team considered adding interesting visuals, audio, and words to the basic
lesson. The options we considered were:
A. Ben is correct. Adding some interesting words and visuals about databases
will improve interest and learning, especially among younger learners.
169.
152 e-Learning and the Science of Instruction
B. Reshmi is correct. Learning is better in the presence of soft music,
especially classical music.
C. Matt is right. Less is more for most learners.
D. Not sure who is correct.
Based on the evidence presented in this chapter, we vote for Option C. The project
manager will be happy because resources needed to create interesting visuals and
narrations will not be needed, since evidence suggests their effects are deleterious
to learning. Because the evidence for the coherence principle is based on perfor-
mance of college-aged subjects, we reject the generational argument. We suggest
that the team consider other ways to make the lesson engaging, such as using
examples and practice exercises that are relevant to the work tasks that learners
will face on the job and making the benefits of databases explicit in the process.
We recommend that you make a distinction between emotional interest and
cognitive interest. Emotional interest occurs when a multimedia experience evokes
an emotional response in a learner, such as reading a story about a life-threaten-
ing event or seeing a graphic video. There is little evidence that emotion-grabbing
adjuncts—which have been called seductive details—promote deep learning (Gar-
ner, Gillingham, & White, 1989; Renninger, Hidi, & Krapp, 1992). In short, attempts
to force excitement do not guarantee that students will work hard to understand
the presentation. In contrast, cognitive interest occurs when a learner is able to
mentally construct a model that makes sense. As a result of attaining understand-
ing, the learner feels a sense of enjoyment. In summary, understanding leads to
enjoyment. The achievement of cognitive interest depends on active reflection by
the learner, rather than exposure to entertaining but irrelevant sights and sounds.
Overall, the research and theory summarized in this chapter show that designers
should always consider the cognitive consequences of adding interesting sounds,
pictures, or words. In particular, designers should consider whether the proposed
additions could distract, disrupt, or seduce the learner’s process of knowledge
construction.
170.
A p pl y i n g t h e C o h e r e n c e Pr i n c i p l e 153
W H AT T O LO O K F O R I N e – L E A R N I N G
Lessons that do not contain extraneous sounds in the form of background
music or sounds
Lessons that do not use illustrations, photos, and video clips that may
be interesting but are not essential to the knowledge and skills to be
learned
Lessons that do not contain interesting stories or details that are not essential
to the instructional goal
Lessons that present the core content with the minimal amount of words and
graphics needed to help the learner understand the main points.
ON e-LEARNING AND THE SCIENCE
OF INSTRUCTION CD
You will note periodic “Did You Know” screens in the database counter-example lesson.
These screens give related information about databases, as well as include visual
effects. Although related to databases, they are not relevant to the instructional goal.
These screens do not appear in the example lesson. Likewise, soft background music
and gratuitous sound effects added to the counter-example are omitted in the example
lesson version.
COMING NEXT
We have seen in this chapter that sounds, graphics, and textual details added
for interest can depress learning compared to more concise lessons. In the
next chapter on the personalization principle, we ask about the learning
effects of formal versus informal language in e-lessons and preview an area of
emerging research on the use of virtual coaches.
171.
154 e-Learning and the Science of Instruction
Suggested Readings
Avoid Adding Extraneous Sounds
Moreno, R., & Mayer, R.E. (2000). A coherence effect in multimedia learn-
ing: The case for minimizing irrelevant sounds in the design of multimedia
instructional messages. Journal of Educational Psychology, 92, 117–125.
Avoid Adding Extraneous Pictures
Mayer, R.E., Heiser, J., & Lonn, S. (2001). Cognitive constraints on
multimedia learning: When presenting more material results in less
understanding. Journal of Educational Psychology, 93, 187–198.
Avoid Adding Extraneous Words
Harp, S.F., & Mayer, R.E. (1998). How seductive details do their damage:
A theory of cognitive interest in science learning. Journal of Educational
Psychology, 90, 414–434.
Mayer, R.E., Heiser, J., & Lonn, S. (2001). Cognitive constraints on
multimedia learning: When presenting more material results in less
understanding. Journal of Educational Psychology, 93, 187–198.
Renninger, K.A., Hidi, S., & Krapp. A. (Eds.). (1992). The role of interest in
learning and development. Mahwah, NJ: Lawrence Erlbaum.
173.
CHAPTER OUTLINE
Personalization Principle1: Use Conversational Rather Than Formal
Style
Psychological Reasons for the Personalization Principle
Evidence for Using Conversational Style
Promote Personalization Through Voice Quality
Promote Personalization Through Polite Speech
Personalization Principle 2: Use Effective On-Screen Coaches to
Promote Learning
What Are Pedagogical Agents?
Do Agents Improve Student Learning?
Do Agents Need to Look Real?
Do Agents Need to Sound Real?
Personalization Principle 3: Make the Author Visible to Promote
Learning
What Is a Visible Author?
Psychological Reasons for Using a Visible Author
Evidence for the Visible Author
What We Don’t Know About Personalization
174.
8
Applying the Personalization
Principle
US E C O N V E R S AT I O N A L S T Y L E A N D
VIRTUAL COACHES
W H AT ’ S N E W I N T H I S C H A P T E R ?
S OME e-LEARNING LESSONS rely on a formal style of writing to
present information. In this chapter we summarize the empirical evidence
that supports using a conversational style of writing (including using first- and
second-person language). Since the first edition of this book, the research
base for using conversational style has grown, and new evidence has emerged
concerning the role of the speaker’s voice. The personalization principle is
particularly important for the design of pedagogical agents—on-screen char-
acters who help guide the learning processes during an instructional episode.
While research on agents is somewhat new, we present evidence—including
157
175.
158 e-Learning and the Science of Instruction
new evidence since the previous edition—for the learning gains achieved in
the presence of an agent as well as for the most effective ways to design and
use agents. A new topic we’ve added to this edition focuses on what we call
“the visible author.” We will define, give examples, and show evidence for the
benefits of a visible author. The psychological advantage of conversational
style, pedagogical agents, and visible authors is to induce the learner to engage
with the computer as a social conversational partner.
DE S I GN D I L E M M A : YO U DEC IDE
Reshmi has been working on the script for the database lesson. As a former
classroom instructor, she is convinced that a more relaxed instructional environ-
ment leads to better learning. Therefore she is writing in a conversational rather
than a formal style. She also has designed an on-screen coach to guide learn-
ers through the lesson. “The agent adds a personal touch that leads to a more
friendly learning environment,” she claims as she shows her draft storyboard
(Figure 8.1).
Figure 8.1. An Informal Approach Uses an Agent and Conversational
Language.
From e-Learning and the Science of Instruction CD.
176.
A p pl y i n g t h e Pe r s o n a l i z a t i o n P r i n c i p l e 159
Matt, the project manager, has his doubts: “I don’t think Legal is going to
approve of this approach. And neither will the communications department. They
are going to require us to use the official corporate communication standards.
No contractions—no slang! That new VP is pretty traditional. He will think the
character—what did you call it? An agent? Well, anyway, he will think it’s a
cartoon. I suggest for our first e-learning we follow the corporate tradition with
something more like this” (Figure 8.2).
Figure 8.2. A Formal Approach Omits the Agent and Drops First- and
Second-Person Language.
From e-Learning and the Science of Instruction CD.
The database e-learning team is divided over the tone of the lesson, including the
use of an agent. Based on your own experience or intuition, which of the following
options would you select?
A. Reshmi is correct. A more informal approach plus an agent will lead to
better learning.
177.
160 e-Learning and the Science of Instruction
B. Matt is correct. A more formal tone will fit the corporate image better,
leading to a more credible instructional message.
C. The tone of the lesson should be adjusted for the learners. Women will
benefit from more informality and men will find a formal approach more
credible.
D. Not sure which option is correct.
P E R S O N A L I Z AT I O N P R I N C I P L E 1
Use Conversational Rather Than Formal Style
Does it help or hurt to change printed or spoken text from formal style
to conversational style? Would the addition of a friendly on-screen coach
distract from or promote learning? In this chapter, we explore research and
theory that directly address these issues.
Consider the lesson introduction shown in Figure 8.1. As you can see, an
on-screen agent uses an informal conversational style to introduce the lesson.
This approach resembles human-to-human conversation. Of course, learners
know that the character is not really in a conversation with them, but they
may be more likely to act as if the character is a conversational partner. Now,
compare this with the introduction shown in Figure 8.2. Here the overall
feeling is quite impersonal. The agent is gone and the tone is more formal.
Based on cognitive theory and research evidence, we recommend that you
create or select e-learning courses that include some spoken or printed text
that is conversational rather than formal.
Let’s look at a couple of e-learning examples. The screen in Figure 8.3
summarizes the rules for calculating compound interest. Note that the
on-screen text is quite formal. How could this concept be made more
conversational? Figure 8.4 shows a revised version. Rather than pas-
sive voice, it uses second-person active voice and includes a comment about
how this concept relates to the learner’s job. It rephrases and segments the
calculation procedure into four directive steps. The overall result is a more
user-friendly tone.
178.
A p pl y i n g t h e Pe r s o n a l i z a t i o n P r i n c i p l e 161
Figure 8.3. Passive Voice Leads to a Formal Tone in the Lesson.
Clark & Mayer
Calculating Interest
Annual Percentage Yield (APY) Calculation
Interest is compounded or added to the
Overview existing cash balance monthly. For disclosure
on client statements, the annual percentage
Interest yield earned is calculated as follows:
FDIC All interest paid amounts divided by the
Test
average available cash balance for the quarter
divided by the number of actual days in the
quarter multiplied by the actual days in the
year.
Example: $50.00 divided by $20,000 divided
by 91, multiplied by 365 1.00%
Figure 8.4. Use of Second Person and Informal Language Lead to a
Conversational Tone in the Lesson.
Clark & Mayer
Calculating Interest
Annual Percentage Yield (APY) Calculation
Clients will often ask you to explain how the
Annual Percentage Yield on their statement was
Overview calculated. This can be confusing, so let’s run
Interest through an example:
1. Take the interest earned $50.00
FDIC during the quarter
2. Divide it by the average
Test
cash balance in the account $50/$20,000 .0025
3. Divide the answer by the
number of days in the quarter .0025/91 .0000274
4. Multiply by 365 days in year .0000274 365 .01
The APY earned would be 1.00%
179.
162 e-Learning and the Science of Instruction
Psychological Reasons for the Personalization
Principle
Let’s begin with a common sense view that we do not agree with. The ratio-
nale for putting words in formal style is that conversational style can detract
from the seriousness of the message. After all, learners know that the com-
puter cannot speak to them. The goal of a training program is not to build
a relationship, but rather to convey important information. By emphasizing
the personal aspects of the training—by using words like “you” and “I”—you
convey a message that training is not serious. Accordingly, the guiding prin-
ciple is to keep things simple by presenting the basic information.
This argument is based on an information delivery view of learning in
which the instructor’s job is to present information and the learner’s job is
to acquire the information. According to the information delivery view, the
training program should deliver information as efficiently as possible. A for-
mal style meets this criterion better than a conversational style.
Why do we disagree with the call to keep things formal and the informa-
tion delivery view of learning on which it is based? Although the information
delivery view seems like common sense, it is inconsistent with how the human
mind works. According to cognitive theories of learning, humans strive to make
sense of presented material by applying appropriate cognitive processes. Thus,
instruction should not only present information but also prime the appropriate
cognitive processing in the learner. Research on discourse processing shows that
people work harder to understand material when they feel they are in a conversa-
tion with a partner, rather than simply receiving information (Beck, McKeown,
Sandora, Kucan, & Worthy, 1996). Therefore, using conversational style in a
multimedia presentation conveys to the learners the idea that they should work
hard to understand what their conversational partner (in this case, the course
narrator) is saying to them. In short, expressing information in conversational
style can be a way to prime appropriate cognitive processing in the learner.
According to cognitive theories of multimedia communication (Mayer,
2005d), Figure 8.5 shows what happens within the learner when a lesson
contains conversational style and when it does not contain conversational
style. On the top row, you can see that instruction containing social cues
(such as conversational style) activates a sense of social presence in the learner
180.
A p pl y i n g t h e Pe r s o n a l i z a t i o n P r i n c i p l e 163
Figure 8.5. How the Presence or Absence of Social Cues Affects Learning.
How Social Cues Prime Deeper Learning
Increase in Increase in
Instructional
Activation of Active Quality
Message
Social Response Cognitive of Learning
with Social Cues
Processing Outcome
How Lack of Social Cues Does Not Prime Deeper Learning
No Increase No Increase
Instructional
No Activation of in Active in Quality
Message
Social Response Cognitive of Learning
Without Social Cues
Processing Outcome
(a feeling of being in a conversation with the author). The feeling of social
presence, in turn, causes the learner to engage in deeper cognitive processing
during learning (by working harder to understand what the author is saying),
which results in a better learning outcome. In contrast, when an instructional
lesson does not contain social cues, the learner does not feel engaged with the
author and therefore will not work as hard to make sense of the material. The
challenge for instructional processionals is to avoid over-using conversational
style to the point that it becomes distracting to the learner.
Evidence for Using Conversational Style
Although this technique as it applies to e-learning is just beginning to be studied,
there is already preliminary evidence concerning the use of conversational style
in e-learning lessons. In a set of five experimental studies involving a computer-
based educational game on botany, Moreno and Mayer (2000b, 2004) compared
versions in which the words were in formal style with versions in which the
words were in conversational style. For example, Figure 8.6 gives the introduc-
tory script spoken in the computer-based botany game; the top portion shows
the formal version and the bottom shows the personalized version. As you can
see, both versions present the same basic information, but in the personalized
version the computer is talking directly to the learner. In five out of five studies,
students who learned with personalized text performed better on subsequent
transfer tests than students who learned with formal text. Overall, participants
181.
164 e-Learning and the Science of Instruction
Figure 8.6. Formal vs. Informal Lesson Introductions Compared in
Research Study.
From Moreno and Mayer, 2000b.
Formal Version:
“This program is about what type of plants survive on different planets.
For each planet, a plant will be designed. The goal is to learn what type
of roots, stems, and leaves allow the plant to survive in each environment.
Some hints are provided throughout the program.”
Personalized Version:
“You are about to start a journey where you will be visiting different
planets. For each planet, you will need to design a plant. Your mission
is to learn what type of roots, stems, and leaves will allow your plant to
survive in each environment. I will be guiding you through by giving out
some hints.”
in the personalized group produced between 20 to 46 percent more solutions to
transfer problems than the formal group, with effect sizes all above 1. Figure 8.7
shows results from one study where improvement was 46 percent and the effect
size was 1.55, which is considered to be large.
People can also learn better from a narrated animation on lightning
formation when the speech is in conversational style rather than formal style
Figure 8.7. Better Learning from Personalized Narration.
From Moreno and Mayer, 2000b.
Personalized
50
Version
Percent Correct on Transfer Test
40
30
Formal Version
20
10
0
182.
A p pl y i n g t h e Pe r s o n a l i z a t i o n P r i n c i p l e 165
(Moreno & Mayer, 2000b). For example, consider the last sentence in the
lightning lesson: “It produces the bright light that people notice as a flash of
lightning.” To personalize, we can simply change “people” to “you.” In addition
to changes such as this one, Moreno and Mayer (2000b) added direct com-
ments to the learner, such as, “Now that your cloud is charged up, let me tell
you the rest of the story.” Students who received the personalized version of the
lightning lesson performed substantially better on a transfer test than those who
did not, yielding effect sizes greater than 1 across two different experiments.
These results also apply to learning from narrated animations involv-
ing how the human lungs work (Mayer, Fennell, Farmer, & Campbell,
2004). For example, consider the final sentence in the lungs lesson: “Dur-
ing exhaling, the diaphragm moves up, creating less room for the lungs,
air travels through the bronchial tubes and throat to the nose and mouth,
where it leaves the body.” Mayer, Fennell, Farmer, and Campbell (2004)
personalized this sentence by changing “the” to “your” in five places, turn-
ing it into: “During exhaling, your diaphragm moves up, creating less
room for your lungs, air travels through your bronchial tubes and throat
to your nose and mouth, where it leaves your body.” Overall, they created
a personalized script for the lungs lesson by changing “the” to “your” in
eleven places. Across three experiments, this fairly minor change resulted
in improvements on a transfer test yielding a median effect size of .79.
These results should not be taken to mean that personalization is always a
useful idea. There are cases in which personalization can be overdone. For exam-
ple, consider what happens when you add too much personal material, such as,
“Wow, hi dude, I’m here to teach you all about…, so hang onto your hat and
here we go!” The result can be that the advantages of personalization are offset
by the disadvantages of distracting the learner and setting an inappropriate tone
for learning. Thus, in applying the personalization principle it is always useful to
consider the audience and the cognitive consequences of your script—you want
to write with sufficient informality so that the learners feel they are interacting
with a conversational partner, but not so informally that the learner is distracted
or the material is undermined. In fact, implementing the personalization prin-
ciple should create only a subtle change in the lesson; a lot can be accomplished
by using a few first- and second-person pronouns.
183.
166 e-Learning and the Science of Instruction
Promote Personalization Through Voice Quality
Recent research summarized by Reeves and Nass (1996) shows that, under
the right circumstances, people “treat computers like real people.” Part of
treating computers like real people is to try harder to understand their com-
munications. Consistent with this view, Mayer, Sobko, and Mautone (2003)
found that people learned better from a narrated animation on lightning for-
mation when the speaker’s voice was human rather than machine-simulated,
with an effect size of .79. More recently, Atkinson, Mayer, and Merrill (2005)
presented online mathematics lessons in which an on-screen agent named
Peedy the parakeet explained the steps in solving various problems. Across
two experiments, students performed better on a subsequent transfer test
when Peedy spoke in a human voice rather than a machine voice, yielding
effect sizes of .69 and .78. We can refer to these findings as the voice prin-
ciple: People learn better from narration with a human voice than from nar-
ration with a machine voice. Nass and Brave (2005) have provided additional
research showing that characteristics of the speaker’s voice can have a strong
impact on how people respond to computer-based communications.
There is also some preliminary evidence that people learn better from a
human voice with a standard accent rather than a foreign accent (Mayer, Sobko,
& Mautone, 2003), but this work is limited by focusing only on a Russian accent
used over a short presentation. There is also some preliminary evidence that both
men and women prefer to learn from female voices for female-stereotyped sub-
jects such as human relationships and to learn from male voices for male-stereo-
typed subjects such as technology (Nass & Brave, 2005). However, more work is
needed to determine whether the gender of the voice affects learning outcomes.
Promote Personalization Through Polite Speech
A related implication of the personalization principle is that on-screen agents
should be polite. For example, consider an instructional game in which an
on-screen agent gives you feedback. A direct way to put the feedback is for the
agent to say, “Click the ENTER key,” and a more polite wording is, “You may
want to click the ENTER key” or “Do you want to click on the ENTER key?”
or “Let’s click the ENTER key.” A direct statement is, “Now use the quadratic
184.
A p pl y i n g t h e Pe r s o n a l i z a t i o n P r i n c i p l e 167
formula to solve this equation,” and a more polite version is “What about using
the quadratic formula to solve this equation?” or “You could use the quadratic
formula to solve this equation,” or “We should use the quadratic formula to
solve this equation.” According to Brown and Levinson’s (1987) politeness
theory, these alternative wordings help to save face—by allowing the learner to
have some freedom of action or by allowing the learner to work cooperatively
with the agent. Mayer, Johnson, Shaw, and Sandhu (2006) found that students
rated the reworded statements as more polite than the direct statements, indi-
cating that people are sensitive to the politeness tone of feedback statements.
Students who had less experience in working with computers were most sensi-
tive to the politeness tone of the on-screen agent’s feedback statements.
Do polite on-screen agents foster deeper learning than direct agents? A pre-
liminary study by Wang, Johnson, Mayer, Rizzo, Shaw, and Collins (2006) indi-
cates that the answer is yes. Students interacted with an on-screen agent while
learning about industrial engineering by playing an educational game called Vir-
tual Factory. On a subsequent problem-solving transfer test, students who had
learned with a polite agent performed better than those who learned with a direct
agent, yielding an effect size of .70. Overall, there is evidence that student learning
is not only influenced by what on-screen agents say but also by how they say it.
These results have important implications for virtual classroom facilitators.
In many virtual classrooms, only the instructor’s voice is transmitted. The virtual
classroom instructor can apply these guidelines by using polite conversational
language as one tool to maximize the benefits of social presence on learning.
P E R S O N A L I Z AT I O N P R I N C I P L E 2
Use Effective On-Screen Coaches to Promote
Learning
In the previous section, we provided evidence for writing with first- and second-
person language, speaking with a friendly human voice, and using polite word-
ing to establish a conversational tone in your training. In some of the research
described in the previous section, the instructor was an on-screen character who
interacted with the learner. A related new area of research focuses specifically on
the role of on-screen coaches, called pedagogical agents, on learning.
185.
168 e-Learning and the Science of Instruction
What Are Pedagogical Agents?
Personalized speech is an important component in animated pedagogical agents
developed as on-screen tutors in educational programs (Cassell, Sullivan, Prevost,
& Churchill, 2000; Moreno, 2005; Moreno, Mayer, Spires, & Lester, 2001).
Pedagogical agents are on-screen characters who help guide the learning process
during an e-learning episode. Agents can be represented visually as cartoon-like
characters, as talking-head video, or as virtual reality avatars; they can be repre-
sented verbally through machine-simulated voice, human recorded voices, or
printed text. Agents can be representations of real people using video and human
voice or artificial characters using animation and computer-generated voice. Our
major interest in agents concerns their ability to employ sound instructional
techniques that foster learning.
On-screen agents are appearing frequently in e-learning. For example,
Figure 8.8 introduces Jim in a lesson on reading comprehension. Throughout
Figure 8.8. On-Screen Coach Used to Give Reading Comprehension
Demonstrations.
With permission from Plato Learning Systems.
Hey there. I’m Jim and I’m taking
a class to help me prepare for the
GED. Each week my instructor
assigns the class literature to read
and discuss.
Since I have to remember a lot of
stories, I learned how to find
what’s important in each one. I’ll
show you how I do it and then I’ll
give you a strategy for finding
what’s important on your own.
186.
A p pl y i n g t h e Pe r s o n a l i z a t i o n P r i n c i p l e 169
the lesson, Jim demonstrates techniques he uses to understand stories,
followed by exercises that ask learners to apply Jim’s guidelines to compre-
hension of stories.
Figure 8.9 shows a screen from a guided discovery e-learning game called
Design-A-Plant in which the learner travels to a planet with certain envi-
ronmental features (such as low rainfall and heavy winds) and must choose
the roots, stem, and leaves of a plant that could survive there. An animated
pedagogical agent named Herman-the-Bug (in lower left corner of Figure 8.9)
poses the problems, offers feedback, and generally guides the learner through
the game. As you can see in the figure, Herman is a friendly little guy, and
research shows that most learners report liking him (Moreno & Mayer, 2000b;
Moreno, Mayer, Spires, & Lester, 2001).
Figure 8.9. Herman the Bug Used in Design-A-Plant Instructional Game.
From Moreno, Mayer, Spires, and Lester, 2001.
In another program, an animated pedagogical agent is used to teach students
how to solve proportionality word problems (Atkinson, 2002; Atkinson, Mayer,
& Merrill, 2005). In this program, an animated pedagogical agent named Peedy
provides a step-by-step explanation of how to solve each problem. Although
187.
170 e-Learning and the Science of Instruction
Peedy doesn’t move much, he can point to relevant parts of the solution and
make some simple gestures as he guides the students. Peedy and Herman are
among a small collection of agents who have been examined in controlled
research studies.
Computer scientists are doing a fine job of producing life-like agents who
interact well with humans (Cassell, Sullivan, Prevost, & Churchill, 2000).
For example, an on-screen agent named Steve shows students how to operate
and maintain the gas turbine engines aboard naval ships (Rickel & Johnson,
2000); an on-screen agent named Cosmo guides students through the archi-
tecture and operation of the Internet (Lester, Towns, Callaway, Voerman, &
Fitzgerald, 2000); and an on-screen agent named Rea interacts with potential
home buyers, takes them on virtual tours of listed properties, and tries to sell
them a house (Cassell, Sullivan, Prevost, & Churchill, 2000).
In spite of the continuing advances in the development of on-screen
agents, research on their effectiveness is just beginning (Atkinson, 2002;
Moreno & Mayer, 2000b; Moreno, Mayer, Spires, & Lester, 2001). Let’s
look at some important questions about agents in e-learning courses and see
how the preliminary research answers them.
Do Agents Improve Student Learning?
An important primary question is whether adding on-screen agents can have
any positive effects on learning. Even if computer scientists can develop
extremely lifelike agents that are entertaining, is it worth the time and
expense to incorporate them into e-learning courses? In order to answer this
question, researchers began with an agent-based educational game, called
Design-A-Plant, described previously (Moreno, Mayer, Spires, & Lester,
2001). Some students learned by interacting with an on-screen agent named
Herman-the-Bug (agent group), whereas other students learned by reading
the identical words and viewing the identical graphics presented on the
computer screen without the Herman agent (no-agent group). Across two
separate experiments, the agent group generated 24 to 48 percent more
solutions in transfer tests than did the no-agent group.
In a related study (Atkinson, 2002), students learned to solve propor-
tionality word problems by seeing worked-out examples presented via a
188.
A p pl y i n g t h e Pe r s o n a l i z a t i o n P r i n c i p l e 171
computer screen. For some students, an on-screen agent spoke, giving
a step-by-step explanation for the solution (agent group). For other students,
the same explanation was printed as on-screen text without any image or
voice of an agent (no-agent group). On a subsequent transfer test involving
different word problems, the agent group generated 30 percent more correct
solutions than the no-agent group. Although these results are preliminary,
they suggest that it might be worthwhile to consider the role of animated
pedagogical agents as aids to learning.
Do Agents Need to Look Real?
As you may have noticed in the previously described research, there were
many differences between the agent and no-agent groups, so it is reasonable
to ask which of those differences has an effect on student learning. In short,
we want to know what makes an effective agent. Let’s begin by asking about
the looks of the agent, such as whether people learn better from human-
looking agents or cartoon-like agents. To help answer this question, students
learned about botany principles by playing the Design-A-Plant game with
one of two agents—a cartoon-like animated character named Herman-the-
Bug or a talking-head video of a young male who said exactly the same words
as Herman-the-Bug (Moreno, Mayer, Spires, & Lester, 2001). Overall, the
groups did not differ much in their test performance, suggesting that a real
character did not work any better than a cartoon character. In addition,
students learned just as well when the image of the character was present
or absent, as long as the students could hear the agent’s voice. These pre-
liminary results (including similar findings by Craig, Gholson, & Driscoll,
2002) suggest that a lifelike image is not always an essential component in
an effective agent.
Do Agents Need to Sound Real?
Even if the agent may not look real, there is compelling evidence that the
agent has to sound conversational. First, across four comparisons (Moreno,
Mayer, Spires, & Lester, 2001; Moreno & Mayer, 2004), students learned
better in the Design-A-Plant game if Herman’s words were spoken rather
than presented as on-screen text. This finding is an indication that the
189.
172 e-Learning and the Science of Instruction
modality effect (as described in Chapter 5) applies to on-screen agents.
Second, across three comparisons (Moreno & Mayer, 2000b), as reported
in the previous section, students learned better in the Design-A-Plant
game if Herman’s words were spoken in a conversational style rather than
a formal style. This finding is an indication that the personalization effect
applies to on-screen agents. Finally, as reported in the previous section,
Atkinson and colleagues (Atkinson, 2002; Atkinson, Mayer, & Merrill,
2005) found some preliminary evidence that students learn to solve word
problems better from an on-screen agent when the words are spoken in a
human voice rather than a machine-simulated voice. Overall, these pre-
liminary results show that the agent’s voice is an important determinant of
instructional effectiveness.
Although it is premature to make firm recommendations concerning on-
screen pedagogical agents, we are able to offer some suggestions based on
the current state of the field. We suggest that you consider using on-screen
agents, and that the agent’s words be presented as speech rather than text,
in conversational style rather than formal style, and with human-like rather
than machine-like articulation. Although intense work is underway to create
entertaining agents who display human-like gestures and facial expressions,
their educational value is yet to be demonstrated.
We further suggest that you use agents to provide instruction rather than
for entertainment purposes. For example, an agent can explain a step in a
demonstration or provide feedback to a learner’s response to a lesson question.
In contrast, the cartoon general in Figure 8.10 is not an agent, since he is never
used for any instructional purpose. Likewise, there is a common unproduc-
tive tendency to insert theme characters from popular games and movies who
are added only for entertainment value and serve no instructional role. These
embellishments are likely to depress learning, as discussed in Chapter 7.
Based on the cognitive theory and research we have highlighted in this
chapter, we can propose the personalization principles. First, present words
in conversational style rather than formal style. In creating the script for a
narration or the text for an on-screen passage, you should use some first- and
second-person constructions (that is, involving “I,” “we,” “me,” “my,” “you,”
and/or “your”) to create the feeling of conversation between the course and
190.
A p pl y i n g t h e Pe r s o n a l i z a t i o n P r i n c i p l e 173
Figure 8.10. The General Character Plays No Instructional Role So Is
Not an Agent.
the learner. However, you should be careful not to overdo the personalization
style because it is important not to distract the learner. Second, use on-screen
agents to provide coaching in the form of hints, worked examples, demon-
strations, and explanations.
P E R S O N A L I Z AT I O N P R I N C I P L E 3
Make the Author Visible to Promote Learning
What Is a Visible Author?
Instructional text is often written in a formal and impersonal style, in which
the author seems invisible. Invisible authors do not tell you anything about
themselves, whereas visible authors reveal information about themselves and
highlight their personal perspectives (Nolen, 1995; Paxton, 2002). Converting
an invisible author to a visible one can be called giving a voice to the text (Beck,
McKeown, & Worthy. 1995). Take a minute to review the two descriptions
191.
174 e-Learning and the Science of Instruction
of Mayer’s multimedia research shown in Figure 8.11. Sample A is a factual
summary of Mayer’s multimedia research. Sample B discusses similar material
but uses an interview format. In Sample B, Mayer speaks directly to the reader
in a personal style. In Sample B, the author is visible, whereas in Sample A the
author is invisible.
Figure 8.11. Invisible (A) vs. Visible (B) Author in Summaries of Mayer’s
Research.
A. Review of Richard Mayer’s Research by Kiewra and Creswell, 2000
“Another example of Mayer’s systematic approach to writing review
articles is seen in his article ‘Multimedia Learning: Are We Asking the
Right Questions?‘ (Mayer, 1997). Here Mayer reviews research showing that
(a) multimedia delivery systems are better than verbal explanations alone,
(b) instructional methods involving coordinated verbal and visual
explanations are better than explanations separated by time or space
(c) effects are strongest for students with low prior knowledge and high
spatial ability” (p.144)
B. Interview of Richard Mayer by Suomala & Shaughnessy
Q: What are you currently researching?
A: For the past decade, my colleagues and I at Santa Barbara have
been studying multimedia learning. Multimedia learning occurs when
material is presented in more than one format, such as in words and in
pictures. In particular we have been tracking down the conditions under
which multimedia presentations concerning scientific explanations lead
to meaningful, constructivist learning. We have found, for example,
that adding animation to narration improves learners’ understanding, and
we have identified six principles for how to combine visual and verbal
materials (p. 478)
In a statistics lesson on correlation, visible authors might include themselves
in an example (Nolen, 1995, p. 61): “Yet, lest anyone become too hopeful
that correlation represents a magic method for unambiguous identification
of cause, consider the relationship between my age and the price of gasoline
during the past ten years. The correlation is nearly perfect, but no one would
suggest any assignment of cause.” As another example from a history lesson
on the fall of Rome, visible authors might reveal personal beliefs (Paxton,
2002, p. 244): “To those of us looking back at the ancient past, Julius Caesar
192.
A p pl y i n g t h e Pe r s o n a l i z a t i o n P r i n c i p l e 175
remains one of the most controversial figures. I, for one, still have a hard
time determining if he was a great leader, or a terrible dictator. Other histo-
rians have the same problem. Let’s see what you think.” One final example
involves providing transcripts (or video clips) of interviews with famous
scholars, so they can describe their ideas in their own words (Inglese, Mayer,
& Rigotti, in press).
The visible author principle can be applied in both synchronous and
asynchronous forms of e-learning. For example, compare the narration in
the two virtual classroom sessions shown in Figures 8.12 and 8.13. The les-
son topic is branding. Figure 8.12 applies the visible author principle when
the instructor reveals his favorite brand by typing it into the chat window.
In contrast, the instructor in Figure 8.13 describes the concept of branding
without making any personal references.
Figure 8.12. The Instructor Makes Himself Visible by Typing His Favorite
Brand in the Direct Message Window.
Audio: Simply put a brand is a promise. I’d like everyone to type in one of
your favorite brands. I’m typing in mine. Think of a product that you are
committed to – a brand that you will always select due to your confidence…
193.
176 e-Learning and the Science of Instruction
Figure 8.13. The Instructor Remains Invisible to the Learners.
Audio: Simply put a brand is a promise. A brand usually includes a visual
and a name or logo that represents a product. What company is the most
recognized brand in the world? Type in your ideas.
Psychological Reasons for Using a Visible Author
The main rationale for using a visible author style is to promote learner
motivation. For example, Nolen (1995, p. 47) suggests that when authors
are visible, students might see the author as “a personal guide through an
otherwise difficult domain.” Paxton (2002, p. 202) proposes that “a human-
to-human relationship between author and reader is encouraged by the pres-
ence of a visible author.” Consistent with Mayer’s (2005d) extension of the
cognitive theory of multimedia learning shown in Figure 8.5, the visible
author technique can help prime a sense of social presence in the learner—a
feeling of being in a conversation with the author. The activation of social
presence, in turn, encourages the learner to engage in deeper cognitive pro-
cessing during learning, leading to a better learning outcome. The under-
lying rationale for the visible author approach is that people work harder
to understand a lesson when they feel they are in a conversation with the
author. However, the danger of over-emphasis on the author’s self-revealing
194.
A p pl y i n g t h e Pe r s o n a l i z a t i o n P r i n c i p l e 177
remarks is that they can become seductive details, which distract the learner
(and violate the coherence principle described in the previous chapter). Good
instructional design involves adding just the right amount of social cues to
prime a sense of social presence in the learner, without adding so much that
the learner is distracted.
Evidence for the Visible Author
There is some preliminary evidence that using the visible author style can
promote deeper engagement in some learners. Paxton (2002) asked high
school students to read a history lesson that featured an anonymous author
(one who writes in the third person, revealing little about personal beliefs
or self ) or a visible author. On a subsequent essay writing task, students in
the visible author group worked harder—as is indicated by writing longer
essays that showed greater sensitivity to the audience. Inglese, Mayer, and
Rigotti (2007) asked students at an Italian-speaking university to view online
video clips and read online transcripts of various scholars in a course on
political theory. On subsequent tests, non-native speakers wrote more and
provided richer answers concerning visible authors than for scholars whose
theories had been described without any interviews, whereas the effects of
author visibility were not as strong for native speakers. These results suggest
that making authors visible may be particularly effective for students who
might otherwise be losing interest in the course. At this time, there is not
a strong database to support the widespread use of the visible author tech-
nique, but we anticipate more research on this potentially useful technique
in the future.
What We Don’t Know About Personalization
Although personalization can be effective in some situations, additional
research is needed to determine when it becomes counterproductive by
being distracting or condescending. Further work also is needed to deter-
mine conditions—if any—under which the visible author technique can
be effective. Perhaps the most exciting application of the personalization
195.
178 e-Learning and the Science of Instruction
principle involves the design of pedagogical agents, so research is needed to
determine which features of an agent promote learning. In addition, we do
not know whether specific types of learners benefit more than others from
the personalization principle. For example, would there be any differences
between novice and experienced learners, learners who are committed to the
content versus learners who are taking required content, male versus female
learners? Finally, research is needed to determine the long-term effects of
personalization, that is, does the effect of conversational style (or politeness)
diminish as students spend more time with the course?
DE S I GN D I L E M M A : RES OLVED
The database team was debating the tone of their lesson defined by the language
used and by adding a learning agent. The options considered were:
A. Reshmi is correct. A more informal approach plus an agent will lead to
better learning.
B. Matt is correct. A more formal tone will fit the corporate image better,
leading to a more credible instructional message.
C. The tone of the lesson should be adjusted for the learners. Women will
benefit from more informality and men will find a formal approach more
credible.
D. Not sure which option is correct.
Based on the evidence reviewed in this chapter, we would select Option A. Until
we have more research on individual differences in response to the personalization
principle, we cannot make any comment about Option C. We recommend that
Matt make a case to the legal department as well as to communications showing
the evidence for learning benefits from an e-learning environment in which social
presence is heightened through the use of second-person constructions and an on-
screen agent who guides the learning process.
196.
A p pl y i n g t h e Pe r s o n a l i z a t i o n P r i n c i p l e 179
W H AT T O LO O K F O R I N e - L E A R N I N G
Instructional content is presented in conversational language using
“you,” “your,” “I,” “our,” and “we.”
Coaching is provided via conversational narration from on-screen
characters (pedagogical agents).
Agents do not need to look realistic.
Agent dialog is presented via audio narration.
Voice quality and script are natural and conversational.
Agents serve a valid instructional purpose.
The course author expresses his or her own point of view or experience
in ways that are relevant to the instructional goals
ON e-LEARNING AND THE SCIENCE
OF INSTRUCTION CD
As you compare the example and counter-example, you will immediately
notice the absence of the on-screen agent in the counter-example. You will
also see that in the counter-example, most second-person constructions have
been dropped in favor of more formal language.
COMING NEXT
The next chapter on segmenting and pretraining completes the basic set
of multimedia principles in e-learning. These principles apply to training
produced to inform as well as to increase performance; in other words they
apply to all forms of e-learning. After reading the next chapter, you will have
topped off your arsenal of basic multimedia instructional design principles
described in Chapters 3 through 9.
197.
180 e-Learning and the Science of Instruction
Suggested Readings
Mayer, R.E. (2005). Principles based on social cues: Personalization, voice,
and image principles. In R.E. Mayer (Ed.), The Cambridge handbook of
multimedia learning (pp. 201–212). New York: Cambridge University
Press.
Mayer, R.E., Sobko, K., & Mautone, P.D. (2003). Social cues in multimedia
learning: Role of speaker’s voice. Journal of Educational Psychology, 95,
419–425.
Moreno, R., & Mayer, R.E. (2000). Engaging students in active learning:
The case for personalized multimedia messages. Journal of Educational
Psychology, 93, 724–733.
Moreno, R., & Mayer, R.E. (2004). Personalized messages that promote sci-
ence learning in virtual environments. Journal of Educational Psychology,
96, 165–173.
Moreno, R., Mayer, R.E., Spires, H., & Lester, J. (2001). The case for social
agency in computer-based teaching: Do students learn more deeply when
they interact with animated pedagogical agents? Cognition and Instruc-
tion, 19, 177–214.
Nass, C., & Brave, S. (2005). Wired for speech: How voice activates and
advances the human–computer relationship. Cambridge, MA: MIT Press.
Reeves, B., & Nass, C. (1996). The media equation: How people treat com-
puters, television, and new media like real people and places. New York:
Cambridge University Press.
199.
CHAPTER OUTLINE
Segmenting Principle:Break a Continuous Lesson into Bite-Size
Segments
Psychological Reasons for the Segmenting Principle
Evidence for Breaking a Continuous Lesson into Bite-Size Segments
Pretraining Principle: Ensure That Learners Know the Names and
Characteristics of Key Concepts
Psychological Reasons for the Pretraining Principle
Evidence for Providing Pretraining in Key Concepts
What We Don’t Know About Segmenting and Pretraining
200.
9
Applying the Segmenting
andPretraining Principles
MANAGING COMPLEXITY BY BREAKING
A L E S S O N I N T O PA R T S
W H AT ’ S N E W I N T H I S C H A P T E R ?
I N SOME OF THE PREVIOUS CHAPTERS, you learned how
to reduce extraneous processing (processing caused by poor instructional
design) by eliminating extraneous words and pictures (Chapter 7), by plac-
ing corresponding words and illustrations near each other on the screen
(Chapter 4), or by refraining from adding redundant on-screen text to a
narrated animation (Chapter 6). In Chapter 2, we introduced the concept
of essential cognitive processing that results from the complexity of the mate-
rial. In this chapter we focus on situations in which learners must engage in
so much essential processing that their cognitive systems are overwhelmed.
In particular, in this chapter we focus on techniques for managing essential
183
201.
184 e-Learning and the Science of Instruction
processing, including segmenting (breaking a lesson into manageable seg-
ments) and pretraining (providing pretraining in the names and charac-
teristics of key concepts). This chapter is a new addition to the book and
represents the small but growing research base in techniques for managing
the learning of complex material.
DE S I GN D I L E M M A : YO U DEC IDE
The database lesson team is working on their lesson design. They have completed
their job analysis and identified five key steps involved in designing a relational
database. Sergio, the subject-matter expert, offers the team an outline. “Here,”
he says, “let me save you some time. This is the outline I use when I teach in the
classroom. (See Sergio’s outline in Figure 9.1.) It works really well because I teach
one step at a time.” “Thanks, Serg, it really helps to have the content broken out,”
Reshmi replies. “But after I reviewed our job analysis, I came up with a slightly dif-
ferent sequence. Take a look.” (See Reshmi’s outline in Figure 9.1.). After reading
Reshmi’s outline, Sergio reacts: “Wow, Reshmi! I think your outline is confusing.
My plan places all of the key concepts with each step. That way they learn each
concept in the context in which they will use it! We can use that new screen capture
tool to run my slides continuously while the narration plays.” Reshmi is not con-
vinced by Sergio’s argument: “Yes, but your plan lumps a lot of content together.
Figure 9.1. Two Organizational Sequences for the Database Lesson.
Sergio’s Outline Reshmi’s Outline
I. Introduction I. Introduction
II. Step 1 – Select Important Entities II. What Are Entities and Tables?
A. What are entities? III. Table Construction
III. Step 2 – Determine Key Characteristics I. Fields and records
A. What are key characteristics? IV. Parent and Child Tables
IV. Step 3 – Assign Primary Keys I. Primary and foreign keys
A. What are primary keys? V. Entity Relationship Diagrams
V. Step 4 – Assign Foreign Keys VI. Steps to Design a Relational
A. What are foreign keys? Database
VI. Step 5 – Designate Table Relationships
A. What are entity-relationship
diagrams?
202.
A p pl y i n g t h e S e g m e n t i n g a n d Pr e t r a i n i n g Pr i n c i p l e s 185
I think it will overwhelm people new to databases; and our learners will be new to
databases.”
Sergio and Reshmi disagree about the sequence of content as well as its display.
Based on your own experience or intuition, which of the following options would you
select?
A. Sergio’s plan is better because it teaches all content in context of the
procedure.
B. Reshmi’s plan is better because she has separated the key concepts from
the procedure.
C. It is better to let the lesson “play” like a video so learners receive a con-
tinuous picture of the entire procedure.
D. It is better to let the learners control the sequence by selecting screens in
small bites so they can work at their own rates.
E. Not sure which options are correct.
SEGMENTING PRINCIPLE
Break a Continuous Lesson into Bite-Size Segments
How can you tell that material is so complex that it will overload the learner’s
cognitive system? A good way to gauge the complexity of a lesson is to tally
the number of elements (or concepts) and the number of interactions between
them. For example, consider a narrated animation on how a bicycle tire pump
works that has the script: “When the handle is pulled up, the piston moves
up, the inlet valve opens, the outlet valve closes, and air enters the cylinder.
When the handle is pushed down, the piston moves down, the inlet valve
closes, the outlet valve opens, and air exits from the cylinder through the
hose.” In this case there are five main elements—handle, piston, cylinder,
inlet valve, and outlet valve. The relations among them constitute a simple
chain in which a change in one element causes a change in the next element,
and so on. Overall, this is a fairly simple lesson that probably requires just two
segments—one showing what happens when the handle is pulled up and one
showing what happens when the handle is pushed down.
203.
186 e-Learning and the Science of Instruction
Next, consider a lesson on lightning formation, such as shown in
Figure 9.2. This is a much more complex lesson because it has many more
elements—warm and cold air, updrafts and downdrafts, positive and negative
particles in the cloud, positive and negative particles on the ground, leaders,
and so on. This lesson can be broken into sixteen segments, each describing
one or two major steps in the causal chain, such as, “Cool moist air moves
over a warmer surface and becomes heated.” Each of the frames shown in
Figure 9.2 constitutes a segment—involving just a few elements and relations
between them.
As training professionals, you have probably worked with content that
was relatively simple as well as with content that was more complex. For
example, if you are teaching a class on editing text in MSWord, you need to
teach a four-step procedure. First the learner must use the mouse to select the
text to edit. Second he or she must click on the scissors icon to cut the text
from its present location. These first two steps are illustrated in Figure 9.3.
Next the writer places the cursor at the insertion point and clicks on the
paste icon. This software procedure is quite linear and relatively simple. It
is made easier by having only a few steps and by using on-screen icons that
call up familiar metaphors such as scissors for cutting. However, in many
cases, your content is more complex than this example. Even an introductory
Excel class offers greater degrees of complexity. As you can see in Figure 9.4,
constructing a formula in Excel can be quite complex for someone new to
spreadsheets and to Excel. One of the key concepts involves the construc-
tion of a formula that uses the correct formatting conventions to achieve the
desired calculation. For someone new to Excel, we would rate this as a more
complex task than the word processing editing task.
When the material is complex, you can’t make it simpler by leaving out
some of the elements or steps in the explanation, because that would destroy
the accuracy of the lesson. However, you can help the learner manage the
complexity by breaking the lesson into manageable segments—parts that
convey just one or two or three steps in the process or procedure or describe
just one or two or three major relations among the elements. We recommend
that you break a complex lesson into smaller parts, which are presented one
at a time. We call this recommendation the segmenting principle.
188 e-Learning and the Science of Instruction
Figure 9.3. Cutting and Pasting Text in MSWord Is a Simple Task.
2. Click on the
scissors icon
1. Select text to be moved
by dragging mouse
over text (left click)
Figure 9.4. Constructing a Formula in Excel Is a Complex Task.
2. Type the correct formula*
into the cell. It will
appear here in the formula
area.
1. Click on the
cell where you * Formulas:
want the answer • Begin with an sign
• Use cell references to
3. Click on the designate the numbers to be used
enter key to get the • Use operators to indicate the operations:
answer • for add * for multiply
• for subtract / for divide
190 e-Learning and the Science of Instruction
the segments. As you can see, the learner receives a short clip approximately ten
seconds in length, along with one sentence describing the actions that are depicted.
The learner can completely digest this link in the causal chain before clicking
on the “Continue” button to go on to the next segment. This technique—which
can be called segmenting—allows the learner to manage essential processing. Thus,
the rationale for using segmenting is that it allows the learner to engage essential
processing without overloading the learner’s cognitive system.
Evidence for Breaking a Continuous Lesson into
Bite-Size Segments
The previous section tells a nice story, but is there any evidence that segment-
ing helps people learn better? The answer is yes. Mayer and Chandler (2001)
carried out the study described in the previous section. They found that learn-
ers who received the segmented presentation on lightning formation performed
better on transfer tests than the learners who received a continuous presenta-
tion, even though identical material was presented in both conditions.
In another set of studies (Mayer, Dow, & Mayer, 2003), students learned
how an electric motor works by watching a continuous narrated animation or
by watching a segmented version. In the segmented version, the learner could
click on a question and then see part of the narrated animation, click on another
question and see the next part, and so on. The material was identical for both
the continuous and segmented versions, but learners performed much better on
transfer tests if they had received the segmented lesson. Overall, in three out of
three studies the results provided strong positive effects for segmenting, yielding
a median effect size of about 1. We conclude that there is tantalizing preliminary
evidence in favor of segmenting, but additional research is needed.
PRETRAINING PRINCIPLE
Ensure That Learners Know the Names and
Characteristics of Key Concepts
Segmenting appears to be a promising way to address the situation in which
the learner is overloaded by the need to engage in essential processing—
208.
A p pl y i n g t h e S e g m e n t i n g a n d Pr e t r a i n i n g Pr i n c i p l e s 191
that is, the learner is overwhelmed by the amount of essential processing
required to understand a complex lesson. In this section, we examine a
related technique, which can be called the pretraining principle: Provide
pretraining in the names and characteristics of the key concepts in a lesson.
For example, before viewing a narrated animation on how the digestive
system works, learners could receive pretraining in which they learn the
names and locations of key body parts such as the esophagus, epiglottis,
trachea, pharynx, upper esophageal sphincter, lower esophageal sphincter,
and stomach.
We mentioned previously that, for a new student or instructor, using
the various facilities in the virtual classroom can be overwhelming. There-
fore we recommend a quick orientation session at the start of a virtual
classroom session that applies the pretraining principle. During the orien-
tation, the instructor can show the different parts of the virtual classroom,
as in Figure 9.6, followed by some introductory exercises during which
each student uses those facilities. We also categorized learning how to use
Figure 9.6. Pretraining Illustrates the Parts and Functions of the Virtual
Classroom Interface.
From Clark & Kwinn, 2007.
209.
192 e-Learning and the Science of Instruction
Figure 9.7. Pretraining Teaches Formula Format Before Procedure.
From Clark and Kwinn, 2007.
Excel formulas as another complex task. To apply the pretraining princi-
ple, the lesson shown in Figure 9.7 begins by teaching formula formatting
conventions. Following this portion of the lesson, the instructor demon-
strates the procedure of how to enter a formula into a spreadsheet.
Psychological Reasons for the Pretraining Principle
The pretraining principle is relevant in situations in which trying to process the
essential material in the lesson would overwhelm the learner’s cognitive system.
In these situations involving complex material, it is helpful if some of the pro-
cessing can be done in advance. When you see a narrated animation on how
the digestive system works, for example, you need to build a cause-and-effect
model of how a change in one part of the system causes a change in the next
part and so on, and you need to understand what each part does. We can help
the learner understand the cause-and-effect chain by making sure the learner
already knows the name and characteristics of each part. When you hear a term
like “upper esophageal sphincter” in a narrated animation, you need to try to
figure out what this term refers to and how it works. Learners who are more
210.
A p pl y i n g t h e S e g m e n t i n g a n d Pr e t r a i n i n g Pr i n c i p l e s 193
familiar with the content area may not need pretraining because they already
know the names and characteristics of key concepts. In short, pretraining can
help beginners to manage their processing of complex material by reducing
the amount of essential processing they do at the time of the presentation. If
they already know what terms like “upper esophageal sphincter” mean, they
can devote their cognitive processing to building a mental model of how that
component relates to others in the causal chain. Thus, the rationale for the
pretraining principle is that it helps manage the learner’s essential processing by
redistributing some of it to a pretraining portion of the lesson.
To implement the pretraining principle, evaluate the procedures and pro-
cesses you need to teach. If they are complex for your audience, then identify
key concepts and concept features that could be sequenced prior to teaching the
process or procedure. You could follow your lesson introduction with a short sec-
tion on the key concepts, even including a practice exercise on them. Then you
can move into the process or procedure that is the main focus of your lesson.
Evidence for Providing Pretraining in Key Concepts
Suppose we asked some learners to watch a sixty-second narrated animation
on how a car’s braking system works (no pretraining condition), containing
the script: “When the driver steps on a car’s brake pedal, a piston moves for-
ward in the master cylinder. The piston forces brake fluid out of the master
cylinder, through the tubes to the wheel cylinders. In the wheel cylinders, the
increase in fluid pressure makes a smaller set of pistons move. Those smaller
pistons activate the brake shoes. When the brake shoes press against the
drum, both the drum and the wheel stop or slow down.” Figure 9.8 shows
part of the animation that goes with this script. As you can see, this lesson
is somewhat complex, partly because it contains some unfamiliar terms.
It describes interactions among many parts such as brake pedal, piston in
master cylinder, brake fluid in tube, pistons in wheel cylinders, brake shoes,
drum, and wheel. The learner must learn the relations among the parts as
well as the characteristics of the parts themselves.
What can be done to provide some pretraining so the learner can be
relieved of some of the essential processing during the narrated animation?
A p pl y i n g t h e S e g m e n t i n g a n d Pr e t r a i n i n g Pr i n c i p l e s 195
Figure 9.10. Pretraining Version Resulted in Better Learning.
Based on data from Mayer, Mathias, and Wetzell, 2002.
9
7
Scores on Transfer Test
Pretraining
5
Version
3 No Pretraining
Version
1
0
separate studies, learners who received this kind of pretraining performed
better on transfer tests than did learners who did not receive pretraining,
yielding a median effect size of .9. The results from one of these studies is
shown in Figure 9.10
In another set of studies (Pollock, Chandler, & Sweller, 2002), electri-
cal engineering trainees took a course that included a multimedia lesson on
conducting safety tests for electrical appliances. The no-pretraining group
was shown how all the electrical components worked together within an
electrical system. The pretraining group first was shown how each compo-
nent worked individually. Across two separate experiments, the pretraining
group outperformed the no-pretraining group on transfer tests, yielding
effect sizes greater than 1. Overall, there is encouraging preliminary evidence
for the pretraining principle, but additional research is warranted.
What We Don’t Know About Segmenting
and Pretraining
Research on segmenting and pretraining is not as well developed as research
supporting other principles in this book, so we need a larger research base
that examines whether the effects replicate with different materials, learners,
213.
196 e-Learning and the Science of Instruction
and learning contexts. We do not yet know how large a segment should be,
that is, we need to determine how much information should be in a bite-
sized chunk. Should a segment last for ten seconds, thirty seconds, sixty
seconds, or more? How do you determine where to break a continuous les-
son into meaningful segments? The issue of how much learner control is
optimal is examined in Chapter 13, but also is not a resolved issue. We also
do not yet know how best to identify key concepts that should be included
in pretraining, or how extensive the pretraining needs to be. Is it enough for
learners to simply know the names and locations of the key components in
a to-be-learned system?
DE S I GN D I L E M M A : RES OLVED
The database e-learning team was debating the best way to sequence and to
display their content. The options considered were:
A. Sergio’s plan is better because it teaches all content in context of the
procedure.
B. Reshmi’s plan is better because she has separated the key concepts from
the procedure.
C. It is better to let the lesson “play” like a video so learners receive a
continuous picture of the entire procedure.
D. It is better to let the learners see the lesson in small bites so they can work
at their own rates.
E. Not sure which options are correct.
Our first question is whether constructing a relational database is a complex task.
We believe it is complex for those who are new to databases. There are a num-
ber of concepts to consider and to weigh in the design of an effective database.
Given a complex instructional goal, we recommend applying the segmenting and
pretraining principles suggested in Options B and D. We do agree that it’s a good
idea to teach the supporting concepts in job context and recommend that these
concepts be shown in the context of constructing a sample database; in this case,
the team used a video store example as their context.
214.
A p pl y i n g t h e S e g m e n t i n g a n d Pr e t r a i n i n g Pr i n c i p l e s 197
W H AT T O LO O K F O R I N e - L E A R N I N G
Material is presented in manageable segments (such as short clips of
narrated animation) controlled by the learner, rather than as a continuous
unit (such as a long clip of narrated animation).
Technical terms are defined and exemplified before the lesson.
Key concepts are named and their characteristics are described
before presenting the processes or procedures to which the concepts
are linked.
ON e-LEARNING AND THE SCIENCE
OF INSTRUCTION CD
You can compare the organization of our example and counter-example lessons to
see application of the pretraining principle. One quick way to compare these is to look
at the lesson pull-down menus for each, located in the upper-right section of the
screen. The example version teaches the major concepts first and then shows how
to apply them in some examples and practice exercises. The counter-example lumps
the concepts in with the steps, potentially leading to student overload. Both examples
apply the segmenting principle, since both allow the learners to proceed at their own
rate by pressing the continue button.
COMING NEXT
One of the most popular and powerful instructional techniques is the exam-
ple. Just about all effective lessons incorporate examples. What is the best
way to use examples in your e-lessons? How can examples actually accelerate
learning? In the next chapter you will learn important guidelines and the
evidence behind the guidelines for the best design, placement, and layout of
examples in your e-learning.
215.
198 e-Learning and the Science of Instruction
Suggested Readings
Mayer, R.E., (2005). Principles for managing essential processing in
multimedia learning: Segmenting, pretraining, and modality principles.
In R.E. Mayer (Ed.), The Cambridge handbook of multimedia learning
(pp. 169–182). New York: Cambridge University Press.
Mayer, R.E., & Chandler, P. (2001). When learning is just a click away:
Does simple user interaction foster deeper understanding of multimedia
messages? Journal of Educational Psychology, 93, 390–397.
Mayer, R.E., Mathias, A., & Wetzell, K. (2002). Fostering understanding
of multimedia messages through pretraining: Evidence for a two-stage
theory of mental model construction. Journal of Experimental Psychology:
Applied, 8, 147–154.
217.
CHAPTER OUTLINE
Worked Examples:Fuel for Learning
How Worked Examples Work
How to Leverage Worked Examples: Overview
Worked Example Principle 1: Transition from Worked Examples to
Problems via Fading
Worked Example Principle 2: Promote Self-Explanations of Worked-
Out Steps
Worked Example Principle 3: Supplement Worked Examples with
Explanations
Worked Example Principle 4: Apply Multimedia Principles to
Examples
Worked Example Principle 5: Support Learning Transfer
Design Guidelines for Near-Transfer Learning
Design Guidelines for Far-Transfer Learning
What We Don’t Know About Worked Examples
218.
10
Leveraging Examples
in e-Learning
WH AT ’ S N E W I N T H I S C H A P T E R ?
I N OUR FIRST EDITION we recommended that you replace some
practice with worked examples to make learning more efficient and effec-
tive. Of all of our chapters from the first edition, the design of worked
examples is among those topics that have generated a large amount of new
research. In our update, we find that worked examples continue to be a pow-
erful proven instructional method. We now can recommend new research-
based techniques for transitioning from worked examples to full problem
exercises via a fading process. We also offer new suggestions for encouraging
deep mental processing of worked examples by way of questions that require
learners to explain worked-out steps to themselves.
As in our first edition, we recommend application of the multimedia
principles to worked examples as well as design techniques to promote near
or far transfer. However, we add new evidence for techniques to get the most
201
219.
202 e-Learning and the Science of Instruction
of examples designed to promote far transfer by requiring learners to actively
compare pairs of examples to derive their common principles.
DE S I GN D I L E M M A : YO U DEC IDE
In the database lesson, Reshmi plans to give an explanation and then show one exam-
ple, followed by several practice exercises that involve different situations that would
benefit from a database. She is tired of e-learning that is nothing more than page
turning. She wants a learning environment that is rich with problem-solving practice.
Matt, however, is concerned about the amount of time required to develop the practice
exercises and associated feedback, as well as the amount of time that the learners will
need to devote to the lessons. He feels that the team could save time and money by
using more examples and fewer practice problems. Based on your own experience or
intuition, which of the following options would you select:
A. Reshmi is correct. The explanation should be followed by a good example
and then by multiple practice problems.
B. Matt is correct. Learning could be faster and more effective if the lesson
included more examples and less practice.
C. Both Reshmi’s and Matt’s approaches could be incorporated in a lesson
that alternates examples with practice.
D. Both Reshmi’s and Matt’s concerns could be addressed by a series of
interactive examples.
E. Not sure which options are best.
Worked Examples: Fuel for Learning
Worked examples are one of the most powerful methods you can use to build
new cognitive skills, and they are popular with learners. Learners often bypass
verbal descriptions in favor of examples. For example, learners in a LISP pro-
gramming tutorial ignored verbal descriptions of LISP procedures in favor of
worked examples (Anderson, Farrell, & Sauers, 1984). LeFevre and Dixon
(1986) evaluated learners who were free to study either textual descrip-
tions or worked examples to help them complete problem assignments. The
220.
Leveraging Examples ine-Learning 203
information in the text was deliberately written to contradict the examples.
By evaluating the learners’ solutions, it was clear that the learners used the
examples, not the text, as their preferred resource.
What Are Worked Examples?
In this chapter we write about a specific type of example called a worked
example. A worked example is a step-by-step demonstration of how to per-
form a task or solve a problem. Worked examples are designed to help
learners build procedural skills such as how to use a spreadsheet or strate-
gic skills such as how to conduct a negotiation. In Figure 10.1 we show a
three-step worked example used in a statistics lesson to illustrate calcula-
tion of probability. In Figure 10.2 we show a screen capture from part
of a worked example from our sample database lesson on the CD. While
worked examples are not new, today we have research providing guidelines
on the most effective type, sequencing, and layout of examples to result in
faster and better learning.
Figure 10.1. A Worked Example of a Probability Problem.
From Atkinson, Renkl, and Merrill, 2003.
Problem: From a ballot box containing 3 red balls and 2 white balls, two balls
are randomly drawn. The chosen balls are not put back into the ballot box.
What is the probability that the red ball is drawn first and a white ball is second?
First Total number of balls: 5
Solution Number of red balls: 3
Step Probability of red ball first 3/5 = .6
Second Total number of balls
Solution after first draw: 4(2 red and 2 white balls)
Step Probability of a white ball second: 2/4 = .5
Probability that a red ball is drawn
Third first and a white ball is second: 3/5 1/2 3/10 .3
Solution Answer:
Step The probability that a red ball is drawn first and white ball is second
is 3/10 or .3.
Next
221.
204 e-Learning and the Science of Instruction
Figure 10.2. A Worked Example from a Database Lesson.
From e-Learning and the Science of Instruction CD.
A B C D E F G H I J K
Step 1: 1
2
Video Store Movie Rentals
3 First Name Last Name Address Zip Phone D.O.B. Gender Movie Rented Rental Date Return Date Movie Genre
Select important entities. 4 Alex Jones 123 Wilson St. 85042 555-4589 12/14/1970 Male Under Water 12/16/2005 12/19/2005 Drama
5 Barbara Smith 5 Thomas Blvd. 85248 555-7896 2/15/1969 Female The Flying Circus 2/12/2004 2/19/2004 Action
6 Ralph Johnson 1209 North Street 85445 555-1254 3/27/1978 Male West Roads 3/17/2005 3/25/2005 Drama
7 Samantha Walters 45 West 82nd St. 85784 555-8621 2/14/1981 Female The Albatross 4/11/2006 4/29/2006 Comedy
8 George Thomas 88 Sound Bend Ave. 85774 555-7814 5/26/1954 Male New Winnings 11/13/2003 11/19/2003 Comedy
First, we looked at the data in the spreadsheet to determine what entities are important to track
in our database. For Sally, we determined that Customers, Movies, and Rentals were the three
entities of interest, so we designated a separate table for each of them.
How Worked Examples Work
In Chapter 2, we summarized the central role of working memory in learn-
ing processes that build new knowledge in long-term memory. We’ve all
heard the expression, “Practice makes perfect.” It’s a common assumption
that the best way to learn is to work lots of practice problems. However,
solving problems demands a great deal of working memory resource. Dur-
ing the early stages of learning, limited worked memory capacity is most
productively allocated to building new knowledge. When working practice
problems, so much working memory capacity is used up that there is little
available resource remaining for knowledge construction.
Instead of following the traditional practice of showing a single example
followed by a great deal of practice, learning is more efficient with a greater
reliance on worked examples. While studying a worked example (in con-
trast to solving a problem), working memory is relatively free for learning.
As learning progresses, new knowledge forms. At that point, practice does
become beneficial to help learners automate the new knowledge. In other
words, most efficient learning starts with lessons that initially use worked
examples that manage cognitive load and then transition into practice.
222.
Leveraging Examples ine-Learning 205
Evidence for the Benefits of Worked Examples
Sweller and Cooper (1985) used algebra to compare the learning outcomes of
studying examples to working multiple practice problems. One lesson version
assigned learners eight practice problems. The second lesson version assigned
learners a worked example followed by a practice exercise four times. Both
groups were exposed to eight problems, with the worked example group only
solving four of the eight. Following the lesson, learners took a test with six
new problems similar to those used in the lessons. The results are shown in
Table 10.1. It’s not surprising that those who worked all eight problems took
a lot longer to complete the lesson—almost six times longer! Notice, however,
that the number of errors during training and in the test was higher for the
all practice groups. This was the first of many experiments demonstrating
the benefits of replacing some practice with worked examples.
Table 10.1. Worked Example Problem Pairs Result in Faster Learning and
Performance.
From Sweller and Cooper, 1985.
Worked Examples/
Outcome Practice Pairs All Practice
Training 32.0 185.5
Time (Sec)
Training 0 2.73
Errors
Test Time 43.6 78.1
Test Errors .18 .36
What If Examples Are Ignored?
A potential problem with worked examples is that many learners either
ignore them altogether or review them in a very shallow manner. Either way,
the learners fail to leverage the examples in a way that will build new knowl-
edge. A comparison of how high-success and low-success learners processed
223.
206 e-Learning and the Science of Instruction
worked examples found that better learners reviewed worked examples by
explaining to themselves the principles reflected in the examples. For exam-
ple, when studying the worked example shown in Figure 10.1, a shallow
processor might be thinking: “To get the answer they multiplied 3/5 by 1/2.”
In contrast, a deeper processor might be thinking: “To determine the prob-
ability of two events, you have to multiply the probability of the first event by
the probability of the second event, assuming the first event happened.” The
shallow processor more or less repeats the content of the example, in contrast
to the deeper processor, who focuses on the principles being illustrated.
To overcome this potential limitation of worked examples, you can encour-
age your learners to process examples in a meaningful way by asking them to
respond to questions about the worked-out steps. In this chapter we show you
how to design effective worked examples and to promote their processing.
How to Leverage Worked Examples: Overview
In our first edition, we showed evidence that replacing some practice with
worked examples results in more efficient and effective learning. To ensure
that learners actively process worked examples, we suggested that some worked
examples be designed as “completion” problems that require the learner to
fill in some of the steps. We can update these recommendations with the
following new guidelines:
Principle 1: Transition from worked examples to full problems via fading.
Principle 2: Include self-explanation questions with your worked examples.
Principle 3: Supplement worked examples with effective explanations.
Regarding the formatting of worked examples, we continue to recommend that
you apply the multimedia principles, including multimedia, modality, redun-
dancy, contiguity, and chunking, to the design of your worked examples:
Principle 4: Apply the multimedia principles to the design of your
examples.
Last, the context you use for your examples will affect the transferability of
the new knowledge that learners build from the examples. In other words,
how you construct your example scenarios will influence the degree to which
224.
Leveraging Examples ine-Learning 207
learners are able to apply new skills learned from them after the training. As in
the first edition, we offer guidance for the design of examples to promote near
transfer or procedural skills, as well as those for building far-transfer skills. We
add new suggestions for helping learners gain the most from diverse examples
designed for far-transfer learning.
Principle 5: Support learning transfer through effective design of
context of worked examples.
WORKED EXAMPLE PRINCIPLE 1
Transition from Worked Examples to Problems
via Fading
Although worked examples are proven to be the most effective path dur-
ing the initial stages of learning, as learners gain more expertise, worked
examples can actually impede learning. This phenomenon is an example of
the expertise reversal effect. The reason for expertise reversal is that novices
benefit from the cognitive load relief of studying an example rather than
working a problem as the basis for initial learning. However, once the new
knowledge is stored in memory, studying a worked example adds no value.
In fact, the worked example may conflict with the learner’s unique approach
to completing the task. At that point, learners need to practice in order to
automate their new skills. A fading process accommodates the growth of
expertise by starting with full worked examples and progressing gradually
into full problem assignments.
What Is Fading?
In fading, the first example is a worked example provided completely by the
instruction, similar to the examples in Figures 10.1 and 10.2. The first fully
worked example is followed by a second example, in which most of the steps
are worked out but the learner is asked to complete one or two of them.
As examples progress, the learner gradually completes more of the steps.
Eventually the learner solves a practice problem completely on his or her
own. Figure 10.3 illustrates the concept of fading. The gray area represents
225.
208 e-Learning and the Science of Instruction
steps the instruction works and the white area represents steps completed
by the learner. Suppose, for example, you were teaching probability calcula-
tions in a statistics class. Figure 10.1 shows a fully worked example as rep-
resented by the all gray circle on the left in Figure 10.3. In Figure 10.4, you
can see the first faded example in the probability examples series. In this
Figure 10.3. Fading from a Full Worked Example to a Practice Problem.
From Clark, Nguyen, and Sweller, 2006.
Worked in Lesson
Worked by the Learner
Step 1 Step 1 Step 1 Step 1
Step 2 Step 2 Step 2 Step 2
Step 3 Step 3 Step 3 Step 3
Worked Completion Completion Assigned
Example Example 1 Example 2 Problem
Figure 10.4. A Faded Worked Probability Problem.
From Atkinson, Renkl, and Merrill, 2003.
Problem: The bulb of Mrs. Dark’s dining room table is defective. Mrs. Dark
had 6 spare bulbs on hand. However, 3 of them are also defective. What is
the probability that Mrs. Dark first replaces the original defective bulb with
another defective bulb before then replacing it with a functioning one?
First Total number of spare bulbs: 6
Solution Number of defective spare bulbs: 3
Step Probability of a defective bulb first 3/6 1/2 .5
Second Total number of spare bulbs
Solution After a first replacement trial: 5(2 defective and 3 functioning spares)
Step Probability of a functioning bulb second: 3/5 .6
Probability of first replacing the original Please enter
Third
defective dining room bulb with a defective the numerical
Solution
bulb first and then replacing it with a answer below:
Step
functioning one:
Next
226.
Leveraging Examples ine-Learning 209
example, the first two steps are worked by the instruction and the learner is
required to complete the final step. This example matches the second circle
in Figure 10.3. Following this worked example, a third probability problem
demonstrates the first step and asks the learner to complete Steps 2 and 3.
A fourth probability problem is assigned to the learner as a practice problem
to work alone. In progressing through a series of faded worked examples, the
learner gradually assumes more and more of the mental work until at the end
of the sequence he or she is working full practice problems.
Evidence for Benefits of Fading
A number of experiments have demonstrated better learning from faded
worked examples compared to learning from worked example-problem pairs.
For example, Atkinson, Renkl, and Merrill (2003) designed lessons on prob-
ability to include three-step faded worked examples like those shown in Fig-
ures 10.1 and 10.4. The first example was a full worked example, followed
by examples in which learners had to complete an increasing number of steps
until they worked the full problem themselves.
Half of the participants were assigned to lessons with faded worked
examples, while the other half were assigned to lessons with worked exam-
ples paired with problems. The amount of study time was the same in both
groups. As you can see in Figure 10.5, learning was better among those who
used the faded examples than among those with the example-problem pairs.
The differences showed an effect size of .27, which is a small effect.
WORKED EXAMPLE PRINCIPLE 2
Promote Self-Explanations of Worked-Out Steps
Principle 1 stated that learning is better with a series of faded worked exam-
ples, compared to learning from a series of example-problem pairs. However,
as we mentioned at the start of the chapter, if learners ignore the worked-
out steps or give them only superficial attention, much of the potential of a
worked example is lost. In our first edition, we recommended that you teach
your learners how to self-explain. Based on recent research, we revise our
227.
210 e-Learning and the Science of Instruction
Figure 10.5. Faded Examples Result in Better Learning Than
Problem-Example Pairs.
From Experiment 1, Near Transfer Learning,
Atkinson, Renkl, and Merrill, 2003.
100
Faded Examples
Problem-Example
80
Pairs
60
40
SD
20
0
recommendation, suggesting that you require your learners to self-explain
worked-out steps by asking them meaningful questions about them.
What Are Self-Explanation Questions?
A self-explanation question is an interaction—usually multiple choice in
multimedia—that requires the learner to review the worked-out step(s) and
identify the underlying principles or concepts behind them. Note that the
worked example we show in Figure 10.6 includes a multiple-choice question
next to the first worked step. The learner is required to identify the principle
that supports each step demonstrated in the worked example by selecting one
of the probability rules or principles. The goal of the self-explanation ques-
tion is two-fold. First, it discourages bypassing the worked example, since an
overt response is required. Second, because learners are asked to identify the
principles that underlie each step, they are encouraged to process that step
in a meaningful way.
Evidence for Benefits of Self-Explanation Questions
Atkinson, Renkl, and Merrill (2003) compared the learning of high school
students from faded worked examples that included self-explanation questions
228.
Leveraging Examples ine-Learning 211
Figure 10.6. A Self-Explanation Question on First Solution Step.
From Atkinson, Renkl, and Merrill, 2003.
Problem: From a ballot box containing 3 red balls and 2 white balls, two balls
are randomly drawn. The chosen balls are not put back into the ballot box.
What is the probability that a red ball is drawn first and a white ball is second?
First Total number of balls: 5
Solution Number of red balls: 3 Probability Rules/
Step Probability of a defective bulb first 3/5 .6 Principles:
a) Probability of
an Event
Please enter the letter of the rule/principle
b) Principle of
used in this step: Complementarity
c) Multiplication
Next
Principle
d) Addition
Principle
like the one in Figure 10.6 with the same faded worked examples without
questions. As you can see in Figure 10.7, adding the questions resulted in
greater learning from the worked examples. The effect size was .42, which is
a moderate effect.
Figure 10.7. Worked Examples with Self-Explanation Questions
Result in Better Learning Than Worked Examples
Without Questions.
From Experiment 2, Near Transfer Learning,
Atkinson, Renkl, and Merrill, 2003.
100 With Questions
No Questions
80
60
40
SD
20
0
229.
212 e-Learning and the Science of Instruction
WORKED EXAMPLE PRINCIPLE 3
Supplement Worked Examples with Explanations
So far, we have seen that learning can be significantly improved if you transi-
tion from examples to practice through a series of faded worked examples
and if you encourage processing of the worked-out steps with self-explanation
questions. These techniques free working memory to focus on processing
examples in ways that will build new knowledge.
However, when reviewing a worked example, the learners may not
really understand the steps shown. Then when required to respond to a
self-explanation question, they are likely to get stuck. When you present
your worked example, you can accompany the worked-out steps with an
explanation of the example. Your explanation would provide the underly-
ing principles and rationale for the steps. You could make the explanation
of the example available only when the learner requests it or in response to
errors to a self-explanation question.
Tips for Design of Explanations to Support Worked Examples
We have consistent evidence that providing explanations to support worked
out steps aids learning (Reed, Demptster, & Ettinger, 1985; Renkl, 2002).
We do not yet know when it is better to provide a more detailed explana-
tion or a shorter explanation. We also do not know when it is better to
incorporate the explanation as a part of the worked example or to make it
available on learner demand or in response to an error to a self-explanation
question. Until we have more evidence on these issues, we recommend the
following:
• Provide detailed explanations of initial worked examples for novice
learners;
• As the lesson progresses, make explanations shorter and available on
demand OR in response to an error to a self-explanation question;
• Write explanations that make the connection between the steps and
underlying principles clear; and
• Position explanations close to the location of the worked step that is
being explained, that is, apply the contiguity principle.
230.
Leveraging Examples ine-Learning 213
WORKED EXAMPLE PRINCIPLE 4
Apply Multimedia Principles to Examples
In Chapters 3 through 9, we presented Mayer’s multimedia principles pertain-
ing to the use of graphics, text, audio, and content sequencing. Some of the
earliest research on worked examples found that they failed to have a positive
effect when the multimedia principles were violated. For example, if the conti-
guity principle was violated by separating text steps from a relevant visual, split
attention resulted. Since split attention added extraneous cognitive load, the
potential of worked examples to reduce cognitive load was negated. To maximize
the cognitive load benefits of worked examples, it is important that you apply
the multimedia principles to their design. In this section we show you how.
Illustrate Worked Examples with Relevant Visuals:
Multimedia Principle
We saw in Chapter 3 that relevant visuals benefit learning in contrast to
lessons that use text alone to present content. The same guideline applies
to design of worked examples. Where possible, include relevant visuals to
illustrate the steps. For example in Figures 10.8 and 10.9, we show Step 2 in
Figure 10.8. A Worked Example Step with a Relevant Visual.
231.
214 e-Learning and the Science of Instruction
Figure 10.9. A Worked Example Step Without a Relevant Visual.
From The e-Learning and Science of Instruction CD.
a worked example from the database lesson. Figure 10.8 illustrates the fields
associated with the three entities for the video store example. In contrast,
Figure 10.9 summarizes the step in text only.
Present Steps with Audio—NOT Audio and Text: Modality and
Redundancy Principles
In Chapters 5 and 6 we summarized research showing that learning is bet-
ter when a relevant visual is explained with words presented in audio rather
than text or audio and text. The same guideline applies to worked examples.
Leahy, Chandler, and Sweller (2003) compared learning from a worked
example of how to calculate temperature changes from the graph shown in
Figure 10.10. Three different modality combinations were used to present
the steps: audio, text, and text plus audio. They found that, for complex
problems where cognitive load would be the highest, learning was better
when the graph was explained with audio alone.
Keep in mind, however, that applying the modality principle sometimes
creates more cognitive load than it saves. For example, you should not use
232.
Leveraging Examples ine-Learning 215
Figure 10.10. A Worked Example with Steps Integrated into Visual.
Adapted from Leahy, Chandler, and Sweller, 2003.
To Find Temperature Differences On Different Days
3. Subtract the lower Monday
Temperature ( C) temperature from the Tuesday
36 higher temperature
34
32
30
28
26
24 2. Locate the two dots
22 directly above the time
20
18
16
9am 10am 11am 12pm 1pm 2pm 3pm 4pm
1. Select a time of day Time of Day
audio in situations in which the learners need to refer to words at their own
pace. For example, when presenting a faded worked example that requires the
learner to complete some of the steps, all steps should be presented in text so
the learner can review those steps at his or her own pace in order to complete
those that are faded. In addition, when including self-explanation questions, it
will also be better to present the steps and the question in text, permitting flex-
ible review of those steps in order to correctly identify the appropriate princi-
ple. (See Chapter 5 for a more detailed discussion of the modality principle.)
Present Steps with Integrated Text: Contiguity Principle
We recommend that you make audio the default modality option in multime-
dia lessons when presenting steps related to a visual. However, to accommodate
learners who may have hearing impairments, who are not native speakers of the
language used in the instruction, or who may not have access to technology that
can deliver sound, as well as to help learners review steps in faded worked exam-
ples or in self-explanation questions, examples should be presented in text. When
using text to present steps pertaining to a visual, implement the contiguity prin-
ciple by placing the text close to the relevant visual, as shown in Figure 10.10.
233.
216 e-Learning and the Science of Instruction
You will notice in our sample database lesson that most of our worked
examples require some response in the form of a self-explanation question or
a completed step. Therefore we have used text to present these examples.
Present Steps in Conceptually Meaningful Chunks
Often worked examples may include ten or more steps. Learners may fol-
low each step individually, failing to see the conceptual rationale for the
steps or for combinations of steps. For example, in the probability prob-
lems shown in Figures 10.1 and 10.4, the steps are grouped into three seg-
ments, each segment illustrating the application of a probability principle.
Atkinson and Derry (2000) showed that, in multimedia, better learning
results from worked examples in which each step is presented on a new
screen, rather than when the steps are presented together. Your challenge is
to group your steps into meaningful chunks and draw learner attention to
those chunks by visually isolating them, by building them through a series
of screens, or by surrounding related steps with boxes to signal the underly-
ing principles.
Present Worked Example Steps Under Learner Control of Pacing:
Segmenting Principle
In Chapter 9 we showed that, for complex content, learning was better when
learners could move through screens at their own pace by clicking on the
“continue” button, rather than viewing the content in a non-stop video man-
ner. This guideline also applies to worked examples that are complex. After
each step, the learner should have control over pacing and click continue
when ready to move to the next screen.
Tips for Design of Worked Examples
In summary, the goal of worked examples is to minimize extraneous cogni-
tive load so that learners can allocate limited working memory resources
to learning. If you violate one or more of the multimedia principles in the
presentation of your worked examples, you add load and thus neutralize
the potential effectiveness of your worked example. Therefore when design-
ing your examples:
234.
Leveraging Examples ine-Learning 217
• Provide relevant visual illustrations;
• Use audio to present steps related to a visual; use text to present steps
when there is no accompanying visual;
• Use integrated text to present steps for faded worked examples or
when including self-explanation questions;
• Provide explanations of worked examples in text;
• Avoid presenting words in both text and audio;
• Segment worked examples with many steps into conceptually mean-
ingful chunks and use labels to highlight the chunks; and
• Allow learners to access each chunk at their own pace, rather than
playing all of the steps continuously.
WORKED EXAMPLE PRINCIPLE 5
Support Learning Transfer
In our first edition, we offered guidelines for designing the context of your
examples to support near or far transfer. Here we repeat those guidelines and
add a new guideline based on recent research related to far-transfer learning.
What Are Near and Far Transfer?
In some training situations, the main goal is to teach learners procedures,
tasks that are performed pretty much the same way each time they are com-
pleted. Accessing your email or filling out a customer order form are two
typical examples. When teaching procedures, your goal is to help learners
achieve near transfer. In other words, your goal is to help learners apply steps
learned in the training to similar situations in the work environment.
However, often your training goal is to build job skills that will require
the worker to use judgment in order to adapt strategies to new work situ-
ations. In a sales setting, for example, the product, the client, and the
situation will vary each time. It is not productive to teach sales skills as an
invariant set of steps because each situation will require adaptation. Rather,
235.
218 e-Learning and the Science of Instruction
you need to teach learners a set of strategies. Your goal is to help learners
adapt strategies learned in the training to the work environment, where
each situation will vary. When teaching strategies, your goal is to help
learners achieve far transfer. Management training, customer service train-
ing, and non-routine troubleshooting are all examples of tasks that require
far-transfer skills.
Design Guidelines for Near-Transfer Learning
You won’t be surprised to learn that you need to design worked examples
in different ways for near-transfer goals than for far-transfer goals. In this
section we will review evidence-based guidelines for constructing worked
examples in ways that best support near-transfer learning.
The Psychology of Near Transfer
Suppose we asked you to state aloud the months of the year. No problem.
However, what if we asked you to state aloud the months of the year in alpha-
betical order? That would likely take you a bit of time to sort out. Why?
Because you learned the calendar chronologically, your retrieval cues stored
in long-term memory are chronological cues. This is an example of what psy-
chologists call encoding specificity. Encoding specificity states that the cues you
will use to retrieve information after learning must be embedded at the time
of learning!
Design to Support Near-Transfer Learning
To apply the encoding specificity principle, it’s important that, for near-
transfer learning, your worked examples incorporate the same context that
workers will encounter on the job. We typically call these types of worked
examples demonstrations. For example, if you are teaching a new computer
skill, it will be important that your instruction incorporate visuals of the
same screens that workers will see on the job. By emulating the work envi-
ronment in the training interface, learners will encode new skills in the same
context in which they will be retrieved later.
236.
Leveraging Examples ine-Learning 219
Design Guidelines for Far-Transfer Learning
When it comes to far-transfer learning, the learner will need more flexible
knowledge based on strategic knowledge that can be adapted to many dif-
ferent job situations. In this section we review the psychology, evidence,
and guidelines for using worked examples in ways that promote far-transfer
learning.
The Psychology of Far Transfer
Experts can size up a problem in their domain by identifying the underlying
principles that are not apparent to a novice. For example, an expert physi-
cist is able to look at a problem that involves pulleys and realize the prob-
lem is really about the conservation of linear momentum. To a novice, it
would appear to be simply a “pulley problem.” Experts gain the ability to
see under the surface of a problem to identify its type through experience
with hundreds of different real problems encountered in their specialty
fields. Over time, experts abstract flexible strategies that they can apply to
new problems they face on a regular basis. The first thing someone needs
to figure out when faced with a problem is: “What kind of a problem
is this?” Once the problem is categorized, the appropriate solution proce-
dures can be applied.
How can you design examples in e-learning that will help learners build
strategies that will transfer to new and diverse situations?
Recall that encoding specificity states that the retrieval cues must be
encoded at the time of learning. This works fine for near-transfer tasks that
have predictable application environments. We simply need to replicate the
environment in our examples. However, we face a different challenge in far
transfer. Here we will need more flexible knowledge—knowledge that can
only be derived from multiple examples with different contexts or story lines
but with the same underlying principles.
Deep Versus Surface Features of Examples
Take a minute to review the tumor problem displayed on the next page.
237.
220 e-Learning and the Science of Instruction
T HE T U M O R P R O BL EM
Suppose you are a doctor faced with a patient who has a malignant tumor in
his stomach. It is impossible to operate on the patient, but unless the tumor is
destroyed, the patient will die. There is a kind of ray that at a sufficiently high inten-
sity can destroy the tumor. Unfortunately, at this intensity, the healthy tissue that the
rays pass through on the way to the tumor will also be destroyed. At lower intensi-
ties, the rays are harmless to healthy tissue, but will not affect the tumor either. How
can the rays be used to destroy the tumor without injuring the healthy tissue?
(Duncker, 1945).
What are some possible solutions to this problem? This problem was used
in an experiment reported by Gick and Holyoak (1980) in which different
groups had different pre-work assignments. One group read a story about a
general who captured a mined fortress by splitting up his troops and attack-
ing from different directions. Another group read the fortress story, plus
a story about putting out a fire on an oil rig. A single hose was not large
enough to disperse sufficient foam, so the fire was put out by directing many
small hoses toward the middle of the fire. In these three stories, the surface
features—the contexts—are quite different. One is about a medical problem,
another is about a fire, and a third is about a fortress. However, the underly-
ing principle—convergence principle—is the same. The convergence prin-
ciple illustrates the deep structure of the stories.
Gick and Holyoak (1980) found that most individuals who tried to solve
the tumor problem without any other stories did not arrive at the conver-
gence solution. Even those who read the fortress problem prior to the tumor
problem did not have much better luck. But the group that read both the
fire and the fortress stories had much better success. That is because, by
studying two examples with different surface features that reflect the same
principle, learners were able to abstract the underlying principle that con-
nected them.
Our challenge in far-transfer learning is to help learners build strategies
that can be retrieved and applied to new problems that emerge in the work
environment. In the next section we show you how.
238.
Leveraging Examples ine-Learning 221
Design to Support Far-Transfer Learning
In the tumor problem experiment, we saw that, when participants were pre-
sented with two stories that varied regarding their surface features (fire fight-
ing and fortress) but were similar regarding the deep structure (convergence
principle), many participants were able to solve the tumor problem. The
best way to help learners build strategies is to present several varied context
worked examples. In this section we will offer guidelines for creating varied
context worked examples and for encouraging learners to engage with those
worked examples in ways that promote strategic knowledge.
What Are Varied Context Worked Examples
Varied context worked examples are several worked examples that illustrate
some common set of principles in which you vary the cover story but keep
the relevant solution methods or principle the same. Take a look at the exam-
ples in Figures 10.1 and 10.4. Both of these worked examples demonstrate
how to solve basic probability problems. However, they vary on surface fea-
tures. First, one is about red and white balls and the other is about defective
and operative light bulbs. In other words, the cover stories have changed in
each problem. Second, the number of items in the two examples differs. The
example in Figure 10.1 involves three red balls and two white balls, whereas
the light bulb example involves three defective and three good bulbs. How-
ever, the basic solution principles (multiplication and probability) are applied
in the same way in each example. Since the number of objects differs in each
problem, so will the numbers differ in the calculation steps.
When teaching far-transfer skills, build several (at least two) worked examples
in which you vary the cover story but illustrate the same guidelines in each.
Evidence for Varied Context Worked Examples
Quilici and Mayer (1996) created examples to illustrate three statistical tests
of t-test, correlation, and chi-square. Each of these test types requires a dif-
ferent mathematical procedure and they are most appropriately applied to
different types of data. For each test type they created three examples. Some
example sets used the same surface story. For example, the three t-test prob-
lems used data regarding experience and typing speed; the three correlation
239.
222 e-Learning and the Science of Instruction
examples used data regarding temperature and precipitation; and the three
chi-square examples included data related to fatigue and performance. The
example sets that used the same cover story were called surface emphasizing
examples. An alternative set of examples varied the cover story. For example,
the t-test was illustrated by one example that used experience and typing
speed, a second example about temperature and precipitation, and a third
example about fatigue and performance. This set of examples was called struc-
ture emphasizing examples.
After reviewing the examples, participants sorted a new set of problems
into groups (Experiment 2) or selected which set of calculations they should
use to implement the appropriate statistical test (Experiment 3). As shown in
Figure 10.11, the structure-emphasizing examples led to significantly greater
discrimination among the test types.
Figure 10.11. Varied Context Worked Examples Resulted in More Correct
Discrimination of Test Type.
From Experiment 3, Quilici and Mayer, 1996.
Varied Context
Examples
Same Context
4.0 Examples
3.0
2.0
SD
1.0
0
Paas and Van Merrienboer (1994) gave learners math problems in the form
of either worked examples or problem assignments. The examples and
problems used were either all quite similar or used a varied context design
that presented examples with different surface features. Consistent with the
Quilici and Mayer results, they found better far-transfer learning occurred
with varied context examples, but only when those examples were presented
240.
Leveraging Examples ine-Learning 223
in the form of worked examples rather than problem assignments. The varied
contexts helped learners build more robust knowledge that could apply to
different problems on the test. However, using example sets with varied sur-
face features will impose greater cognitive load than problems with the same
surface features. Only when that additional load is offset by using worked
examples will the varied contexts pay off in better far-transfer learning.
Therefore we see that worked examples are especially important in building
strategic knowledge to offset the additional cognitive load imposed by the
varied contexts of the examples.
Engage Learners in Comparisons of Varied Context
Worked Examples
We mentioned previously that often learners either bypass worked examples
or attend to them in a shallow manner. We recommended that you use
self-explanation questions to maximize the potential of worked examples.
We extend this guideline by recommending that for far-transfer learning, you
engage learners in a comparison of two or more worked examples in which
the surface features change but the principles remain the same.
Present your first worked example using self-explanation questions, as we
described previously. Then maintain a summary of the solution for the first
worked example on the screen and display a second worked example with a
different surface feature next to the solution summary of the first. To pro-
mote an active comparison, ask the learner to state or identify the common
guidelines shared by the two worked examples.
Evidence for Benefits of Active Comparisons of Varied
Context Worked Examples
Gentner, Loewenstein, and Thompson (2003) designed a lesson on negotiation
skills in which they emphasized the benefits of a negotiated agreement that
uses a safeguard solution, rather than a less effective tradeoff solution. They
presented one worked example of negotiation that involved a conflict between
a Chinese and an American company over the best way to ship parts. They
illustrated both the tradeoff (less effective) and the safeguard (more effective)
negotiation strategies. In the next part of the lesson, they provided a different
241.
224 e-Learning and the Science of Instruction
worked example involving a conflict between two travelers over where to stay
on a planned trip. On the same page as the traveler negotiation example, the
learner can see a diagrammed summary of the safeguard shipping solution next
to a blank diagram the learner must complete using the traveler’s scenario. To
complete the blank diagram, the learner must study the second example closely
and compare it with the solution summary from the first example. This interac-
tion encourages learners to abstract the deep structure from the cover stories of
the two examples.
To evaluate learning, three lesson versions illustrated in Figure 10.12
were studied. In one lesson (separate examples) participants saw the shipping
and traveling examples, each on a separate page. After reading the examples,
participants were asked questions about each case such as, “What is going
on in this negotiation?” In this lesson version, learners reviewed each exam-
ple separately, rather than make a comparison between them. In a second
lesson version (comparison), participants saw both examples displayed on
the same page and were directed to think about the similarities between the
two situations. A third group (active comparison) presented the first example
Figure 10.12. Alternative Placement of Negotiation Strategy Examples
in Three Lessons.
Separate Examples Comparison Examples
Lesson Lesson
Shipping
Example
Shipping Travel
Example Example
Travel
Example
Active Comparison of Examples Lesson
Shipping
Example
Shipping
Example Travel
Example
with Questions
242.
Leveraging Examples ine-Learning 225
on one page. The solution to this example is carried to a second page that
presents the second example and asks learners to actively respond to ques-
tions about the second case. A fourth group received no training.
Following the training, all participants interacted in a role-played
face-to-face negotiation over salary. In the role play they assumed the role
of a job recruiter negotiating with a job candidate who wanted more sal-
ary than was offered. Judges scored the resulting job contract awarding a
higher score if the contract reflected the safeguard solution illustrated in
the lessons. As you can see in Figure 10.13, the lesson that required an
active comparison of the two examples resulted in best learning, followed
by the lesson in which both examples were displayed on the same page
and participants were directed to compare them. The groups that were
encouraged to make comparisons (comparison) and that were engaged in
a comparison activity (active comparison) applied the new skill signifi-
cantly more than those who did not draw comparisons (separate examples
and control group). The active comparison lessons were more effective
than the passive comparisons.
Figure 10.13. Best Learning from Active Comparisons of Examples.
Adapted from Gentner, Loewenstein, and Thompson, 2003.
Active Comparison Separate Cases
Comparison Baseline
100
Proportions of Pairs Forming
80
SafeGuard Contracts
60
40 SD
20
0
243.
226 e-Learning and the Science of Instruction
Tips for Design of Worked Examples for Near and Far Transfer
In summary we recommend that you:
• Incorporate the environment of the job as closely as possible in
worked examples designed to support learning of near-transfer
tasks;
• Include at least two worked examples that vary their cover stories
but embody similar principles to support learning of far-transfer
tasks; and
• Promote active comparisons of far-transfer worked examples by a
contiguous display of the examples, plus interactions that require the
learners to focus on the common principles.
What We Don’t Know About Worked Examples
We have learned a great deal in the past few years about the most effective
way to design worked examples to maximize learning. Still, a number of
issues remain to be resolved.
1. How to best fade multi-step worked examples. In worked exam-
ples with a few steps, such as the probability problems in Figures
10.1 and 10.4, it is easy to create a sequence of a few examples
that start with a full worked example and end with a complete
problem with two or three intervening faded examples. However,
many tasks require multiple steps. If such examples are faded one
step at a time, many worked examples would be needed. We need
more data on how best to apply fading techniques to multi-step
examples.
2. When to drop worked examples in favor of practice. We mentioned
that worked examples are best for early learning and should be
abandoned in favor of multiple practice assignments once the basic
knowledge is acquired. Presumably, different learners would benefit
from different numbers of worked examples to complete the initial
learning stage. Some early work has been initiated on how to use
a rapid adaptive testing technique to assess learner expertise and
244.
Leveraging Examples ine-Learning 227
determine when to transition to full problem assignments (Clark,
Nguyen, & Sweller, 2006). However, the implementation of adap-
tive testing can be quite labor-intensive, and it would be helpful
to have alternative guidelines to determine when to move from
worked examples to full problem assignments.
3. How to design worked examples for ill-defined domains. Most of
the research has used mathematical domains. This is because there
are clear-cut correct and incorrect answers, making it easy to assess
learning in an experiment. Except for the negotiation skills research
described previously, we lack examples of how to best construct
worked examples in more ill-defined arenas such as sales, commu-
nication skills, and management training.
DES I GN D I L EM M A : RES OLVED
We summarized a debate between Reshmi and Matt on the best ratio and place-
ment of examples and practice exercises with the following options:
A. Reshmi is correct. The explanation should be followed by a good example
and then by multiple practice problems.
B. Matt is correct. Learning could be faster and more effective if the lesson
included more examples and less practice.
C. Both Reshmi’s and Matt’s approaches could be incorporated in a lesson
that alternates examples with practice.
D. Both Reshmi’s and Matt’s concerns could be addressed by a series of
interactive examples.
Based on evidence reviewed in this chapter, we recommend option D. We
recommend a series of faded worked examples in which the learner works an
increasingly larger number of steps as he or she progresses through the examples.
Worked-out steps can be made more effective by requiring the learner to respond
to self-explanation questions. Together, these techniques will result in a series of
interactive examples that end with full practice problems.
245.
228 e-Learning and the Science of Instruction
W H AT T O LO O K F O R I N e - L E A R N I N G
Worked examples that fade from a full worked example into a full problem
assignment
Worked examples in which self-explanation questions are attached to worked
steps
Worked examples that provide instructional explanations of the worked steps
Worked examples that minimize cognitive load by applying appropriate
multimedia principles
Use relevant visuals
Explain visuals with audio or text – not both
Integrate explanatory text close to relevant visual
Segment worked examples into chunks that focus attention to underlying
principles
Present complex examples under learner control of pacing
Worked examples that mirror the work environment for near-transfer tasks
Multiple varied-context worked examples for far-transfer tasks
Interactions that encourage learners to actively compare sets of varied
context examples for far-transfer learning
ON e-LEARNING AND THE SCIENCE OF
INSTRUCTION CD
You can see an example of a faded worked example on our example database lesson.
From the drop-down menu, select “Putting It All Together.” The first worked example
appears on screens 36 through 40. Note self-explanation questions on screens 38
and 39. The next worked example on screens 41 through 47 is faded. For each step,
the instruction completes part and the learner finishes it. The final example starting
on screen 48 is a full problem that the learner works alone. In the counter-example
lesson, we do not include fading or self-explanation questions.
246.
Leveraging Examples ine-Learning 229
COMING NEXT
Although we recommend that you replace some practice with worked exam-
ples, you will still need to include effective practice in your training. In the
next chapter we offer evidence for the number, type, design, and placement
of practice, along with new guidelines on design of practice feedback that
will optimize learning.
Suggested Readings
Gentner, D., Loewenstein, J., & Thompson, L. (2003). Learning and
transfer: A general role for analogical encoding. Journal of Educational
Psychology, 95(2), 393–408.
Renkl, A. (2005). The worked-out examples principle in multimedia
learning. In R.E. Mayer (Ed.), The Cambridge handbook of multimedia
learning. New York: Cambridge University Press.
247.
CHAPTER OUTLINE
What IsPractice in e-Learning?
Practice Formats in e-Learning
The Paradox of Practice
How to Leverage Practice: Overview
Practice Principle 1: Mirror the Job
Practice Principle 2: Provide Explanatory Feedback
What Is Explanatory Feedback?
Evidence for Benefits of Explanatory Feedback
Tips for Feedback
Practice Principle 3: Adapt the Amount and Placement of Practice to
Job Performance Requirements
The Benefits of Practice
Practice Benefits Diminish Rapidly
Adjust the Amount of Practice in e-Learning Based on Task
Requirements
Distribute Practice Throughout the Learning Environment
Tips for Determining the Number and Placement of Practice Events
Practice Principle 4: Apply Multimedia Principles
Modality and Redundancy Principles
Contiguity Principle
Coherence Principle
Tips for Applying the Multimedia Principles to Your Interactions
Practice Principle 5: Transition from Examples to Practice Gradually
An Example of Faded Worked Examples
Why Faded Worked Examples Are Efficient
What We Don’t Know About Practice
248.
11
Does Practice Make
Perfect?
WH AT ’ S N E W I N T H I S C H A P T E R ?
I N OUR FIRST EDITION, we recommended that you design practice
to build job-relevant skills and adjust the amount and placement of prac-
tice to match proficiency requirements. These guidelines are still valid today.
There has been a moderate amount of new research on practice since our
first edition. In our update we focus on proven conditions that make prac-
tice exercises effective, including feedback. As discussed in Chapter 10, we
recommend that you manage cognitive load by transitioning from examples
to full practice assignments gradually.
As described in our first edition, you should distribute interactions
throughout the instructional environment and apply Mayer’s multimedia
principles to the design and layout of e-learning interactions.
231
249.
232 e-Learning and the Science of Instruction
DE S I GN D I L E M M A : YO U DEC IDE
Reshmi, Sergio, and Ben have very different ideas about how to design practice for
the database lesson. Sergio and Ben want to add a Jeopardy-type game like the one
shown in Figure 11.1. They feel that most of the learners will find the database topic
very dry and that adding some fun games will increase engagement and motivation.
Reshmi does not like the game idea. She would prefer to include short scenarios about
situations that can benefit from databases and incorporate questions about them.
Figure 11.1. A Jeopardy Game Design for the Database Lesson.
Database Jeopardy
Parent
Basics Keys Relationships
Click a category/dollar Child Tables
square to see your $100.00
$100.00 $100.00 $100.00
challenge. When it
displays, type your
response in the blank $200.00 $200.00 $200.00 $200.00
field and click OK.
$300.00 $300.00 $300.00 $300.00
Your Category:
Winnings: Answer:
$
Question: What is a OK
When it comes to feedback, Reshmi and Ben disagree about what kind of feedback to
include. Reshmi wants to tell participants whether they answered correctly or incorrectly
and explain why. Ben feels they can save a lot of development time by simply using the
automatic program feature of their authoring tool that tells learners whether they are
correct or incorrect. Otherwise the team will have to devote a large block of time to writ-
ing tailored explanations for all correct and incorrect response options. Based on your
own experience or intuition, which of the following options would you select:
A. Adding some familiar and fun games like Jeopardy will make the lesson
more engaging for learners and lead to better learning.
250.
D o es P r a c t i c e M a k e Pe r f e c t ? 233
B. It would be better to use scenarios as the basis for interactions.
C. The extra time invested in writing feedback explanations for practice
responses won’t pay off in increased learning.
D. Time invested in writing tailored feedback will pay off in improved learning.
E. Not sure which options are best.
What Is Practice in e-Learning?
Effective e-learning engages learners with the instructional environment in
ways that foster the selection, organization, integration, and retrieval of new
knowledge. First, attention must be drawn to the important information in
the training. Then the instructional words and visuals must be integrated
with each other and with prior knowledge. Finally, the new knowledge and
skills that are built in long-term memory must be retrieved from long-term
memory after the training when needed on the job. Effective practice exer-
cises support all of these psychological processes. In this chapter we will
review research and guidelines for optimizing learning from online practice.
Practice Formats in e-Learning
One path to engagement is through overt learner responses to lesson prac-
tice exercises. Practice exercises, often referred to as interactions in computer
learning environments, assume a variety of formats. Some interactions use
formats similar to those used in the classroom, such as selecting the correct
answer in a list or indicating whether a statement is true or false. Other inter-
actions use formats that are unique to computers, such as drag and drop and
simulations in asynchronous e-learning and whiteboard marking or typing
into a chat window in synchronous e-learning.
However, the psychological effectiveness of a practice exercise is more
important than its format. For example, consider the questions shown in
Figures 11.2 and 11.3. Both questions use a multiple-choice format. How-
ever, to respond to the question in 11.2, the learner need only recognize
the definition provided in the lesson. We call these kinds of interactions
251.
234 e-Learning and the Science of Instruction
Figure11.2. This Multiple-Choice Question Requires the Learner to
Recognize the Definition of a Field.
A Field is:
A. An instance of data located in a cell of the table
B. A class of data located in the column of the table
C. A row of data related to one instance
Figure 11.3. This Multiple-Choice Question Requires the Learner to
Apply the Concept of a Field to an Example.
From e-Learning and the Science of Instruction CD.
“regurgitative.” They don’t demand much thought. In contrast, to respond
to the question in 11.3, the learners need to apply their understanding of the
concept to an actual example. This question requires a deeper level of process-
ing than the question shown in Figure 11.2.
The Paradox of Practice
We’ve all heard the expression that “practice makes perfect.” But how impor-
tant is practice to skill acquisition? Studies of top performers in music, chess,
and sports point to the criticality of practice in the development of expertise.
252.
D o es P r a c t i c e M a k e Pe r f e c t ? 235
Sloboda, Davidson, Howe, and Moore (1996) compared the practice sched-
ules of higher-performing and lower-performing teenage music students of
equal early musical ability and exposure to music lessons. All of the students
began to study music around age six. The higher performers had devoted
much more time to practice. By age twelve higher performers were prac-
ticing about two hours a day, compared to fifteen minutes a day for the
lower performers. The researchers concluded that “There was a very strong
relationship between musical achievement and the amount of formal prac-
tice undertaken” (Sloboda, Davidson, Howe, & Moore, 1996, p. 287). In
fact, musicians who had reached an elite status at a music conservatory had
devoted over 10,000 hours to practice by the age of twenty!
In contrast, no relationship was found between college student grade-
point average and the amount of time devoted to study (Plant, Ericsson,
Hill, & Asberg, 2005). The research team concluded that the amount of
study by college students has no relationship to academic performance.
Similarly, we have all met individuals of average proficiency in an avo-
cation such as golf or music who spend a considerable amount of time
practicing with little improvement. Based on studies of expert performers
in music and sports, Ericsson (2006) concludes that practice is a necessary
but not sufficient condition to reach high levels of competence. What fac-
tors differentiate practice that leads to growth of expertise from practice
that does not?
Ericsson (2006) refers to practice that leads to expertise as deliberate
practice. He describes deliberate practice as tasks presented to performers
that “are initially outside their current realm of reliable performance, yet
can be mastered within hours of practice by concentrating on critical aspects
and by gradually refining performance through repetitions after feedback.
Hence, the requirement for concentration sets deliberate practice apart from
both mindless, routine performance and playful engagement”(p. 692). To
maximize the payoff from practice, we recommend the following factors:
(1) practice that focuses on specific skill gaps; (2) explanatory corrective
feedback; (3) practice in distraction-free environments; as well as (4) prac-
tice that builds skills that will transfer from learning environments to work
environments.
253.
236 e-Learning and the Science of Instruction
How to Leverage Practice: Overview
In our first edition, we showed evidence that practice should be job-relevant,
distributed throughout the learning environment, and that more practice
leads to improved performance. We update and extend these recommenda-
tions with the following guidelines:
Principle 1: Mirror the job.
Principle 2: Provide explanatory corrective feedback.
Principle 3: Determine the amount of practice based on job perfor-
mance requirements; distribute practice throughout the learning envi-
ronment.
Principle 4: Apply the multimedia principles to the design of your
practice questions.
Principle 5: Transition from examples to practice gradually via fading.
PRACTICE PRINCIPLE 1
Mirror the Job
Design interactions that require learners to respond in a job-realistic context.
Questions that ask the learner to merely recognize or recall information pre-
sented in the training will not promote learning that transfers to the job.
Begin with a job and task analysis in order to define the specific cognitive
and physical processing required in the work environment. Then create transfer
appropriate interactions—activities that require learners to respond in similar
ways during the training as they would in the work environment. In Chapter
10 we described the encoding specificity principle that tells us that the cues of
transfer must be encoded at the time of learning. The more the features of the
job environment are integrated into the interactions, the more likely the right
cues will be encoded into long-term memory for later transfer. The Jeopardy
game shown in Figure 11.1 requires only recall of information. Neither the
psychological nor the physical context of the work environment is reflected in
the game. In contrast, the question shown in Figure 11.3 requires learners to
254.
D o es P r a c t i c e M a k e Pe r f e c t ? 237
process new content in a job-realistic context and therefore is more likely to
support transfer of learning.
For the most part, avoid e-learning with interactions that require simple
regurgitation of information provided in the training program. These ques-
tions do not support the psychological processes needed to integrate new
information with existing knowledge. They can be answered without any
real understanding of the content, and they don’t implant the cues needed
for retrieval on the job. Instead, as you design your course, keep in mind the
ways that your workers will apply new knowledge to their job tasks.
Table 11.1 summarizes our recommendations for the best types of inter-
actions for training of procedural (near transfer) tasks, strategic (far transfer)
tasks, processes, concepts, and facts (Clark, 2007).
Table 11.1. Interactions for Five Types of Content in e-Learning.
Based on Clark, 2007.
Content Example: Web-Page
Type Interaction Description Creation
Fact Use the fact to complete Use the codes on your
a task; provide a job reference aid to access
aid for memory support the application
Concept Identify a new instance Select the web page
of the concept that applies effective
text design features
Process Solve a problem or Predict the impact of
make a decision a miscoded page property
specification on the
final web page output
Procedure Perform a task by Enter text specifications
following steps into the text
properties screen
Principle Perform a task by Design an effective
applying guidelines web page
255.
238 e-Learning and the Science of Instruction
PRACTICE PRINCIPLE 2
Provide Explanatory Feedback
Feedback provides knowledge of practice results. It tells learners whether they
answered the question correctly. But feedback can do much more! We rec-
ommend that, in addition to telling learners that their answers are correct or
incorrect, you provide a short explanation of why a given response is correct
or incorrect. In this section we provide examples and research on feedback to
help you maximize learning from interactions.
What Is Explanatory Feedback?
Take a look at the two feedback responses to the incorrect question response
shown in Figures 11.4 and 11.5. The feedback in Figure 11.4 tells you
that your answer is wrong. However, it does not help you understand why
your answer is wrong. The feedback in Figure 11.5 provides a much better
opportunity for learning because it incorporates an explanation. A missed
question is a teachable moment. The learner is open to a brief instructional
Figure 11.4. This Feedback Tells the Learner That His or Her Response
Is Incorrect.
From e-Learning and the Science of Instruction CD.
Sorry, that is incorrect
256.
D o es P r a c t i c e M a k e Pe r f e c t ? 239
Figure 11.5. This Feedback Tells the Learner That His or Her Response
Is Incorrect and Provides an Explanation.
From e-Learning and the Science of Instruction CD.
Sorry, that is incorrect. Remember, records are
analogous to rows in a spreadsheet. Try again.
explanation that will help build the right mental model and/or correct mis-
conceptions. Although the benefits of explanatory feedback seem obvious,
crafting explanatory feedback is much more labor-intensive than corrective
feedback, which can be automated in many authoring tools with only a few
key strokes. What evidence do we have that explanatory feedback will give a
return sufficient to warrant the investment?
Evidence for Benefits of Explanatory Feedback
Moreno (2004) compared learning from two versions of a computer botany
game called Design-A-Plant. In the game, participants construct plants from
a choice of roots, leaves, and stems in order to build a plant best suited to
an imaginary environment. The object of the game is to teach the adaptive
benefits of plant features for specific environments, such as heavy rainfall,
sandy soil, and so forth. In the research study, either corrective or explanatory
feedback was offered by a pedagogical agent in response to a plant design.
For explanatory feedback, the agent made comments such as: “Yes, in a low
257.
240 e-Learning and the Science of Instruction
sunlight environment, a large leaf has more room to make food by photo-
synthesis” (for a correct answer) or “Hmmm, your deep roots will not help
your plant collect the scarce rain that is on the surface of the soil” (for an
incorrect answer). Corrective answer feedback told the learners whether they
were correct or incorrect, but did not offer any explanation. As you can see
in Figure 11.6, better learning resulted from explanatory feedback, with an
effect size of 1.16. Students rated the version with explanatory feedback as
more helpful than the versions with corrective feedback. Motivation and
interest ratings were the same in both versions.
Figure 11.6. Better Learning from Explanatory Feedback.
From data in Experiment 1, Moreno, 2004.
50 SD Significant Difference
40
Scores on Transfer Test
30
20
SD
10
0
Explanatory Corrective
Feedback Feedback
Moreno and Mayer (2005) reported similar results using the same botany
game environment in a follow-up study. They found that explanatory feed-
back resulted in much better learning than corrective feedback, with a very
high effect size of 1.87. Learners in the explanatory feedback group gave
fewer wrong answers than those in the correct feedback group, with an effect
size of .94.
Debowski, Wood, and Bandura (2001) compared learning an electronic
search task from a guided and an unstructured practice session. All par-
ticipants attended an initial class that explained and demonstrated several
principles for conducting effective online searches. Following the instruction,
258.
D o es P r a c t i c e M a k e Pe r f e c t ? 241
participants were assigned to conduct practice searches on five topics. Half
the participants were randomly assigned to an unstructured practice in which
they could search on the five topics in any order or use topics of their own
choice. Participants in the unstructured group were encouraged to explore
and practice using the skills they learned in their training. The guided prac-
tice group was assigned the five search tasks in a sequence from easier to
more difficult. If they made an error in the search steps, they were reminded
of the correct procedure and given a demonstration of the correct approach.
Therefore, the guided practice group received a practice sequence from easier
to more difficult problems in addition to immediate explanatory feedback.
After the practice session, both groups completed two test searches during
which they were monitored and rated for the quality of their search strategy,
wasted effort, total effort, depth and breadth of search, and final perfor-
mance, measured by the number of relevant records retrieved by the final
search statement. The guided practice was more effective in building learner
confidence and in satisfaction with learning. Additionally, learners who
practiced under structured conditions demonstrated better quality search
strategies and retrieved more relevant records.
Search tasks offer little in the way of natural feedback. A novice would
have no way to know whether there are additional relevant records that
were not retrieved. The research team concludes that “for complex, ill-
structured tasks that provide low fidelity feedback, the evidence suggests
that guided mastery training plus extended guided exploration during
practice is needed to build initial competencies before the benefits of self-
guided exploration will be realized” (p. 1139).
Taken together, there is strong evidence for increased learning efficiency,
better learning, and higher learner satisfaction from environments that pro-
vide explanatory feedback during practice.
Tips for Feedback
We believe your lesson will benefit from the following tips:
• After the learner responds to a question, provide feedback in text
that tells the learner whether the answer is correct or incorrect and
provides a succinct explanation.
259.
242 e-Learning and the Science of Instruction
• Position the feedback so that the learner can see the question, his
or her response to the question, and the feedback in close physical
approximation to maintain contiguity.
• For a question with multiple answers, such as the example in Figure 11.7,
show the correct answers next to the learner’s answers and include an
explanation for the correct answers.
Figure 11.7. A Multiple-Select Question and Its Feedback.
From the example lesson on e-Learning and the Science of Instruction CD.
PRACTICE PRINCIPLE 3
Adapt the Amount and Placement of Practice to Job
Performance Requirements
Practice exercises are expensive. First, they take time to design and to program.
Even more costly will be the time learners invest in completing the practice.
How much practice is necessary and where should the practice be placed? In
this section we describe evidence that will help you determine the optimal
amount and placement of practice in your e-learning environments.
260.
D o es P r a c t i c e M a k e Pe r f e c t ? 243
The Benefits of Practice
Some e-learning courses in both synchronous and asynchronous formats
include little or no opportunities for overt practice. In Chapters 1 and 2
we classified these types of courses as receptive. Can learning occur without
practice? How much practice is needed?
Moreno and Mayer (2005) compared learning from the Design-A-Plant
game described previously in this chapter from interactive versions in which
the learner selected the best plant parts to survive in a given environment
with the same lesson in which the learning agent selected the best parts. As
you can see in Figure 11.8, interactivity improved learning with an effect size
of .63, which is considered moderate. In the same research report, a second
form of interactivity asked learners to explain why an answer was correct
or not correct to promote reflection on responses. Asking learners to pro-
vide an explanation proved beneficial when the agent rather than the learn-
ers selected the plant parts. In fact, learner explanations promoted learning
only when learners explained correct answers rather than their own answers,
which may have been incorrect. From these results, we conclude that interac-
tions are beneficial to far-transfer learning but that one form of interaction
(either selecting the plant parts OR giving an explanation for correct selec-
tions made by the program) is probably sufficient.
Figure 11.8. Better Learning from e-Learning with Interactions.
Based on data from Experiment 2, Moreno and Mayer, 2005.
30
25
20
15
10 SD
5
0
Interactive Non-Interactive
261.
244 e-Learning and the Science of Instruction
Practice Benefits Diminish Rapidly
Practice can improve performance indefinitely, although at diminishing levels.
Timed measurements of workers using a machine to roll cigars found that, after
thousands of practice trials conducted over a four-year period, proficiency con-
tinued to improve (Crossman, 1959). Proficiency leveled off only after the speed
of the operator exceeded the physical limitations of the equipment. In plotting
time versus practice for a variety of motor and intellectual tasks, a logarithmic
relationship has been observed between amount of practice and time to complete
tasks (Rosenbaum, Carlson, & Gilmore, 2001). Thus the logarithm of the time
to complete a task decreases with the logarithm of the amount of practice. This
relationship, illustrated in Figure 11.9, is called the power law of practice. As
you can see, while the greatest proficiency gains occur on early trials, even after
thousands of practice sessions, incremental improvements continue to accrue.
Practice likely leads to improved performance in early sessions as learners find
better ways to complete the tasks and in later practice sessions as automaticity
increases efficiency.
Figure 11.9. The Power Law of Practice: Speed Increases with More
Practice.
2.0
Response Time in Seconds
1.5
1.0
0.8
0.6
0.4
0.2
0
1,000 5,000 10,000 50,000
Practice Trials
262.
D o es P r a c t i c e M a k e Pe r f e c t ? 245
Adjust the Amount of Practice in e-Learning Based
on Task Requirements
More directly relevant to e-learning, Schnackenberg and others compared
learning from two versions of computer-based training, one offering more
practice than the other (Schnackenberg, Sullivan, Leader, & Jones, 1998;
Schnackenberg & Sullivan, 2000). In their experiment, two groups were
assigned to study from a full-practice version lesson with 174 information
screens and sixty-six practice exercises or from a lean practice version with
the same 174 information screens and twenty-two practice exercises. Partici-
pants were divided into high-ability and low-ability groups based on their
grade point averages and randomly assigned to complete either the full or
lean practice version. Outcomes included scores on a fifty-two-question test
and average time to complete each version. Table 11.2 shows the results.
Table 11.2. Better Learning with More Practice.
From Schnackenberg, Sullivan, Leader, and Jones, 1998.
66 Practices 22 Practices
Ability Level Low High Low High
Test Scores 32.25 41.82 28.26 36.30
Time to Complete 146 107 83 85
(minutes)
As expected, higher-ability learners scored higher and the full version took
longer to complete. The full version resulted in higher average scores, with
an effect size of .45, which is considered moderate. The full-practice ver-
sion resulted in increased learning for both higher-ability and lower-ability
learners. The authors conclude: “When instructional designers are faced with
uncertainty about the amount of practice to include in an instructional pro-
gram, they should favor a greater amount of practice over a relatively small
amount if higher student achievement is an important goal” (Schnackenberg,
Sullivan, Leader, & Jones, 1998, p. 14).
263.
246 e-Learning and the Science of Instruction
Notice that lower-ability learners required 75 percent longer to complete
the full-practice version than the lean-practice version, for a gain of about
4 points on the test. Does the additional time spent in practice warrant the
learning improvement? To decide how much practice your e-learning courses
should include, consider the nature of the job task and the criticality of job
proficiency to determine whether the extra training time is justified by the
improvements in learning.
After many practice exercises, new skills can be executed without using
any capacity from working memory. We refer to these skills as automatic.
Some job tasks must be learned to automaticity to ensure safe job performance
the first time these tasks are performed. Landing an airplane is one example.
These types of tasks benefit from repetitive drills that over time result in auto-
maticity. Other tasks benefit from automaticity of skills, but the automaticity
can be developed through practice on the job. Yet other types of tasks will
depend more on understanding the underlying concepts and principles to
apply to problem-solving situations than on automatic responses. In these
environments, more attention to the quality of practice than to the quantity
of practice may be warranted.
Distribute Practice Throughout the Learning Environment
The earliest research on human learning, conducted by Ebbinghaus in 1913,
showed that distributed practice yields better long-term retention. Accord-
ing to the National Research Council, “The so-called spacing effect—that
practice sessions spaced in time are superior to massed practices in terms
of long-term retention—is one of the most reliable phenomena in human
experimental psychology. The effect is robust and appears to hold for ver-
bal materials of all types as well as for motor skills” (1991, p. 30). As long
as eight years after an original training, learners whose practice was spaced
showed better retention than those who practiced in a more concentrated
time period (Bahrick, 1987).
The spacing effect, however, does not result in better immediate learn-
ing. It is only after a period of time that the benefits of spaced practice are
realized. Since most training programs do not measure delayed learning, the
benefits of spaced practice would typically not be noticed. Only in long-term
264.
D o es P r a c t i c e M a k e Pe r f e c t ? 247
evaluation would this advantage be seen. Naturally, practical constraints will
dictate the amount of spacing that is feasible.
Since our first edition, there are at least two studies that continue to
support the benefits of distributed practice. Both studies focused on reading
skills. Seabrook, Brown, and Solity (2005) showed that recall of words in a
laboratory experiment that included various age groups was better for words
in a list that were repeated after several intervening words than for words that
were repeated in sequence. To demonstrate the application of this principle
to instructional settings, they found that phonics skills taught in reading
classes scheduled in three two-minute daily sessions showed an improvement
six times greater than those practicing in one six-minute daily session.
Rawson and Kintsch (2005) compared learning among groups of college
students who read a text once, twice in a row, or twice with a week separating
the readings. As you can see in Figure 11.10, reading the same text twice in a
row (massed practice) improves performance on an immediate test, whereas
reading the same text twice with a week in between readings (distributed
practice) improves performance on a delayed test.
Figure 11.10. Best Learning on Delayed Test from Spaced Readings.
Data from Experiment 1, Rawson and Kintsch, 2005.
55
Comprehension Scores (%)
50
45
40
35
Single Massed Distributed Single Massed Distributed
Immediate Test Delayed Test
265.
248 e-Learning and the Science of Instruction
Taken together, evidence continues to recommend practice that is sched-
uled throughout a learning event, rather than concentrated in one time or
place. To apply this guideline, incorporate review practice exercises among
the various lessons in your course, and within a lesson distribute practice
over the course of the lesson rather than all in one place.
Tips for Determining the Number and Placement
of Practice Events
We have consistent evidence that interactions promote learning. However,
the greatest amount of learning accrues on the initial practice events. Large
amounts of practice will build automaticity, but offer diminishing perfor-
mance improvements. We also know that greater long-term learning occurs
when practice is distributed throughout the learning environment rather
than all at once. To summarize our guidelines for practice, we recommend
that you:
• Analyze the desired result for task performance requirements:
Is automatic task performance needed? If so, is automaticity
required immediately or can it develop during job performance?
Does the task require an understanding of concepts and processes
along with concomitant reflection?
• For less critical tasks or for tasks that do not require automaticity,
incorporate fewer practice sessions.
• For tasks that require high degrees of accuracy and/or automaticity,
incorporate large numbers of practice sessions.
• For tasks that require automatic responses, use the computer to mea-
sure response accuracy and response time. Once automated, responses
will be both accurate and fast.
• Distribute practice among lessons in the course and within any given
lesson.
• In synchronous e-learning courses, extend learning by designing sev-
eral short sessions of one to two hours with asynchronous practice
assigned between sessions.
266.
D o es P r a c t i c e M a k e Pe r f e c t ? 249
PRACTICE PRINCIPLE 4
Apply Multimedia Principles
In Chapters 3 through 8, we presented six principles for design of multimedia
pertaining specifically to the use of graphics, text, and audio in e-learning.
Here are some suggestions for ways to apply those principles to the design of
practice interactions.
Modality and Redundancy Principles
According to the modality principle described in Chapter 5, audio should
be used to explain visuals in your lesson. However, audio is too transient for
practice exercises. Learners need to refer to the directions while respond-
ing to questions. Any instructions or information learners need in order
to answer a question should remain in text on the screen while the learner
formulates a response.
Previously in this chapter, we focused on the importance of explana-
tory feedback. Feedback should also be presented in text so that learners can
review the explanations at their own pace. Based on the redundancy principle
described in Chapter 6, use text alone for most situations. Do not narrate
on-screen text directions, practice questions, or feedback.
Contiguity Principle
According to the contiguity principle, text should be closely aligned to the
graphics it is explaining to minimize extraneous cognitive load. Since you
will be using text for your questions and feedback, the contiguity principle
is especially applicable to design of practice questions. Clearly distinguish
response areas by placement, color, or font and place them adjacent to the
question. In addition, when laying out practice that will include feedback
to a response, leave an open screen area for feedback near the question and
as close to the response area as possible so that learners can easily align
the feedback to their responses and to the question. In multiple-choice or
multiple-select items, use color or bolding to show the correct options as
part of the feedback.
267.
250 e-Learning and the Science of Instruction
In situations in which there are multiple responses to a lengthy practice
question, the feedback may require considerable screen real estate. In these cir-
cumstances, show a correct answer on a different screen along with an expla-
nation. However, when so doing, be sure to display the learner’s responses next
to the correct response and visible to the feedback, as shown in Figure 11.7.
Coherence Principle
In Chapter 7 we reviewed evidence suggesting that violation of the coherence
principle imposes extraneous cognitive load and may interfere with learning.
Specifically, we recommended that you exclude stories added for entertain-
ment value, background music and sounds, and detailed textual descriptions.
Our bottom line is “less is usually more.”
We recommend that practice opportunities be free of extraneous visual
or audio elements such as gratuitous animations or sounds (applause,
bells, or whistles) associated with correct or incorrect responses. Research
has shown that, while there is no correlation between the amount of study
and grade point average in universities, there is a correlation between the
amount of deliberate practice and grades. Specifically, study in distraction-
free environments alone in a quiet room (rather than with a radio) or in a
team leads to better learning (Plant, Ericsson, Hill, & Asberg, 2005; Kenz &
Hugge, 2002). During virtual classroom synchronous sessions, the instructor
should maintain a period of silence during practice events. In addition, the
instructor should ask learners to display one of the response icons, such as
the smiley face, when they have completed an exercise outside of the virtual
environment, such as in a workbook. Multi-session virtual classroom courses
can leverage the time in between sessions with homework assignments that
may require a lengthy time of individual reflection.
Tips for Applying the Multimedia Principles to Your Interactions
In summary, the following tips will be helpful in designing your learning
events:
• Include relevant visuals as part of your interaction design;
• Align directions, practice questions, and feedback in on-screen text; and
• Minimize extraneous text, sounds, or visuals during interactions.
268.
D o es P r a c t i c e M a k e Pe r f e c t ? 251
PRACTICE PRINCIPLE 5
Transition from Examples to Practice Gradually
Completing practice exercises imposes a great deal of mental load. In Chap-
ter 10, we showed evidence that using healthy doses of worked examples
along with practice will result in more efficient learning. In fact, a proven
strategy to impose load gradually as learners gain expertise is to use faded
worked examples. Because we discussed the evidence for faded worked exam-
ples extensively in Chapter 10, we provide only a brief review here.
An Example of Faded Worked Examples
In our database lesson on the CD, after presenting several basic concepts,
the lesson guides the learners to apply five database design steps. The first
example is a full worked example in which all of the steps to construct a video
store database are illustrated for the learner and briefly explained by the agent.
To ensure that learners process this example, self-explanation questions are
included at several of the steps. The second example is a faded example focus-
ing on a database for a library. In the faded example, steps are partially worked
out for the learner and the learner is asked to finish the steps. The final assign-
ment requires the learner to construct a database on his or her own.
Why Faded Worked Examples Are Efficient
A number of research studies we reviewed in Chapter 10 have shown that using
worked examples speeds learning and improves learning outcomes. When care-
fully observing and processing a demonstration, the learner can use limited
working memory capacity to build a mental model. By gradually assuming more
mental work in completing examples and then in working problems themselves,
learners invest more mental effort after they have built an initial mental model.
What We Don’t Know About Practice
We conclude that, while practice does not necessarily lead to perfect,
deliberate practice that includes effective feedback does. We saw that
explanatory feedback is more effective than feedback that merely tells
269.
252 e-Learning and the Science of Instruction
learners whether their responses are correct or incorrect. We still need to
know more about the best types of feedback to give. For example, should
feedback be detailed or brief? We also need to know more about the best
timing for feedback. Is feedback provided immediately after a response
always most effective? Finally, it is easy for learners to bypass or give feed-
back only cursory attention. What are some techniques we can use to
ensure that learners reflect on feedback? We look to future research on
these questions.
Another question of interest involves the tradeoffs between overt practice
and reflecting on the responses of others. In the Design-A-Plant experiment,
both actively responding or giving explanations for the correct actions of oth-
ers led to learning. Under which circumstances would one type of response
be more effective and more efficient than the other? Would it be as valuable
to ask learners to pause and think to themselves as it is to ask them to overtly
type or select explanations?
DE S I GN D I L EM M A : RES O LVED
The database design team had disagreements about the type of practice and
practice feedback to include in the database lesson, leading to the following
options:
A. Adding some familiar and fun games like Jeopardy will make the lesson
more engaging for learners and lead to better learning.
B. It would be better to use database scenarios as the basis for interactions.
C. The extra time invested in writing feedback explanations for practice
responses won’t pay off in increased learning.
D. Time invested in writing tailored feedback will pay off in improved
learning.
E. Not sure which options are best.
Based on the research we have summarized in this chapter, we recommend Options
B and D.
270.
D o es P r a c t i c e M a k e Pe r f e c t ? 253
W H AT T O LO O K F O R I N e - L E A R N I N G
Job-relevant overt practice questions that require participants to apply new
content in authentic ways
Feedback that not only tells the respondent whether his or her answer is
correct or incorrect but gives an explanation as well
The number of practice opportunities reflects the criticality of the job skills
and the need for automaticity
Practice exercises distributed throughout the learning event
Practice exercises that minimize cognitive load by applying appropriate
multimedia principles
Use relevant visuals
Use text to provide directions and feedback close to related visuals
or response areas
Avoid gratuitous sounds or other distractions
Full-practice assignments that are preceded by faded worked examples
ON e-LEARNING AND THE SCIENCE
OF INSTRUCTION CD
Although both example and counter-example lessons include practice, the feedback
and layout of practice in the example lesson applies our guidelines more effectively.
COMING NEXT
From discussion boards to blogs to breakout rooms, there are numerous
computer facilities to promote to synchronous and asynchronous forms of
collaboration among learners and instructors during e-learning events. There
has been a great deal of research on how to best structure and leverage online
collaboration to maximize learning. Unfortunately, we still have few solid
guidelines from that research. In the next chapter we look at what we know
about online collaboration and learning.
271.
254 e-Learning and the Science of Instruction
Suggested Readings
Debowski, S., Wood, R.E., & Bandura, A. (2001). Impact of guided explora-
tion and inactive exploration on self-regulatory mechanisms and informa-
tion acquisition through electronic search. Journal of Applied Psychology,
86(6), 1129–1141.
Moreno, R., & Mayer, R.E. (2005). Role of guidance, reflection, and inter-
activity in an agent-based multimedia game. Journal of Educational
Psychology, 97(1), 117–128.
Plant, E.A., Ericsson, K.A., Hill, L., & Asberg, K. (2005). Why study time
does not predict grade point average across college students: Implications
of deliberate practice for academic performance. Contemporary Educa-
tional Psychology, 30, 96–116.
273.
CHAPTER OUTLINE
What IsComputer-Supported Collaborative Learning (CSCL)?
Types of CSCL
Individual vs. Group Outcomes from CSCL
Factors That Make a Difference: Overview
Optimizing Individual Outcomes from CSCL
Optimizing Group Products from CSCL
Is Problem-Solving Learning Better with CSCL or Solo?
Virtual vs. Face-to-Face Group Decisions
Software Representations to Support Collaborative Work
Group Roles and Assignments in CSCL
Team-Building Skills and CSCL Outcomes
Collaborative Structures and CSCL Outcomes
Collaborative Group Techniques
Structured Controversy
Problem-Based Learning
CSCL: The Bottom Line
274.
12
Learning Together
Virtually
W HAT ’ S N E W I N T H I S C H A P T E R ?
W E STATED IN OUR FIRST EDITION that the research base was
insufficient to make firm recommendations regarding computer-
mediated collaborative learning. Therefore, we summarized the research evi-
dence available from face-to-face collaborative learning and speculated about
ways this evidence might apply to e-learning environments.
Although there continues to be a great deal written about computer-
supported collaborative learning (CSCL), we still do not have sufficient evidence
to offer guidelines for its best use. However, due to the interest in this topic and
to the emergence of “social software” in the form of synchronous collaboration
tools, as well as blogs and wikis for asynchronous collaboration, we wanted to
summarize the main issues being addressed in CSCL research. Design prin-
ciples such as modality or contiguity featured in previous chapters are not yet
available for CSCL. Still, our discussion of the issues and research surrounding
257
275.
258 e-Learning and the Science of Instruction
computer-mediated collaboration will shape your ideas for applying collaborative
techniques in ways that support workforce learning. We will review research on
how the following factors may modify CSCL results: individual versus group
outcomes, team composition, technology features, task assignments and instruc-
tions, participant roles, time to collaborate, and teamwork skills.
DE S I GN D I L E M M A : YO U DEC IDE
The new vice president of corporate learning and performance is very keen on
knowledge management strategies that capture organizational expertise and make
it accessible via electronic repositories. She has indicated that she wants all proj-
ect teams to integrate collaborative activities into both formal and informal learning
programs. The database training project manager has directed the design team to
integrate some effective collaboration techniques into the new course. Reshmi wants
to incorporate collaborative projects. Specifically, she would like to assign teams to
design a database that will improve an operational objective in their department. Matt
thinks a team project of this type will require too much instructor mentoring time. And
he is skeptical about the learning outcomes of group work for the resources invested.
Instead, he suggests that they set up a company-wide discussion board to exchange
ideas and applications relevant to databases. Both Matt and Reshmi wonder about
the best collaborative approach to use. Would they get better results from synchro-
nous activities or from asynchronous discussions? They also wonder about the best
way to structure whatever collaborative assignments they decide to pursue. Based on
your own experience or intuition, which of the following options is/are correct:
A. A team project assignment to create a real-world database will result in
better individual learning than an individual project assignment.
B. A discussion board would have more far-reaching benefits than an
end-of-class project.
C. A team project would be best accomplished through synchronous
collaborative facilities using chat or audio.
D. Any collaborative assignments should include structured group roles and
processes for best results.
E. Not sure which options are correct.
276.
L e ar n i n g To g e t h e r V i r t u a l l y 259
What Is Computer-Supported Collaborative
Learning (CSCL)?
The first generations of e-learning were designed for solo learning. There
were few practical ways to integrate multiple learners or instructors into
asynchronous self-study e-learning. However, the emergence of social soft-
ware has made both synchronous and asynchronous connections practi-
cal and easy. Table 12.1 summarizes common social software and some of
their applications in e-learning. Chats, breakout rooms in virtual classrooms
(shown in Figure 12.1), wikis (shown in Figure 12.2), blogs, and discussion
boards (shown in Figure 12.3) offer a variety of channels for online collabo-
ration. Tools such as wikis and blogs have emerged since our first edition.
Table 12.1. Online Facilities for Social Learning.
Some e-Learning
Facility Description Applications
Blogs A website where individuals Learning journals
write commentaries on an Post-class application
ongoing basis. Visitors can commentaries
comment or link to a blog. Informal updates on
Some writers use blogs to course skills and
organize individual thoughts, related topics
while others command Evaluation of
influential, worldwide course effectiveness
audiences of thousands.
Breakout A conferencing facility Synchronous team work
Rooms that usually supports audio, during a virtual
whiteboard, polling, and classroom session
chat, used for small groups Small group meetings
in conjunction with a virtual
classroom event or online
conference (see Figure 12.1)
(Continued)
277.
260 e-Learning and the Science of Instruction
Table 12.1. (Continued).
Some e-Learning
Facility Description Applications
Chats Two or more participants Role-play practice
communicating at the Group decision making
same time by text Group project work
Pair collaborative study
Questions or
comments during a
virtual presentation
Email Two or more participants Group project work
communicating at Instructor-student
different times with exchanges
messages received and Pair collaborative
managed at the individual’s activities
mail site
Message A number of participants Topic-specific discussions
Boards communicate at different Case-study work
times by typing comments Post-class commentaries
that remain on the board
for others to read and
respond to (see Figure 12.3)
Online A number of participants Guest speakers
Conferencing online at once with Virtual classes
access to audio, Group project work
whiteboard, polling,
media displays, and chat
Wikis A website that allows Collaborative work
visitors to edit its on a project document
contents; can be Ongoing updated
controlled for repository of course
editing/viewing by a information
small group or by Collaborative course
all (see Figure 12.2) material construction
278.
L e ar n i n g To g e t h e r V i r t u a l l y 261
Figure 12.1. Synchronous Collaborative Learning with Chat, Audio,
Whiteboard in Breakout Room.
From Clark & Kwinn, 2007.
Figure 12.2. Asynchronous Collaborative Learning Using a Wiki.
Accessed from http://en.wikipedia.org, August 15, 2006.
279.
262 e-Learning and the Science of Instruction
Figure 12.3. Asynchronous Collaborative Learning Using a
Discussion Board.
With permission from The Australian Flexible Learning Framework 2006
and the e-Learning Networks Community Forum.
Other tools have expanded greatly in their use. For example, in large com-
mercial organizations remote synchronous forms of instructor-led training
make up 25 percent of the training delivery media (Dolezalek, 2005).
What do we really know about how various approaches to computer-
mediated collaborative learning affect learning and performance? To answer
that question we need to define what we mean by CSCL and how we measure
its effectiveness.
Types of CSCL
By CSCL we refer to collaborative engagements among teams of two to
five members using synchronous and/or asynchronous tool facilities in
ways that support an instructional goal, such as to produce a joint product,
resolve a case study, or complete an instructional worksheet. Other forms of
CSCL that we will not address include knowledge management resources
as a repository of community electronic documents, including templates,
checklists, best-practice examples, and mentor contacts. These resources are
280.
L e ar n i n g To g e t h e r V i r t u a l l y 263
generally available on the organization’s website and are intended primarily
for use as asynchronous guides for individual work assignments.
Individual vs. Group Outcomes from CSCL
Research studies have used different metrics to assess CSCL outcomes.
To assess the applicability of a CSCL research report to your environ-
ment and goals, you need to identify what outcomes were measured.
Individual outcomes from CSCL measure achievements of each member
of a team that has worked collaboratively. For example, a team of four
collaborates in a virtual classroom for several hours to solve a case prob-
lem. After the exercise, each team member is individually tested for his or
her knowledge gained from the case. Individual outcome metrics include
satisfaction ratings, technology usage logs, analysis of statements made by
participants during the collaborative activities, and learning evaluated
by traditional tests or by a product such as an essay, a design plan, or a
problem solution.
In contrast, other research studies measure group outcomes. For example,
a team of four works together over several hours to solve a case problem.
The group solution to this exercise and the quality of the discussions are
evaluated as the primary outcomes. Group outcomes include metrics such as
group perceptions of learning, team test scores or team grades, products or
decisions emerging from team collaboration, analysis of team dialog during
collaboration, and logs to evaluate which technology features were used for
what purposes. Each of these outcomes tells us different things, and no one
measure tells the full story. For instructional purposes, learning outcomes are
an important metric to guide our decisions.
We might assume that if a team outcome is good, the individuals who
make up that team likewise benefi ted. This, however, may not always
be the case. A meta-analysis of CSCL by Lou, Abrami, and d’Apollonia
( 2001) separated research that measured individual achievement out-
comes from studies that measured group products. They found that group
performance is not necessarily predictive of individual performance. In
addition, factors that optimize individual performance from collaborative
environments are different from those that optimize team performance.
281.
264 e-Learning and the Science of Instruction
Therefore, you will need to carefully examine the performance metrics cited
in any claims regarding the effectiveness of CSCL. In addition, decide whether
group performance or individual performance is more relevant to your goals. For
example, a project team is assigned to develop a risk analysis for a costly new tech-
nology initiative the organization is considering. The team consists of experts from
product design, manufacturing, engineering, consumer research, and finance. In
this setting, the final group product is the main focus of interest and you would
want to design collaborative environments that lead to best team performance.
In contrast, in a class on risk analysis, project teams are assembled to work on a
case study. Each team must produce a risk analysis report. Here the main focus of
interest is individual learning and you would want design collaborative environ-
ments that lead to best individual performance.
In general, goals related to workplace performance products suggest a
focus on group outcomes, whereas learning goals suggest a focus on individual
performance outcomes.
Factors That Make a Difference: Overview
Early CSCL research compared outcomes from various forms of CSCL to
outcomes from individual work. Unfortunately, little consensus emerged.
As the field matures, a more productive question is: Under what circum-
stances will individual or group outcomes of a given type be best mediated
by what type of online collaborative structures? However, we are unlikely to
find guidelines that are universally applicable.
As summarized in Table 12.2, technology features, team assignments,
performance evaluation plans, and team sizes are among a number of ele-
ments that can affect CSCL outcomes. Any unique combination of those
factors may exert different effects. For example, the individual learning out-
comes of a team of two working on a near-transfer task in a synchronous chat
mode would likely be quite different from a group product outcome from
a team of four working on a decision task in an asynchronous discussion
environment. Alter any one of these factors, and the outcome may shift.
In this section we review meta-analysis and individual research studies
that have addressed some of the factors listed in Table 12.2. A comprehensive
282.
L e ar n i n g To g e t h e r V i r t u a l l y 265
review of all relevant reports on CSCL is a book in itself. Instead, we limit
ourselves to a few recent reports that illustrate the range and diversity of
ongoing research. From these reports you can get a glimpse of some of the
factors that shape CSCL outcomes. However, until there is a much larger
body of controlled research that measures learning and that systematically
varies the factors listed in Table 12.2, we cannot make any broad generaliza-
tions about computer-mediated collaboration and learning.
Optimizing Individual Outcomes from CSCL
As mentioned previously, Lou, Abrami, and d’Apollonia (2001) synthesized
the results of over 122 experiments that compared individual and/or group
achievements from collaborative learning environments with individual learn-
ing from technology. They defined collaborative learning as: “Two or more stu-
dents per computer on the same task in a face-to-face setting or two or more
students collaborating either synchronously or asynchronously on the same task
electronically versus learning with computers individually—one computer per
student each working on his or her own task” (p. 457). Notice their definition
for collaborative learning includes data from groups working with computers
in a face-to-face environment as well as groups working through computers in
either synchronous or asynchronous formats.
Lou, Abrami, and d’Apollonia (2001) find that, when optimal condi-
tions are present, individual learning is better in collaborative compared to
individual settings with an effect size of .66, which is considered of moder-
ate practical significance. But the key to success lies in the details. What
factors should be present to realize these positive gains? Lou, Abrami, and
d’Apollonia (2001) recommend the following:
A. Provide team skills training for students who lack previous experience
working in a team.
B. Use specific collaborative learning structures that ensure interde-
pendence among members of a team and at the same time promote
individual accountability. Some examples of collaborative learning
structures are structured argumentation and problem-based learning
(to be summarized later in this chapter).
283.
Table 12.2. CSCLFactors That Make a Difference.
Factor Description Guidelines Citation
Outcome of Individual vs. group Group metrics may be independent Lou, Abrami, & d’Apollonia (2001);
Collaboration metrics; of individual outcomes meta-analysis; Jonassen, Lee, Yang,
discourse analysis Assumes that deeper discourse & Laffey (2005)
equals better learning
Group Size: from 2 to 5 Best size may depend on desired Lou, Abrami, & d’Apollonia (2001);
Composition Makeup: heterogeneous vs. outcomes; heterogeneous meta-analysis
homogeneous compositions generally favored
Technology Synchronous vs. Tool features should match outcome Kirschner, Strijbos, Kreijns, & Beers
asynchronous goals. Asynchronous better for reflec- (2004); Suthers, Vatrapu, Joseph,
Tools to support tion and longer time periods; synchro- Dwyer, & Medina (2005); McGill,
collaboration nous better for higher social presence. Nicol, Littlejohn, Gierson, Juster, &
Many common tools lack capability to Ion (2005); Jonassen, Lee, Yang, &
capture and display group thinking. Laffey (2005)
Need better groupware.
Task Assignment Near transfer CSCL lends itself well to far-transfer Jonassen, Lee, Yang, & Laffey (2005);
Far transfer —well ill-structured problem solving with Yetter, Gutkin, Saunders, Galloway,
structured groups of three to five. Mixed results Sebansky, & Song (2006); Kirsch-
Far transfer —ill structured with near and well-structured far- ner, Strijbos, Kreijns, & Beers (2004);
transfer assignments. Uribe, Klein, & Sullivan (2003)
284.
Group Roles, Instructor or student Student moderators may be better for DeWever, Van Winckle, & Valcke
Processes, and moderator groups of advanced learners when (2006); Nussbaum & Kardash
Instructions Assigned roles argumentation structures are used (2005); Campbell & Stasser (2006);
High or low structure Higher structures generally lead to Nussbaum (2005)
process better outcomes than low structure
Frequency of Specific instructions lead to better
interaction outcomes than general instructions
Time Limited vs. constrained CSCL outcomes take longer than Campbell & Stasser (2006)
individual outcomes
CSCL outcomes can exceed
individual outcomes if there is
ample processing time
Team Skills Yes or No Teamwork training leads to better Prichard, Bizo, & Stratford (2006)
Training outcomes as long as the trained
group remains intact
Learner Prior High vs. Low Factors that mediate CSCL among Uribe, Klein, & Sullivan (2003)
Knowledge high PK learners likely different from
those most appropriate for low PK
learners
Incentives The basis for awarding of Base points or grades on a synthesis Mayer, 2007; Slavin, Hurley, &
points or grades of individual outcomes rather than a Chamberlain (2003)
group product or individual products
alone
285.
268 e-Learning and the Science of Instruction
C. Create teams of heterogeneous pairs. Pairs maximize the involvement
of each participant. The more experienced member of the pair
benefits from tutoring the less experienced member, while the less
experienced member benefits from being tutored.
D. Use collaborative teams when the learning tasks are relatively near
transfer rather than ill-structured open-ended assignments.
In addition, based on extensive research on group learning in face-to-face settings
summarized by Slavin (1983) and Slavin, Hurley, and Chamberlain (2003), we
recommend that incentives such as grades or points be assigned to individuals
based on the achievement of each individual in the group, rather than based on
a single group product or on individual achievements unrelated to the achieve-
ments of other members in the team. For example, if a group works together on a
case study project, rather than assigning the same grade to each individual based
on the group product, team grades are based on an aggregation of individual
outcomes to a test or other individual measure of learning related to the project.
This evaluation strategy assures that each member of the group is accountable
not only for his or her own performance but for that of teammates.
Optimizing Group Products from CSCL
When your goal is a performance product, groups can outperform individuals.
Under optimal conditions, Lou, Abrami, and d’Apollonia (2001) found that
group products are better than individual products, with an effect size of 2
or more, indicating a very high practical significance! The research team con-
cludes: “When working together, the group is capable of doing more than any
single member by comparing alternative interpretations and solutions, correct-
ing each other’s misconceptions, and forming a more holistic picture of the
problem” (p. 479).
To optimize group performance:
A. Assign challenging tasks that can benefit from the perspectives and
expertise of several participants; ill-defined far-transfer tasks are best.
B. Construct groups of three to five members to provide sufficient
expertise to tackle a difficult task.
286.
L e ar n i n g To g e t h e r V i r t u a l l y 269
In the next section of this chapter we will look at research that evaluates
how various factors, including task assignments, technology, time limits,
group roles, and teamwork training can influence either group or individ-
ual outcomes. Our goal is not a comprehensive review of CSCL research.
That would require a book in itself. Rather, we seek to illustrate the diversity
in research questions, assigned tasks, outcome measures, and technologies
reflected in some representative recent reports.
Is Problem-Solving Learning Better with
CSCL or Solo?
Jonassen, Lee, Yang, and Laffey (2005) recommend that CSCL is best suited
to complex ill-defined tasks for which there is no single correct solution.
These types of tasks benefit from the collaboration of a group. Some exam-
ples include developing a patient treatment plan, designing a small business
website, or troubleshooting a unique equipment failure. The study reviewed
in this section evaluates learning a process to solve ill-defined problems as a
result of practice via CSCL compared to solo practice.
R ES E A R CH T H U M B N A IL
Problem Solving: Team Using Chat vs. Individual Solutions
Authors: Uribe, Klein, and Sullivan (2003)
Type of Study: Experimental
Task: Applying a structured problem-solving process to solve ill-structured problems
Outcome Measures: Individual scores of an essay describing a solution to an
ill-defined assessment problem
Teams: Heterogeneous pairs of college students
Technology: Synchronous chat
Comparison: Assessment scores of individuals who solved a practice problem in a
team via synchronous chat versus individuals who solved the problem alone
Result: Individuals working in pairs via synchronous chat learned more than
individuals working alone
287.
270 e-Learning and the Science of Instruction
In an experimental study, Uribe, Klein, and Sullivan (2003) compared indi-
vidual learning of a problem-solving process from pairs solving an assessment
problem collaboratively using synchronous chat to individuals solving the
assessment problem on their own. The study included three phases. First,
each participant individually completed web-based self-study training on a
four-step problem-solving process. After the instructional period, participants
were tested individually with a knowledge quiz to ensure learning of the pro-
cess. Quiz results were positive for all participants. In Phase 2, participants
were assigned to solve an ill-structured practice problem, either alone or with
a virtual partner using chat. In the third phase, each participant individually
completed an essay test that asked questions about the assessment problem
they solved in Phase 2. Individuals who worked with a partner scored higher
on the essay questions (60 percent average) than individuals who had worked
independently (50 percent average). The difference was significant, with a
small effect size of .11.
Virtual vs. Face-to-Face Group Decisions
How can group decision making benefit from collaborative technology?
In the study reviewed in this section, the decisions of teams working
face-to-face were compared with decisions made in a collaborative virtual
environment.
RE S EAR CH T H U M B N A I L
Team Decision Quality: Virtual vs. Face-to-Face Collaboration
Authors: Campbell and Stasser, 2006
Type of Study: Experimental
Task: Identify the guilty suspect in a crime case for which there was a correct
answer that could be derived only by sharing of information given to different
team members
288.
L e ar n i n g To g e t h e r V i r t u a l l y 271
Outcome Measures: Accuracy of group solutions to a crime decision task
Teams: Trios of college students in which each member was provided different rel-
evant case knowledge
Technology: Synchronous chat
Comparison: Synchronous chat versus face-to-face decision accuracy; ample versus
constrained time during synchronous chat
Result: Synchronous collaborators with plenty of time produced more accurate deci-
sions than face-to-face teams or synchronous collaborators with restricted time
Campbell and Stasser (2006) compared the accuracy of a decision task that
had a correct answer from three-person groups collaborating in a face-to-face
group with the accuracy of trios collaborating via synchronous chat. The
decision task involved a fictional homicide investigation with three suspects.
Each participant in the trios received a different packet of information about
the crime and the suspects. A correct solution required that all three team
members disclose and discuss the unique information that each had reviewed
in his or her packet.
Overall, the computer-mediated groups arrived at more correct solutions
(63 percent) than face-to-face groups (less than 20 percent), provided the
computer team was allocated sufficient discussion time. Some computer
teams were given only twenty minutes to solve the problem, whereas others
were instructed to take as long as they needed. The time-restricted computer-
mediated groups were much less accurate when compared to computer
groups given ample discussion time. The computer-mediated groups required
more time to arrive at their solutions than the face-to-face groups, resulting
in higher solution accuracy. The research team concluded that computer-
mediated discussions are more effective for decision making than face-to face
groups, provided virtual groups have sufficient working time. They suggest
that synchronous chat leads to more accurate decisions than face-to-face dis-
cussions due to parallel communications in chat, the ability to reference the
group discussion maintained in the text of the chat, as well as the anonymity
of the communications.
289.
272 e-Learning and the Science of Instruction
Software Representations to Support
Collaborative Work
How can computer interfaces more effectively represent and support collab-
orative work? For example, the comments in a traditional discussion board
are displayed chronologically. In a lengthy discussion it is challenging to
infer shared agreement or to make knowledge gained explicit. If you join an
ongoing discussion, it can be difficult to find relevant contributions, enter
your own ideas into a relevant context, or to make a determination of the
outcomes.
RE S EAR CH T H U M B N A I L
Problem Solving with Different Collaboration Interfaces
Authors: Suthers, Vatrapu, Joseph, Dwyer, and Medina (2005)
Type of Study: Experimental
Task: Solving a science problem
Outcome Measures: Accuracy of individual solutions to a science problem, conver-
gence of conclusions in essays
Technology: Asynchronous discussions
Teams: Pairs of college students
Comparison: Asynchronous discussions using discussion board, graphic representa-
tion, and both discussion board and graphic representation
Result: No differences in quality of solutions; greater idea convergence with graphic
representations
Suthers, Vatrapu, Joseph, Dwyer, and Medina (2005) evaluated the effec-
tiveness of three different interfaces to summarize and capture collabora-
tion decisions and data. They compared a traditional discussion board, the
graphic representation shown in Figure 12.4, and a mix of the discussion
board and graphic. The graphic representation uses symbols and lines to
290.
L e ar n i n g To g e t h e r V i r t u a l l y 273
Figure 12.4. A Graphical Interface to Capture Group Problem-Solving
Processes.
From Suthers, Vatrapu, Joseph, Dwyer, and Medina, 2005.
Reprinted with permission from D. Suthers.
encode facts, state hypotheses, and link facts to hypotheses. The goal of the
graphic interface is to represent a group discussion around scientific topics.
Pairs of college students were given science problems to solve along
with a number of short articles with relevant information. Teams had up
to 120 minutes to work asynchronously using one of the three different
interfaces. An asynchronous environment was simulated by imposing filler
activities during the 120-minute experimental period. Following the study
period, each participant worked alone to write an essay about the problem
he or she researched that stated the hypotheses considered, the evidence for
or against the hypotheses, and the conclusion reached. The research team
compared the solutions as well as the convergence in essay conclusions
among teams working with different interfaces. They found best conver-
gence among teams that used the graphic representation. However, there
were no significant differences in correct solutions to the problem.
291.
274 e-Learning and the Science of Instruction
Group Roles and Assignments in CSCL
The outcomes in face-to-face team learning assignments are affected by the
structure of the group process, including roles assigned to team members. In
this section we summarize two studies that examine the influence of team
member role assignments on CSCL interactions.
RE S EAR CH T H U M B N A I L
Roles in Problem-Based Learning (PBL) Online Discussions
Authors: De Wever, Van Winckle, and Valcke (2006)
Type of Study: Quasi experimental
Task: Development of treatment plans for clinical pediatric cases
Outcome Measures: Depth of group discussions
Teams: Groups of four or five medical interns
Technology: Asynchronous discussions
Comparison: Student versus instructor discussion moderation and alternative treat-
ment generation role
Results: Deeper case discussions with student moderators only when another stu-
dent generated treatment alternatives
DeWever, Van Winckle, and Valcke (2006) report on adapting a problem-
based learning program using asynchronous case discussions. Pediatric
interns met weekly for face-to-face case reviews. More frequent case discus-
sions were desired, but additional face-to-face meetings were not practical
due to staff schedules and ward activities. To supplement the face-to-face
meetings, the research team tested asynchronous discussions of authentic
cases, each extending over a two-week period. A complete case with diag-
nosis was included, along with access to electronic information resources.
For the first three days, each participant worked independently to develop a
patient treatment plan. Starting on day four, individual posts were opened
to everyone and each participant was required to post at least four additional
292.
L e ar n i n g To g e t h e r V i r t u a l l y 275
messages in which they supported their treatment plans with rationale, data,
and references.
Two different team roles were studied: moderator (student versus instruc-
tor) and alternatives generator (participant role versus no role). In some teams
one of the interns served as a moderator, while in other teams the instructor
moderated the discussions. A second variable was an assigned student role
to review posted treatment suggestions and develop alternative treatments.
Rather than direct measures of learning, the outcome measure was quality of
discussions within the different teams.
DeWever, Van Winckle, and Valcke (2006) found that students who were
assigned a moderator role were more likely to write higher-level contributions.
Further, higher-knowledge construction was evident in groups moderated by a
student, but only when one of the participants assumed the alternative treat-
ment role. In the absence of this specialized role, there were no differences
in the discussions of student-moderated or instructor-moderated discussions.
The research team suggests that, when a student develops alternatives and
the discussion is moderated by another student, there is greater freedom to
critique and respond to one another than when an instructor is moderating.
In this study there were no direct measures of learning. The outcome mea-
sure was ratings of the quality of the discussions among the different teams. In
addition, as medical interns, the background knowledge level of the participants
was relatively high compared to other studies in which participants had little
or no entry-level knowledge related to the experimental task. Different results
might be seen among learners more novice to the content. This study suggests
that discussions will differ depending on assigned roles within a team.
R ES E A R CH T H U M B N A IL
Different Team Goal Assignments
Author: Nussbaum, 2005
Type of Study: Experimental
Task: Online debates of issues such as the relationship between watching television
and violence in children
293.
276 e-Learning and the Science of Instruction
Outcome Measures: Type and complexity of group arguments during discussions
Teams: Trios of college students
Technology: Synchronous chat
Comparison: Different team goals such as persuade, explore, generate reasons, or
no goal
Result: Persuade and generate reasons goals resulted in more argumentation claims
The type of assignment made to a collaborative group can affect group out-
comes. Nussbaum (2005) compared the quality of arguments made by teams
using synchronous chat responding to the question: “Does watching TV cause
children to become more violent?” The type and complexity of team arguments
were analyzed as outcomes. As in the DeWever research, the outcome was an
analysis of the discussions of the group rather than individual learning.
Different teams were given different instructions. Some were assigned a
general goal, such as explore the question or write a persuasive discussion, or no
goal at all. Other teams were given specific goals, such as give reasons or state
counter-arguments. The asynchronous discussion spanned five days, during
which all participants were required to post two notes. The various goal assign-
ments resulted in arguments of varying quality.
The author concludes that goals to persuade and generate reasons had
the strongest effects, resulting in more argumentation claims. Specifically, the
author recommends that students should be explicitly told to think of as many
reasons as possible to support their positions.
In both the medical intern and the argumentation research summarized
in this section, we see that CSCL outcomes are influenced by the instruc-
tions given to the team as well as by specific roles assigned within the team.
Both studies measured the quality of the group discussions, so we do not
know how individual learning outcomes were affected.
Team-Building Skills and CSCL Outcomes
In the Lou, Abrami, and d’Apollonia (2001) meta-analysis, better individual
achievement outcomes are associated with better teamwork skills. A similar
result is reported by a study conducted comparing a year-long face-to-face
294.
L e ar n i n g To g e t h e r V i r t u a l l y 277
college course in which trained and untrained teams worked together to
accomplish various course assignments.
R ES E A R CH T H U M B N A IL
Team Skills Training
Authors: Prichard, Bizo, and Stratford (2006)
Type of Study: Naturalistic experimental
Task: Learning to report psychological research
Outcome Measures: Individual course scores and various individual ratings
Teams: Groups of five or six college students
Technology: Face-to-face teamwork
Comparison: Teams that had team skills training versus teams with no training
Result: Better outcomes for teams with teamwork training, only as long as the
trained team remained intact
Prichard, Bizo, and Stratford (2006) found that individuals working in face-
to-face teams that completed a one-day team skills training program earned
end-of-semester scores that were 6 percent higher than untrained teams. The
team-skills training included: setting objectives, problem solving, planning,
decision making, and time management. The team-skills training benefits
lasted as long as the teams that were trained together stayed together. How-
ever, when trained team members were reorganized into new teams the sec-
ond semester, the outcomes of the new teams were no better than those of
teams who had not been trained. In a follow-up experiment, another group
of teams was provided team-skills training and, rather than being reorganized
into new teams at the end of the semester, remained intact for the academic
year. These intact teams maintained their improved learning outcomes. The
authors suggest that team skills developed in a specific team may not trans-
fer from one team to another. They conclude that “These findings provide
empirical evidence that prior team-skills training has produced superior col-
laborative group work compared with that of students merely placed in unfa-
cilitated groups”(p. 129).
295.
278 e-Learning and the Science of Instruction
This study focused on face-to-face collaborative learning. If specific
elements of the teamwork training program such as setting objectives,
problem solving, decision making, and so forth, could be translated into
collaborative interfaces that supported those activities, perhaps the benefits
of team training could be magnified in a collaborative environment.
Collaborative Structures and CSCL Outcomes
Research in face-to-face collaborative learning summarized by Slavin (1983),
Slavin, Hurley, and Chamberlain (2003) and Mayer (2007), as well as the
Lou, Abrami, and d’Apollonia (2001) meta-analysis of virtual collaboration,
suggests that under appropriate conditions students can learn more together
than individually. A structured collaborative assignment is one critical condi-
tion to maximize benefits from group work. A second is accountability for
learning of each member of the team. Collaborative environments that give
general instructions such as “Discuss these issues” and that reward group
products rather than individual products may not lead to optimal results.
Collaborative Group Techniques
Collaborative structures that promote reliance of team members on each
other and also foster individual accountability have proven most effective in
face-to-face environments. In this section we review two structures that have
been used extensively in face-to-face collaborative learning environments:
structured controversy and problem-based learning. Structures such as these that
have been evaluated in face-to-face collaborative settings can serve as starting
points for the building of CSCL environments.
Structured Controversy
Wiley and Voss (1999) showed that individual learners assigned to write a pro
and con argument learned more than learners asked to write either a narration
or a summary. The deeper processing stimulated by synthesizing opposing
aspects of an issue led to more learning than merely writing a summary.
Developing alternative positions on an issue supported by facts is called
296.
L e ar n i n g To g e t h e r V i r t u a l l y 279
argumentation. Johnson and Johnson (1992) developed a structured meth-
odology for group argumentation called structured controversy.
The workflow for structured controversy is summarized in Figure 12.5.
Learners are assigned to heterogeneous teams of four. The teams are pre-
sented with an issue or problem that lends itself to a pro-and-con position.
The teams divide into pairs, each taking either the pro or con, and develop a
strong position for their perspective. Later, the team of four reconvenes and
one pair presents their argument to the other. After the presentation, the
receiving pair must state back the argument adequately to the presenting pair
to demonstrate their understanding of the presentation team’s position. Then
the pairs reverse roles. As a result, all team members develop an understand-
ing of both perspectives. After the argumentation, the full team moves into a
synthesis stage wherein the opposing perspectives are merged into a reasoned
position that culminates in a group report or presentation.
Figure 12.5. Structured Argumentation Collaborative Learning
Structure.
Phase 1: Review
Problem
PRO Team CON Team
Phase 2: Prepare and Deliver
Pro and Con Arguments
Phase 3: Develop
Synthesis
297.
280 e-Learning and the Science of Instruction
When comparing this structured controversy method with several
alternative structures, including traditional debates, individual learning,
or groups that stressed concurrence, the structured controversy method
proved more effective, with effect sizes ranging from .42 to .77 (Johnson &
Johnson, 1992).
The authors recommend the following elements for successful construc-
tive controversy:
• Ensure a cooperative context where the goal is understanding the
opposing views, followed by a synthesis of perspectives;
• Structure groups to include learners of mixed background knowledge
and ability;
• Provide access to rich and relevant information about the issues;
• Ensure adequate social skills to manage conflict; and
• Focus group interactions on rational arguments.
Structured controversy can use a combination of asynchronous and
synchronous facilities in a CSCL adaptation. For example, present an appli-
cation problem or case that lends itself to two or more alternative positions.
Provide links to relevant resources. Assign pairs to research and advocate for
one of the positions. Each pair can work asynchronously through email or
discussion boards to research their position and to develop their case, as well as
synchronously via telephone or online conferencing. Next each pair posts their
argument to an accessible online location and reviews opposing arguments. To
verify understanding of alternative positions, pairs could post their summaries
of the opposing arguments or state back the opposition positions in synchro-
nous sessions. To complete the exercise, the entire team of four develops a
project that represents a synthesis of all perspectives. Structured argumentation
ported to CSCL could benefit from a combination of asynchronous research
and reflection coupled with synchronous discussions.
Problem-Based Learning
A number of universities have adopted a specialized form of collaborative
learning called problem-based learning (PBL). Most PBL teams follow a
structured process whereby the team reviews a case together, each member
298.
L e ar n i n g To g e t h e r V i r t u a l l y 281
works on it individually, and then the team reconvenes to apply lessons
learned to the case. For example, the University of Maastricht in the Nether-
lands follows the following team process after reading a presented case such as
the Life of a Miserable Stomach, shown in Figure 12.6:
1. Clarify unknown terms and concepts.
2. Define the problem in the case.
3. Use brainstorming to analyze the problem by identifying plausible
explanations.
4. Critique the different explanations produced and work to draft a
coherent description of the problem.
5. Define the learning issues.
6. Engage in self-directed study to fill the gaps specified by the learning
issues.
7. Meet with the team to share learning and develop a final problem
solution.
Figure 12.6. A Case Problem Used in PBL.
From Schmidt and Moust, 2000.
The Miserable Life of a Stomach
The protagonist of our story is the stomach of a truck driver who
used to work shifts and who smokes a lot. The stomach developed
a gastric ulcer and so the smoking stopped. Stomach tablets are not
a regular part of the intake.
While on the highway in Southern Germany, our stomach had to
digest a heavy German lunch. Half an hour later, a severe abdomina
pain developed. The stomach had to expel the meal. Two tablets
of acetylsalicylic acid were inserted to relieve the pain.
A second extrusion some hours later contained a bit of blood. In
a hospital in Munich an endoscope was inserted. The stomach
needed to be operated upon in the near future. Explain.
Research reviews conclude that there is no clear evidence that PBL offers
significant learning advantages over traditional instructional approaches.
However, PBL medical students consistently report more positive attitudes
than students engaged in traditional courses (Hmelo-Silver, 2004).
299.
282 e-Learning and the Science of Instruction
How can PBL be adapted to CSCL? Valaitis, Sword, Jones, and Hodges
(2005) evaluated a PBL lesson for nursing students that used both asyn-
chronous and synchronous chat sessions. The focus of the lesson was Fetal
Alcohol Spectrum Disorder (FASD). Students begin the lesson by view-
ing an online video of a pregnant patient being interviewed by the nurse.
Students had access to a number of resources, including a patient history
(shown in Figure 12.7), a multimedia description of early fetal development,
and related articles and websites. In addition, students could email a vari-
ety of experts on FASD, including a public health nurse, a neonatologist,
and a legal guardian of two children with FASD. Figure 12.8 shows the
email interface to these resources. Student reactions to the case experts was
very positive. One participant commented: “So, having a real person with
real experience; that was really good,” noting that Ann Guardian was more
genuine than the characters in the PBL case videos (Valaitis, Sword, Jones, &
Hodges, 2005, p. 242).
Figure 12.7. A Patient History from a PBL Case.
With permission from Ruta Valaitis. Accessed December 7, 2005,
from www.fhs.mcmaster.ca/pblonline/scenarios.htm
300.
L e ar n i n g To g e t h e r V i r t u a l l y 283
Figure 12.8. Asynchronous Access to Experts During PBL Lesson.
Accessed December 7, 2005, from www.fhs.mcmaster.ca/pblonline/scenarios.htm
CSCL: The Bottom Line
Jonassen, Lee, Yang, and Laffey (2005) conclude their review of CSCL research
as follows: “More is unknown about the practice than is known. CSCL will
constitute one of the pivotal research issues of the next decade” (p. 264). We
do have evidence that under optimal conditions, learning collaboratively can
result in better outcomes than learning alone. Likewise, work products and
projects can, under some conditions, benefit from a collaborative approach.
However, what constitutes optimal conditions for one set of learners, desired
outcomes, and technology features is likely different from what is appropriate
for a different set. We can point to the following enablers that may promote
better individual or group outcomes from collaborative environments:
A. Group process structures that foster the accountability and
participation of each member of the team
B. Assignment of far-transfer problems to small heterogeneous groups
composed of three to five members
301.
284 e-Learning and the Science of Instruction
C. Use of asynchronous facilities for outcomes that benefit from
reflection and independent research; use of representational
mechanisms such as text or diagrams to maintain a record of the
communications, allow for parallel input, encode group agreements,
and support greater anonymity of discussions
D. Team-skill training for groups that have not had previous teamwork
experience
E. Group assignments and participant roles that promote deeper
processing
F. Clear guidance and objectives for team processes to avoid extraneous
mental processing
DE S I GN D I L E M M A : RES OLVED
In our chapter introduction, you considered the following options for collaborative
work in the database course:
A. A team project assignment to create a real-world database will result in
better individual learning than an individual project assignment.
B. A discussion board would have more far-reaching benefits than an
end-of-class project.
C. A team project would be best accomplished through synchronous
collaborative facilities using chat or audio.
D. Any collaborative assignments should include structured group roles and
processes for best results.
E. Not sure which options are correct.
Constructing an effective database is a far-transfer task because the generic steps
will require adaptation to each unique situation. Option A to assign a collaborative
case study is a good idea. The database created by a well-structured collaborative
team will likely be better than one designed by an individual working alone. How-
ever, in addition to evaluating the database constructed by a team as a whole, to
motivate mutual support to each participant’s learning, the instructor should base
302.
L e ar n i n g To g e t h e r V i r t u a l l y 285
group assessments on some measures of individual learning. A team score should
reflect some synthesis of individual scores.
Asynchronous discussions, as suggested in Option B, if appropriately structured,
can result in deep communications. Likewise, a discussion board can provide a
community resource for ongoing learning after a class. However, we do not have
evidence to support the cost benefits of a discussion board compared to other CSCL
alternatives such as a group project.
Option C recommends synchronous collaborative facilities. However, a team
project would likely benefit from at least some asynchronous work, since construct-
ing a database requires reflection and research. A combination of synchronous and
asynchronous collaboration might yield the best results.
Option D is correct. The course outcomes will be well served by adding struc-
tured roles and processes into whatever CSCL options they choose.
At this stage in the evolution of CSCL, we lack sufficient evidence on
which to predicate an ideal collaborative environment or even to know when
resources invested in such an environment will yield any significant organiza-
tional return.
W H AT T O LO O K F O R I N e - L E A R N I N G
In classes that focus on far-transfer outcomes, group projects or case
assignments that incorporate some asynchronous work to allow time for
reflection and individual research
Small teams with participants of diverse prior knowledge and background
Structured collaborative team processes that encourage individual participation
and accountability to the team outcome
Use of CSCL when there is adequate learning time to support team
discussions and product generation
Student evaluations that reflect the accomplishments of each member of the
team to encourage interdependence
303.
286 e-Learning and the Science of Instruction
COMING NEXT
Asynchronous forms of e-learning can use navigational devices such as menus
and links that grant learners many choices over elements of the course. In
Chapter 13, we review the options and benefits of offering control over pac-
ing, lesson topics, and instructional methods such as practice. How do these
levels of freedom affect learning? Who benefits most from learner control?
How should synchronous forms of e-learning that are more limited in learner
control options compensate for additional extraneous cognitive load? These
are some of the issues we review in Chapter 13.
Suggested Readings
Campbell, J., & Stasser, G. (2006). The influence of time and task demon-
strability on decision making in computer-mediated and face-to-face
groups. Small Group Research, 37 (3), 271–294.
Jonassen, D.H., Lee, C.B., Yang, C-C., & Laffey, J. (2005). The collaboration
principle in multimedia learning. In R.E. Mayer (Ed.), The Cambridge
handbook of multimedia learning. Newyork: Cambridge University Press.
Laboratory for Interactive Learning Technologies: lilt.ics.hawaii.edu/lilt/software/
belvedere/index.html
Lou, Y., Abrami, P.C., & d’Apollonia, S. (2001). Small group and individual
learning with technology: A meta-analysis. Review of Educational Research,
71(3), 449–521.
Uribe, D., Klein, J.D., & Sullivan, H. (2003). The effect of computer-mediated
collaborative learning on solving ill-defined problems. Educational Technology
Research and Development, 51(1), 5–19.
305.
CHAPTER OUTLINE
Learner ControlVersus Program Control
Three Types of Learner Control
Popularity of Learner Control
Do Learners Make Good Instructional Decisions?
Do You Know What You Think You Know? Calibration Accuracy
How Calibration Is Measured
Illusions of Knowing: Evidence for Poor Calibrations
Practice and Examples Improve Calibration Accuracy
Do Learners Like Lesson Features That Lead to Learning?
Psychological Reasons for Poor Learner Choices
Four Principles for Learner Control: Overview
Learner Control Principle 1: Give Experienced Learners Control
Who Learns What Best Under Learner Control?
Evidence for Benefits of Program Control
Evidence for Learner Control Later in Learning
Learner Control Principle 2: Make Important Instructional Events the Default
Learner Control Principle 3: Consider Adaptive Control
Four Formats for Adaptive Control
Dynamic Adaptive Control vs. Program Control
Adaptive Advisement vs. Adaptive Control
Shared Control
Learner Control Principle 4: Give Pacing Control
Manage Cognitive Load When Pacing Is Program-Controlled
Navigational Guidelines for Learner Control
Use Headings and Introductory Statements
Use Links Sparingly
Use Course Maps
Provide Basic Navigation Options
What We Don’t Know About Learner Control
306.
13
Who’s in Control?
GUIDELINESFOR e-LEARNING
N AV I G AT I O N
W H AT ’ S N E W I N T H I S C H A P T E R ?
L EARNER CONTROL is implemented by navigational features such as
menus and links that allow learners to select the topics and instructional
elements they prefer. In our first edition, we recommended that you adjust the
amount of learner control in asynchronous e-learning based on the prior knowl-
edge of your learners and the criticality of your training goals. There has been
relatively little new research on learner control since our first edition. In our
update, we summarize new research on adaptive control and adaptive advise-
ment designs in which instructional elements are dynamically personalized
based on learner performance. We introduce shared control as a new approach
to learner control in which both the program and the learner make decisions.
Based on the segmentation principle summarized in Chapter 9, we
recommend that in asynchronous e-learning, you always allow learners
289
307.
290 e-Learning and the Science of Instruction
control over pacing. Pacing control allows participants to progress forward
or backward at their own rates. Learner control is one of the features that
distinguishes asynchronous from synchronous forms of e-learning. Since
synchronous e-learning is instructor-led, by default it is usually under
instructor control. Instructor-controlled lessons have a greater potential to
overload learners. Therefore in virtual classroom events it is especially impor-
tant to apply multimedia principles that manage cognitive load.
DE S I GN D I L EM M A : YO U DEC IDE
The e-learning design team is discussing the navigation controls for the database
training currently under development:
Ben: “Here’s my first cut at the navigation controls. (See Figure 13.1.) We’ll
set it up so the learner can jump to any topic she wants and can skip les-
son topics she doesn’t find relevant. And I’m adding a lot of links so the
learner can jump to the practice exercises or examples if she wants them
or skip them if she feels she understands the concepts. I’ll also put in links
so learners can branch to definitions and to other relevant websites. That’s
Figure 13.1. Navigational Elements Designed for High Learner Control.
Menu
Tour
Introduction
Select
entities
Determine
Features
Assign
primary
keys The first step in constructing a relational database is to look at the data
Assign in the spreadsheet to determine which entities are important to track.
foreign Click on baby tables above to see an example.
keys Click here for a practice. Otherwise, select another topic.
Designate
relations
308.
Who’s in Control? 291
what people expect on the Internet. They are used to going where they
want and doing what they want.”
Reshmi: “But Ben, learning a new skill is not the same as surfing for information.
We are building the lessons and topics in a logical sequence and includ-
ing worked examples and practice exercises that should not be skipped.
I think all those navigational features you’ve designed jeopardize the
integrity of our training design. Having to make so many choices will only
confuse the learners.”
Ben: “The new generation of learners is used to make these kinds of choices.
They know how to Google for any information they want! You instructional
folks have to quit holding learners by the hand. And they will like the
training much better if they can make their own choices. The whole point
of the online world is choices—take those away and you lose the power of
e-learning!
Based on your own experience or intuition, which of the following options would
you select:
A. Ben is correct. The “digital natives” are used to high levels of learner con-
trol and will be turned off by excessive guidance.
B. Reshmi is correct. Learners do not make good decisions about what to
study and what to skip. Program control will result in better learning.
C. Reshmi and Ben can compromise by providing learner control and at
the same time giving learners guidance about what options they should
select.
D. Not sure which options are best.
Control over the content and pace of a lesson is a common feature of asyn-
chronous e-learning. Certainly the underlying scheme of the Internet is
freedom of choice. How effective is learner control in training? What are
the tradeoffs between learner control and program control? Fortunately,
we have evidence from research and from cognitive theory to guide our
decisions.
309.
292 e-Learning and the Science of Instruction
Learner Control Versus Program Control
In contrast to classroom and synchronous e-learning, asynchronous e-learning
can be designed to allow learners to select the topics they want, control the
pace at which they progress, and decide whether to bypass some lesson ele-
ments such as examples or practice exercises. e-Learning programs that offer
these choices are considered high in learner control. In contrast, when the
course and lesson offer few learner options, the instruction is under program
control. Most synchronous forms of e-learning operate in program control
mode—also called instructional control. Instructor-led virtual classrooms typi-
cally progress at a single pace, follow a linear sequence, and use one set of
teaching techniques. The instructor facilitates a single learning path. On the
other hand, asynchronous e-learning can offer many or few options and thus
can be designed to be learner controlled or program controlled.
Three Types of Learner Control
Although the term “learner control” is often used generically, the actual type of
control varies. Thus, two courses that are depicted as “high in learner control”
may in fact offer quite different learner control options. In general, control
options fall into three arenas:
1. Content Sequencing. Learners can control the order of the lessons,
topics, and screens within a lesson. Many e-courses, such as the
design in Figure 13.1, allow content control through a course
menu from which learners select topics in any sequence they wish.
Likewise, links placed in lessons can lead to additional pages in the
course or to alternative websites with related information.
2. Pacing. Learners can control the time spent on each lesson page.
With the exception of short video or audio sequences, a standard
adopted in virtually all asynchronous e-learning, allows learners to
progress through the training at their own rate, spending as much
or as little time as they wish on any given screen. Likewise, options
to move backward or to exit are made available on every screen.
A more extensive form of pacing control allows learners to use
slider bars or rollers to move through the content or includes fast
forward, rewind, pause, and play buttons.
310.
Who’s in Control? 293
3. Access to Learning Support. Learners can control instructional com-
ponents of lessons such as examples or practice exercises. Within a
given lesson, navigation buttons, links, or tabs lead to course objec-
tives, definitions, additional references, coaches, examples, help sys-
tems, or practice exercises. In contrast, a program-controlled lesson
provides most of these instructional components by default as the
learners click the forward button.
Figure 13.2 shows a screen for an asynchronous course that allows control
over all three of these arenas. At the bottom right of the screen, the direc-
tional arrows provide for movement forward or backward at the learner’s
own pace. The course uses Microsoft standard control buttons in the
upper-right-hand corner of the screen as well as an on-screen button to exit.
In the left-hand frame, the course map allows learners to select lessons in any
sequence. Within the central lesson frame, the learner can decide to study
the examples by clicking on the thumbnail sample screens to enlarge them.
Learners can also select a practice exercise by either clicking on the link above
the examples or on the navigational tab on the right-hand side. In addition,
Figure 13.2. A Lesson with Multiple Navigational Control Elements.
With permission from Element K.
Selection of
Definitions
Lesson
Menu
Selection of
Practice
Selection of
Examples
Pacing
311.
294 e-Learning and the Science of Instruction
embedded links lead to definitions of terms. Table 13.1 summarizes the most
common techniques used to implement various forms of learner control in
asynchronous e-learning.
Table 13.1. Common Navigational Techniques Used in Asynchronous e-Learning.
Technique Description Examples
Course and lesson Allow learners to Figures 13.1 and 13.2
menus in left-hand select specific lessons both use left window
frame, pull-down and topics within a menu lists
window, or section tabs lesson or a course
Links placed within Allow learners to Figures 13.1 and 13.2
teaching frame access content from include links leading
other sites on the to definitions or
Internet or from other practice exercises
sections within the course
Pop-ups or Provide additional Figure 13.3 includes
mouse-overs information without rollover functionality;
having when the learner
to leave the screen clicks on a screen
icon, a small window
explains its functions
Buttons to activate Permit control of The database lesson
forward, backward, pacing within a shown in Figure 13.1
and quit options lesson and are standard includes buttons for
features in asynchronous audio controls,
e-learning; more movement forward,
sophisticated buttons backward, and exit
allow for fast forward,
rewind, pause, and play
Guided tours Overviews of course Typically used in courses
resources accessible that offer very high learner
from the main menu control, such as game-type
screen interfaces with multiple
paths and interface options
312.
Who’s in Control? 295
Figure 13.3. A Rollover Explains Screen Functionality.
Credit: Mark A. Palmer.
Popularity of Learner Control
Learners like learner control! To the extent that student appeal is a major goal
of your instructional projects, learner control is a definite satisfier. Given the
high control features inherent on the Internet, it is likely that learners will
expect the same kind of freedom in e-learning courses.
Rather than advocate for or against learner control, we provide guidelines
and illustrations for when and how learner control is best used. Additionally, we
summarize both the evidence and the psychological reasons for these guidelines
to help you adapt them to your own unique situations. Learner control can be
effective if learners are able to make accurate decisions about their learning needs.
If learners have a good sense of what they know and what learning support
they need to reach their goals, they can make good use of navigation options.
However, you might wonder, how accurate are learner self-assessments?
Do Learners Make Good Instructional Decisions?
The extent to which learners make accurate determinations of their exist-
ing knowledge will influence the kinds of decisions they make in a highly
313.
296 e-Learning and the Science of Instruction
learner-controlled environment. For example, if learners can accurately assess
which topics they do and do not comprehend, they can make good selections
about topics to study and how much time and effort to put into studying
those topics. In short, they are capable of good achievement under conditions
of learner control. We have two lines of evidence addressing this question:
calibration accuracy and student lesson ratings.
Do You Know What You Think You Know?
Calibration Accuracy
Suppose you have to take a test on basic statistics. Prior to taking the test,
you are asked to estimate your level of confidence in your knowledge. You
know that even though you took statistics in college, you are a little rusty
on some of the formulas, but you figure that you can score around 70 per-
cent. After taking the test, you find your actual score is 55 percent. The
correlation between your confidence estimate and your actual performance
is called calibration. Had you guessed 55 percent, your calibration would
have been perfect. Test your own calibration now by answering this question:
What is the capital of Australia? As you state your answer, also estimate your
confidence in your answer as high, medium, or low. We will return to this
example later.
How Calibration Is Measured
In a typical calibration experiment, learners read a text and then make a
confidence rating about their accuracy in responding to test questions about
the text. The correlation between their confidence ratings, typically on a
1 to 6 scale, and their actual test score is the calibration metric. If there is
no relationship between confidence and accuracy, the correlation is close
to 0. Calibration is an important skill. If learners are well-calibrated, they
can make accurate estimates of their knowledge and should be able to make
appropriate instructional decisions in courses high in learner control. The
focus of calibration measurement is not so much on what we actually know,
but on the accuracy of what we think we know. If you don’t think you know
much and in fact your test score is low, you have good calibration.
314.
Who’s in Control? 297
Illusions of Knowing: Evidence for Poor Calibrations
Although most of us may feel we have a general sense of what we do and do
not know, our specific calibration accuracy tends to be poor (Stone, 2000).
Glenberg and his associates (1987) found calibration correlations close to 0,
concluding that “contrary to intuition, poor calibration of comprehension is
the rule, rather than the exception” (p. 119). Eva, Cunnington, Reiter, Keane,
and Norman (2004) report poor correlations between medical students’ esti-
mates of their knowledge and their test scores. When comparing knowledge
estimates among year 1, year 2, and year 3 medical students, there was no
evidence that self-assessments improved with increasing seniority. The team
concludes that “Self-assessment of performance remains a poor predictor of
actual performance” (p. 222). Glenberg, Wilkinson, and Epstein (1992) refer
to the subjective assessment of knowledge as “illusions of knowing.”
By the way, the capital of Australia is not Sydney, as many people guess with
high confidence. It is Canberra. If you guessed Sydney with low confidence OR
if you guessed Canberra with high confidence, your calibration is high!
Practice and Examples Improve Calibration Accuracy
In comparing calibration of individuals before and after taking a test,
accuracy is generally better after responding to test questions than before.
Therefore, providing questions in training should lead to more accurate
self-assessments. Walczyk and Hall (1989) confirmed this relationship by
comparing the calibration of learners who studied using four resources: text
alone, text plus examples, text plus questions, and text plus examples and
questions. Calibration was best among those who studied from the version
with examples and questions. Along similar lines, a pretest that matches the
knowledge and skills of post-tests has been reported to improve calibration
(Glenberg, Sanocki, Epstein, & Morris, 1987).
Do Learners Like Lesson Features That Lead to Learning?
Is there a correlation between actual learning and learner ratings of how
much they learned and liked the instruction? Dixon (1990) compared course
ratings with actual learning for more than 1,400 employees who participated
315.
298 e-Learning and the Science of Instruction
in classroom training on implementation of a new manufacturing process.
At the end of the class, learners completed a rating form in which they
assessed the amount of new information they learned, rated their enjoy-
ment of the session, and rated the skill of the instructor. These ratings were
then correlated with the amount of actual learning determined by a valid
post-test. The result? There was no correlation between ratings and actual
learning.
Do students learn more when matched to their preferences in lesson
features? Schnackenberg, Sullivan, Leader, and Jones (1998) surveyed par-
ticipants before taking a course regarding their preferences for amount
of practice—high or low. Participants were assigned to two e-learning
courses—one with many practice exercises and a second identical course
with half the amount of practice. Half the learners were matched to their
preferences and half mismatched. Regardless of their preference, those
assigned to the full practice version achieved significantly higher scores on
the post-test than those in the shorter version. The authors conclude that
“the results are more consistent with past evidence that students’ prefer-
ences and judgments often may not be good indicators of the way they
learn best” (p. 14).
Psychological Reasons for Poor Learner Choices
Metacognition refers to learners’ awareness and control of their own learn-
ing processes, such as how well they understand a lesson or how best to
study the material in a lesson. Metacognition is the mind’s operating sys-
tem. In short, metacognition supports mental self-awareness. Individuals
with high metacognitive skills set realistic learning goals and use effective
study strategies. They have high levels of learning management skills. For
example, if faced with a certification test, they would plan a study sched-
ule. Based on accurate self-assessments of their current strengths and weak-
nesses, they would focus their time and efforts on the topics most needed
for achievement. They would use appropriate study techniques based on
an accurate assessment of the certification requirements. In contrast, learn-
ers with poor metacognitive skills are prone to poor understanding of how
they learn, which will lead to flawed decisions under conditions of high
learner control.
316.
Who’s in Control? 299
Four Principles for Learner Control: Overview
How can you best apply the evidence and the psychology behind learner control
to your design of effective e-courses? Based on empirical evidence, we recom-
mend four guidelines for the best use of learner control to optimize learning:
1. Use learner control for learners with high prior knowledge and
good metacognitive skills as well as in advanced lessons or courses.
2. When learner control is used, design the default navigation options
to lead to important instructional course elements.
3. Design some form of adaptive control that tailors learning to indi-
vidual needs.
4. Apply the Segmentation Principle described in Chapter 9 by allowing
control over pacing in asynchronous e-learning; manage cognitive load
in instructor-controlled environments such as synchronous e-learning.
LEARNER CONTROL PRINCIPLE 1
Give Experienced Learners Control
As we have seen, learners prefer full control over their instructional options, but
often don’t make good judgments about their instructional needs—especially
those who are novice to the content and/or who lack good metacognitive skills.
Hence the instructional professional must consider the multiple tradeoffs of
learner control, including learner satisfaction, the profile of the target learners,
the cost of designing learner-controlled instruction, and the criticality of skills
being taught. Fortunately, there are design options that can provide both learner
control and instructional effectiveness!
Who Learns What Best Under Learner Control?
A review of research on learner versus program control concludes that learners
with little prior knowledge of the subject as well as poor metacognitive skills are
likely to do better with program control—especially in high-complexity courses
(Steinberg, 1989). Learner control is more likely to be successful when:
• Learners have prior knowledge of the content and skills involved in
the training;
317.
300 e-Learning and the Science of Instruction
• The training is a more advanced lesson in a course or a more
advanced course in a curriculum;
• Learners have good metacognitive skills; and/or
• The course is of low complexity.
Evidence for Benefits of Program Control
Gay (1986) found that low-prior-knowledge students learned more under pro-
gram control. Figure 13.4 shows learning outcomes from high- and low-prior-
knowledge students under learner and program control. In this experiment,
individuals in the learner control version could control topic sequencing, pre-
sentation mode (video, audio, graphics, or text), number of examples, amount
of practice, and depth of study. Those in program control could control their
pacing only. As you can see, while low-prior-knowledge learners had low scores
under learner control, high-prior-knowledge learners did well under either
Figure 13.4. Low-Prior-Knowledge Students Learn Least Under Learner
Control.
Based on data from Gay, 1986.
SD = Significant difference Learner Control
20 Program Control
18
16
14
12
10
8
SD
6
4
2
0
High Prior Knowledge Low Prior Knowledge
318.
Who’s in Control? 301
condition. Gay (1986) concludes: “The results demonstrate that not all subjects
were capable of making appropriate decisions. The low-knowledge students prac-
ticed too little and emphasized areas with which they already had familiarity. In
summary, low-prior-knowledge subjects did not use good learning strategies and
made poor sequencing decisions under learner controlled treatment”(p. 227).
Young (1996) compared outcomes of learners with high and low self-
regulatory (metacognitive) skills who took four e-lessons in either a learner-
control or program-control mode. Under learner control, participants could
select or bypass definitions, examples, and practice exercises, whereas those
in the program-controlled version were presented with all the above options.
Those in the learner-controlled version looked at less than 50 percent of
the total number of screens available. As summarized in Table 13.2, Young
found that learners with low metacognitive skills learned less in the learner-
controlled mode than any of the other three groups.
Table 13.2. Test Scores of High and Low Metacognitive Learners Studying Under
Learner or Program Control.
From Young, 1996.
Learner-Controlled Program-Controlled
Low Metacognitive Skill 20 percent 79 percent
High Metacognitive Skill 60 percent 82 percent
Overall, there is a consistent pattern in which too much learner control can be
detrimental to learners with either low prior knowledge or metacognitive skill.
Evidence for Learner Control Later in Learning
A computer-based lesson in chemistry compared learning from program
control and learner control over the sequence of tasks and number of practice
exercises completed (Lee & Lee, 1991). Learning was compared during early
stages of learning versus later stages of learning, when learners would have
acquired a knowledge base. Program control gave better results during initial
learning, while learner control was more effective at later stages. This outcome
319.
302 e-Learning and the Science of Instruction
supports our conclusion that learners with greater prior knowledge are able to
make more appropriate decisions under conditions of learner control. Based
on evidence to date, we recommend that, when selecting or designing course-
ware for novice learners, look for courses with greater program control—at
least in the beginning lessons in a course.
LEARNER CONTROL PRINCIPLE 2
Make Important Instructional Events the Default
We saw in Chapter 11 that practice is an important instructional method that
leads to expertise. We also know that learners prefer learner control, and in
many e-learning environments, they can easily drop out if not satisfied. There-
fore, if you opt for high learner control, set the default navigation option to
lead to important instructional elements such as practice exercises. In other
words, require the learner to make a deliberate choice to bypass practice.
Research by Schnackenberg and Sullivan (2000) supports this guideline.
Two navigational versions of the same lesson were designed. As illustrated
in Figure 13.5, in one version pressing “continue” bypassed practice, while in
the other version pressing “continue” led to practice. In the “more practice”
Figure 13.5. Default Navigation Options That Bypass Practice (Version 1)
Compared to Those That Lead to Practice (Version 2).
Continue Continue
Version 1 Version 2
Viewed 35% Viewed 68%
of Screens of Screens
Next Topic Practice
320.
Who’s in Control? 303
default (Version 2), participants viewed nearly twice as many of the screens
as those in version 1 and scored higher on the final test.
Programs that make a high amount of practice available as the default
route are more likely to result in higher achievement than those that make
less practice available as the default route. Schnackenberg and Sullivan (2000)
suggest that since learner-controlled programs (a) have no instructional
advantages, (b) have been shown in other studies to be disadvantageous for
low-ability learners, and (c) cost more than program control, program con-
trol should be a preferred mode.
However, their learner population consisted of students taking a required
university course. In environments in which learners have greater freedom
about whether to take or complete e-learning, a designer cannot downplay user
preferences to the extent recommended in this study. When designing programs
with high learner control, set navigation controls so that critical aspects of the
program (such as examples or practice exercises) are the default options.
LEARNER CONTROL PRINCIPLE 3
Consider Adaptive Control
In adaptive control (also called personalized instruction or user modeling), the
program dynamically adjusts lesson content based on an evaluation of learner
responses. If learners do better on an exercise, the program offers more chal-
lenging exercises. Conversely, if learners do poorly, the program offers more
instruction or easier exercises. Adaptive control has proven to yield higher
achievement than learner control (Tennyson, Tennyson, & Rothen, 1980).
Four Formats for Adaptive Control
Four ways to implement adaptive control are illustrated in Figure 13.6. An
early type of adaptive control still used today involves branching learners to dif-
ferent lessons or topics based on pretest results. We refer to this form of adap-
tive control as static adaptive control. Static adaptive control defines learner
needs based on a single event—a pretest for example. More recent forms of
adaptive control are dynamic. That is, they adjust instructional elements based
on an ongoing assessment of learner progress.
321.
304 e-Learning and the Science of Instruction
Figure 13.6. Four Forms of Adaptive Control.
Static Branching Dynamic Branching Advisement Shared Control
Pretest Practice Practice Practice
Lesson N Y N Y N Y
1 Correct? Correct? Correct?
Lesson
2
Lesson Easier Harder Advice Advice Easier Harder
3 Practice 2 Practice 2 A B Practice 2 Practice 1
OR OR
Easier Harder
Practice 2 Practice 2
Dynamic Adaptive Control vs. Program Control
Salden, Paas, Broers, and Van Merrienboer (2004) confirmed the advantages
of dynamic adaptive e-learning. They compared the effectiveness of program
control and dynamic adaptive control on learning of simulated air traf-
fic control situations displayed on radar screens. Program control assigned
each learner twenty practice tasks selecting two tasks at each of ten com-
plexity levels. Dynamic adaptive control adjusted number and complexity
of practice tasks based on learners’ performance on practice tasks. There
were no differences in learning on the final test between program and adap-
tive groups. However, the program-controlled version required the greatest
time to complete. In the program-controlled version all learners received
twenty tasks, whereas learners in adaptive lessons completed an average of
ten tasks.
The team concludes that “dynamic task selection leads to more efficient
training than a fixed, predetermined training sequence that is not adjusted
to the individual student. Although the fixed condition did attain the
same performance score as the … dynamic conditions, its costs in terms of
time and mental effort to achieve this performance level were substantially
higher” (p. 168).
322.
Who’s in Control? 305
Adaptive Advisement vs. Adaptive Control
Advisement is a variation of adaptive control that leaves learner control in
place. Advisement may be generic or adaptive. Generic advise offers general
learning tips such as “We recommend that you take these topics in the order
listed.” All learners receive the same advice. In adaptive advisement, the com-
puter program assesses learners’ needs based on their responses, similar to the
adaptive control designs described previously. However, rather than automati-
cally branching learners to appropriate sections of the instruction, the program
makes recommendations regarding what the learner should select next. In the
end, the learner maintains control and is free to ignore or heed the advice.
Bell and Kozlowski (2002) compared learner control to adaptive guid-
ance on a radar tracking simulation similar to the air traffic control tasks
described previously. Both learner-control and adaptive-guidance lessons pro-
vided feedback regarding performance after each practice session. However,
in the adaptive-guidance lessons, students received recommendations regard-
ing what actions they could take to improve deficiencies based on their per-
formance on the practice task. Specifically, they were told what areas needed
improvement and how to best sequence learning and practice. The team
found that learners in adaptive guidance spent over 25 percent more time
studying and practiced almost twice as many relevant topics, compared to
those in the learner-controlled program. Those in the adaptive-guidance
lessons performed better on the final test on far-transfer tasks, although not
on basic-knowledge items.
There are two main advantages to adaptive instruction with advisement.
First, adaptive instruction leads to better learning outcomes than learner
control and more efficient instruction than program control. Second, you
still keep the popular learner-control features. The disadvantage of adaptive
advisement is the time required to construct and validate decision logic, as
well as to write appropriate recommendations.
We recommend that you consider the cost benefit of building advisement
programs in terms of the criticality of the learning and the potential savings
in learning time. If your training tasks have high criticality and/or your
learner population is heterogeneous, adaptive designs may have cost benefit.
However, when most of the audience is likely to be novice and development
323.
306 e-Learning and the Science of Instruction
budgets or time is limited, we recommend program control or learner con-
trol with generic advisement.
Shared Control
We saw that, by using adaptive advisement, you can give learners full control
and they will make better decisions based on personalized advice. Another
control alternative is shared control. In shared control, the program makes
some decisions and leaves others to the learner. For example, based on learner
performance on practice questions, the program may assign the learner to
tasks of a higher or lower level of complexity or to practice exercises with
greater or lesser amounts of instructional support. Within those levels, how-
ever, the learner may be given a choice of alternative tasks with diverse con-
text or surface features.
Corbalan, Kester, and Van Merrienboer (2006) tested a shared control
approach in a course on dietetics. The program included a database con-
taining tasks of varied complexity, varying levels of instructional support,
and different surface features such as different people with varied genders,
weight, age, energy intake, diet, and so forth. Based on a dynamic calculation
of learner expertise, the program offers several tasks, each at the appropri-
ate level of complexity and support. The task options vary regarding surface
features such as the specifics of the client’s diet, weight, and so forth. The
learner can select the task he or she prefers. In shared control, the program
makes decisions regarding task complexity and support and the learner makes
decisions regarding the specific task. In a pilot study, the research team found
that those working with shared control learned more than those working
under full adaptive control. The effect sizes, however, were small, suggesting
relatively little gain for the resources invested.
The concept of shared control offers some flexible options for a balance of
program and learner control. A disadvantage to shared control is the number
of tasks that must be created. Having to create multiple surface feature tasks
for varying levels of task complexity and instructional support will require
additional resources, compared to a pure adaptive guidance approach or to
program control. We will need more evidence showing the benefits of shared
control before recommending this approach.
324.
Who’s in Control? 307
LEARNER CONTROL PRINCIPLE 4
Give Pacing Control
Most asynchronous e-learning programs allow learners to proceed at their
own pace by pressing the “forward” button. Video or animated demonstra-
tions typically have slider bar controls indicating progress as well as “replay”
and “quit” options. Recent research by Mayer and Chandler (2001), Mayer,
Dow, and Mayer (2003), and Mayer and Jackson (2005) summarized in
Chapter 9 recommends that asynchronous e-learning be divided into small
chunks that learners access at their own pace. In Chapter 9 we refer to this
guideline as the Segmentation Principle.
Manage Cognitive Load When Pacing Is Program-Controlled
Pacing control is an important feature that distinguishes asynchronous from
synchronous e-learning. Just as in the face-to-face classroom, the rate of les-
son progress in virtual classrooms is typically controlled by the instructor.
Based on the research on learner control of pacing, these environments pose
a higher risk of cognitive overload than self-paced media. Therefore, those
engaged in design and delivery of virtual classrooms should pay special atten-
tion to the multimedia principles we summarized throughout the book. For
more details on managing cognitive load in the virtual classroom, see The
New Virtual Classroom by Clark and Kwinn (2007).
Navigational Guidelines for Learner Control
Screen titles, embedded topic headers, topic menus, course maps, links, and
movement buttons (forward, backward, and exit) are common navigational
elements that influence comprehension. What evidence do we have for the
benefits of various navigational elements commonly used in e-learning?
Use Headings and Introductory Statements
Content representations such as headings and introductory sentences improve
memory and comprehension in traditional text documents. For example,
325.
308 e-Learning and the Science of Instruction
Lorch, Lorch, Ritchey, McGovern, and Coleman (2001) asked readers to
provide summaries of texts that included headings for half of the paragraphs.
They found that the summaries included more content from paragraphs
with headers and less from paragraphs lacking headers. Mayer (2005b) refers
to headings as a form of signaling—providing cues concerning the impor-
tant information in a lesson. We recommend that similar devices be used in
e-learning programs. Screen headings, for example, might include the lesson
title followed by the topic. On-screen text blocks and visuals should likewise
be signaled with brief descriptive labels similar to paper documents.
Use Links Sparingly
Links that take the learner off the teaching screen as well as links leading to
important instructional events should be used sparingly. By definition, links
signal to the user that the information is adjunct or peripheral to the site.
Learners will bypass many links. Based on the research described previously,
we discourage using links for access to essential skill building elements such
as worked examples or practice, especially with novice audiences.
Neiderhauser, Reynolds, Salmen, and Skolmoski (2000) presented two
related concepts in two separate lessons. In each lesson, links led learners to
correlated information about the concept in the other lesson. For example,
if reading about the benefits of Concept A in Lesson 1, a link would bring
up benefits of Concept B in Lesson 2 for purposes of contrast. They found
that nearly half the learners frequently made use of these links. The other half
either never used the links or used them briefly before abandoning them in
favor of a more linear progression where they moved through one lesson from
start to finish before moving to the other. Contrary to the authors’ expecta-
tions, they found that extensive use of the links was negatively related to learn-
ing. They attribute their findings to adverse impact of hypertext navigation on
cognitive load.
These findings may reflect another example of the contiguity principle
discussed in Chapter 4, where learning suffers from separated information
that requires the learners to perform the integration themselves. The action of
selecting a link and relating contrasting information to the primary instruc-
tional material may increase extraneous cognitive load similar to asking learn-
ers to integrate explanatory text with pictures that are physically separated.
310 e-Learning and the Science of Instruction
Research has been mixed on the contribution of course maps to learning.
Neiderhauser, Reynolds, Salmen, and Skolmoski (2000) included a topic
map containing a graphic representation of the hierarchical structure of the
hypertext. Learners could access any screen in the hypertext from the topic
map. A trace of user paths found that many learners did access the topic map
frequently, but rarely used it to navigate. Most would access the map, review
the levels, and return to where they were reading. A few participants never
accessed the topic map. In correlating map use with learning, the research
team found only a slight benefit.
Potelle and Rouet (2003) compared comprehension of a hypertext
between novice and content specialists for the three menu layouts shown
in Figure 13.7: an alphabetical list, a hierarchical map, and a network map.
Low-knowledge participants learned most from the hierarchical map, whereas
the type of map made no difference to high-prior-knowledge participants.
It may be that course maps are less important for navigational control than
for providing learners with an advance orientation to the content structure.
Novice learners may benefit most from such an orientation.
Shapiro (2000) compared learning from two versions of site maps for
hypertext on a fictitious world of animals. One map version focused on
animal categories. For example, a main menu item of reptiles included
a submenu of desert shark, fat tail lizard, and so forth. The other map
version focused on ecosystems. For example, a main menu item of desert
included a submenu of long plume quail, fin lizard, and so forth. Half
of the students were given learning goals pertaining to animal categories,
whereas the other half were given goals pertaining to ecosystems. The focus
of the map had a strong effect on learning, whereas the learning goals did
not. Shapiro (2005) suggests that: “The influence of a site map can be
powerful enough not only to guide the structure of a learner’s internal
representations, but also to overshadow the effect of a learning goal during
that process” (p. 317).
We recommend the following guidelines regarding course maps:
• Consider using course maps for courses that are lengthy and complex
and/or for learners who are novice to the content.
328.
Who’s in Control? 311
• Use a simple hierarchical structure.
• If your content will apply to learners with different tasks and instruc-
tional goals, consider multiple versions of a course map adapted to
the instructional goals most appropriate to different learners.
Provide Basic Navigation Options
In asynchronous e-learning, make elements for forward and backward move-
ment, replay of audio and video, course exit, and menu reference easily acces-
sible from every display. In courses that use scrolling pages, navigation should
be accessible from both the top and bottom of the page to avoid overloading
learners with unnecessary mouse work (having to scroll back to the top of
the page to click “next”). Additionally, some sort of a progress indicator such
as “Page 1 of 10” is useful to learners so that they know where they are in a
topic and how far they have to go to complete it.
What We Don’t Know About Learner Control
Although we have seen evidence that learners low in prior knowledge or meta-
cognitive skills benefit from program control, we need to know more about
the relationship between prior knowledge, metacognitive skills, and various
navigational control options. For example, do high metacognitive skills over-
ride low prior knowledge? Do learners with high metacognitive skills benefit
from a different type of navigational structure than those with low metacogni-
tive skills?
Although adaptive advisement seems to have advantages compared to
program control or learner control, we need more information on the cost
benefit of dynamic adaptation. Under what circumstances will the resource
investment made in adaptive designs pay off in more efficient learning
outcomes?
How should navigational elements such as course maps and lesson menus
be displayed? Is there an advantage to having them always visible, as in a left
navigation display, or will a drop down course map be as effective?
329.
312 e-Learning and the Science of Instruction
DE S I GN D I L E M M A : RES OLVED
Ben and Reshmi’s disagreement about the amount and type of learner control to
use in the database lesson led to the following options:
A. Ben is correct. The “digital natives” are experienced with high levels of
learner control and will be turned off by excessive guidance.
B. Reshmi is correct. Learners do not make good decisions about what to
study and what to skip. Program control will result in better learning.
C. Reshmi and Ben can compromise by providing learner control but giving
learners guidance about what options they should select.
D. Not sure which options are best.
Based on the research summarized in this chapter, we recommend providing learner
control but offering generic guidance by suggesting that learners proceed through
the lesson in the prescribed sequence. If budget and time allow, providing personal-
ized adaptive advice based on responses to practice questions might lead to more
efficient learning. Adaptive advice is most beneficial when considerable instruc-
tional efficiencies can be gained by highly paid workers, when the learners are likely
to be heterogeneous regarding their prior knowledge and learning abilities, and
when task criticality demands a high standard of performance for all learners.
W H AT T O LO O K F O R I N e - L E A R N I N G
Consider high learner control when:
Your goal is primarily to provide information rather than to build skills
Your content is relatively low in complexity and topics are not logically
interdependent
Your audience is likely to have high metacognitive or learning self-regulation skills
Your audience is likely to have prior knowledge of the content
The lessons or courses are later in a series so that learners have built a
knowledge base
330.
Who’s in Control? 313
Designing the pacing options such as moving forward, backward, or exiting
the course
You can easily add generic advisement such as “If you are new to these skills,
take the lessons in the sequence shown”
You can include important instructional elements such as examples and
practice in the default navigational path
Your course includes practice exercises with feedback shown to improve
learner calibration
Consider adaptive advisement when:
Your audience has a mix of background knowledge and skills related to the
content
Saving learning time is a high priority and there are sufficient numbers of
highly paid staff to cost justify the resources needed for adaptive advisement
Reaching high levels of skill and knowledge proficiency is a high priority
Resources are available to create the decision logic necessary for
advisement
Consider program control when:
Your audience is primarily novice and a high level of proficiency is a priority
ON THE e-LEARNING AND THE SCIENCE OF
INSTRUCTION CD
In our demonstration lesson on how to create a database, we relied primarily on learner
control. On Screen 2 we include generic advice to new learners recommending they
take the course in the sequence designed. However, our pull-down menu allows learn-
ers to select any of the topics in the lesson. Important instructional elements such as
worked examples and practice are displayed as the default navigational options. Pacing
control, audio replay, exit options, and progress indicators appear on every screen.
Our resources, including time and budget, precluded any type of adaptive control or
adaptive advisement.
331.
314 e-Learning and the Science of Instruction
COMING NEXT
In Chapter 1 we distinguished between instructional goals that are procedural
(near transfer) and those that are strategic or require problem solving (far
transfer). Many e-learning courses currently in use are designed to teach pro-
cedural skills, especially computer skills. What is the potential of e-learning
to teach more complex problem-solving skills? In the next chapter we look at
this question.
Suggested Readings
DeRouin, R.E., Fritzsche, B.A., & Salas, E. (2004). Optimizing e-learning:
Research-based guidelines for learner-controlled training. Human Resource
Management, 43(2–3), 147–162.
Leung, A.C.K. (2003). Providing navigation aids and online learning helps
to support user control: A conceptual model on computer-based learning.
The Journal of Computer Information Systems, 43(3), 10–17.
National Research Council. (1994). Illusions of comprehension, competence,
and remembering. In D. Druckman and R.A. Bjork (Eds.), Learning,
remembering, believing. Washington, DC: National Academy Press.
Nelson, T.O. (1996). Consciousness and metacognition. American Psycholo-
gist, 51(2), 102–116.
Rouet, J.F., & Potelle, H (2005). Navigational principles in multimedia
learning. In R.E. Mayer (Ed.), The Cambridge handbook of multimedia
learning. New York: Cambridge University Press.
Shapiro, A.M. (2005). The site map principle in multimedia learning. In
R.E. Mayer (Ed.) The Cambridge handbook of multimedia learning. New
York: Cambridge University Press.
Stone, N.J. (2000). Exploring the relationship between calibration and self-
regulated learning. Educational Psychology Review, 12(4), 437–475.
333.
CHAPTER OUTLINE
What AreThinking Skills?
Can Creativity Be Trained?
What Kinds of Thinking-Skills Programs Work Best?
Focus on Job-Specific Cognitive and Metacognitive Skills
Building Critical Thinking Skills in the Workforce: Overview
Thinking Skills Principle 1: Use Job–Specific Cases
BioWorld: A Case-Based Environment for Scientific Reasoning
Accelerate Expertise: A Case-Based Environment for Loan Analysis
Psychological Reasons for Job-Specific Training
Evidence for Job-Specific Problem-Solving Training
Evidence from BioWorld
Evidence from Sherlock
Internet Cases vs. Face-to Face Instruction
Thinking Skills Principle 2: Make Thinking Processes Explicit
Teach Metacognitive Skills
Provide Examples of Expert Problem-Solving Processes
Promote Awareness of Problem-Solving Processes
Thinking Skills Principle 3: Define Job-Specific Problem-Solving
Processes
Teaching Thinking Skills: The Bottom Line
What We Don’t Know About Teaching Thinking Skills
334.
14
e-Learning to Build
ThinkingSkills
W H AT ’ S N E W I N T H I S C H A P T E R ?
W HETHER IT’S CALLED CRITICAL THINKING or creativity
training, the goals are similar: to build more effective problem-
solving skills. As digital information from diverse sources grows exponen-
tially, assessment of the quality and relevance of that information is just
one example of the expanding need for critical thinking skills. Competitive
edge in a knowledge economy depends on a workforce able to quickly
adapt to changing conditions and to excel in creative design of products
and services (Pink, 2005).
In our first edition we provided evidence and guidelines for build-
ing job-specific thinking or problem-solving skills through e-learning. We
emphasized the unique ability of e-learning to make mental problem-solving
skills explicit. We recommended against using a broad approach to think-
ing skills training in favor of a job-specific or domain-specific focus. Since
317
335.
318 e-Learning and the Science of Instruction
the first edition, many articles and several books have addressed how to teach
thinking skills. However, valid evidence supporting the implementation and
outcomes of thinking skills training programs remains scarce.
In this edition, we summarize new meta-analytic data that point to the
potential value of thinking skills training and that specify some of the fea-
tures associated with effective programs. We also describe new examples of
multimedia learning environments designed to foster thinking skills as well
as some new research showing the benefits of case-based learning over tradi-
tional didactic instruction.
DE S I GN D I L E M M A : YO U DEC IDE
“I wish our employees were better at critical thinking! They are really good at
quickly Googling information. But once they get the information, they assume
it’s good, no matter what the source. Blogs, wikis, websites—they are all treated
in the same manner—as valid and reliable. And when it comes to creative new
products or processes, we just hear the same tired ideas recycled again and
again. Our success relies on innovation. I want everyone to take creative thinking
skills training!”
That was the message from upper management to the training department.
Your team leader led the kickoff meeting: “Upper management wants training on
problem-solving skills and they want it for everyone, including operations, market-
ing, sales, engineers, and supervisors. We’ve got two weeks to report back with
either a design for the training or with recommendations for off-the-shelf course-
ware that would do the job.”
Back at your desk, you do a Google search on creativity training. You are
amazed to receive over sixteen million hits! As you access websites like the
one in Figure 14.1 , you are surprised to see the number of different classes
and books that promise to make people more creative and better problem solv-
ers. After reviewing some of the options, you end up with more questions than
you had originally. Does creativity training work? Wouldn’t it be better to teach
creativity in the classroom than with e-learning? Are there any advantages to
building your own course compared to buying one of the many off-the-shelf
courses available?
336.
e-Learning to BuildThinking Skills 319
Figure 14.1. A Website Promoting Critical Thinking Skills Training.
Brain Busters Creativity Programs
Books Workshops Exercises Articles Contact
Register
Evaluate
• Goals Ideas
• Framing
Test • Assuming Define the Problem
Yourself • Chunk
Testimonials Generate
• Brainstorm Ideas Plan and
• Visualize Implement
• Metaphors
• Mindmap
Email
Based on your own experience or intuition, which of the following options
would you select:
A. Money can be saved by purchasing an off-the-shelf course that
includes techniques like the ones listed in Figure 14.1.
B. Creativity training would be most effective in a face-to-face
environment.
C. Creative thinking training should be job specific; no one general
creative thinking course will be effective for everyone.
D. There is no way to improve creativity through training; it’s like
intelligence—you either have it or you don’t.
E. Not sure which options are correct.
337.
320 e-Learning and the Science of Instruction
What Are Thinking Skills?
Creativity training programs are popular. Over 25 percent of organizations
with over one hundred employees provide some form of thinking or creativ-
ity skills training (Scott, Leritz, & Mumford, 2004). But what is creative
thinking? Scott and her colleagues (2004) define creativity as involving “the
production of original, potentially workable, solutions to novel, ill-defined
problems of relatively high complexity” (p. 362). From designing websites to
troubleshooting equipment problems, creative problem solving spans a broad
range of workforce activities. In this chapter we use the terms creative think-
ing, critical thinking, and problem solving interchangeably to focus on the
skills that help workers solve new non-routine problems in effective ways.
Mayer (1998) suggests that success in problem solving rests on:
• Cognitive skills—the facts, concepts, and guidelines unique to a
skill field
• Metaskills—the ability to plan, monitor, and assess actions associ-
ated with problem solving
• Motivation—an investment of effort to persist and solve the problem
Success in problem solving relies on both cognitive and metacognitive skills.
For example, consider the following math problem. An army bus holds thirty-
six soldiers. If 1,128 soldiers are being bused to their training site, how many buses
are needed? In a test containing this item, 70 percent of respondents did the
math correctly. But 29 percent selected the answer: 31 remainder 12. Eighteen
percent said 31 buses needed, while 23 percent gave the correct answer of 32
(Schoenfeld, 1987). Here we see a good example of problem-solvers who
knew the mathematical operations—that is, they had the cognitive skills. It
was their metacognitive skills that were lacking. They failed to ask themselves:
“What is the problem asking? Does my answer make sense?” Consequently,
they chose either too few buses or “fractions” of buses.
In Chapter 13, we defined metacognition as the skill that sets goals, plans
an approach, monitors progress, and makes adjustments as needed. People
with good metacognitive skills focus not only on the outcome of the job,
but on the steps and decisions they make to achieve that outcome. When
338.
e-Learning to BuildThinking Skills 321
working in a team, the person with high metacognitive skills will be the one
to say: “Wait! Let’s stop and see if we are making progress. Will our individ-
ual efforts come together?” When working on a problem alone, they might
say: “This approach might work eventually, but it’s really labor-intensive.
How could I accomplish this more efficiently?” In other words, they are
mindful of their mental work. When they don’t see progress toward a goal,
they shift gears and try another approach.
Can creative thinking be trained? If so, what training methods are best?
In what ways can technology support the learning of critical thinking skills?
Can practice with techniques like the ones shown in Figure 14.1 build more
creative thinkers? These are some of the issues we consider in this chapter.
Can Creativity Be Trained?
Before considering specific guidelines for building problem-solving skills, it
makes sense to first ask whether there is any evidence that creativity can be
enhanced through training at all and, if so, what types of training work best.
Hundreds of creativity programs have been created and quite a few of these
have been evaluated, giving us at least some preliminary answers to our ques-
tions. Scott, Leritz, and Mumford (2004) reviewed seventy research studies
on creativity programs that measured results with (a) divergent thinking tests,
(b) production of original solutions to novel problems, or (c) generation of
creative products. When aggregating the outcomes across these different crite-
ria, they found an overall positive effect for creativity training programs of .68,
which is moderate. The research team concludes that “Well-designed creativity
training programs typically induce gains in performance, with effects gener-
alizing across criteria, settings, and target populations” (p. 361). In fact, the
research team found that creativity training is more effective in organizational
settings (effect size of 1.41) than in academic settings (effect size of .65).
What Kinds of Thinking-Skills Programs Work Best?
We see that at least some creativity programs can have positive effects on
measures of divergent thinking and problem solving. Scott, Leritz, and
Mumford (2004), however, found considerable variation across different
339.
322 e-Learning and the Science of Instruction
programs. Some were much more effective than others. We might wonder
then what distinguishes an effective from an ineffective program.
In Table 14.1 we summarize three types of creativity training pro-
grams, ranging from those that focus on very general non-verbal tech-
niques to those that focus on specific domain or job problem-solving
skills. General creativity training uses strategies such as visualization, met-
aphors, and puzzle problems, such as number sequences or visual insight
problems. Programs that fall in the middle range of specificity focus on
cognitive skills that can be applied across a range of settings. For example,
they teach skills such as problem finding, information gathering, concept
search, idea generation, idea evaluation, and implementation planning.
The most specific type of problem-solving programs focus on unique
domains or jobs, such as scientific thinking, mathematical problem solv-
ing, various types of troubleshooting, medical diagnosis and patient treat-
ment, to name a few. Which of these three approaches to thinking skills
training is most effective?
Table 14.1. Three Types of Thinking-Skills Training Programs.
Type Description Examples
1. Non-Verbal Emphasizes non-verbal Imagery exercises
approaches to creativity Metaphors
Puzzle problems
“Right-brain” thinking
2. General Cognitive Emphasizes cognitive Compare and contrast
and Metacognitive skills that apply to a Uncover assumptions
Skills broad spectrum of Brainstorming techniques
problem solving Avoid group think
Take a different view
3. Specific Cognitive and Emphasizes problem- Medical diagnosis
Metacognitive Skills solving processes and Equipment troubleshooting
skills that are unique to Reading comprehension
a domain or job role Scientific reasoning
340.
e-Learning to BuildThinking Skills 323
Focus on Job-Specific Cognitive and Metacognitive Skills
Scott, Leritz, and Mumford (2004) found that programs using cognitive tech-
niques, such as convergent thinking, critical thinking, and metacognitive strate-
gies, resulted in better outcomes than general non-verbal techniques that relied
on imagery and metaphors, which were negatively related to learning. In com-
paring Type 2 and Type 3 programs, they found that domain-specific programs
exerted the greatest positive outcomes. They conclude that specific programs are
most useful when cognitive skills must be applied in a certain arena: “The most
clear-cut finding to emerge in the overall analysis was that the use of domain-
based performance exercises was positively related to effect size” (p. 380).
In a review of three problem-solving courses that have been used in schools,
Mayer (2008) concludes that effective programs: “a. focus on a set of specific
problem-solving skills, b. contextualize the skills within tasks like those the
learner is expected to perform, and c. give practice in processes of problem
solving” (p. 454). Although problem-solving courses may seem to be addressing
a general set of skills, they are actually building task-specific skills that enable
learners to better perform similar tasks that benefit from those skills. The future
of educational problem-solving instruction rests with subject-matter-specific
programs targeted to specific cognitive skills, such as how to collect and analyze
scientific information. Mayer predicts that “Every subject matter will incorpo-
rate teaching of relevant cognitive and metacognitive skills” (p. x).
Building Critical Thinking Skills in the Workforce:
Overview
Based on evidence to date, we recommend the following guidelines for
building critical or creative thinking skills that will pay off in better work-
place performance:
• Use domain-specific or job-specific cases as a context to teach
problem-solving skills;
• Make thinking processes explicit through expert models and activities
that require learners to articulate their mental processes; and
• Base the lesson on an analysis of job expert problem-solving processes.
341.
324 e-Learning and the Science of Instruction
THINKING SKILLS PRINCIPLE 1
Use Job–Specific Cases
In Chapter 1 we defined three types of instruction for e-learning courses:
teaching by show-and-tell (receptive), teaching by show-and-do (directive),
and teaching by problem solving (guided discovery). We have evidence from
successful thinking-skills programs that a guided discovery approach that
relies on case-based learning is the most appropriate instructional tech-
nique for building workforce thinking skills. To illustrate this approach, we
describe two domain-specific multimedia programs: BioWorld, designed
to teach biology students scientific reasoning, and Accelerate Expertise,
designed to teach bank agents how to research and analyze a commercial
loan application.
BioWorld: A Case-Based Environment for Scientific Reasoning
BioWorld is a multimedia environment designed to teach scientific rea-
soning processes, including evidence gathering and analysis, through hos-
pital case scenarios (Lajoie & Nakamura, 2005). As shown in Figure 14.2,
the learner selects relevant phrases mentioned in the case description
in the center frame and drags them into the evidence table located in the left
frame. For example, in this case, the learner had already identified poor
nutrition and is currently selecting sore throat as relevant case evidence.
After identifying relevant evidence, learners select an initial hypothesis
from the “Select Hypothesis” pull-down menu located in the upper-left-
hand corner. For example, as you can see in Figure 14.3 in this case, the
learner selects Infectious Mononucleosis. The learner uses the slider bar
under “Belief Meter” to indicate confidence in the diagnosis as he or she
progresses through the program. By clicking on the chart icon, various
tests can be selected and the results recorded on the chart, as shown in
Figure 14.3. Learners can access resources from the online library at any
time. The library contains information on biological terms, diagnostic
tests, and symptoms. At the conclusion of a case, learners prioritize their
evidence in the right “prioritized evidence” window and can compare
342.
e-Learning to BuildThinking Skills 325
Figure 14.2. The Learner Moves Relevant Symptoms into the Evidence
Table.
Accessed October 25, 2006, from www.education.mcgill.ca/cognitionlab/bioworld/en/
research/narrator.html. Reprinted with permission of Susanne LaJoie.
Figure 14.3. The Learner Orders Diagnostic Tests.
Accessed October 25, 2006, from www.education.mcgill.ca/cognitionlab/bioworld/en/
research/narrator.html. Reprinted with permission of Susanne LaJoie.
343.
326 e-Learning and the Science of Instruction
their priorities to those of a doctor listed in the left window, as shown in
Figure 14.4.
Figure 14.4. The Learners Compare Their Evidence to an Expert List.
Accessed October 25, 2006, from www.education.mcgill.ca/cognitionlab/bioworld/en/
research/narrator.html. Reprinted with permission of Susanne LaJoie.
BioWorld includes many elements of an effective critical-thinking-skills pro-
gram. First, it is domain-specific, focusing on teaching of scientific reasoning
in biology. Second, it is case-based. The learning is contextualized within
the process of gathering evidence about a patient and forming diagnostic
hypotheses. Third, it makes scientific reasoning explicit by requiring par-
ticipants to select a hypothesis, indicate their confidence in their hypothesis,
and build and prioritize evidence to support it. Fourth, it offers instructional
support in the form of library resources. Fifth, BioWorld provides feedback
on the accuracy of the hypotheses as well as with the table comparing the
student list of evidence with an expert’s list shown in Figure 14.4.
344.
e-Learning to BuildThinking Skills 327
Accelerate Expertise: A Case-Based Environment
for Loan Analysis
In this program, the learner is asked to evaluate a new client applying for a
commercial loan. As illustrated in Figure 14.5, learners have a number of
resources in their virtual office interface. These include a fax machine for
requesting credit checks, a bookshelf with literature on the client’s indus-
try, and a telephone for checking references. The office computer includes a
program to guide learners through a loan analysis process. When sufficient
evidence has been collected, the learner completes the loan transmittal form,
making a loan recommendation, along with a justification statement. At any
point, the learner can access instructional tutorials by clicking on the agent
icon located in the bottom menu. The learner can also review the completed
steps to analyze a loan (shown in Figure 14.6) as well as compare the steps
with those of an expert.
Figure 14.5. The Learner Can Access Many Resources While Analyzing
a Loan Request.
With permission from Moody’s Investment Service.
345.
328 e-Learning and the Science of Instruction
Figure 14.6. The Learner Can Review the Loan Analysis Process.
With permission from Moody’s Investment Service.
Accelerate Expertise includes many features of an effective thinking-skills
program. First, it is job-specific, as it is based on a defined analytic process to
collect and analyze data relevant to loan risk. Second, it is case-based. A series of
loan applicants offers learners multiple specific cases. Third, it makes thinking
processes explicit as follows: (a) it tracks the learners’ activities and allows learn-
ers to compare their process with that of an expert and (b) it requires learners
to recommend acceptance or rejection of the loan based on evidence collected.
Fourth, it offers instructional support in the form of guidance from an agent,
as well as from online tutorials.
Psychological Reasons for Job-Specific Training
It would be wonderful if Type 2 creativity training on general cognitive skills
could build thinking skills that applied to a variety of jobs. If this were the case,
we could propose that metacognitive skills that underlie problem-solving are
general, with applicability to many different career fields. The general thinking
skills training approach would be quite efficient, since one training course on a
346.
e-Learning to BuildThinking Skills 329
set of generic problems would suffice for all employees in all jobs. The thinking
guidelines would be general problem-solving hints such as, “Think outside the
box,” “Revisit your assumptions,” “Use metaphors,” and “Avoid group think.”
What’s wrong with this approach? We know that successful training must
transfer back to the job after the learning event, and transfer has proven to be
a thorny problem. Our goal in improving worker thinking skills is to enable
them to solve non-routine problems, that is, novel problems for which they
do not have a standardized response. We know that work-related problems
are encountered in a specific job context, such as management, patient care,
or commercial bank lending. It is unlikely that the general skills derived from
broad thinking-skills training will transfer effectively to these diverse set-
tings. Good thinking-skills courses will need to include the unique skills that
underlie effective problem solving in a specific domain. Mayer (1990) sum-
marizes the situation: “An important instructional implication of the focus
on metacognition is that problem-solving skills should be learned within the
context of realistic problem-solving situations” (p. 53).
Think of metacognitive skills like a hand. A hand is a useful and flex-
ible tool, but without something to grasp, a hand can’t accomplish much.
Further, the way a hand grasps a baby will differ from how a hand picks up a
basket of laundry (Perkins & Salomon, 1989). Similarly, metacognitive skills
must be wedded to job-specific knowledge to be useful. And metacognitive
skills must be shaped to the type of work involved. In other words, highly
generalizable guidelines such as “set your goal,” “plan your approach,” or
“monitor your progress” are fine as far as they go; but how they apply to
specific job problems will differ. Unfortunately, there is no one general set of
thinking skills that all workers can apply successfully to their skill fields. Each
job domain requires its own customized set of metacognitive strategies to be
applied to specific and unique job cognitive knowledge. These skills need to
be taught in the context of authentic work problems.
Evidence for Job-Specific Problem-Solving Training
Unfortunately, there has not been sufficient empirical research on the effec-
tiveness of case-based learning approaches to make definitive statements
347.
330 e-Learning and the Science of Instruction
about their use. We need to know that, in general, they are effective, which
features of case-based learning are most relevant to building thinking skills,
and also how case-based learning compares with more traditional approaches
using a receptive or directive training design. In this section we review limited
evidence that supports the power of case-based guided discovery e-learning.
Evidence from BioWorld
Lajoie, Lavigne, Guerrera, and Munsie (2001) report results of a field trial
with BioWorld in which they evaluated how pairs of ninth-graders worked
collaboratively to solve BioWorld cases. Groups of students worked as pairs
with BioWorld with or without teacher coaching support. The team found
that 90 percent of the learners solved the problems in BioWorld. Successful
case resolution was related to the amount of evidence collected overall, as
well as to the frequency of use of the online library. There were no differ-
ences in case solution success between those pairs working on their own and
those teams with a human tutor. This study showed that BioWorld can sup-
port successful case resolution among teams working on their own. However,
the research did not evaluate whether new scientific reasoning skills could be
applied outside of the BioWorld context, nor did it compare BioWorld to a
more traditional approach to building scientific reasoning skills.
Evidence from Sherlock
One case-based problem-solving training program that has been evaluated
extensively is Sherlock, an intelligent multimedia instructional environment
designed to train Air Force technicians how to troubleshoot the F-15 test
station (Lesgold, Eggan, Katz, & Rao, 1993). Sherlock provides learners with
many simulated test station failures to solve, accompanied by computerized
tutorial help. Thirty-two airmen with some electronics background experi-
ence along with sixteen experts were included in an evaluation study. The
thirty-two new technicians were divided into two groups of sixteen. One
group completed twenty-five hours of Sherlock training, and the other served
as a comparison group. The skills of all thirty-two were evaluated through
pre- and post-tests that required them to solve simulated test station diag-
nosis problems—problems that were different from those in the training.
348.
e-Learning to BuildThinking Skills 331
The sixteen expert technicians also took the post-test. Figure 14.7 shows the
average test scores. Note that the average skill level of the trained group was
equivalent to that of the advanced technicians. The researchers conclude that
“the bottom line is that twenty to twenty-five hours of Sherlock practice time
produced average improvements that were, in many respects, equivalent to
the effects of four years on the job” (p. 54).
Figure 14.7. Acceleration of Expertise Using Sherlock.
Based on data from Eggan, Katz, and Rao, 1993.
Pretest
90 Posttest
80
70
60
Average Score
50
40
30
20
10
0
Trained Untrained Advanced
While this acceleration of expertise seems almost too good to be true, it
points to the power of technology-delivered case-based learning to compress
experience. In essence, the Sherlock learners received the equivalent of four
years of on-the-job experience in twenty-five hours. This reflects the accel-
eration of expertise that can be gained by exposing learners to a systematic
series of job-specific problems to solve, along with tutoring to help them
solve the problems. The Sherlock results suggest that case-based training
delivered via multimedia can effectively use simulation to compress experi-
ence and build skills that would take many months to build in the actual
work setting.
349.
332 e-Learning and the Science of Instruction
Internet Cases vs. Face-to Face Instruction
While the results from BioWorld and Sherlock are encouraging, it would
be useful to compare learning from case-based programs to learning from
traditional approaches. Kumta, Psang, Hung, and Chenge (2003) did just
that. The research team compared learning of 163 medical students from
a three-week program of case-based online instruction supplemented by
regular face-to-face discussions to learning from traditional didactic meth-
ods. The research was conducted in the context of a three-week rotation
required of all final-year medical students in a department of orthopedics.
A series of computer-based clinical case simulations was designed to foster
reasoning and logical thinking abilities. The simulations required students
to comment on radiographs, interpret clinical and diagnostic test results,
select appropriate investigations, and demonstrate logical reasoning for their
clinical decisions. During each case, learners started with patient assessment,
selected appropriate tests, interpreted test results, and made treatment deci-
sions. The web-based training was augmented by regular face-to-face meet-
ings with faculty moderators. The comparison group participated in the
traditional teaching program that included didactic lectures, bedside tutori-
als, and outpatient clinics.
At the conclusion of the three-week module, all participants completed
an assessment that included a computer-based test, an objective structured
clinical examination, and a patient-based clinical examination. The test
results are shown in Figure 14.8. The differences were significant and reflect
an effect size of .9, which is large. The research team observed that the stu-
dents felt the “simulations complemented and deepened their understanding
of patient care as they could relate this information to real cases present in
the wards. In fact, the scenarios reinforced the need to obtain the neces-
sary clinical history and to complete a comprehensive physical assessment
of patients in order to make clinical decisions” (p. 272). The research team
further noted that “students valued the weekly facilitator-led discussions, at
which time student answers to the cases were reviewed, discussed, and cri-
tiqued. These active student-teacher interactions ensured that the evaluation
of the thinking process, not just the resources uncovered, provided the value to
the information gained through the case scenarios” (p. 272).
350.
e-Learning to BuildThinking Skills 333
Figure 14.8. Better Learning from Case-Based Learning.
Based on data from Kumta, Psang, Hung, and Chenge, 2003.
Case-Based Training
60
Traditional Face-to-Face
55 Training
50
45
Average Score
40
35
30
25
20
0
The results from this comparison of case-based to “traditional” didactic
methods support the benefits of e-learning designed to be job-specific and
case-based. Still, we cannot make a solid case for case-based approaches to
thinking skills training until we have many more studies involving different
job roles, different learner populations, and diverse outcome measures.
THINKING SKILLS PRINCIPLE 2
Make Thinking Processes Explicit
In the BioWorld and the Accelerate Expertise programs, we saw that domain-
specific or job-specific thinking processes were made salient. For example, in
BioWorld, learners are required to identify, post, and prioritize relevant evi-
dence to support their disease hypotheses. At the end of each case, they com-
pare their evidence priorities with those of an expert. Likewise, in Accelerate
Expertise, the learner must collect and evaluate evidence regarding the risk
of a loan application. The learner can compare his or her evidence-gathering
activities with those of an expert.
351.
334 e-Learning and the Science of Instruction
Effective problem-solving training must focus on the metacogni-
tive thinking skills of the job. Most job training today concentrates
on knowledge of job facts, concepts, and procedures. This job knowl-
edge is typically taught using a teaching-by-telling (receptive) or show-
and-do (directive) architecture. Whether in the classroom or through
multimedia, learners generally listen to lectures or read text, complete
short exercises, and follow the steps to practice performing a task. The
training emphasis is on direct job knowledge. Rarely are the processes,
especially the invisible mental processes involved in solving job problems,
explicitly trained.
For example, in many mathematics classes, the focus is on the calcula-
tion procedures needed to solve a problem. Rarely has it been on the mental
processes—especially the metacognitive processes underlying problem solu-
tion. The outcome is learners who can get the right answer, but fail to assess
its relevance, as in the army bus problem described previously.
Teach Metacognitive Skills
In the last twenty years, educators have designed programs with the
explicit goal of building metacognitive skills in their learners. Alan Schoen-
feld, a mathematics professor, has developed one such classroom program
(1987). He noted that his graduate students were quite adept at specific
mathematical techniques taught in their classes, but they lacked problem-
solving skills. In studying the thinking processes of students, he noted that
about 60 percent would read a problem, start down a solution path, and
continue down that path, whether it was productive or not. Schoenfeld
characterizes this as the “read the problem, make a decision to do some-
thing, and then pursue it come hell or high water” approach (p. 207).
In contrast, experts solving the same problem were more refl ective. In
Figure 14.9 you can see Schoenfeld’s visual representations of problem-
solving activities of experts compared to novices. He gathered this data
by analyzing the dialog of experts and novices who talked aloud while
they solved problems. Unlike the novices who stuck to one approach, the
expert problem solvers moved iteratively among planning, implementing,
and evaluating problem-solving actions.
352.
e-Learning to BuildThinking Skills 335
Figure 14.9. Different Problem-Solving Activities in Novice and Expert
Mathematicians.
From Schoenfeld, 1987.
NOVICE EXPERT
Read Read
Analyze Analyze
Explore Explore
Plan Plan
Implement Implement
Verify Verify
Schoenfeld designed training to make student problem-solving skills more
like those of experts. He used worked examples and practice as his main
instructional methods. He solved demonstration problems in class, during
which he would voice aloud his thoughts—including his monitoring and
adjusting thoughts. On occasion he might deliberately go down an unpro-
ductive path. After a bit he would stop and say something like, “Wait—is this
getting me anywhere? What other alternatives might I consider?” In this way
he provided examples not only of problem solutions but also of the thinking
processes behind them. Second, he assigned problems to small student groups.
As they worked together, he would visit the groups and ask “metacogni-
tive questions” such as, “What are you doing now?” “Why are you trying that
approach?” “What other approaches might you consider?” By first demonstrating
and then holding learners responsible for applying these problem-solving
process skills, they soon learned to incorporate this kind of thinking in their
problem-solving sessions.
Based on these teaching methods, we suggest two guidelines for making
problem-solving processes explicit through e-learning:
• Provide examples of expert problem-solving actions and thinking; and
• Promote learners’ awareness of and reflection on their problem-solving
processes by making learners document their thinking processes and
by showing maps of student and expert problem-solving paths.
353.
336 e-Learning and the Science of Instruction
Provide Examples of Expert Problem-Solving Processes
Similar to the Schoenfeld techniques described in the previous section,
e-learning can make expert thinking processes explicit. For example, con-
sider the screen shown in Figure 14.10. This e-learning program focuses
on teaching of metacognitive skills associated with reading comprehension
of stories. Example skills include defining the theme or focus of a story, iden-
tifying the sequence of main events, and considering the feelings and motives
of the main characters. In the screen shown in Figure 14.10, a pedagogical
agent uses audio to demonstrate his comprehension processes. As he starts
his analysis, he makes a mistake about what the story is about. As he reads
on, he recognizes his error and crosses out his initial thoughts, replacing
them with a more accurate summary.
Figure 14.10. Reading Comprehension Skills Modeled.
With permission from Plato Software.
In Chapter 10, we reviewed the power of worked examples. In this exam-
ple we apply this powerful instructional method to the demonstration of
thinking skills rather than task-specific skills. We recommend that you use
354.
e-Learning to BuildThinking Skills 337
techniques to encourage learner processing of worked examples. For exam-
ple, throughout a demonstration, learners can be asked questions about the
techniques illustrated. Responding to these questions requires learners to
process the example rather than skip it or just give it cursory attention.
Promote Awareness of Problem-Solving Processes
By requiring learners to record the key actions or outcomes of a problem-solv-
ing process, e-learning can make thinking processes explicit. For example, in
Figure 14.11, the reading comprehension skills demonstrated in Figure 14.10
are practiced by the learner. A new story is presented on the screen and the
learner is asked to type in an analysis of the story in the workbook area. When
done, an expert response (on the left-hand portion of the screen) allows
learners to compare their statements with a model answer. We saw similar
functionalities in the BioWorld and Accelerate Expertise examples shown in
Figures 14.4 and 14.6.
Figure 14.11. Reading Comprehension Skills Practiced.
With Permission from Plato Software.
What’s the story
about?
Its about cooking
What’s the
sequence of the
main events?
They are cooking
They take a break
The food starts to burn
355.
338 e-Learning and the Science of Instruction
THINKING SKILLS PRINCIPLE 3
Define Job-Specific Problem-Solving Processes
As you review e-lessons that claim to build problem-solving skills in your
workforce, look for case scenarios, research tools, data sources, activities, and
thinking processes that expert job performers would use in your organiza-
tion. If the lessons incorporate these elements, you are more likely to obtain
performance improvement than from a program that is more general.
These job-specific elements must be identified during the planning
phases of the e-learning program. While some elements such as the tools
and observable activities can be readily seen, the most important elements
of problem solving, namely the reasoning processes of experts, are invisible.
Special techniques to define the case problems to be solved in the train-
ing and the processes experts use to solve them must be applied during the
design of the training.
For example, the developers of an intensive care nursing problem-solving
(SICUN) training documented their planning process in some detail (Lajoie,
Azevedo, & Fleiszer, 1998). They started by interviewing three head nurses
from the intensive care unit to determine the most difficult aspects of their
jobs. These were used to define the job competencies that distinguish expert
from beginning practitioners. Interviews with additional nurses ensured
that the types of problems built into the training would reflect the most
difficult parts of the job a nurse would have to encounter.
Following the interviews, the team worked with expert nurses to identify
specific case problems that would incorporate the key competencies iden-
tified earlier. Once some cases were developed on paper, the actions that
experienced nurses would take to solve them were defined by asking three
nurses unfamiliar with the case to talk aloud as they solved the problem.
These problem-solving interviews followed a specific sequence. For every
action that a nurse would mention, the interviewer would ask the reason
for the action. Then the interviewer would state the outcome of the action
and the nurse would state his or her interpretation of the outcome. The
transcripts collected from these problem-solving sessions were coded into cat-
egories, including hypothesis generation, planning of medical interventions,
356.
e-Learning to BuildThinking Skills 339
actions performed, results of evidence gathering, and interpretation of results,
along with overall solution paths. The goal of this phase was to define the
problem-solving processes and actions experts used to provide the basis for
the training program.
The activities involved in identifying the actions and thoughts of experts
during problem solutions are called a cognitive task analysis. The task analysis
is a major project in itself that needs to be completed before starting to design
the e-lessons. Initial interviews are used to define skills and competencies that
distinguish expert practitioners from others. Based on these, specific cases are
built that incorporate those competencies. Since expert job practitioners can
rarely articulate their thinking processes in a direct way, these must be inferred
indirectly through a cognitive task analysis technique such as the one described
here. Through a combination of interviews and cognitive task analysis, you
define: (1) target case problems, (2) the normal tools and resources available to
the worker, and (3) expert solution paths. All three of these problem-solving
elements should be incorporated in the design of your e-lesson.
As you plan your analysis project, use care to define who is considered
an expert, since it is the expert processes that will serve as the basis for your
training. Ideally, you can identify experts based on metrics that objectively
point them out as best practitioners. For example, sales records can be used
to identify top sales practitioners. In other situations, you will need to use a
combination of years of experience, job position, and/or practitioner consen-
sus as indicators of expertise.
Teaching Thinking Skills: The Bottom Line
In this chapter we have seen evidence and examples for the design of job-specific
case-based e-learning that builds problem-solving metacognitive skills as much
as (or layered on) technical knowledge and skills. We have advocated for a
domain-specific or job-specific approach that uses real-world cases as a context
for learning the problem-solving techniques unique to a discipline. e-Learning
can be used to make invisible thinking processes explicit as well as to prompt
practice applying those processes. We look forward to additional research to
shape these guidelines.
357.
340 e-Learning and the Science of Instruction
What We Don’t Know About Teaching Thinking Skills
In Table 14.1 we outlined three approaches to teaching thinking skills, rang-
ing from very broad to quite specific. Based on evidence to date, we recom-
mended using the more specific approaches for workforce learning. However,
many questions remain:
• Can moderately general thinking skills training (Type 2) be tailored
to benefit a variety of job problems through job-specific examples
and practice?
• How does case-based thinking skills training compare with a more
directive approach that incorporates examples and practice?
• Are case-based learning environments more effective for learners with
greater job-relevant experience, rather than for novices?
• How important is collaboration (among learners and between learn-
ers and instructors) to optimizing results in case-based problem-
solving environments?
• Which techniques can be used to guide learners in a case-based envi-
ronment in order to ensure efficient and effective learning?
DE S I GN D I L E M M A : RES OLVED
Your training department was charged with providing courses that would improve
workforce critical thinking skills. In reviewing the many courses claiming to improve
creative thinking, you wondered which of the following options were correct:
A. Money can be saved by purchasing an off-the-shelf course that includes
techniques like the ones listed in Figure 14.1.
B. Creativity training must be conducted in a face-to-face environment, so
any effective program must be classroom-based.
C. Creative-thinking training should be job-specific; no one general
creative-thinking course will be effective for everyone.
D. There is no way to improve creativity through training; it’s like
intelligence—you either have it or you don’t.
E. Not sure which options are correct.
358.
e-Learning to BuildThinking Skills 341
Based on evidence to date, we believe that Option C offers the greatest promise for
performance results from problem-solving training. However, this option requires
customized training focusing on job-specific problem-solving skills. Alternatively,
the training department might recommend a needs analysis to define which job
categories engage in problem solving that most directly links to organizational
competitive advantage. Then perhaps, tailored training should focus on leveraging
the problem-solving skills of those work groups.
W H AT T O LO O K F O R I N e - L E A R N I N G
Case-based learning that allows learners to observe and apply job-specific
problem-solving skills
Lessons that require learners to make their reasoning process and products
explicit
Thinking processes modeled and practiced in training based on job-specific
analysis of expert strategies
Various forms of instructional guidance provided to ensure successful case
resolution and learning of problem-solving skills
Several diverse cases included to foster building of a more robust set of
problem-solving skills
ON THE e-LEARNING AND THE SCIENCE OF
INSTRUCTION CD
Our CD lesson uses a directive instructional approach and primarily focuses on cog-
nitive skills (rather than metacognitive skills), including the concepts and guidelines
involved in building a database. However, we believe that construction of effective
databases is a task that relies on creative problem solving. We recommend that once
the basics are learned with lessons such as our example, case-based lessons that
emphasize the thinking and planning processes behind database construction could
apply the guidelines of this chapter.
359.
342 e-Learning and the Science of Instruction
COMING NEXT
Games and simulations are one of the hottest topics in e-learning today. But
before you jump on the bandwagon, you might wonder what evidence we
have for the instructional value of games and simulations. In the next chapter
we define the key elements of games and simulations, show some examples,
and review what lessons we have learned from these environments so far.
Suggested Readings
Lajoie, S.P., & Nakamura, C (2005). Multimedia learning of cognitive skills.
In R.E. Mayer (Ed.), The Cambridge handbook of multimedia learning.
New York: Cambridge University Press.
Mayer, R.E. (2008) Learning and instruction (2nd ed.). Upper Saddle River,
NJ: Pearson Merrill Prentice Hall. See Chapter 12: Teaching by Fostering
Problem-Solving Strategies.
Richart, R., & Perkins, D.N. (2005). Learning to think: The challenges
of teaching thinking. In K.J. Holyoak & R.G. Morrison (Eds.), The
Cambridge handbook of thinking and reasoning. New York: Cambridge
University Press.
Schoenfeld, A.H. (1987). What’s all the fuss about metacognition?
In A. Schoenfeld (Ed.), Cognitive science and mathematics education.
Mahwah, NJ: Lawrence Erlbaum.
Scott, G., Leritz, L.E., & Mumford, M.D. (2004). The effectiveness of cre-
ativity training: A quantitative review. Creativity Research Journal, 16(4),
361–388.
361.
CHAPTER OUTLINE
The Casefor Simulations and Games
Popularity of Games
Games and Brains
What Are Simulations and Games?
Do Simulations and Games Teach?
What Research Tells Us About Games and Simulations
Balancing Motivation and Learning
The America’s Army Game
Indiana Jones
When Motivation and Learning Clash
Games and Simulations Principle 1: Match Game Types to Learning Goals
Games and Simulations Principle 2: Make Learning Essential to Progress
Features That Lead to Learning
Discovery Learning Receives an F
Games and Simulations Principle 3: Build in Guidance
Evidence for Explanatory Feedback
Games and Simulations Principle 4: Promote Reflection on Correct Answers
Evidence for Reflection of Accurate Responses
Games and Simulations Principle 5: Manage Complexity
Move from Simple to Complex Goals
Minimize Interface Complexity
Provide Training Wheels
Use Faded Worked Examples
Manage Game or Simulation Pace
Provide Instructional Support
What We Don’t Know About Games and Simulations
362.
15
Simulations and Games
ine-Learning
WHY THIS NEW CHAPTER?
W ILL ONLINE LEARNING GAMES soon replace books and
traditional step-by-step e-learning? Are younger generations better
served by highly experiential and high-intensity multimedia learning games?
Unfortunately, when it comes to learning, there is more we don’t know about
simulations and games than we do. However, we do have some accumulat-
ing evidence about how games and simulations can be designed to promote
learning. In this chapter we focus on the evidence we do have to help you
define tradeoffs and leverage proven techniques when considering simula-
tions and games to achieve your learning goals.
In Chapter 1 we introduced three e-learning architectures, ranging from
low to high in interactivity. Receptive forms of e-learning are low in overt
opportunities for interactivity. Learning from these environments relies on
345
363.
346 e-Learning and the Science of Instruction
psychological engagement, not visible activity. In Chapters 10 and 11 we
focused on moderately interactive e-learning. In those chapters we looked at
directive learning environments characterized by explanations, examples, and
interspersed practice exercises designed to promote active learning. In this
chapter we move to the far end of the activity spectrum as we review highly
interactive forms of e-learning found in games and simulations.
DE S I GN D I L E M M A : YO U DEC IDE
Scene: The Database Training Project Meeting
Sandy: “Did you know that 55 percent of our staff play either video or computer
games in their free time? And it’s not just the young new hires either! Some
tell me they spend up to twenty hours a week playing these games. The work-
force of today—those who have been playing online games for years—have
different brains! Their nervous systems are attuned to high engagement mul-
timedia experiences. These digital natives are bored by anything that even
looks like traditional training!
Let’s leverage the popularity of games with a database adventure theme.
We could design a mystery scenario where databases contain clues to reach
goals. The more clues that are accumulated, the closer the player is to
achieving the mission!”
Matt: “OK. This sounds exciting . . . but how long will it take to develop this game?
And how will it affect our production budget? And what about learning time?
How long do you think it will take to play the game compared to completing
an old-fashioned tutorial? If we invest in this game, will they learn how to
construct databases as effectively and efficiently as a traditional lesson that
just shows them how?”
Sandy is excited about embedding the database content into a highly interactive
learning environment. But Matt has some questions. Based on your own experience
or intuition, which of the following options would you select:
A. Sandy is correct. Raised on games, the younger workforce will learn more
effectively from game-type lessons.
B. More participants will complete a game-type course than a traditional tutorial.
364.
Simulations and Gamesin e-Learning 347
C. Learning by exploration and experience is more effective than learning by
explanations and traditional practice exercises.
D. Constructing a gaming environment will be more expensive than
developing a traditional course; however, the investment will pay off in
higher course completion rates and better databases.
E. Not sure which options are correct.
The Case for Simulations and Games
A rash of conference presentations, books, and articles tout the use of simula-
tions and games for learning. At the 2006 e-Learning Guild conference, over
12 percent of the presentations included the words “game” or “simulation” in
their titles. Issenberg, McGaghie, Petrusa, Gordon, and Scalese (2005) report
that 385 research studies on the use of high-fidelity medical simulations were
published between 2000 and 2003.
Enthusiasts hope to leverage the popularity of entertainment games and
simulations to improve learning outcomes. Some argue that the younger
generation of “digital natives” raised on games and simulations have different
neurological requirements for learning—requirements that demand highly
interactive media-intensive learning environments.
In medical education high-fidelity simulations are recommended because
(a) managed health care has resulted in shorter patient stays with consequent
fewer clinical teaching opportunities than in the past, (b) patient safety is
enhanced when procedures can be learned and practiced on simulators,
(c) new medical procedures such as sigmoidoscopy, laparoscopy, and robotics
involve motor and perceptual skills that can be effectively practiced via simu-
lators, and (d) deliberate practice involving repetitive performances leads to
improved skills (Issenberg, McGaghie, Petrusa, Gordon, and Scalese, 2005).
Popularity of Games
According to the 2006 Entertainment Software Association report, games
are not just for the young. Sixty-nine percent of American heads of
365.
348 e-Learning and the Science of Instruction
households play computer or video games. The average age of game players
is thirty-three, with 25 percent over the age of fifty. Males outplay females
almost two to one, making up 62 percent of the gaming population. You can
see in Figure 15.1 that action and sports are the most popular video games
and strategy and family-children’s games are the most popular computer
games. Since 1996, there has been a steady increase in the annual dollar
sales of computer and video games, which has leveled at the $7 billion range
since 2002.
Figure 15.1. Sales of Video and Computer Game Types.
Source: Entertainment Software Association, 2006 Report.
Adventure Other
Other 8.4%
5.8%
12.5%
Action Strategy
Shooter
30.1% 30.8%
8.7% Role Play
12.4%
Racing
11.1%
Shooter
Sports 14.4%
Family
Children 17.3%
19.8%
9.3%
Best Selling Video Game Types Best Selling Computer Game Types
2006 2006
Games and Brains
Some say that extensive childhood experience with digital games is changing
brains. According to Carstens and Beck (2005): “The immense amount of
time spent with games during a child’s formative years has led them to be
literally ‘hard wired’ in a different way than those who came before” (p. 23).
Along similar lines, Prensky (2001) claims that: “Immense changes in tech-
nology over the past thirty years, of which video games are a major part, have
dramatically and discontinuously changed the way those people raised in this
366.
Simulations and Gamesin e-Learning 349
time period think, learn, and process information.… The change has been
so enormous that today’s younger people have, in their intellectual style and
preferences, very different minds from their parents and, in fact, all preced-
ing generations” (p. 17).
To leverage the minds of the gamer generation, Prensky (2001) recom-
mends that educators plan learning environments that:
1. Are fast-paced to take advantage of “twitch speed” information-
processing capabilities;
2. Emphasize high learner control and multiple tracks to leverage
greater multitasking abilities; and
3. Actively engage participants in highly visual environments that
encourage learning by exploration.
What evidence do we have about the instructional effectiveness and effi-
ciency of simulations and games? Will a simulation or game result in higher
e-learning completion rates compared to standard tutorials? Will learning be
faster? Will learners feel more positive about the instructional experience as
well as about the knowledge and skills learned? What is the cost-benefit of
simulations and games? What distinguishes an effective game or simulation
from an ineffective one? In this chapter we review what evidence we do and
do not have regarding these questions.
What Are Simulations and Games?
Suppose you wanted to learn the basics of genetics. You could work through
a structured linear interactive tutorial. Alternatively, you could opt for a more
experiential environment like the genetics simulation in Figure 15.2. In the
simulation, learners can change the genes on the chromosomes and immedi-
ately see how the dragon features are altered. In Figure 15.3, the simulation
has been converted into a game by giving learners a goal to change the lower-
left dragon to match the one in the upper left.
What Are Simulations? A simulation is a model of a real-world system.
Simulated environments respond in dynamic and rule-based ways to user
responses. For example, if in the simulation in Figure 15.2 the user changes
367.
350 e-Learning and the Science of Instruction
Figure 15.2. Simulation of Laws of Genetics.
From Biologica Project: http://biologica.Concord.org
the h on chromosome 1 to a dominant gene H, horns appear on the
dragon based on laws of genetics. De Jong and van Joolingen (1998) define
a computer simulation as a “program that contains a model of a system
(natural or artificial; e.g. equipment) or a process” (p. 180).
There are two basic types of simulations: operational and conceptual.
Operational simulations are designed primarily to teach procedural skills,
whereas conceptual simulations focus on learning of domain-specific stra-
tegic knowledge and skills. In workforce learning, operational simulations
have been used for training of software applications, medical procedures, and
safety-related skills such as aircraft piloting and industrial control operations.
In contrast, conceptual simulations such as the one shown in Figure 15.2
are primarily designed to build far-transfer knowledge of a specific domain
as well as associated problem-solving skills. Conceptual simulations in the
368.
Simulations and Gamesin e-Learning 351
Figure 15.3. Game Based on Simulation of Laws of Genetics.
From Biological Project: http://biologica.Concord.org
educational arena have focused on principles of physics, genetics, chemis-
try, botany, and ecology, to name a few. In workforce learning, conceptual
simulations have been designed to teach management and communication
skills, bank loan analysis, medical diagnostics, and equipment troubleshoot-
ing among others. For example, in Figure 15.4 we show a screen from a
simulation designed to teach commercial bank loan analysis. The learner
is presented with a loan applicant and is free to explore the office interface
in order to collect data about the applicant and ultimately make a funding
recommendation.
What Are Games? From Solitaire to Jeopardy to Doom, online games
reveal a diverse array of formats and features. The common elements of all
games include (1) a competitive activity with a challenge to achieve a goal,
(2) a set of rules and constraints, and (3) a specific context. For example, the
369.
352 e-Learning and the Science of Instruction
Figure 15.4. A Simulation for Commercial Loan Analysis.
With permission from Moody’s Investment Service.
genetics game shown in Figure 15.3 has a goal to match the features of the
test dragon to the target dragon by changing the genes of the test dragon one
at a time. As the genes of the test dragon are changed, the learner receives
immediate feedback by seeing a change in dragon features. Gene changes
result in feature changes based on the laws of genetics. Additional game
rules could be added that, for example, assigned points based on the number
of moves required to match the target dragon. Like many adventure, action,
or strategy online games, the genetics game involves a simulation. However,
not all games incorporate simulations. For example, game-show quiz games
such as Jeopardy are not simulation-based.
Do Simulations and Games Teach?
Rieber (2005) tested the effectiveness of the simulation shown in Figure 15.5
for teaching physics principles of velocity and acceleration. The player manipu-
lates the ball’s acceleration by clicking on the large arrows. To add a motivational
354 e-Learning and the Science of Instruction
also failed to support learning objectives (Hays, 2005). The Oregon Trail
Game was designed to teach school children the problem-solving challenges
of managing food, dealing with disease, and crossing rough terrain in a cov-
ered wagon. Children converted the game into a target practice and racing
game by shooting as many animals as possible and by getting to the end of
the trail rapidly. Most of the domain-specific information was ignored.
Those who played the flip-flop and Oregon Trail games learned. They
learned to play the games. However, game play did not translate into
achievement of the intended objectives. Games must be designed in ways
that promote learning. That way we can get the best of both worlds—fun
and learning! Later in this chapter we will focus on design guidelines to opti-
mize learning from simulations and games.
What Research Tells Us About Games and Simulations
Several research teams have recently gathered and analyzed a number of indi-
vidual experiments that tested the effectiveness of simulation-based learning
or games. There are no clear conclusions except that we need better-quality
research studies. For example, Gosen and Washbush (2004) found that,
while at face value many studies support the effectiveness of computer-based
simulations, very few of the studies meet high standards for research design.
They reported that, of 155 studies reviewed, not one met all of the criteria
for sound research. They conclude that: “There is evidence the approaches
are effective, but the studies showing these results do not meet the highest of
research design and measurement standards. Thus we believe any conclusion
about them must be tentative” (pp. 283–284).
Randel, Morris, Wetzel, and Whitehill (1992) reviewed sixty-seven
experiments, finding that twenty-two favored simulation games over con-
ventional instruction, three showed advantages for conventional instruction,
and thirty-eight showed no difference.
In a review of research on high-fidelity medical simulations Issenberg,
McGaghie, Petrusa, Gordon, and Scalese (2005) conclude: “Outcomes
research on the use and effectiveness of simulation technology in medical
education is scattered, inconsistent, and varies widely in methodological
rigor and substantive focus” (p. 10).
372.
Simulations and Gamesin e-Learning 355
Hays (2005) located over 270 documents on games, of which only
forty-eight included empirical data. He concludes that “The empirical
research on the effectiveness of instructional games is fragmented, filled
with ill-defined terms, and plagued with methodological flaws. Some
games provide effective instruction for some tasks some of the time, but
these results may not be generalizable to other games or instructional
programs” (p. 3).
Balancing Motivation and Learning
The goal in game-based learning is to provide an instructional envi-
ronment that is enjoyable AND achieves the learning objectives. What
makes a game or simulation fun? Malone (1981) and Malone and Lepper
(1987) identified four features that motivate persistence and enjoy-
ment of games: (1) a challenge: a structure that is neither too simple
nor too difficult; (2) control: the players must feel that they can affect
the outcomes of the game and that the game maintains an optimal pace;
(3) curiosity: for example, when exploratory opportunities lead to unpre-
dictable outcomes; and (4) fantasy: the perception of participation in a
made-up environment.
The America’s Army Game
The America’s Army game is a first-person perspective adventure/shoot-
ing game with advanced graphics and sound effects. Figure 15.6 shows a
screen shot from the target practice segment. Belanich, Sibley, and Orvis
(2004) identified the features of America’s Army that players did and
did not like, summarized in Figure 15.7. Game realism was one com-
monly mentioned popular element. The authors suggest that high degrees
of realism contribute to the fantasy element of the game by engaging
participants in a military environment. Challenge was a positive element
for those who perceived a match and a negative element for those who felt
the game was too easy or too hard. Control was also a major motivational
factor. In America’s Army it was rated as a negative due to a perceived lack
of control.
373.
356 e-Learning and the Science of Instruction
Figure 15.6. Target Practice in the America’s Army Game.
Accessed from www.americasarmy.com
Figure 15.7. Features That Players Did or Did Not Like in America’s Army Game.
From Belanich, Sibley, and Orvis, 2004.
Lack of
Control
Realism
Exploration
Lack of
Realism Control
Challenge
Too High or
Too Low
Challenge
Game Motivators Game De-Motivators
374.
Simulations and Gamesin e-Learning 357
Indiana Jones
Ju and Wagner (1997) asked players of the Indiana Jones game what made
it fun, challenging, or unattractive. Players liked the fun factors included in
the story—its richness, play, and its narrative speed, as well as the graphical
interface. The authors (p. 89) report that “a game became unattractive in the
subjects’ view when it had a poor (‘cheesey’) interface, with poor graphics,
sound, and input controls.” Game tasks that were either too difficult or too
repetitive were mentioned as unattractive. Pacing was also identified by some
participants reviewing Indiana Jones commenting that the story was a little
too slow moving.
When Motivation and Learning Clash
The designer’s challenge in a marriage of motivational and instructional fea-
tures is managing extraneous mental load so that the game challenge, fantasy,
and control elements do not subvert learning. A game or simulation runs the
risk of overloading or distracting learners in ways that are counterproduc-
tive to learning. For example, a game that incorporates “twitch” elements
allows little time for reflection. A game or simulation that includes highly
detailed and realistic visuals and audio may overload memory. Simulations
or games that are highly exploratory can lead to a great deal of activity but
little learning. The solution is to shape motivational elements in games in
ways that support and do not defeat basic psychological learning processes.
In the next section, we summarize evidence-based guidelines for design and
development of simulations and games for instructional success.
G A M E S A N D S I M U L AT I O N S P R I N C I P L E 1
Match Game Types to Learning Goals
To be effective, the goals, activities, feedback, and interfaces of simulations and
games must align with the desired instructional outcomes. The Oregon Trail
and flip-flop games described previously included elements that were antago-
nistic to the intended learning objectives. Learning took place—just not the
intended learning. In the Oregon Trail game, children co-opted game features
375.
358 e-Learning and the Science of Instruction
that appealed to them, such as shooting animals, that did not contribute to
the learning goal. The “twitch” feature of the flip-flop game was counter-
productive to the deeper reflection needed to learn physics principles.
In Figure 15.1 we summarized the categories of commercial video and
computer games. What types of games are best suited for various learning
outcomes? Van Eyke (2006) suggests: “Jeopardy-style games, a staple of games
in the classroom, are likely to be best for promoting the learning of verbal
information (facts, labels, and propositions) and concrete concepts. Arcade-
style games … are likely to be best at promoting speed of response, automatic-
ity, and visual processing. Adventure games are likely to be best for promoting
hypothesis testing and problem solving. It is critical, therefore, that we under-
stand not just how games work, but how different types of games work and
how game taxonomies align with learning taxonomies” (p. 22).
We will look to future research to validate the match between game types
and learning outcomes. For any game used for learning purposes, it’s critical
to embed the key knowledge and skills into the game environment.
G A M E S A N D S I M U L AT I O N S P R I N C I P L E 2
Make Learning Essential to Progress
It’s important to ensure that game progress and success translate into learn-
ing. In other words, learning required to succeed in the game should be the
same learning required by your instructional objectives. Belanich, Sibley, and
Orvis (2004) evaluated learning of twenty-one individuals who played the
America’s Army game with questions assessing information presented dur-
ing the game. Participants completed four sections of the game, including
marksmanship training, an obstacle course, weapons familiarization, and an
operational training mission. The research team compared learning of infor-
mation that was relevant to playing the game with information that did not
impact progress in the game. For example, a relevant question asks: “During
basic rifle marksmanship qualifying, how many rounds are in a magazine?”
In contrast, “What is written on the lane posts of the obstacle course?” is
irrelevant to game progress. As you can see in Figure 15.8, learning of rel-
evant information was greater, with an effect size of .65, which is moderate.
376.
Simulations and Gamesin e-Learning 359
Figure 15.8. Players Recognized More Game-Relevant Information Than
Game-Irrelevant Information.
Based on data from Belanich, Sibley, and Orvis, 2004.
100 SD Significant Difference
Effect Size .65
90
80
70
Percent Correct
60
50
40
SD
30
20
10
0
Relevant Irrelevant
The research team recommends that “instructional objectives should be inte-
grated into the game’s story line so that the training material is relevant to
the progression of the game” (p. 17).
Features That Lead to Learning
So far we have seen that games can either lead to or defeat learning. Rather
than asking whether games or simulations work, we think it’s more use-
ful to consider what characteristics of games and simulations lead to learn-
ing. Recent research comparing different versions of simulations and games
points to the criticality of learning support. Any element included in a simu-
lation or game that leads to the important cognitive processes we summa-
rized in Chapter 2 constitutes learning support. A simulation or game will
be successful to the extent that it does not overload working memory and at
the same time promotes generative processing aligned with the instructional
goal. In the remainder of this chapter, we will review evidence for features of
simulations and games that realize these cognitive goals.
377.
360 e-Learning and the Science of Instruction
Discovery Learning Receives an F
If there is one thing we do know about experiential learning, it’s that pure
discovery learning, whether by an individual alone or with a group, does
not pay off in learning. The popular view that learning must involve active
engagement in discussions, hands-on activities, or interactive games, rather
than more traditional passive environments such as reading books, attending
lectures, or viewing online presentations is one of the defining arguments
behind the use of games and simulations. Simulation and game enthusi-
asts often equate physical activity and mental activity. For example, Prensky
(2001) claims that “We now see much less tolerance in the workplace among
the Games Generations for passive situations such as lectures, corporate class-
rooms, and even traditional meetings. Games Generation workers rarely even
think of reading a manual. They’ll just play with the software, hitting every
key if necessary, until they figure it out” (p. 59).
The assumption that mental activity must be predicated on physical
activity is a teaching fallacy (Mayer, 2004). The challenge facing instruc-
tional professionals is to “promote appropriate processing in learners rather
than methods that promote hands-on activity or group discussion as ends
in themselves…. Instructional programs evaluated over the past fifty years
consistently point to the ineffectiveness of pure discovery. Activity may
help promote meaningful learning, but instead of behavioral activity per se,
the kind of activity that really promotes meaningful learning is cognitive
activity” (p. 17).
Judge the value of any simulation or game not on the activity, but rather
on the degree to which the activity promotes appropriate cognitive process-
ing. “Guidance, structure, and focused goals should not be ignored. This
is the consistent and clear lesson of decade after decade of research on the
effects of discovery methods” (Mayer, 2004, p. 17).
We discourage the creation of games and simulations that are highly
exploratory—environments that at best are inefficient for learning and at
worst defeat learning completely. One way to mitigate these unintended con-
sequences is to incorporate guidance into simulations and games. The next
section offers guidelines and evidence on how to structure simulations and
games for learning success.
378.
Simulations and Gamesin e-Learning 361
G A M E S A N D S I M U L AT I O N S P R I N C I P L E 3
Build in Guidance
Design simulations and games in ways that offer structure and learning
support. Research is just starting to uncover ways to incorporate effective
guidance. In the sections to follow, we describe the following techniques for
guidance, summarized in Table 15.1.
• Incorporate instructional explanations;
• Encourage reflection on instructional content;
• Manage complexity; and
• Provide instructional support.
Table 15.1. Techniques for Guidance in Games and Simulations.
Technique Description Examples
Incorporate 1. Provide explanatory feedback Remember that you need
Explanations rather than corrective-only two recessive genes to see
feedback a recessive trait. Try again.
2. Provide brief instructional To see recessive traits
explanations between expressed, two recessive
simulation rounds genes must be inherited.
Encourage Reflection After seeing a correct response, The dragon changes color
provided by a learning agent, from purple to green when
for example, ask learners to I select the two recessive
explain the answer genes for green color.
Select the reason for
this change:
Manage Complexity 1. Sequence tasks from In the first game, only a
easier to more complex single gene change from
by constraining variables recessive to dominant is
needed.
(Continued)
379.
362 e-Learning and the Science of Instruction
Table 15.1. (Continued).
Technique Description Examples
Manage Complexity 2. Make only some elements in Only some chromosomes
(continued) the interface functional allow gene changes.
(training wheels)
3. Use faded worked examples The agent changes some
genes and the learner
changes the rest.
4. Manage pacing to minimize There is no goal that
extraneous load and promote involves speed of response.
reflection
Optimize Interface 1. Avoid highly realistic images The dragon is a line
Fidelity and sounds, especially for drawing with a limited
novice learners number of features.
2. Minimize realism that is not The dragon does not
aligned to the instructional roar or exhibit
objectives features irrelevant to
the goal.
Provide Instructional 1. Demonstrate how to Watch me change a
Support play the game gene and see what
happens to the dragon.
2. Provide memory support Look in the online
notes for a list of what
you tried and what
happened.
3. Include process guidance Try changing only one
gene at a time and
record what happens.
4. Include visualization Look at this diagram
support showing how genes are
passed from parents
to offspring.
380.
Simulations and Gamesin e-Learning 363
Evidence for Explanatory Feedback
An instructional explanation is a brief tutorial that states the principles or
concepts being illustrated in the simulation or game. We have evidence that
learning from games or simulations with explanations is better than from
games and simulations without explanations. There are two main ways to
integrate explanations. They can be included as feedback to learner responses,
as described in Chapter 11. Or explanations can be offered in the form of
hints appearing between simulation rounds. When using a simulation or
game lacking explanations, learners try to achieve the goals of the game and
learn at the same time. These two activities may lead to mental overload
and it’s usually the game, not the learning, that takes precedence.
Knowledge of results that incorporates guidance is one of the most
important instructional elements in any simulation or game. Feedback was
the single most commonly mentioned success factor among research studies
on the effectiveness of medical simulations (Issenberg, McGaghie, Petrusa,
Gordon, & Scalese, 2005). Feedback may be built into a simulator, provided
by an instructor, or provided in a video replay reviewed after a simulator
session. The source of the feedback is less important than its presence. Evalu-
ations of Design-A-Plant and Hunger in the Stahl games summarized in the
following paragraphs support the value of incorporating feedback into games
or simulations.
Feedback in Design-A-Plant. Moreno (2004) evaluated learning and
efficiency of two versions of a botany game called Design-A-Plant. In
Design-A-Plant learners are given a goal to construct a plant with the best
combinations of roots, leaves, and stems to survive in planets of different
environmental features. The game goal is to design a plant that succeeds in
a specific environment. The instructional goal is to learn how plant features
are adaptive to various environmental conditions.
In one version of Design-A-Plant, a learning agent provided explanatory
feedback to learner responses. A comparison version offered only “correct–
incorrect” feedback. In the explanatory feedback version, when the learner
makes a correct selection, the agent confirms the choice with a statement
such as: “Yes, in a low sunlight environment, a large leaf has more room to
381.
364 e-Learning and the Science of Instruction
make food by photosynthesis.” For an incorrect choice, the agent responds
with a statement such as: “Hmmmm, your deep roots will not help your
plant collect the scarce rain that is on the surface of the soil.” This feedback
is followed by the correct choice.
As you can see in Figure 15.9, the explanatory feedback version resulted
in better learning and was also rated as more helpful than the comparison
versions. There were no differences in student ratings of motivation or inter-
est for the two versions. Adding explanations to the feedback improved
learning, but did not detract from the enjoyment of the game. Efficiency
calculations found that better learning occurred with less mental effort in the
explanatory feedback versions.
Figure 15.9. Better Learning from Explanatory Feedback.
Based on data from Moreno, 2004.
50 SD Significant Difference
Effect Size 1.16
40
Percent Correct
30
20
SD
10
0
Explanatory Corrective
Feedback Feedback
In a follow-up experiment, Moreno and Mayer (2005) confirmed these find-
ings. Learners working with versions that provided explanatory feedback
scored twice as much on a transfer post-test, with an effect size of 1.87,
which is very high.
Feedback in Hunger in the Sahel. Leutner (1993) evaluated learning
ecological principles from a simulation game in which the student plays the
role of a farmer and makes decisions regarding how to use ten lots of land
382.
Simulations and Gamesin e-Learning 365
with different geophysical features. Decisions made in the game determine
the agricultural profit and, in turn, the family’s ability to survive. Each
game round simulates a year. The simulation model is set so that without a
suitable land-use strategy, starvation results within only a few years. Leutner
measured game performance as well as ecological knowledge such as what
erosion is, ways to manage erosion, and so forth.
Some participants were free to explore the simulation without any sup-
port. Others received feedback based on their choices. For example, they
were told, “If you dig too many water holes, the ground water level may
collapse.” Explanatory feedback improved scores on the domain test, but
diminished game performance. In contrast, participants who did not receive
feedback learned to perform the game more effectively, but scored lower on
domain knowledge. It seems that learning to play the game effectively built
implicit knowledge that did not translate into verbal knowledge. Leutner
concludes: “If the goal of discovery learning is to promote the acquisition of
verbal knowledge related to concepts, facts, rules, and principles of the simu-
lated domain of reality, then it is very useful to make pieces of information,
which are implicitly available in the system, explicit through appropriate
instructional support during system exploration.” In other words, success
in game play does not necessarily lead to knowledge and skills that can be
explicitly articulated. Additional support in the form of explanations can
bridge that gap.
Embedded Explanations in a Physics Game. Rieber, Tzeng, and Tribble
(2004) evaluated learning of laws of motion from a game in which learners
clicked to kick a ball to position it on a target on the screen. The game score
was based on the time needed to reach the goal. The team measured: scores
on a multiple choice test that assessed understanding of the physics principles,
game scores, and user frustration ratings. Some participants received hints
between game rounds such as: “This simulation is based on Newton’s laws
of motion. Newton’s second law says that the speed of an object depends on
size of the force acting upon it. Therefore, an object kicked two times to the
right would move at a speed twice as fast as a ball kicked only once” (p. 314).
Those who received hints had an average pretest-post-test gain of 32 points,
compared to 13 points for those who did not receive hints!
383.
366 e-Learning and the Science of Instruction
Rieber, Tzeng, and Tribble (2004) conclude that “Discovery learning
within a simulation can be very inefficient, ineffective, and frustrating to
students, but providing students with short explanations at just the right
time can offset these limitations” (p. 319). A brief and succinct instructional
explanation incorporated into a simulation can improve learning and at the
same time not detract from the game experience.
Taken together, these studies point to the benefits of embedding brief
instructional explanations into a game or simulation. Explanations may be in
the form of feedback to learner responses or placed as hints between simula-
tion rounds. The explanations may come from the program, an instructor, or
by way of a post-simulation review of actions. We need additional research
to tell us the best timing, format, source, and placement of effective explana-
tions for different learning goals.
G A M E S A N D S I M U L AT I O N S P R I N C I P L E 4
Promote Reflection on Correct Answers
Achieving the goal of a game or attempting to master a simulation may pre-
clude reflection—reflection that is needed to abstract lessons learned from
the game. Rieber, Tzeng, and Tribble (2004) suggest that: “The experiential
nature of an educational simulation is very compelling—users often become
very active and engaged in a simulation, similar to the experience of playing
a video game. However, the intense and demanding interactivity of many
simulations may not provide adequate time for the user to carefully reflect
on the principles being modeled by the simulation” (p. 318). The Reflection
Principle states that learning from simulations and games will be better when
learners have opportunities to actively explain correct responses.
Evidence for Reflection of Accurate Responses
Moreno and Mayer (2005) used versions of the Design-A-Plant game, all of
which provided explanatory feedback based on our Principle 3 on providing
instructional explanations. In some versions, after seeing the correct answer
displayed by a learning agent, learners were asked to give an explanation
384.
Simulations and Gamesin e-Learning 367
for the answer. In alternative versions, learners were asked to explain their
own solutions. Students asked to reflect on the program’s correct solutions
scored significantly higher on a transfer test, with an effect size of .80. How-
ever, reflection on their own answers (some of which were incorrect) did
not yield as good learning. In other words, for reflection to be effective,
be sure you ask learners to explain correct, not inaccurate choices. Thus
“reflection alone does not foster deeper learning unless it is based on correct
information” ( p. 127).
G A M E S A N D S I M U L AT I O N S P R I N C I P L E 5
Manage Complexity
Throughout this book we have described multimedia design principles
designed to avoid mental overload. For example, in Chapter 9 we reviewed
evidence showing that segmenting and sequencing instructional content
can reduce cognitive load and improve learning. Likewise, there are a num-
ber of ways to help learners manage mental load in games. These include
managing the complexity of the simulation or game goal, optimizing the
complexity of the interface, as well as providing instructional support in
the form of memory aids or activity guidance. In this section, we summa-
rize the following approaches to complexity management in simulations and
games: (1) goal progression, (2) interface design, (3) training wheels, (4) faded
worked examples, (5) pacing, and (6) several forms of instructional support.
Move from Simple to Complex Goals
Begin a game or simulation with a relatively low-challenge task or goal and
move gradually to more complex environments. For example, in the genetics
simulation shown in Figure 15.3, the challenge of the game can be adjusted by
changing the number of genes needed to match the test dragon to the target
dragon or by the complexity of the genetic relationships required to achieve a
given match. Game complexity can be controlled by asking learners to select
a game difficulty level based on their relevant experiences or by dynamically
adapting game complexity based on accuracy of responses during the game.
385.
368 e-Learning and the Science of Instruction
Minimize Interface Complexity
Interface complexity is a function of the type and display of images used in a
game or simulation. Lee, Plass, and Homer (2006) created a conceptual simula-
tion of Boyles and Charles Laws that describe the relationships between gas pres-
sure and gas volume (Boyles Law) and gas temperature and gas volume (Charles
Law). The research team created four different interfaces based as follows:
1. Combined interface (high complexity) that allowed manipulation
of both temperature and pressure on the same screen;
2. Separated interface (low complexity) that allowed manipulation of
temperature on one screen and pressure on a separate screen;
3. Abstract interface that used slider bars only to manipulate
temperature and pressure; and
4. Concrete interface that used a flame adjuster and weights to
represent adjustments in temperature and pressure.
Figure 15.10 shows the combined interface that used concrete symbols. As
students adjust the temperature or pressure icons, changes in the volume of
the gas are recorded in the right-hand graph.
Figure 15.11 shows the effects of these simulation interfaces on learning.
As you can see, the most complex combination, the combined interface with
abstract controls, resulted in the least learning, with an effect size close to
1. This type of research that compares learning from different interface ele-
ments in games and simulations will help guide our design of these environ-
ments in the future.
Highly realistic images and sounds in the interface are primary satisfiers
for game play. These features may promote the fantasy elements of a game
environment. However, highly realistic interfaces are more expensive to create
and may impose extraneous mental load. Van Merrienboer and Kester (2005)
suggest that “for novice learners, a high-fidelity task environment often con-
tains irrelevant details that may deteriorate learning” (p. 79). Norman (2005)
similarly notes that in medical education the degree of fidelity in the simula-
tion is best matched to the learning goal and to the background experience
of the learner. “You are unlikely to benefit much from a explanation of wave
386.
Simulations and Gamesin e-Learning 369
Figure 15.10. Simulation Interface for Ideal Gas Laws That Combines Both
Laws (High Complexity) and Uses Concrete Representations of
Variables (Weights and Flames).
Adapted from Lee, Plass, and Homer, 2006.
Boyle‘s and Charles‘ Law This screen shows the relationship among pressure,
temperature, and volume of a gas. You can observe how the
volume of the gas changes by using the pressure button
(keeping temperature constant) and the temperature button
(keeping pressure constant).
Pressure
Volume
Pressure/Temperature
Temperature
formation to a multimedia animated narrated version, Mayer and Jackson
(2005) found better learning from the paper group, probably because learn-
ers could interact with the material at their own pace and were less likely to
experience cognitive overload.
Games that rely on “twitch” behaviors are likely most beneficial for jobs
that require “twitch” responses based on speed and accuracy. If your instruc-
tional goals require application of concepts and rules, games that proceed under
learner control of pacing and do not reward speed are more likely to succeed.
747 simulation unless you already have a lot of hours on big jets, and the
medical student trying to learn physiology in the simulated operating room
is a bit like the Piper Cub student pilot in the 747 simulator. . . . Both are
little more than tourists in a foreign country” (p. 88).
387.
370 e-Learning and the Science of Instruction
Figure 15.11. Worst Learning from Complex Simulation Interface That
Used Abstract Symbols.
Based on data from Lee, Plass, and Homer, 2006.
SD Significant Difference
Effect Size .96
7
6
5
Percent Correct
4
3
2 SD
1
0
Separated Separated Combined Combined
Iconic Symbolic Iconic Symbolic
We reviewed evidence in Chapter 7 that interesting visuals and words
related to the topic of lightning but not relevant to the instructional goal
depressed learning. The potential antagonism between the highly realistic
interfaces that lead to motivation and the lower-fidelity interfaces that lead
to learning requires additional research for resolution.
Provide Training Wheels
Carroll (2000) described a “training wheels” principle for software simulations.
He recommends that learners work with a simulation in which only some of
the functionality is enabled. Although the full interface may be visible, only rel-
evant elements of it work. In that way, learners cannot go too far astray during
early trials. As more tasks are learned, the functionality constraints are gradually
released until the user is working with a highly functional system. For example,
when working with a software simulation, only a few commands or icons are
functional. As the learner gains experience, greater functionality is added.
388.
Simulations and Gamesin e-Learning 371
Use Faded Worked Examples
In Chapter 10 we saw the benefits of transitioning from worked examples to
practice by way of fading. The instruction begins with a complete demonstration
of the task. Next learners view a demonstration of the first few steps of the task
and finish it on their own. Gradually, the learner assumes more and more
task responsibility until she is doing it on her own. A simulation or game can
also incorporate a fading strategy. Initially the learner observes a successful game
round with explanatory commentary. For example, a pedagogical agent may
demonstrate how to play the game or interact with the simulation. In the next
round, the agent completes some of the steps, assigning others to the learner.
Gradually the learner assumes greater control until she is working on her own.
In a game scenario, the beginner may play the role of the apprentice working
under the direction of a game agent who serves as the master performer. Over
time the agent assigns greater responsibility to the apprentice as her skills build.
Manage Game or Simulation Pace
According to some, the new generation of gamers is not patient. They have
learned to multitask and to respond to multiple digital information sources
quickly. Slow game pace was one complaint of players of the Indiana Jones
adventure game (Ju & Wagner, 1997). While fast-paced games may be more
popular, they are also likely to lead to greater overload and to fewer opportu-
nities for reflection. For example, in comparing learning from a paper-based
explanation of wave formation to a multimedia animated narrated version,
Mayer and Jackson (2005) found better learning from the paper group, prob-
ably because learners could interact with the material at their own pace and
were less likely to experience cognitive overload.
Games that rely on “twitch” behaviors are likely most beneficial for jobs
that require “twitch” responses based on speed and accuracy. If your instruc-
tional goals require application of concepts and rules, games that proceed under
learner control of pacing and do not reward speed are more likely to succeed.
Provide Instructional Support
We have already discussed the importance of explanations and reflection
on correct answers. There are many other potential instructional resources
389.
372 e-Learning and the Science of Instruction
you can consider. These include simulation or game instruction, memory
support, and game play aids.
Provide Instruction in Using the Game. A simulation or game will require
cognitive effort to master the mechanics of the environment—cognitive
effort that will not be available for learning. You can free mental resources for
learning the instructional goals by explicitly teaching how the simulation
or game works. The focus of this suggestion is on the interface mechanics—
not the strategic decisions required by the game. An agent can start the
game or simulation with a tour or example of how the goals are achieved by
manipulation of the various interface elements. For example, the America’s
Army game provides a working aid that summarizes the keyboard symbols
for various actions such as running, loading a rifle, and others.
Provide Memory Support. Many problem-solving or strategy games and
simulations take place over time, during which the participant accumulates
data or draws conclusions from experiences. Provide facilities for records of
actions taken, facts accumulated, and conclusions reached. In the bank loan
simulation shown in Figure 15.4, learners can access data from a number of
sources, including interviews, credit reports, and referrals. The file cabinet
located under the left side of the desk stores all data automatically as it is
gathered throughout the game. At any point, the learner can open the file
drawer and refer to the data collected. In the genetics game, a record of gene
manipulations and results could be maintained by the game or by the learner
on an electronic note pad. Such a record will help learners derive conclusions
based on a series of experiments.
Include Process Guidance. Some games and simulations focus on a
defined process or strategy that reflects best practices for goal achievement.
For example, commercial loan analysis requires completion of a prescribed
sequence of stages, including evaluation of the applicant’s credit, economic
forecasts for an industry segment, and evaluation of the applicant’s prior
financial performance. Incorporate process worksheets as well as automated
process tracking into these types of games or simulations. The process
worksheet directs the learner through specific problem-solving stages.
In addition, you may provide action tracking, as we discussed in Chapter
14. As the learner progresses through the game, her actions may be recorded
390.
Simulations and Gamesin e-Learning 373
so she can view her breadcrumbs upon completion of a game or a segment of
it. Upon request, she can compare her solution path to that of an expert.
Include Visualization Support. Success in some simulations or games may
rely on spatial skills. Instructional aids promote learning by providing external
spatial representations as guides. For example, Mayer, Mautone, and Prothero
(2002) evaluated different types of support for a geology simulation game
called the Profile Game. During the game, learners collect data from a planet
whose surface is obscured by clouds. Players draw a line and the computer
shows a profile line indicating how far above and below sea level the surface
is at each point on the line. By drawing many lines, learners can determine
whether the section contains a mountain, trough, island, or other feature.
Participants were provided with strategy aids in text, visual aids dia-
gramming the features listed in the previous sentence, or no aids. A sample
of a visual aid is shown in Figure 15.12. The visual aids led to best game
Figure 15.12. This Visual Aid Helped Learners Identify Geological
Features in a Geology Simulation Game.
From Mayer, Mautone, and Prothero, 2002.
Ridge on Land Ridge in Ocean
Trench on Land Trench in Ocean
Basin on Land Basin in Ocean
Island in Ocean Seamount in Ocean
391.
374 e-Learning and the Science of Instruction
performance. The research team concludes that “students need support in
how to interact with geology simulations, particularly support in building
and using spatial representations” (p. 181).
What We Don’t Know About Games and Simulations
There is far more we don’t know about games than what we do know. We do
know that, for some, games are both motivational and when well-designed
can improve learning. We are also confident that well-designed simula-
tions can offer instructional environments for practice and learning that are
unavailable or unsafe in the workplace. The research of the next few years
should give more guidance about how to design simulation and game fea-
tures that effectively balance motivational and learning elements. Here is a
list of some important questions for which we need empirical data:
1. Guidance for guidance. We know that guidance is an essential
ingredient for deriving learning from a simulation or game. We
presented evidence for guidance in the form of explanations and
reflection support. However, we need more information on the
most appropriate format, source, timing, and type of guidance to
use for different instructional goals at different learning stages.
2. Simulation and game taxonomies for different learning outcomes. We
know it’s important to match the simulation or game goal, actions,
feedback, and interface to the instructional goals. However, we
have only general guidelines for making an appropriate match,
most of which lack empirical verification. Will arcade games with
“twitch” features be most effective for visual or motor skills? Will
adventure or strategy games be best aligned for learning cause-and-
effect relationships? Are memory goals such as learning product
knowledge best supported by game-show type formats? An empiri-
cally based taxonomy of game formats aligned to learning outcomes
should help game and simulation designers make optimal matches.
3. Cost-benefit of games and simulations. To design and implement a com-
puter game or simulation of any complexity will require an investment
of time and resources. In addition to development costs, participant
392.
Simulations and Gamesin e-Learning 375
time is invested in interacting with the simulation or game. What
are the efficiencies of games? How does the time to achieve an instruc-
tional goal from a game compare with achieving the same goal from a
book or tutorial? When does the motivational appeal of a game offset
the investment in development and learning time? For example, will
an embedded game result in higher completion of e-learning as well
as equal or better learning contrasted to traditional methods? In most
commercial settings, there is a cost attached to the development and
use of learning environments and we have much to learn about the
cost-benefit tradeoffs to games and simulations.
4. Who prefers games? Are there some individuals of specified professions,
ages, or prior knowledge who will find learning from games more
motivational than others? For example, will sales professionals enjoy
games more than engineers, men more than women, younger staff
more than mature staff, college graduates more than non-grads? Would
specific types of games appeal to different populations? Until we have
better guidelines, run a game pilot to assess your audience’s response.
5. Effective game interfaces. We have evidence that how game elements—the
interface, the feedback, and the support—are represented affect out-
comes. However, we need more data to guide interface design. Com-
mercial games use high-end graphics, animations, and sounds. Rich
multimedia interfaces increase motivational appeal. However, might a
high-fidelity environment impose a mental burden that impedes learn-
ing? Van Merrienboer and Kester (2005) recommend that training
should start with low-fidelity environments that only represent the essen-
tial aspects necessary to accomplish the task. We need evidence on how
the interface of a simulation or game affects motivation and learning.
6. How much interactivity? There may be optimal levels of interactiv-
ity to promote learning. Excessive interactivity may distract learners
from the goal of building a mental model of the system. Novices in
particular may be overloaded by very high levels of interactivity. On
the other hand, purely observational environments may not sustain
attention or promote encoding processes. We need research that
393.
376 e-Learning and the Science of Instruction
compares varying levels of interactivity for novice and experienced
learners in the same simulation or game.
7. Simulations versus games? When is a simulation more effective than a
game? How will learning be affected by simulations used as structured
practice exercises compared to using the same simulation in the form
of a game? Will the game features add extraneous mental load? Will
the game lead to greater learning and learner satisfaction? In what sit-
uations, for example, types of learners and nature of the instructional
goal, would a game added to a simulation be most effective?
DE S I GN D I L E M M A : RES OLVED
We started this chapter with a debate between Sandy and Matt on embedding the
database content into an adventure game context. The options included:
A. Sandy is correct. Raised on games, the younger workforce will learn more
effectively from game-type lessons.
B. More participants will complete a game-type course than a traditional
tutorial.
C. Learning by exploration and experience is more effective than learning by
explanations and traditional practice exercises.
D. Constructing a gaming environment will be more expensive than devel-
oping a traditional course; however, the investment will pay off in higher
course completion rates and better databases.
E. Not sure which options are correct.
While we would like to select Option D, at this time we do not have sufficient evi-
dence to support it. For now, we have to go with Option E. However, we are seeing
the gradual accumulation of research that points to features such as explanatory
feedback and reflection support as well as management of cognitive load in the
interface that promote learning in simulations and games. We look forward to
additional research that narrows our “what we don’t know” list.
394.
Simulations and Gamesin e-Learning 377
W H AT T O LO O K F O R I N e - L E A R N I N G
Simulations and games whose goals, rules, activities, feedback, and
consequences are aligned to desired learning outcomes
Simulations or games that provide sufficient structure and guidance to help
learners reach instructional goals
Feedback to learner responses provides explanations
Explanations incorporated between rounds
Visual support provided for games or simulations that require
visualization skills
Embedded questions for require explanations of correct answers to
promote reflection
Open-ended games and simulations that require unguided exploration are
avoided
Simulation or game goal complexity and interface managed in ways that
minimize distractions or extraneous mental load
Use of games and simulations for learners who will be motivated to initiate
or complete learning goals in these environments
COMING NEXT
This chapter completes our review of what research tells us about impor-
tant design and development issues in e-learning. In our final chapter, we
integrate all of the guidelines of the previous chapters in two ways. First
we offer a checklist of evidence-based features as they apply to receptive,
directive, and guided-discovery forms of e-learning. Second, we illustrate
the application of the checklist by reflecting on how four e-learning lessons
do and do not apply the guidelines effectively. Among the four, we review
the two asynchronous database sample lessons on the CD, one synchronous
e-learning class on Excel formulas, and one asynchronous guided discovery
lesson on bank loan analysis.
395.
378 e-Learning and the Science of Instruction
Suggested Readings
Hays, R.T. (2005). The effectiveness of instructional games: A literature review
and discussion. Technical Report 2005–004. Washington, DC: Naval Air
Warfare Center Training Systems Division.
Lee, H., Plass, J.L., & Homer, B.C. (2006). Optimizing cognitive load for
learning from computer-based science simulations. Journal of Educational
Psychology, 98(4), 902–913.
Mayer, R.E. (2004). Should there be a three-strikes rule against pure
discovery learning: The case for guided methods of instruction. American
Psychologist, 59(1), 14–19.
Moreno, R., & Mayer, R.E. (in press). Interactive multi-modal learning
environments. Educational Psychology Review.
Rieber, L.P. (2005). Multimedia learning in games, simulations, and micro-
worlds. In R.E. Mayer (Ed.), The Cambridge handbook of multimedia
learning. New York: The Cambridge University Press.
Van Eck, R. (2006). Digital game-based learning. Educause Review,
41(2), 17–30.
397.
CHAPTER OUTLINE
Applying OurGuidelines to Evaluate e-Courseware
Integrating the Guidelines
e-Lesson Reviews
Asynchronous Samples One and Two: Design of Databases
Description of the Samples
Application of Guidelines
Synchronous Sample Three: Constructing Formulas in Excel
Description of Sample
Application of Guidelines
Asynchronous Sample Four: Simulation Course for Commercial
Bank Loan Analysis
Description of Sample
Application of Guidelines
The Next Generation of e-Learning
Prediction One: e-Learning for Job Payoff
Prediction Two: e-Learning to Build Problem-Solving Skills
In Conclusion
398.
16
Applying the Guidelines
WH AT ’ S N E W I N T H I S C H A P T E R ?
T HIS CHAPTER CONSOLIDATES all the guidelines we have dis-
cussed by describing how they apply or are violated in four e-learning
examples. Here you have the opportunity to consider all of the guidelines
in concert as you read how we apply them to some sample e-lessons. In our
update to this chapter, we add new guidelines to our checklist, based on the
new research we have included. We also put the checklist on the CD. We
compare and contrast the application of our guidelines to the asynchronous
database example and counter-example lessons included on the book’s CD.
We also include a new synchronous e-learning example to illustrate how the
guidelines apply to the virtual classroom. In our discussion of a bank loan
simulation lesson, we can apply new guidelines regarding games and simula-
tions. Finally, we look back at our predictions about the future directions of
e-learning for workforce learning.
381
399.
382 e-Learning and the Science of Instruction
Applying Our Guidelines to Evaluate e-Courseware
The goal of our book is to help consumers and designers make e-learning
decisions based on empirical research and on the psychological processes of
learning. In an ideal world, e-courseware effectiveness should be based on
measurement of how well and how efficiently learners achieve the learning
objectives. This measurement requires a validation process in which learners
are formally tested on their skills after completing the training. In our expe-
rience, formal course validation is rare. More often, consumers and design-
ers look at the features rather than at the outcomes of an e-learning course
to assess its effectiveness. We recommend that, among the features that
are assessed, you include the research-based guidelines we have presented.
We recognize that decisions about e-learning alternatives will not be based on
learning theory alone. A variety of factors, including the desired outcome of
the training, the culture of the organization sponsoring the training, the tech-
nological constraints of the platforms and networks available to the learners,
and pragmatic issues related to politics, time, and budget, will shape e-learning
decisions. That is why you will need to adapt our guidelines to your unique
training situations.
In Chapter 1 we described three common purposes for e-learning:
to inform workers, to teach procedural tasks, and to teach far-transfer or
strategic tasks. Your technological constraints will determine whether you
can only deliver courseware with low-memory intensive media elements like
text and simple graphics or whether you can include media elements that
require greater technical resources such as video, audio, and animation. If
you are planning an Internet or intranet course, you can use collaborative
facilities, including email, chats, and message boards.
Integrating the Guidelines
Taken together, we can make a general statement about the best use of
media elements to present content and learning methods in e-learning. In
situations that support audio, best learning will result from concise infor-
mal narration of relevant graphics. In situations that preclude audio, best
learning will result from concise informal textual explanations of relevant
400.
Applying the Guidelines 383
graphics in which the text and graphic are integrated on the screen. In
all cases, learning of novices is best promoted by dividing content into
short segments, allowing learners to control the rate at which they access
each segment. In addition, in lessons of any complexity, learning is more
efficient when supporting concepts are presented prior to the process or
procedure that is the focus of the lesson.
Table 16.1 compares the average effect sizes and number of experimental
tests for the multimedia principles described in Chapters 3 through 9. Recall
from Chapter 2 that effect sizes tell us the proportion of a standard deviation
of test score improvement you will realize when you apply that principle. For
example, if you apply the multimedia principle, you can expect overall a test
score of one and one half standard deviations greater than a comparable les-
son without visuals. As a general guideline effect sizes: less than .2 are small,
around .5 are moderate, and .8 or above are quite large. Principles with larger
effect sizes based on more experimental tests indicate greater potential prac-
tical applicability. As you can see in the table, with the exception of the
Table 16.1. Summary of Research Results from the Eight Multimedia Principles.
From Mayer, 2001, Mayer, 2003b, c, d.
Principle Effect Size Number of Tests
Multimedia 1.50 9 of 9
Contiguity 1.11 8 of 8
Coherence 1.32 11 of 12
Modality .97 21 of 21
Redundancy .69 10 of 10
Personalization 1.30 10 of 10
Segmenting .98 3 of 3
Pretraining 1.30 7 of 7
401.
384 e-Learning and the Science of Instruction
redundancy principles, all effect sizes fall into the large range. Several exceed
an effect size of 1! In particular, the multimedia, contiguity, coherence, per-
sonalization, and pretraining principles all show large effect sizes based on
multiple experiments.
Because the research underlying the multimedia principles was conducted
in the same laboratory and used similar instructional materials (Mayer,
2001a; Mayer, 2005b, c, & d), we can make these comparisons among the
results. Regarding the principles summarized in Chapters 10 and beyond,
however, we do not have data to make a similar comparison.
e-Lesson Reviews
In this chapter we offer three brief examples of how the guidelines might be
applied (or violated) in e-learning courses. We do not offer these guidelines as
a “rating system.” We don’t claim to have included all the important variables
you should consider when evaluating e-learning alternatives. Furthermore,
which guidelines you will apply will depend on the goal of your training and
the environmental considerations mentioned previously. Instead of a rating
system, we offer these guidelines as a checklist of research-based indicators
of some of the psychological factors you should consider in your e-learning
design and selection decisions.
We have organized the guidelines in a checklist in Exhibit 16.1 by chap-
ters and according to the technological constraints and training goals for
e-learning. Therefore guidelines 1 through 17 apply to all forms of e-learning.
Guidelines 18 through 26 apply to e-learning designed to teach specific job
tasks. Guidelines 27 through 31 apply to e-learning with facilities that can
engage learners in collaborative work. Guidelines 32 through 35 apply to
design of navigational elements that apply primarily to asynchronous forms
of e-learning. Last, guidelines 36 through 43 apply to e-learning designed
to build problem-solving skills and to simulations and games. The checklist
is also on the CD that accompanies this edition. The commentaries to fol-
low the checklist reference the guidelines by number, so we recommend you
print out the copy of Exhibit 16.1 on your CD to reduce split attention
as you read the rest of this chapter. We will discuss the following e-lesson
402.
Applying the Guidelines 385
samples: Asynchronous directive example and counter-example lessons on
How to Design a Database from our CD, a synchronous directive lesson
on Constructing Formulas in Excel, and an asynchronous simulation guided
discovery course on bank loan funding analysis.
Exhibit 16.1. A Summary of e-Learning Guidelines.
Three Types of e-Learning:
Best Used for
Type Training Goals Examples
Show-and-Tell—Receptive Inform New hire orientation
Product updates
Tell-and-Do—Directive Procedural Tasks Computer end-user
training
Problem Solving— Far-Transfer or Bank loan application
Guided Discovery Problem-Solving analysis
Tasks Sales skills
Chapters 3 through 9. Multimedia Guidelines for All Types of e-Learning
If Using Visual Mode Only:
1. Use relevant graphics and text to communicate content—Multimedia
Principle.
2. Integrate the text nearby the graphic on the screen—Contiguity Principle.
3. Avoid covering or separating information that must be integrated for learning—
Contiguity Principle.
4. Avoid irrelevant graphics, stories, and lengthy text—Coherence Principle.
5. Write in a conversational style using first and second person—Personalization
Principle.
6. Use virtual coaches (agents) to deliver instructional content such as examples
and hints—Personalization Principle.
7. Break content down into small topic chunks that can be accessed at the learner’s
preferred rate—Segmentation Principle.
8. Teach important concepts and facts prior to procedures or processes—Pretraining
Principle.
(Continued)
403.
386 e-Learning and the Science of Instruction
Exhibit 16.1. A Summary of e-Learning Guidelines. (Continued).
If Using Audio and Visual Modes:
9. Use relevant graphics explained by audio narration to communicate content—
Multimedia and Modality Principles.
10. Maintain information the learner needs time to process in text on the screen,
for example, directions to tasks, new terminology—Exception to Modality
Principle.
11. Avoid covering or separating information that must be integrated for learning—
Contiguity Principle.
12. Do not present words as both on-screen text and narration when there are
graphics on the screen—Redundancy Principle.
13. Avoid irrelevant videos, animations, music, stories, and lengthy narrations—
Coherence Principle.
14. Script audio in a conversational style using first and second person—Personalization
Principle.
15. Script virtual coaches to present instructional content such as examples and
hints via audio—Personalization Principle.
16. Break content down into small topic chunks that can be accessed at the learner’s
preferred rate—Segmentation Principle.
17. Teach important concepts and facts prior to procedures or processes—Pretraining
Principle.
Chapters 10 and 11—Guidelines for e-Learning Designed to Teach Job Tasks
In addition to the above guidelines:
18. Transition from full worked examples to full practice assignments using fading—
Worked Example Principle.
19. Insert questions next to worked steps to promote self-explanations—
Self-Explanation Principle.
20. Add explanations to worked out steps.
21. Provide a worked example using realistic job tools and situations in the form of
demonstrations for procedural skills—Encoding Specificity Principle.
22. Provide several diverse worked examples for far-transfer skills—Varied Context
Principle.
23. Provide job-relevant practice questions interspersed throughout the lessons—
Practice/Encoding Specificity Principles.
24. For more critical skills and knowledge, include more practice questions—Practice
Principle.
25. Provide explanatory feedback for correct and incorrect answers—Feedback
Principle.
404.
Applying the Guidelines 387
Exhibit 16.1. (Continued).
26. Design space for feedback to be visible close to practice answers—Contiguity
Principle.
Chapter 12—Guidelines for Use of Collaboration in Internet/Intranet e-Learning
27. Assign collaborative projects or problem discussions to heterogeneous small
groups or pairs.
28. Use asynchronous communication tools for projects that benefit from reflection
and independent research.
29. Use synchronous communication tools for projects that benefit from group synergy
and social presence.
30. Make group assignments and assign participant roles that promote deeper
processing.
31. Provide structured assignments such as structured argumentation to minimize
extraneous cognitive load.
Chapter 13—Guidelines for e-Learning Navigation—Learner-Control Principles
32. Allow learners choices over topics and instructional methods such as practice when:
They have related prior knowledge and skills and/or good self-regulatory learning
skills
Courses are designed primarily to be informational rather than skill building
Courses are advanced rather than introductory
The content topics are not logically interdependent so sequence is not critical
The default option leads to important instructional methods such as practice
33. Limit learner choices over topics and instructional options when:
Learners are novice to the content, skill outcomes are important, and learners
lack good self-regulatory skills
34. Use adaptive diagnostic testing strategies when:
Learners lack good self-regulation skills and the instructional outcomes are
important
Learners are heterogeneous regarding background and needs and the cost to
produce tests pays off in learner time saved
35. Always give learners options to progress at their own pace, review prior topics/
lessons, and quit the program
(Continued)
405.
388 e-Learning and the Science of Instruction
Exhibit 16.1. A Summary of e-Learning Guidelines. (Continued).
Chapter 14—Guidelines for e-Learning to Build Thinking Skills
36. Use real job tools and cases to teach job-specific problem-solving processes—
Encoding Specificity Principle.
37. Provide worked examples of experts’ problem-solving actions and thoughts—
Worked Examples Principle.
38. Provide learners with a map of their problem-solving steps to compare with an
expert map—Feedback Principle.
39. Base lessons on analysis of actions and thoughts of expert practitioners—
Encoding Specificity Principle.
Chapter 15—Guidelines for Simulations and Games
40. Align the goals, rules, activities, feedback, and consequences of the game or
simulation to desired learning outcomes.
41. Provide structure and guidance to help learners reach instructional goals.
42. Avoid open-ended games and simulations that require unguided exploration.
43. Manage goal and interface complexity to minimize extraneous cognitive load.
Asynchronous Samples One and Two: Design
of Databases
Description of the Samples
Figures 16.2 through 16.10 are screen captures from our example and counter-
example lessons included on the book’s CD. If you have not viewed these, you
may want to look at them in conjunction with this section. The major lesson
objectives are:
• To distinguish between records and fields in a database
• To distinguish between parent and child tables in a database
• To use primary and foreign keys to define relations in tables
• To design a relational database from an existing flat file system
We designed these lessons as asynchronous directive e-learning tutorials assum-
ing learners are new to databases. We imagine placing this lesson in a course on
how to use database tools such as Access. In Figure 16.1 we show the content
406.
Applying the Guidelines 389
Figure 16.1. Content Outline of Example and Counter-Example
Database Lessons.
Example Lesson Counter-Example Lesson
1. Introduction 1. Introduction
2. Entities and Tables 2. Did you know?
– Fields and records 3. Select Entities
3. Parent and Child Tables – What is an entity?
Concepts
– Primary keys 4. Determine Characteristics
– Foreign keys – Fields and records
4. Entity-Relationship 5. Assign Primary Keys
Diagram – What is a primary key?
5. Full Worked Example with 6. Did you know?
Questions 7. Assign Foreign Keys
Procedure
6. Faded Worked Example – What is a foreign key?
7. Full Practice Exercise 8. Designate Table
Relationships
9. Did you know?
10. Practice 1 – Guided
11. Full Practice Exercise
outlines for the two courses. Note that in the example lesson, we apply Guideline
8 as we sequence the important concepts first, followed by the steps to construct
the database. In addition we apply Guideline 18 by starting with a full worked
example and fading to a full practice assignment. The counter-example lesson
embeds concept topics into procedure steps sections, does not use worked exam-
ples, and includes extraneous information in the “Did You Know” topics.
Application of Guidelines
Figures 16.2 and 16.3 illustrate an ineffective and effective application of the
multimedia principles on screens presenting the topic of entity relationship
diagrams. The counter-example (Figure 16.2) violates Principles 1, 4, and 6.
Rather than explaining the concept with a visual and brief text, it uses a large
block of text. In addition, there is no learning agent. In contrast, the example
screen in Figure 16.3 uses an explanatory visual and applies Principle 9 by
describing the visual with audio narration. Note that arrows and circles are used
to signal the relationships among the tables and the keys.
407.
390 e-Learning and the Science of Instruction
Figure 16.2. Screen Explaining One-to-Many Relationships in
Counter-Example.
From e-Learning and the Science of Instruction CD.
Figure 16.3. Screen Explaining One-to-Many Relationships in
the Example.
From e-Learning and the Science of Instruction CD.
AUDIO: Entity relationship diagrams dictate how the tables in the database relate to one
another. These relationships govern how the database searches for data when running
a query. In our case, a “one-to-many” relationship exists between the Rentals table and
the Customers and Movies tables. Let’s take a closer look at what this means.
408.
Applying the Guidelines 391
Figure 16.4. Violation of Contiguity in the Counter-Example.
From e-Learning and the Science of Instruction CD.
In Figure 16.4 we illustrate a violation of Guideline 3 in the counter-
example. Applying the contiguity principle requires an integration of words
and visuals on the screen. The example version includes a visual of the
spreadsheet and places the text under it. Figure 16.5 illustrates effective prac-
tice feedback. When the learner answers incorrectly, the explanatory feedback
shown not only tells the learner he is incorrect but gives a brief explanation
to lead to a correct answer on a second try. In contrast, the counter-example
lesson only tells the learner that he is incorrect. The feedback is presented in
on-screen text rather than audio. Feedback in text allows the learner to review
the feedback repeatedly in preparation for a second try at the question.
Figures 16.6 and 16.7 illustrate ineffective and effective presentation of
examples. Compare the text used to present the step. Note that the text in
the example (Figure 16.7) applies Principles 14 and 15 by using the first per-
son pronoun. Figure 16.7 ensures that learners will study the step by includ-
ing a question in accordance with Guideline 19. In addition, the visual includes
an arrow and labels to draw attention to the primary keys in both tables.
409.
392 e-Learning and the Science of Instruction
Figure 16.5. Feedback Offers an Explanation in the Example.
From e-Learning and the Science of Instruction CD.
Sorry, that is incorrect. Remember, records are
analogous to rows in a spreadsheet. Try again.
Figure 16.6. An Example from the Counter-Example Lesson.
From e-Learning and the Science of Instruction CD.
410.
Applying the Guidelines 393
Figure 16.7. An Example from the Example Lesson.
From e-Learning and the Science of Instruction CD.
Figure 16.8 is taken from the counter-example lesson and shows one of
three brief discussions about the use or abuse of databases. These types
of add-ons are intended to sustain interest in the lesson. However, based on
Guideline 13 and the coherence principle on which it is based, in many cases,
they only serve to depress learning. You will not find these types of additions
in the example lesson. Additionally, the counter-example lesson includes back-
ground music throughout—yet another violation of coherence.
Synchronous Sample Three: Constructing
Formulas in Excel
Description of Sample
Figures 16.10 through 16.12 are taken from a virtual classroom demon-
stration lesson on How to Use Excel Formulas. Synchronous e-learning has
become a major player in e-learning solutions since our first edition, and
we wanted to show how to apply our principles to it. If you are new to the
virtual classroom, refer to our description of synchronous e-learning features
411.
394 e-Learning and the Science of Instruction
Figure 16.8. Violation of Coherence in the Counter-Example.
From e-Learning and the Science of Instruction CD.
and uses in Chapter 1. The goal of this course is to teach end-user spread-
sheet procedures. The lesson objectives are:
• To construct formulas with valid formatting conventions
• To perform basic calculations using formulas in Excel
Figure 16.9 shows a content outline. In applying Guideline 8 based on
the pretraining principle, the procedural part of the lesson is preceded by
important concepts. Before learning the steps to input a formula in Excel,
Figure 16.9. Content Outline of Synchronous Excel Lesson.
Example Lesson
1. Introduction
2. What is a formula? Concepts
– Formula formatting
3. How to input a formula?
– Full worked example
with questions Procedure
– Faded worked example
– Full practice exercise
412.
Applying the Guidelines 395
the lesson teaches the concept of a formula, including its formatting con-
ventions. When teaching the procedures, the lesson follows guidelines for
worked examples by starting with a full worked example accompanied by
questions and fades to a full practice exercise.
Although virtual classroom tools can project a video image of the instructor,
in this lesson the instructor used audio alone. Research we reviewed in Chapter 8
showed that it was the voice of a learning agent—not the image—that was most
instrumental in promoting learning. Since the main instructional message is con-
tained on the whiteboard slides, we deliberately decided to minimize the potential
for split attention caused by a second image. The introductory slide is shown in
Figure 16.10. The instructor places her photo on this slide to implement Guide-
line 6, based on the personalization principle. In addition, the instructor builds
social presence by inviting participants to use their audio as they join the session.
Figure 16.10. Introduction to Synchronous Excel Lesson.
Application of Guidelines
In Chapter 13, we discussed various forms of learner control. Figure 16.11
shows the application of Guideline 34 with a pretest to help learners define
413.
396 e-Learning and the Science of Instruction
Figure 16.11. Adaptive Control in Synchronous Excel Lesson.
which virtual classroom session they should attend. Asynchronous e-learning
can dynamically tailor training to individual needs and progress. However,
virtual classrooms are instructor-led and therefore offer few opportunities
for dynamic learner control. But a pretest administered prior to the event
should help ensure a good match between learner prior knowledge and les-
son objectives.
Figure 16.12 illustrates example fading in the virtual classroom. Most
virtual classroom tools allow the instructor to share desktop applications for
demonstration and practice purposes. The spreadsheet window in the middle
of the virtual classroom interface is being projected to the learners through
application sharing. In the first example, shown in Figure 16.12, the instruc-
tor has completed the first step in the procedure by typing the equal sign
into the correct spreadsheet cell. The instructor asks participants to finish
the example by typing the rest of the formula in the chat window. Note that
in applying Guideline 10, the directions are kept on the screen in text, since
participants need to refer to them as they work the exercise. The second
example (not shown) is a full practice assignment that requires participants
414.
Applying the Guidelines 397
Figure 16.12. Faded Worked Example.
From Clark and Kwinn, 2007.
to enter the formula. The fading process gradually assigns more work to the
learners, ending with a full practice assignment.
From this brief look at some virtual classroom samples, you can see that
just about all of the principles we describe in the book apply. Because the
class proceeds under instructor rather than learner control, it is especially
critical to apply all guidelines that reduce extraneous mental load. Lesson
designers should create effective visuals to project on the whiteboard that will
be described verbally by the instructor, applying the multimedia and modal-
ity principles. The instructor should use a conversational tone and language
and incorporate participant audio to apply personalization. Skill-building
classes can apply all of our guidelines for faded worked examples and effec-
tive practice exercises. The presence of multiple participants in the virtual
sessions lends itself to collaborative projects. Most virtual classroom tools
offer breakout rooms in which small teams can carry out assignments. Apply
Guidelines 27, 29, and 30 as you plan collaborative activities. As with asyn-
chronous e-learning, instructors should minimize irrelevant visual effects,
stories, themes, or audio in accordance with the coherence principle.
415.
398 e-Learning and the Science of Instruction
Asynchronous Sample Four: Simulation Course
for Commercial Bank Loan Analysis
Description of Sample
Figures 16.13 through 16.16 are from a guided discovery simulation course
designed to teach bank loan officers how to use a structured process to research
and evaluate commercial loan applicants. The course is presented on CD-ROM
or via the intranet and includes video, text, and various other graphic elements.
The learner starts with a point of view perspective in an office equipped with
a computer, telephone, fax machine, file cabinet, and other common office
tools. The case begins with a video assignment from the learner’s manager
(Figure 16.13). Typical of guided-discovery learning environments, the learner
is free to use various resources in the office to analyze the loan. For example,
in Figure 16.14 the learner makes a request for a credit report on the loan
applicant. Other data collection options include interviews of the loan appli-
cant, industry publications, and applicant references. An agent coach is avail-
able for advice and offers links to structured lessons related to the loan review
Figure 16.13. Manager Assigns Case to Student Loan Analyst.
Courtesy of Moody’s Financial Services.
416.
Applying the Guidelines 399
Figure 16.14. The Simulation Offers Access to Case Data.
Courtesy of Moody’s Financial Services.
process shown in Figure 16.15. At the end of the research, the learner makes
recommendations, along with supporting rationale to the loan committee, and
receives feedback from the online agent. The learners can also view the steps
they took to solve the case (Figure 16.16) and compare them to expert steps. As
the learners progress through the simulation and gather case data, all data is
stored in the file cabinet located to the left of the desk in Figure 16.13.
Application of Guidelines
This lesson effectively applies the multimedia Guidelines 7 through 13. It also
applies Guidelines 36 through 43 applicable to e-learning to build problem-
solving skills and to games and simulations. By situating the learner in a typi-
cal office, the designer gives access to the tools and resources needed on the
job. The goal, rules, activities, and feedback of the simulation are all aligned to
the desired learning outcome, that is, to teach the process associated with com-
mercial loan analysis. Learners can see maps of their steps and compare their
maps with an expert approach. Thus the lesson focuses not only on obtaining
the correct answer but on how the answer is derived. There are several sources
417.
400 e-Learning and the Science of Instruction
Figure 16.15. Help from an Agent Offers Advice and Access to Lessons.
Courtesy of Moody’s Financial Services.
Figure 16.16. Learners Can View Their Steps Taken.
Courtesy of Moody’s Financial Services.
418.
Applying the Guidelines 401
of structure and guidance available congruent with Guideline 41. For example,
the agent is always available for advice, and learners can access a series of direc-
tive tutorial lessons. The file cabinet reduces mental load by providing mem-
ory support. Other than paper documents, there is no on-screen text. Human
interactions such as the manager’s assignment are presented in video.
Since the structure of the case study is guided discovery, it emphasizes
learning during problem solving. Regarding navigation, there was a high level
of learner control in the case study segment. However, in the tutorial part of the
course (not shown), a pretest is used to give advice regarding which lessons to
study. Overall, we feel this course offers a good model for game and simula-
tion environments that are most likely to achieve workforce learning goals.
The Next Generation of e-Learning
What differences will we see in e-learning developed for organizational train-
ing in the next few years? In the following section, we first review our predic-
tions from the first edition, followed by our observations four years later.
Prediction One: e-Learning for Job Payoff
Because e-learning developed for workers in organizations is an expensive
commitment, we predict more examples of online training that apply guide-
lines proven to lead to return on investment. Specifically, we believe that
there will be:
• Fewer Las Vegas-style courses that depress learning by over-use of glitz
and games. Instead, the power of technology will be leveraged more
effectively to support acquisition and transfer of job-related skills.
• More problem-centered designs that use job-realistic problems in
the start of a lesson or course to establish relevance, in the body
of the lesson to drive the selection and organization of related
knowledge and skills, and at the end of the lesson to provide prac-
tice and assessment opportunities.
• More creative ways to blend computer technology with other delivery
media so that the features of a given medium are best used to support
ongoing job-relevant skill requirements.
419.
402 e-Learning and the Science of Instruction
Four Years Later. As we look back over the past few years, we find this
prediction to be valid, although it is perhaps not being realized exactly as we
anticipated. We do see a continued and growing focus on e-learning that pays
off in job performance. Job-related e-learning has been achieved by an increased
integration of e-learning into the work environment and increased blending of
media, as predicted in the fourth bulleted point. e-Learning implementations
have broadened to include knowledge management resources workers can
access during job task completion. For example, if a sales person is writing a
first proposal, the company website offers industry-specific information, sample
proposal templates, links to mentors, recorded mini lessons on proposal success,
and other similar resources.
Prediction Two: e-Learning to Build Problem-Solving Skills
The majority of e-learning currently on the business and industry market is
designed to build near-transfer or procedural skills such as end-user software
training. However, the increasing economic dependence on knowledge work-
ers, coupled with a shrinking workforce, will drive more courses that focus
on building problem-solving skills in specific work domains. Specifically, we
believe that:
• e-Learning will increasingly make use of the unique technological
features that can support simulations and guided opportunities to
learn from them. The current lesson designs that use text, audio,
and graphics to describe content will survive. However, these will
be supplemented by lessons that encourage the building of mental
models and problem-solving skills.
• e-Learning will increasingly be used to make invisible processes
and events visible. Learners will be able to see maps of their own
problem-solving activities and compare them to expert maps. Addi-
tionally, learners will be able to “see” invisible processes, such as
how equipment works internally or how to know what a customer
is thinking.
• Alternative representations will be used to help to see dynamic
relationships in ways that can only be described in other media.
420.
Applying the Guidelines 403
For example, in training of food professionals, a “germ meter” can
be used to illustrate the effects of various methods of preparation
and handling of food. The relationship between germ density and
heat can be illustrated by a dynamic chart that graphs the number of
germs as a function of temperature and time of cooking.
• Collaborative e-learning features will be used more extensively and
more effectively. Teams of learners will work asynchronously to solve
case problems and contribute to ongoing corporate lessons learned
about issues relevant to a specific industry or cross-industry profession.
Four Years Later. We have not seen much evidence that e-learning designed
to build problem-solving skills has evolved much beyond our first edition.
Trainers remain hard pressed to produce training that teaches the basic
tasks of the job and lack time and resources to focus on problem-solving
or thinking skills. However, the new interest in games and simulations may
offer a window of opportunity for strategic problem-solving e-learning.
Our last point in the second prediction focused on greater use of collab-
orative e-learning features. The emergence of the Web-2 with social software
tools such as blogs and wikis supports this prediction. We hope that the next
few years will provide a more cohesive set of research-based guidelines for
the application of collaborative tools for learning than we can offer at the
present time.
In Conclusion
We have been gratified by the response to the first edition of our book. We
believe that workforce learning is moving beyond a crafts approach based
on fads and folk wisdom toward a true profession. Professionals base their
decisions on many factors, one of which is evidence. We hope the guidelines
and supporting evidence in this second edition will support the professional
evolution of workforce learning.
422.
REFERENCES
Alexander, P.A., & Winne, P.H. (Eds.) (2006). Handbook of educational
psychology (2nd ed.). Mahwah, NJ: Lawrence Erlbaum.
Anderson, J.R., Farrell, R., & Sauers, R. (1984). How subject-matter knowl-
edge affects recall and interest. American Educational Research Journal,
31, 313–337.
Atkinson, R.K. (2002). Optimizing learning from examples using animated
pedagogical agents. Journal of Educational Psychology, 94, 416–427.
Atkinson, R.K., & Derry, S.J. (2000). Computer-based examples designed to
encourage optimal example processing: A study examining the impact of
sequentially presented, subgoal-oriented worked examples. In B. Fishman
& S.F. O’Connor-Divelbill (Eds.), Proceedings of the Fourth International
Conference of Learning Sciences (pp. 132–133). Hillsdale, NJ: Lawrence
Erlbaum.
Atkinson, R.K., Derry, S.J., Renkl, A., & Wortham, D. (2000). Learning
from examples: Instructional principles from the worked examples
research. Review of Educational Research, 70(2), 181–214.
Atkinson, R.K., Mayer, R.E., & Merrill, M.M. (2005). Fostering social
agency in multimedia learning: Examining the impact of an animated
agent’s voice. Contemporary Educational Psychology, 30, 117–139.
Atkinson, R.K., Renkl, A., & Merrill, M.M. (2003). Transitioning from
studying examples to solving problems: Effects of self-explanation
prompts and fading worked out steps. Journal of Educational Psychology,
95(4), 774–783.
Ayres, P., & Sweller, J. (2005). The split-attention principle in multimedia
learning. In R.E. Mayer (Ed.), The Cambridge handbook of multimedia
learning (pp. 135–146). New York: Cambridge University Press.
405
423.
406 References
Baggett, P. (1984). Role of temporal overlap of visual and auditory material
in forming dual media associations. Journal of Educational Psychology,
76, 408–417.
Baggett, P., & Ehrenfeucht, A. (1983). Encoding and retaining information
in the visuals and verbals of an educational movie. Educational Communi-
cations and Technology Journal, 31, 23–32.
Bahrick, H.P. (1987). Retention of Spanish vocabulary over eight years.
Journal of Experimental Psychology: Learning, Memory, and Cognition,
13, 344–349.
Beck, I., McKeown, M.G., Sandora, C., Kucan, L., & Worthy, J. (1996).
Questioning the author: A year-long classroom implementation to engage
students in text. Elementary School Journal, 96, 385–414.
Belanich, J., Sibley, D.E., & Orvis, K.L. (2004). Instructional characteristics
and motivational features of a PC-based game. Washington, DC: U.S.
Army Research Institute for the Behavioral and Social Sciences, Research
Report 1822.
Bell, B.S., & Kozlowski, S.W.J. (2002). Adaptive guidance: Enhancing self-
regulation, knowledge, and performance in technology-based training.
Personnel Psychology, 55(2), 267–306.
Bernard, R.M., Abrami, P.C., Lou, Y., Borokhovski, E., Wade, A., Wozney,
L., Wallet, P.A., Fixet, M., & Huant, B. (2004). How does distance educa-
tion compare with classroom instruction? A meta-analysis of the empirical
literature. Review of Educational Research, 74, 379–439.
Betrancourt, M. (2005). The animation and interactivity principles in
multimedia learning. In R.E., Mayer (Ed.), The Cambridge handbook of
multimedia learning (pp. 287–296). New York: Cambridge University
Press.
Brown, P., & Levinson, S.C. (1987). Politeness: Some universals in language
usage. New York: Cambridge University Press.
Butcher, K.R. (2006). Learning from text and diagrams: Promoting mental
model development and inference generation. Journal of Educational
Psychology, 98, 182–197.
424.
References 407
Campbell, J., & Stasser, G. (2006). The influence of time and task demon-
strability on decision making in computer-mediated and face-to-face
groups. Small Group Research, 37(3), 271–294.
Carroll, J.M. (2000). Making use: Scenario-based design of human-computer
interactions. Cambridge, MA: MIT Press.
Carstens, A., & Beck, J. (2005). Get ready for the gamer generation.
TechTrends, 49 (3), 22–25.
Cassell, J., Bickmore, T., Campbell, L., Vilhjalmsson, H., & Yan, H. (2000).
Human conversation as a system framework: Designing embodied conver-
sational agents. In J. Cassell, J. Sullivan, S. Prevost, & E. Churchill (Eds.),
Embodied conversational agents (pp. 29–63). Cambridge, MA: MIT Press.
Cassell, J., Sullivan, J., Prevost, S., & Churchill, E. (2000). Embodied conver-
sational agents. Cambridge, MA: MIT Press.
Catrambone, R. (1998). The subgoal learning model: Creating better exam-
ples so that students can solve novel problems. Journal of Experimental
Psychology: General, 127 (4), 355–376.
Chandler, P., & Sweller, J. (1991). Cognitive load theory and the format of
instruction. Cognition and Instruction, 8, 293–332.
ChanLin, L. (1998). Animation to teach students of different knowledge
levels. Journal of Instructional Psychology, 25, 166–175.
Clark, R.E. (1994). Media will never influence learning. Educational
Technology Research and Development, 42 (2), 21–30.
Clark, R.C. (2000). Four architectures of learning. Performance Improvement,
39(10), 31–37.
Clark, R.C. (2003). Building expertise: Cognitive methods for training and
performance improvement (2nd ed.). Silver Spring, MD: International
Society for Performance Improvement.
Clark, R.C. (2007). Developing technical training (3rd ed.). San Francisco,
CA: Pfeiffer.
Clark, R.C., & Kwinn, A. (2007). The new virtual classroom. San Francisco,
CA: Pfeiffer.
425.
408 References
Clark, R.C., & Lyons, C. (2004). Graphics for learning. San Francisco, CA:
Pfeiffer.
Clark, R., Nguyen, F., & Sweller, J. (2006). Efficiency in learning. San Fran-
cisco, CA: Pfeiffer.
Clark, R., & Nguyen, F. (2007). Behavioral, cognitive, and technological
models for performance improvement. In J.M. Spector, M.D. Merrill,
J.J.G. van Merrienboer, & M.P. Driscoll (Eds.), Handbook of research on
educational communications and technology (3rd ed.). Mahwah, NJ: Law-
rence Erlbaum.
Cohen, J. (1988). Statistical power analysis for the behavioral sciences (2nd ed.).
Mahwah, NJ: Lawrence Erlbaum.
Corbalan, G., Kester, L., & Van Merrienboer, J.J.G. (2006). Towards a
personalized task selection model with shared instructional control.
Instructional Science, 34, 399–422.
Craig, S.D., Gholson, B., & Driscoll, D.M. (2002). Animated pedagogical
agents in multimedia learning environments: Effects of agent properties,
picture features, and redundancy. Journal of Educational Psychology, 94,
428–434.
Crossman, E.R.F.W. (1959). A theory of the acquisition of speed skill.
Ergonomics, 2, 153–166.
Cuban, L. (1986). Teachers and machines: The classroom use of technology
since 1920. New York: Teachers College Press.
Debowski, S., Wood, R.E., & Bandura, A. (2001). Impact of guided explo-
ration and enactive exploration on self-regulatory mechanisms and
information acquisition through electronic search. Journal of Applied
Psychology, 86 (6), 1129–1141.
DeJong, T. (2005). The guided discovery principle in multimedia learning.
In R.E. Mayer (Ed.), The Cambridge handbook of multimedia learning.
New York: The Cambridge University Press.
DeJong, T., & Van Joolingen, W.R. (1998). Scientific discovery learning
with computer simulations of conceptual domains. Review of Educational
Research, 68(2), 179–201.
426.
References 409
DeRouin, R.E., Fritzsche, B.A., & Salas, E. (2004). Optimizing e-learning:
Research-based guidelines for learner-controlled training. Human Resource
Management, 43(2–3), 147–162.
De Wever, B., Van Winckle, M., & Valcke, M. (2006). Discussing patient
management online: The impact of roles on knowledge construction
for students interning at the pediatric ward. Advances in Health Sciences
Education.
Dewey, J. (1913). Interest and effort in education. Cambridge, MA: Houghton
Mifflin.
Dillon, A., & Gabbard, R. (1998). Hypermedia as an educational technol-
ogy: A review of the quantitative research literature on learner compre-
hension, control, and style. Educational Psychology, 81, 240–246.
Dixon, N.M. (1990). The relationship between training responses on par-
ticipant reaction forms and posttest scores. Human Resource Development
Quarterly, 1(2), 129–137.
Dolezalek, H. (2005). The 2005 industry report. Training, 42(12).
Duncker, K. (1945). On problem solving. Psychological Monographs, 58, 270.
Ebbinghaus, N. (1913). Memory (N.R., Ruger & C.E., Bussenius, Trans.).
New York: Teacher’s College. (Original work published 1885.)
Entertainment Software Association. (2006). Sales, demographic and
usage data: Essential facts about the computer and video game industry.
Accessed August 21, 2006, from www.theesa.com/archieves/files/
essentail%Facts%202006.pdf
Ericsson, K.A. (2006). The influence of experience and deliberate practice
on the development of superior expert performance. In K.A., Ericsson,
N., Charness, P.J., Feltovich, & R.R., Hoffman (Eds.), The Cambridge
handbook of expertise and expert performance. New York: Cambridge
University Press.
Eva, K.W., Cunnington, J.P.W., Reiter, H.I., Keane, D.R., & Norman,
G.R. (2004). How can I know what I don’t Know? Poor self-assess-
ment in a well-defined domain. Advances in Health Sciences Education,
9, 211–224.
427.
410 References
Fletcher, J.D., & Tobias, S. (2005). The multimedia principle. In R.E. Mayer
(Ed.), The Cambridge handbook of multimedia learning (pp. 117–134).
New York: Cambridge University Press.
Galvin, T. (2001). 2001 industry report. Training, 38(10), 40–75.
Garner, R., Gillingham, M., & White, C. (1989). Effects of seductive details
on macroprocessing and microprocessing in adults and children. Cognition
and Instruction, 6, 41–57.
Gay, G. (1996). Interaction of learner control and prior understanding in
computer-assisted video instruction. Journal of Educational Psychology,
78(3), 225–227.
Gentner, D., Loewenstein, J., & Thompson, L. (2003). Learning and
transfer: A general role for analogical encoding. Journal of Educational
Psychology, 95(2), 393–408.
Gick, M.L., & Holyoak, K.J. (1980). Analogical problem solving. Cognitive
Psychology, 12, 306–355.
Ginns, P. (2005). Meta-analysis of the modality effect. Learning and
Instruction, 15, 313–331.
Glenberg, A.M., Sanocki, T., Epstein, W., & Morris, C. (1987). Enhancing
calibration of comprehension. Journal of Experimental Psychology: General,
116 (2), 119–136.
Glenberg, A.M., Wilkinson, A.C., & Epstein, W. (1992). The illusion
of knowing: Failure in the self-assessment of comprehension. In T.O.
Nelson (Ed.), Metacognition: Core readings. Boston, MA: Allyn & Bacon.
Gosen, J., Washbush, J. (2004). A review of scholarship on assessing experi-
ential learning effectiveness. Simulation and Gaming, 35(2), 270–293.
Hall, W.E., & Cushing, J.R. (1947). The relative value of three methods of
presenting learning material. Journal of Psychology, 24, 57–62.
Harp, S.F., & Mayer, R.E. (1997). The role of interest in learning from
scientific text and illustrations: On the distinction between emotional
interest and cognitive interest. Journal of Educational Psychology, 89,
92–102.
428.
References 411
Harp, S.F., & Mayer, R.E. (1998). How seductive details do their damage:
A theory of cognitive interest in science learning. Journal of Educational
Psychology, 90, 414–434.
Hays, R.T. (2005). The effectiveness of instructional games: A literature
review and discussion. Technical Report 2005–004. Washington, DC:
Naval Air Warfare Center Training Systems Division.
Hegarty, M., Carpenter, P.A., & Just, M.A. (1996). Diagrams in the com-
prehension of scientific texts. In R. Barr, M.L. Kamil, P. Mosenthal, &
P.D. Pearson (Eds.), Handbook of reading research (Vol. II) (pp. 641–668).
Mahwah, NJ: Lawrence Erlbaum.
Hegarty, M., Kriz, S., & Cate, C. (2003). The role of mental animations and
external animations in understanding mechanical systems. Cognition and
Instruction, 21, 325–360.
Hegarty, M. (2004). Dynamic visualizations and learning: Getting to the
difficult questions. Learning and Instruction, 14, 343–351.
Hmelo-Silver, C.E. (2004). Problem-based learning: What and how do
students learn? Educational Psychology Review, 16 (3), 235–266.
Hidi, S., & Renninger, K.A. (2006). The four-phase model of interest
development. Educational Psychologist, 41, 67–77.
Inglese, T., Mayer, R.E., & Rigotti, F. (2007). Using audiovisual TV inter-
views to create visible authors that reduce the learning gap between native
and non-native speakers. Learning and Instruction, 16, 67–77.
Industry Report. (2006). Training, 38(12), 20–32. Accessed December 8,
2006, from www.Trainingmag.com.
Issenberg, S.B., McGaghie, W.C., Petrusa, E.R., Gordon, D.L., & Scalese, R.J.
(2005). Features and uses of high fidelity medical simulations that lead to
effective learning: A BEME systematic review. Medical Teacher, 27 (1), 10–29.
Johnson, D.W., & Johnson, R.T. (1992). Creative controversy: Intellectual
challenge in the classroom. Edina, MN.: Interaction Book Company.
Jonassen, D.H. (Ed.). (2004). Handbook of research on educational
communications and technology (2nd ed.). Mahwah, NJ: Lawrence Erlbaum.
429.
412 References
Jonassen, D.H., & Kwon, H.I. (2001). Communication patterns in computer-
mediated versus face-to-face group problem solving. Educational Technology
Research and Development 49(1), 35–51.
Jonassen, D.H., Lee, C.B., Yang, C-C., & Laffey, J. (2005). The collabo-
ration principle in multimedia learning. In R.E. Mayer (Ed.), The
Cambridge handbook of multimedia learning, New York: Cambridge
University Press.
Ju, E., & Wagner, C. (1997). Personal computer adventure games: Their
structure, principles, and applicability for training. The DATA BASE for
Advances in Information Systems, 28(2), 78–92.
Kalyuga, S. (2005). Prior knowledge principle in multimedia learning.
In R.E. Mayer (Ed.), The Cambridge handbook of multimedia learning
(pp. 325–337). New York: Cambridge University Press.
Kalyuga, S., Ayres, P., Chandler, P., & Sweller, J. (2003). Expertise reversal
effect. Educational Psychologist, 38, 23–31.
Kalyuga, S., Chandler, P., & Sweller, J. (1998). Levels of expertise and
instructional design. Human Factors, 40, 1–17.
Kalyuga, S., Chandler, P., & Sweller, J. (1999). Managing split attention and
redundancy in multimedia instruction. Applied Cognitive Psychology, 13,
351–372.
Kalyuga, S., Chandler, P., & Sweller, J. (2000). Incorporating learner experi-
ence into the design of multimedia instruction. Journal of Educational
Psychology, 92, 126–136.
Kalyuga, S., Chandler, P., & Sweller, J. (2004). When redundant on-screen
text in multimedia technical instruction can interfere with learning.
Human Factors, 46, 567–581.
Kalyuga, S., Chandler, P., Tuovinen, J., & Sweller, J. (2001). When problem
solving is superior to studying worked examples. Journal of Educational
Psychology, 93, 579–588.
Kenz, I., & Hugge, S. (2002). Irrelevant speech and indoor lighting: Effects of
cognitive performance and self-reported affect. Applied Cognitive Psychology,
15, 709–718.
430.
References 413
Kiewra, K.A., & Creswell, J.W. (2000). Conversations with three highly pro-
ductive educational psychologists: Richard Anderson, Richard Mayer, and
Michael Pressley. Educational Psychology Review, 12(1), 135–159.
Kirschner, P.A. (2005). Technology-based collaborative learning: A European
perspective. Educational Technology, 45, 5–7.
Kirschner, P., Strijbos, J., Kreijns, K., & Beers, P.J. (2004). Designing elec-
tronic collaborative learning environments. Educational Technology
Research and Development, 52(3), 47–66.
Kumta, S.M., Psang, P.L., Hung, L.K., & Chenge, J.C.Y. (2003). Fostering
critical thinking skills through a web-based tutorial program for first-year
medical students: A randomized controlled study. Journal of Educational
Multimedia and Hypermedia, 12(3), 267–273.
Lajoie, S.P., Azevedo, R., & Fleiszer, D.M. (1998). Cognitive tools for assess-
ment and learning in a high information flow environment. Journal of
Educational Computing Research, 18, 205–235.
Lajoie, S.P., Lavigne, N.C., Guerrera, C., & Munsie, S.D. (2001). Constructing
knowledge in the context of BioWorld. Instructional Science, 29, 155–186.
Lajoie, S.P., & Nakamura, C. (2005). Multimedia learning of cognitive skills.
In R.E. Mayer (Ed), The Cambridge handbook of multimedia learning.
New York: Cambridge University Press.
Lee, H., Plass, J.L., and Homer, B.C. (2006). Optimizing cognitive load for
learning from computer-based science simulations. Journal of Educational
Psychology, 98 (4), 902–913.
Lee, S., & Lee, Y.H.K. (1991). Effects of learner-control versus program
control strategies on computer-aided learning of chemistry prob-
lems: For acquisition or review? Journal of Educational Psychology, 83,
491–498.
LeFevre, J.A., & Dixon, P. (1986). Do written instructions need examples?
Cognition and Instruction, 3, 1–30.
Leahy, W., Chandler, P., & Sweller, J. (2003). When auditory presenta-
tions should and should not be a component of multimedia instruction.
Applied Cognitive Psychology, 17, 401–418.
431.
414 References
Lesgold, A., Eggan, G., Katz, S., & Rao, G. (1993). Possibilities for assessment
using computer-based apprenticeship environments. In M. Rabinowitz (Ed.),
Cognitive science foundations of instruction. Mahwah, NJ: Lawrence Erlbaum.
Lester, J.C., Towns, S.G., Callaway, C.B., Voerman, J.L., & Fitzgerald, P.J.
(2000). Deictic and emotive communication in animated pedagogical
agents. In J. Cassell, J. Sullivan, S. Prevost, & E. Churchill (Eds.), Embodied
conversational agents (pp. 123–154). Cambridge, MA: MIT Press.
Leutner, D. (1993). Guided discovery learning with computer-based simula-
tion games: Effects of adaptive and non-adaptive instructional support.
Learning and Instruction, 3, 113–132.
Lorch, R.F., Jr., Lorch, E.P., Ritchey, K., McGovern, L., & Coleman, (2001).
Effects of headings on text summarization. Contemporary Educational
Psychology, 26, 171–191.
Lou, Y., Abrami, P.C., & d’Apollonia, S. (2001). Small group and individual
learning with technology: A meta-analysis. Review of Educational Research,
71, 449–521.
Low, R., & Sweller, J. (2005). The modality effect in multimedia learning.
In R.E. Mayer (Ed.), The Cambridge handbook of multimedia learning
(pp. 147–158). New York: Cambridge University Press.
Leung, A.C.K. (2003). Providing navigation aids and online learning helps
to support user control: A conceptual model on computer-based learning.
The Journal of Computer Information Systems, 43(3), 10–17.
Malone, T.W. (1981). Toward a theory of intrinsically motivating instruction.
Cognitive Science, 4, 333–369.
Malone, T.W., & Lepper, M.R. (1987). Making learning fun: A taxonomy
of intrinsic motivations for learning. In R.E. Snow & M.J. Farr (Eds.),
Aptitude, learning and instruction. Mahwah, NJ: Lawrence Erlbaum.
Mautone, P.D., & Mayer, R.E. (2001). Signaling as a cognitive guide in
multimedia learning. Journal of Educational Psychology, 81, 240–246.
Mayer, R.E. (1983). Can you repeat that? Qualitative effects of repetition
and advance organizers on learning from visual and verbal summaries of
science textbook lessons. Journal of Educational Psychology, 75, 40–49.
432.
References 415
Mayer, R.E. (1989a). Models for understanding. Review of Educational
Research, 59, 43–64.
Mayer, R.E. (1989b). Systematic thinking fostered by illustrations in
scientific text. Journal of Educational Psychology, 81, 240–246.
Mayer, R.E. (1993). Illustrations that instruct. In R. Glaser (Ed.), Advances
in instructional psychology (Vol. 4, pp. 253–284). Mahway, NJ:
Lawrence Erlbaum.
Mayer, R.E. (1998). Cognitive, metacognitive, and motivational aspects of
problem solving. Instructional Science, 26, 49–63.
Mayer, R.E. (2001a). Multimedia learning. New York: Cambridge Univer-
sity Press.
Mayer, R.E. (2001b). Cognitive constraints on multimedia learning: When
presenting more material results in less learning. Journal of Educational
Psychology, 93, 187–198.
Mayer, R.E. (2003). Learning and instruction. Upper Saddle River, NJ:
Merrill Prentice Hall.
Mayer, R.E. (2004). Should there be a three-strikes rule against pure discov-
ery learning: The case for guided methods of instruction. American Psy-
chologist, 59(1), 14–19.
Mayer, R.E. (Ed.). (2005a). The Cambridge handbook of multimedia learning.
New York: Cambridge University Press.
Mayer, R.E. (2005b). Principles for reducing extraneous processing in multi-
media learning: Coherence, signaling, redundancy, spatial contiguity, and
temporal contiguity. In R.E. Mayer (Ed.), The Cambridge handbook of mul-
timedia learning (pp. 183–200). New York: Cambridge University Press.
Mayer, R.E. (2005c). Principles for managing essential processing in
multimedia learning: Segmenting, pretraining, and modality principles.
In R.E. Mayer (Ed.), The Cambridge handbook of multimedia learning
(pp. 147–158). New York: Cambridge University Press.
Mayer, R.E. (2005d). Principles based on social cues: Personalization, voice,
and image principles. In R.E. Mayer (Ed.), The Cambridge handbook of
multimedia learning (pp. 201–212). New York: Cambridge University Press.
433.
416 References
Mayer, R.E. (2005e). Introduction to multimedia learning. In R.E. Mayer
(Ed.), The Cambridge handbook of multimedia learning (pp. 1–18).
New York: Cambridge University Press.
Mayer, R.E. (2008) Learning and instruction (2nd ed.). Upper Saddle River,
NJ: Pearson Merrill Prentice Hall.
Mayer, R.E. (in press). Research-based guidelines for multimedia instruc-
tion. In D.A. Boehm-Davis (Ed.), Annual review of human factors and
ergonomics (Vol. 3). Santa Monica, CA: Human Factors and Ergonomics
Society.
Mayer, R.E., & Anderson, R.B. (1991). Animations need narrations: An
experimental test of a dual-processing systems in working memory.
Journal of Educational Psychology, 90, 312–320.
Mayer, R.E., & Anderson, R.B. (1992). The instructive animation: Helping
students build connections between words and pictures in multimedia
learning. Journal of Educational Psychology, 84, 444–452.
Mayer, R.E., Bove, W., Bryman, A., Mars, R., & Tapangco, L. (1996). When
less is more: Meaningful learning from visual and verbal summaries of
science textbook lessons. Journal of Educational Psychology, 88, 64–73.
Mayer, R.E., & Chandler, P. (2001). When learning is just a click away: Does
simple user interaction foster deeper understanding of multimedia mes-
sages? Journal of Educational Psychology, 93, 390–397.
Mayer, R.E., Dow, G., & Mayer, S. (2003). Multimedia learning in an inter-
active self-explaining environment: What works in the design of agent-
based microworlds? Journal of Educational Psychology, 95, 806–813.
Mayer, R.E., Fennell, S., Farmer, L., & Campbell, J. (2004). A personaliza-
tion effect in multimedia learning: Students learn better when words are
in conversational style rather than formal style. Journal of Educational
Psychology, 96, 389–395.
Mayer, R.E., & Gallini, J.K. (1990). When is an illustration worth ten thou-
sand words? Journal of Educational Psychology, 88, 64–73.
Mayer, R.E., Hegarty, M., Mayer, S., & Campbell, J. (2005). When static
media promote active learning: Annotated illustrations versus narrated
434.
References 417
animations in multimedia instruction. Journal of Experimental Psychology:
Applied, 11, 256–265.
Mayer, R.E., Heiser, J., & Lonn, S. (2001). Cognitive constraints on mul-
timedia learning: When presenting more material results in less under-
standing. Journal of Educational Psychology, 93, 187–198.
Mayer, R.E., & Jackson, J. (2005). The case for coherence in scientific expla-
nations: Quantitative details can hurt qualitative understanding. Journal
of Experimental Psychology: Applied, 11, 13–18.
Mayer, R.E., Johnson, L., Shaw, E., & Sahiba, S. (2006). Constructing com-
puter-based tutors that are socially sensitive: Politeness in educational
software. International Journal of Human Computer Studies, 64, 36–42.
Mayer, R.E., Mathias, A., & Wetzell, K. (2002). Fostering understanding
of multimedia messages through pretraining: Evidence for a two-stage
theory of mental model construction. Journal of Experimental Psychology:
Applied, 8, 147–154.
Mayer, R.E., Mautone, P., & Prothero, W. (2002). Pictorial aids for
learning by doing in a multimedia geology simulation game. Journal of
Educational Psychology, 94 (1), 171–185.
Mayer, R.E., & Moreno, R. (1998). A split-attention effect in multimedia
learning: Evidence for dual coding hypothesis. Journal of Educational
Psychology, 83, 484–490.
Mayer, R.E., & Moreno, R. (2003). Nine ways to reduce cognitive load in
multimedia learning. Educational Psychologist, 38, 43–52.
Mayer, R.E., Moreno, R., Boire, M., & Vagge, S. (1999). Maximizing con-
structivist learning from multimedia communications by minimizing
cognitive load. Journal of Educational Psychology, 91, 638–643.
Mayer, R.E., & Sims, V. (1994). For whom is a picture worth a thousand
words? Extensions of a dual-coding theory of multimedia learning.
Journal of Educational Psychology, 86, 389–401.
Mayer, R.E., Sims, V., & Tajika, H. (1995). A comparison of how textbooks
teach mathematical problem solving in Japan and the United States.
American Educational Research Journal, 32, 443–460.
435.
418 References
Mayer, R.E., Sobko, K., & Mautone, P.D. (2003). Social cues in multimedia
learning: Role of speaker’s voice. Journal of Educational Psychology, 95,
419–425.
Mayer, R.E., Steinhoff, K., Bower, G., & Mars, R. (1995). A generative theory of
textbook design: Using annotated illustrations to foster meaningful learning
of science text. Educational Technology Research and Development, 43, 31–43.
Mayer, R.E., & Wittrock, M.C. (1996). Problem-solving transfer. In D.C.
Berliner & R.C. Calfee (Eds.), Handbook of educational psychology.
New York: Macmillan.
McDaniel, M.A., & Donnelly, C.M. (1996). Learning with analogy and
elaborative interrogation. Journal of Educational Psychology, 88, 508–519.
McGill, L., Nicol, D., Littlejohn, A., Gierson, H., Juster, N., & Ion, W.J.
(2005). Creating an information-rich learning environment to enhance
design student learning: Challenges and Approaches. British Journal of
Educational Technology, 36 (4), 629–642.
Moreno, R. (2004). Decreasing cognitive load for novice students: Effects
of explanatory versus corrective feedback in discovery-based multimedia.
Instructional Science, 32, 99–113.
Moreno, R. (2005). Multimedia learning with animated pedagogical agents.
In R.E. Mayer (Ed.), The Cambridge handbook of multimedia learning
(pp. 507–524). New York: Cambridge University Press.
Moreno, R., & Mayer, R.E. (1999a). Cognitive principles of multimedia
learning: The role of modality and contiguity. Journal of Educational Psy-
chology, 91, 358–368.
Moreno, R., & Mayer, R.E. (1999b). Multimedia-supported metaphors for
meaning making in mathematics. Cognition and Instruction, 17, 215–248.
Moreno, R., & Mayer, R.E. (2000a). A coherence effect in multimedia learn-
ing: The case for minimizing irrelevant sounds in the design of multimedia
instructional messages. Journal of Educational Psychology, 92, 117–125.
Moreno, R., & Mayer, R.E. (2000b). Engaging students in active learning:
The case for personalized multimedia messages. Journal of Educational
Psychology, 93, 724–733.
436.
References 419
Moreno, R., & Mayer, R.E. (2002a). Verbal redundancy in multimedia
learning: When reading helps listening. Journal of Educational Psychology,
94, 156–163.
Moreno, R., & Mayer, R.E. (2002b). Learning science in virtual reality
multimedia environments: Role of methods and media. Journal of Educa-
tional Psychology, 94, 598–610.
Moreno, R., & Mayer, R.E. (2004). Personalized messages that promote sci-
ence learning in virtual environments. Journal of Educational Psychology,
96, 165–173.
Moreno, R., & Mayer, R.E. (2005). Role of guidance, reflection, and
interactivity in an agent-based multimedia game. Journal of Educational
Psychology, 97, 117–128.
Moreno, R., & Mayer, R.E. (2005). Role of guidance, reflection, and
interactivity in an agent-based multimedia game. Journal of Educational
Psychology, 97(1), 117–128.
Moreno, R., & Mayer, R.E. (in press). Interactive multimodal learning envi-
ronments. Educational Psychology Review.
Moreno, R., Mayer, R.E., Spires, H., & Lester, J. (2001). The case for social
agency in computer-based teaching: Do students learn more deeply
when they interact with animated pedagogical agents? Cognition and
Instruction, 19, 177–214.
Mosteller, F., & Boruch, R. (Eds.). (2002). Evidence matters: Randomized tri-
als in educational research. Washington, DC: Brookings Institution Press.
Mousavi, S., Low, R., & Sweller, J. (1995). Reducing cognitive load by
mixing auditory and visual presentation modes. Journal of Educational
Psychology, 87, 319–334.
Nass, C., & Brave, S. (2005). Wired for speech: How voice activates and
advances the human-computer relationship. Cambridge, MA: MIT Press.
National Research Council. (1994b). Illusions of comprehension,
competence, and remembering. In D. Druckman and R.A. Bjork
(Eds.), Learning, remembering, believing. Washington, DC: National
Academy Press.
437.
420 References
Nelson, T.O. (1996). Consciousness and metacognition. American Psychologist,
51(2), 102–116.
Neiderhauser, D.S., Reynolds, R.E., Salmen, D.J., & Skolmoski, P. (2000).
The influence of cognitive load on learning from hypertext. Journal of
Educational Computing Research, 23, 237–255.
Nolen, S. (1995). Effects of a visible author in statistical texts. Journal of
Educational Psychology, 87, 47–65.
Norman, D.A. (1993). Things that make us smart. Reading, MA: Addison-
Wesley.
Norman, G.R. (2005). Inverting the pyramid. Advances in Health Sciences
Education, 10, 85–88.
Nussbaum, E.M. (2005), The effect of goal instructions and need for cogni-
tion on interactive argumentation. Contemporary Educational Psychology,
30(3), 286–313.
Nussbaum, E.M., & Kardash, C.M. (2005). The effects of goal instructions
and text on the generation of counter-arguments during writing. Journal
of Educational Psychology, 97 (2), 157–169.
Ollerenshaw, A., Aidman, E., & Kidd, G. (1997). Is an illustration always
worth ten thousand words? Effects of prior knowledge, learning style, and
multimedia illustrations on text comprehension. International Journal of
Instructional Media, 24, 227–238.
O’Neil, H.F., Mayer, R.E., Herl, H.E., Niemi, C., Olin, K., & Thurman,
R.A. (2000). Instructional strategies for virtual aviation training environ-
ments. In H.F. O’Neil and D.H. Andrews (Eds.), Aircrew training and
assessment (pp. 105–130). Mahwah, NJ: Lawrence Erlbaum.
Paas, F.G.W.C., & van Merrienboer, J.J.G. (1994). Instructional control of
cognitive load in the training of complex cognitive tasks. Educational
Psychology Review, 6, 351–371.
Paxton, R. (2002). The influence of author visibility on high school
students solving a historical problem. Cognition and Instruction, 20,
197–248.
438.
References 421
Perkins, D.N., & Salomon, G. (1989). Are cognitive skills context-bound?
Educational Researcher, 18 (1), 16–25.
Phye, G.D., Robinson, D.H., & Levin, J. (Eds.). (2005). Empirical methods
for evaluating educational interventions. San Diego, CA: Elsevier.
Pink, D.H. (2005). A whole new mind: Why right-brainers will rule the future.
New York: Penguin Group.
Plant, E.A., Ericsson, K.A., Hill, L., & Asberg, K. (2005). Why study time
does not predict grade point average across college students: Implications
of deliberate practice for academic performance. Contemporary Educa-
tional Psychology, 30, 96–116.
Pollock, E., Chandler, P., & Sweller, J. (2002). Assimilating complex
information. Learning and Instruction, 12, 61–86.
Potelle, H., & Rouet, J.F. (2003). Effects of content representation
and readers’ prior knowledge on the comprehension of hypertext.
International Journal of Human Computer Studies, 58, 327–345.
Prensky, M. (2001). Digital game-based learning. New York: McGraw-Hill.
Prichard, J.S., Bizo, L.A., & Stratford, R.J. (2006). The educational impact
of team-skills training: Preparing students to work in groups. British
Journal of Educational Psychology, 76, 119–140.
Quilici, J.L., & Mayer, R.E. (1996). Role of examples in how students learn
to categorize statistics word problems. Journal of Educational Psychology,
88(1), 144–161.
Randel, J.M., Morris, B.A., Wetzel, C.D., & Whitehill, B.V. (1992). The
effectiveness of games for educational purposes: A review of recent
research. Simulation and Gaming, 23(3), 261–276.
Ransdell, S.E., & Gilroy, L. (2001). The effects of background music on
word proceeded writing. Computers in Human Behavior, 17, 141–148.
Rawson, K.A., & Kintsch, W. (2005). Rereading effects depend on time of
test. Journal of Educational Psychology, 97 (1), 70–80.
Reed, S.K., Dempster, A., & Ettinger, M. (1985). Usefulness of analogous
solutions for solving algebra word problems. Journal of Experimental
Psychology: Learning, Memory, and Cognition, 11, 106–125.
439.
422 References
Reeves, B., & Nass, C. (1996). The media equation: How people treat
computers, television, and new media like real people and places. New York:
Cambridge University Press.
Renkl, A. (2005). The worked out examples principles in multimedia
learning. In R.E. Mayer (Ed.), The Cambridge handbook of multimedia
learning. New York: Cambridge University Press.
Renkl, A. (2002). Learning from worked-out examples: Instructional explanations
supplement self-explanations. Learning and Instruction, 12, 529–556.
Renninger, K.A., Hidi, S., & Krapp. A. (1992). The role of interest in learning
and development. Mahwah, NJ: Lawrence Erlbaum.
Ricer, R.E., Filak, A.T., & Short, J. (2005). Does a high tech (computer-
ized, animated, PowerPoint) presentation increase retention of material
compared to a low tech (black on clear overheads) presentation? Teaching
and Learning in Medicine, 17 (2), 107–111.
Rickel, J., & Johnson, L.W. (2000). Task-oriented collaboration with embodied
agents in virtual worlds. In J. Cassell, J. Sullivan, S. Prevost, & E. Churchill
(Eds.), Embodied conversational agents. Cambridge, MA: MIT Press.
Richart, R., & Perkins, D.N. (2005). Learning to think: The challenges
of teaching thinking. In K.J. Holyoak & R.G. Morrison (Eds.), The
Cambridge handbook of thinking and reasoning. New York: Cambridge
University Press.
Rieber, L.P. (2005). Multimedia learning in games, simulations, and micro-
worlds. In R.E. Mayer (Ed.), The Cambridge handbook of multimedia
learning. New York: Cambridge University Press.
Rieber, L.P., Tzeng, S.C., & Tribble, K. (2004). Discovery learning, represen-
tation, and explanation within a computer-based simulation: Finding the
right mix. Learning and Instruction, 14, 307–323.
Robinson, D.H. (2002). Spatial text adjuncts and learning: An introduction
to the special issue. Educational Psychology Review, 14, 1–3.
Rosenbaum, D.A., Carlson, R.A., & Gilmore, R.O. (2001). Acquisition
of intellectual and perceptual motor skills. Annual Review of Psychology,
52, 453–470.
440.
References 423
Rouet, J.F., & Potelle, H. (2005). Navigational principles in multimedia
learning. In R.E. Mayer (Ed.), The Cambridge handbook of multimedia
learning. New York: Cambridge University Press.
Sanchez, C.A., & Wiley, J. (2006). An examination of the seductive details
effect in terms of working memory capacity. Memory & Cognition, 34,
344–355.
Salden, R.J.C.M, Paas, F., Broers, N., & Van Merrienboer, J.G. (2004). Mental
effort and performance as determinants for the dynamic selection of learn-
ing tasks in air traffic control training. Instructional Science, 32, 153–172.
Schmidt, H.E., & Moust, J.H.C. (2000). Factors affecting small-group
tutorial learning: A review of research. In D.H. Evensen & C.E. Hmelo
(Eds.), Problem-based learning. Mahwah, NJ: Lawrence Erlbaum.
Schnackenberg, H.L., Sullivan, H.J., Leader, L.R., & Jones, E.E.K. (1998).
Learner preferences and achievement under differing amounts of learner
practice. Educational Technology Research and Development, 46, 5–15.
Schnackenberg, H.L., & Sullivan, H.J. (2000). Learner control over full and
lean computer based instruction under differing ability levels. Educational
Technology Research and Development, 48, 19–35.
Schoenfeld, A.H. (1987). What’s all the fuss about metacognition? In A.
Schoenfeld (Ed.), Cognitive science and mathematics education. Mahwah,
NJ: Lawrence Erlbaum.
Scott, G., Leritz, L.E., & Mumford, M.D. (2004). The effectiveness of creativity
training: A quantitative review. Creativity Research Journal, 16(4), 361–388.
Seabrook, R., Brown, G.D., & Solity, J.E. (2005). Distributed and massed
practice: From laboratory to classroom. Applied Cognitive Psychology, 19,
107–122.
Shapiro, A.M. (2000). The effect of interactive overviews on the develop-
ment of conceptual structure in novices learning from electronic texts.
Journal of Educational Multimedia and Hypermedia, 9 (1), 57–78.
Shapiro, A.M. (2005). The site map principle in multimedia learning. In
R.E. Mayer (Ed.), The Cambridge handbook of multimedia learning.
New York: Cambridge University Press.
441.
424 References
Shavelson, R.J., & Towne, L. (Eds.). (2002). Scientific research in education.
Washington, DC: National Academy Press.
Slavin, R. (1983). Why does cooperative learning increase student achieve-
ment? Psychological Bulletin, 94, 429–445.
Slavin, R.E., Hurley, E.A., & Chamberlain, A. (2003). Cooperative learning
and achievement: Theory and practice. In W.M. Reynolds & G.E. Miller
(Eds.), Handbook of psychology: Volume 7, Educational psychology
(pp. 177–198). New York: John Wiley & Sons.
Slobada, J.A., Davidson, J.W., Howe, M.J.A., & Moore, D.G. (1996). The
role of practice in the development of performing musicians. British
Journal of Psychology, 87, 287–309.
Steinberg, E.R. (1989). Cognition and learner control: A literature review,
1977–1988. Journal of Computer-Based Instruction, 16(4), 117–121.
Stone, N.J. (2000). Exploring the relationship between calibration and self-
regulated learning. Educational Psychology Review, 4, 437–475.
Suomala, J., & Shaughnessy, M.F. (2000). An interview with Richard
E. Mayer: About technology. Educational Psychology Review, 12(4),
477–483.
Sugrue, B., & Rivera, R.J. (2005). State of the industry: ASTD’s annual review
of trends in workplace learning and performance. Alexandria, VA: American
Society for Training and Development.
Suthers, D., Vatrapu, R., Joseph, S., Dwyer, N., & Medina, R. (2005).
Proceedings of the 39th Hawaiian International Conference on the System
Sciences. Institute of Electrical and Electronics Engineers.
Svetcov, D. (2000). The virtual classroom vs. the real one. Forbes, 166, 50–54.
Sweller, J. (1999). Instructional design in technical areas. Camberwell, Australia:
ACER Press.
Sweller, J. (2005). The redundancy principle in multimedia learning. In
R.E. Mayer (Ed.), The Cambridge handbook of multimedia learning
(pp. 159–167). New York: Cambridge University Press.
Sweller, J., & Chandler, P. (1994). Why some material is difficult to learn.
Cognition and Instruction, 12, 185–233.
442.
References 425
Sweller, J., Chandler, P., Tierney, P., & Cooper, M. (1990). Cognitive load
and selective attention as factors in the structuring of technical mate-
rial. Journal of Experimental Psychology: General, 119, 176–192.
Sweller, J. & Cooper, G.A. (1985). The use of worked examples as a substi-
tute for problem solving in learning algebra. Cognition and Instruction, 2,
59–89.
Sweller, J., van Merrienboer, J.J.G., & Paas, F. (1998). Cognitive architecture
and instructional design. Educational Psychology Review, 10, 251–296.
Tallent-Runnels, M.K., Thomas, J.A., Lan, W.Y., Cooper, S., Ahern, T.C.,
Shaw, S.M., & Shaw, L.X. (2006). Teaching courses online: A review of
the research. Review of Educational Research, 76(1) 93–135.
Tennyson, C.L., Tennyson, R.D., & Rothen, W. (1980). Content structure and
instructional control strategies as design variables in computer assisted instruc-
tion. Educational Communication and Technology Journal, 28, 169–176.
Tversky, B., Morrison, J. B., & Betrancourt, M. (2002). Animation: Can it
facilitate? International Journal of Human-Computer Studies, 57, 247–262.
Uribe, D., Klein, J.D., & Sullivan, H. (2003). The effect of computer-
mediated collaborative learning on solving ill-defined problems.
Educational Technology Research and Development, 51(1), 5–19.
Van Eck, R. (2006). Digital game-based learning. Educause Review, 41(2), 17–30.
Van Merrienboer, J.J.G., & Kester, L. (2005). The four-component instruc-
tional design model: Multimedia principles in environments for complex
learning. In R.E. Mayer (Ed.), The Cambridge handbook of multimedia
learning. New York: Cambridge University Press.
Valaitis, R.K., Sword, W., Jones, B., & Hodges, A. (2005). Problem-based
learning online: Perceptions of health science students. Advances in Health
Sciences Education, 10, 231–252.
Walczyk, J.J., & Hall, V.C. (1989). Effects of examples and embedded
questions on the accuracy of comprehension self-assessments. Journal of
Educational Psychology, 81, 435–437.
Wang, N., Johnson, L., Mayer, R.E., Rizzo, P., Shaw, E., & Collins, H.
(2006). The politeness effect: Pedagogical agents and learning gains. In
443.
426 References
C. Looi, G. McCalla, B. Bredeweg, & J. Breuker (Eds.), Artificial intel-
ligence in education: Supporting learning through intelligent and socially
informed technology (pp. 868–693). Amsterdam: IOS Press.
Wiley, J., & Voss, J.F. (1999). Constructing arguments from multiple
sources: Tasks that promote understanding and not just memory for text.
Journal of Educational Psychology, 91, 301–311.
Yetter, G., Gutkin, T.B., Saunders, A., Galloway, A.M., Sobansky, R.R., &
Song, S.Y. (2006). Unstructured collaboration versus individual practice
for complex problem solving: A cautionary tale. Journal of Experimental
Education, 74(2), 137–159.
Young, J.D. (1996). The effect of self-regulated learning strategies on per-
formance in learner controlled computer-based instruction. Educational
Technology Research and Development, 44, 17–27.
444.
GLOSSARY
Active Processing A psychological principle stating that learning occurs
when people engage in appropriate mental processing
during learning, such as attending to relevant materials,
responding to practice exercises, reflecting on examples.
Adaptive Control A process in which learners are directed or branched to
different instructional materials in a lesson based on the
program’s evaluation of their responses to lesson exercises.
Advance Organizer A device placed in the start of a learning event designed
to provide an overview or big picture of the lesson con-
tent. May take the form of a graphic or table.
Advisement A form of adaptive control in which learners are given
advice as to what actions they should take in a lesson
based on the program’s evaluation of their responses to
lesson exercises or pretests.
Agents Onscreen characters who help guide the learning process
during an e-learning episode. Also called pedagogical agents.
Animation A graphic that depicts movement, such as a video of a
procedure or a moving sequence of line drawings.
Architecture A course design that reflects a theory of learning. Archi-
tectures vary regarding the amount and type of structure
and interactivity included in the lesson.
Arousal Theory The idea that adding entertaining and interesting
material to lessons stimulates emotional engagement that
promotes learning.
Asynchronous Opportunities for learners and/or instructors to interact
Collaborations with each other via computer at different times such as in
a discussion board or email.
427
445.
428 Glossar y
Asynchronous Digitized instructional resources intended for self-study.
e-Learning Learners can access training resources any time and any
place.
Auditory Channel Part of the human memory system that processes
information that enters through the ears and is mentally
represented in the form of sounds.
Automaticity A stage of learning in which new knowledge or skills
can be applied directly from long-term memory without
using working memory capacity. Some common
examples of automatic tasks are driving a car, typing, and
reading. Knowledge becomes automatic only after many
practice repetitions.
Blogs A website on which individuals write commentaries on
an ongoing basis. Visitors can comment or link to a blog.
Breakout Rooms An online conferencing facility that usually supports
audio, whiteboard, polling, and chat, used for small
groups in conjunction with a virtual classroom event.
Calibration The accuracy of self-estimates of knowing. If a learner
estimates low knowledge and scores low on a test, he or
she has good calibration; likewise, if he or she estimates
high knowledge and scores high on a test, he or she has
good calibration.
Chats Two or more participants communicating online at the
same time via text.
Clinical Trials Research comparing the learning outcomes and/or pro-
cesses of people who learn in a test e-learning course versus
people who learn in another venue such as a competing
e-learning course. Also called controlled field testing.
Cognitive Learning An explanation of how people learn based on the idea
Theory of dual channels (information is processed in visual
and auditory channels), limited capacity (only a small
amount of information can be processed in each channel
446.
Glossar y 429
at one time), and active learning (meaningful learning
occurs when learners pay attention to relevant informa-
tion, organize it into a coherent structure, and integrate
it with what they already know). Also called cognitive
theory and cognitive theory of multimedia learning.
Cognitive Load The amount of mental resource in working memory
required by a task.
Cognitive Interest A source of motivation stemming from a learner’s ability
to make sense of the instructional materials. As a result of
understanding the lesson, the learner experiences enjoy-
ment. Contrast with emotional interest.
Cognitive Task Analysis Techniques used to define the thinking processes used
during real-world problem solution.
Collaborative Learning A structured instructional interaction among two or
more learners to achieve a learning goal or complete an
assignment.
Computer-Supported Any instructional program in which two to five
Collaborative Learning individuals work together on an instructional activity or
(CSCL) assignment using digital technology to communicate.
Concept-Lesson Content Refers to a category that includes multiple instances. For
example, web page, spreadsheet, software, e-learning.
Content Analysis Research to define content and content relationships to be
included in an educational course. See also task analysis.
Coherence Principle People learn more deeply from multimedia lessons when
distracting stories, graphics, sounds, and extraneous
words are eliminated.
Contiguity Principle People learn more deeply when corresponding printed
words and graphics are placed close to one another
on the screen or when spoken words and graphics are
presented at the same time.
Control A comparison lesson that does not include the variable
being studied in the treatment lesson. For example,
447.
430 Glossar y
a text-only lesson is a control being compared with a
lesson with both text and graphics.
Controlled Studies Research comparing the learning outcomes and/or pro-
cesses of two or more groups of learners; the groups are
the same except for the variable(s) being studied. Also
called experimental studies.
Conversational Style A writing style that uses first- and second-person
constructions, active voice, and speech-like phrases.
Corrective Feedback Instructional responses to answers to a practice exercise
that tells the learners whether they answered correctly or
incorrectly. Contrast with explanatory feedback.
Course Map A type of menu or concept map that graphically repre-
sents the structure of an online course or lesson. Course
maps have been shown to influence how learners orga-
nize learning content.
Critical Thinking Production of original solutions to novel, ill-defined
problems of relatively high complexity; ability to analyze
and base arguments on valid data.
Decorative Graphics Visuals used for aesthetic purposes or to add humor, such
as a picture of a person riding a bicycle in a lesson on
how bicycle pumps work.
Deep Structure The principle that underlies an example. Contrast with
surface features. See also varied context.
Dependent Variable The outcome measures in an experimental study. In many
learning experiments a test score is the dependent variable.
Design One of the stages in e-learning development in which the
content is defined and summarized in the form of out-
lines, learning objectives, and storyboards.
Development One of the stages in e-learning development in which the
course is created, including graphics, text, programming, etc.
Deliberate Practice Exercises that fall just outside the learner’s level of com-
petence that focus on specific skill gaps and demand
448.
Glossar y 431
focus and reflection. The type of practice that leads to
continued performance improvement.
Directive Architecture Training that primarily asks the learner to make a
response or perform a task and then provides feedback.
Also called show-and-do method. Based on a response-
strengthening view of learning.
Discovery Learning Experiential exploratory instructional interfaces that offer
little structure or guidance.
Disruption A process that interferes with the organization of new
content in memory as a result of irrelevant content get-
ting in the way.
Distraction A process that interferes with the selection process by
taking learner focus away from important instructional
content or methods.
Distributed Practice Exercises that are placed throughout a lesson rather than all
in one location. Long-term learning is better under condi-
tions of distributed practice. Compare to massed practice.
Drag and Drop A facility that allows the user to move objects from one
part of the screen to another. Often used in e-learning
practice exercises.
Dual Channels A psychological principle stating that humans have two
separate channels, one for processing visual/pictorial
material and a second for processing auditory/verbal
material.
Dynamic Adaptive A form of learner control based on a continuous
Control assessment of learner skills during the lesson, followed
by branching to needed instructional methods, topics, or
lessons. Contrast with static adaptive control.
Effect Size A statistic indicating how many standard deviations dif-
ference there is between the mean score of the experi-
mental group and the mean score of the control group.
A useful metric to determine the practical significance of
449.
432 Glossar y
research results. Effect sizes of less than .2 are considered
small, .5 moderate, and .8 or greater large.
e-Learning A combination of content and instructional methods
delivered by media elements such as words and graph-
ics on a computer intended to build job-transferable
knowledge and skills linked to individual learning goals
or organizational performance. May be designed for self-
study or instructor-led training. See asynchronous and
synchronous e-learning.
Emotional Interest A source of motivation stemming from treatments that
induce arousal in learners, such as dramatic visuals or
stories. See also seductive details. Contrast with cognitive
interest.
Encoding Integration of new information entering working mem-
ory into long-term memory for permanent storage.
Encoding Specificity A principle of memory stating that people are better able
to retrieve information if the conditions at the time of
original learning are similar to the conditions at the time
of retrieval. For example, to enable learning of a new
computer system, learners should practice with the same
system they will use on the job so they encode memories
that are identical to the performance environment.
Essential Processing Mental work during learning directed at representing
the content that originates from the inherent complexity
of the content. More complex content requires greater
amounts of essential processing.
Experimental Studies See controlled studies.
Expertise Reversal Effect Instructional methods that are helpful to novice learn-
ers may have no effect or even depress learning of high-
knowledge learners.
Explanatory Feedback Instructional responses to student answers to practice
exercises that tell the learners whether they are correct or
450.
Glossar y 433
incorrect and also provide the rationale or a hint guiding
the learners to a correct answer.
Explanatory Visual A graphic that helps learners build relationships among
content elements. Includes the organizational, relational,
transformational, and interpretive types of visuals.
Exploratory Lessons Lessons that are high in learner control and rely on the
learner to select instructional materials they need.
Extraneous Processing Irrelevant mental work during learning that results from
Load ineffective instructional design of the lesson.
Fact Lesson content that includes unique and specific
information or data. For example, the codes to log into a
system or a specific application screen.
Fading An instructional technique in which learners move from
fully worked examples to full practice exercises through a
series of worked examples in which the learner gradually
completes more of the steps.
Far Transfer Tasks Tasks that require learners to use what they have learned
in a novel situation, such as adjusting a general principle
for a new problem. For example, how to troubleshoot an
unusual system failure or how to write a sales proposal.
See also strategic knowledge.
Feedback Information concerning the correctness of one’s perfor-
mance on a learning task or question. May also include
explanations to guide learners to a correct response.
Formative Evaluation The evaluation of courseware based on learner responses
(test results or feedback) during the development and ini-
tial trials of the courseware.
Game An online environment that involves a competitive activity
with a challenge to achieve a goal, a set of rules and con-
straints, and a specific context. Game features vary dramat-
ically and include games of chance, games based on motor
skills (also called twitch games), and games of strategy.
451.
434 Glossar y
Generative Processing Relevant mental work during learning directed at deeper
understanding of the content that stems from the moti-
vation of the learner to make sense of the material.
Graphic Any iconic representation, including illustrations,
drawings, charts, maps, photos, organizational visuals,
animation, and video. Also called picture.
Guided Discovery An instructional architecture in which the learner is
assigned an authentic job task or case study, along with
guidance from the instructor about how to process the
incoming information. Based on a knowledge construction
view of learning.
Heterogeneous Groups Learners who differ regarding prior knowledge, job
background, culture, or other significant features.
Contrast with homogeneous.
Homogeneous Groups Learners who are similar regarding prior knowledge,
job background, culture, or other significant features.
Contrast with heterogeneous.
Independent Variable The feature that is studied in an experiment. For exam-
ple, in a lesson that uses visuals that is compared to a
lesson that uses text alone, visuals are the independent
variable.
Inform Programs Lessons designed primarily to communicate information
rather than build skills.
Informal Studies Research in which conclusions are based on observing
people as they learn or asking them about their learning.
Also called observational studies.
Information Acquisition A metaphor of learning that assumes that learners absorb
information that is provided to them by the instructor. This
metaphor is the basis for receptive architectures of learning.
Information Delivery An explanation of how people learn based on the idea that
learners directly absorb new information presented in the
instructional environment. Also called the transmission
452.
Glossar y 435
view or the information acquisition view. See also informa-
tion acquisition.
Ill-Defined Tasks Problems for which there is no one correct answer or
approach. For example, designing a website or develop-
ing a patient treatment plan.
Instructional Method A technique in a lesson intended to facilitate cognitive pro-
cessing that underlies learning. For example, a demonstra-
tion, a practice exercise, or feedback to practice responses.
Interdependence A condition in collaborative group work in which the
rewards of each individual member depend to some
degree on the outcomes of all group members. Has been
shown to be an important condition for successful col-
laborative learning.
Integration Process A cognitive process in which visual information and
auditory information are connected with each other and
with relevant memories from long-term memory.
Interpretive Graphics Visuals used to depict invisible or intangible relationships
such as an animation of a bicycle pump that uses small
dots to represent the flow of air.
Interaction See practice.
Job Analysis See task analysis.
Knowledge Construction A metaphor of learning that holds that learners are active
participants in the building of new knowledge by integrat-
ing new content into existing knowledge structures. Cog-
nitive approaches to learning are based on this metaphor.
Learner Control A condition in which the learner can select or man-
age elements of the lesson, such as the pacing, topics,
sequencing, and instructional methods. Asynchronous
e-learning can provide various types of learner control.
Contrast with program control.
Learning Styles The idea that individuals process information in differ-
ent ways based on some specific mental differences. For
453.
436 Glossar y
example, some learners may have an auditory style and
learn better from narration, while others have a visual
style and learn better from graphics. There has not been
good evidence to support learning styles.
Limited Capacity A psychological principle stating that humans have a
small capacity in working memory, allowing them to
actively process only a few pieces of information in each
channel at one time. See also cognitive load.
Link An object on a screen (text or graphic) that when double
clicked leads to additional information on the same or on
different web pages.
Long-Term Memory Part of the cognitive system that stores memories in a
permanent form.
Massed Practice Practice exercises that are placed all in one location in a
lesson. Compare to distributed practice.
Media Element Text, graphics, or sounds used to convey lesson content.
Message Boards A communication facility in which a number of partici-
pants type comments at different times that remain on
the board for others to read and respond to.
Metacognition Awareness and control of one’s learning or thinking pro-
cessing, including setting goals, monitoring progress, and
adjusting strategies as needed. Also called metacognitive
skill and metaskill.
Modality Principle People learn more deeply from multimedia lessons when
graphics are explained by audio narration rather than
onscreen text. Exceptions include situations in which
learners are familiar with the content, are not native
speakers of the narration language, or when only printed
words appear on the screen.
Mouse-Over A technique in which new information appears on the
screen when the user places his or her mouse over a
designed screen area. Also called rollover.
454.
Glossar y 437
Multimedia Presentation Any presentation containing words (such as narration or
onscreen text) and graphics (such as illustrations, photos,
animation, or video).
Multimedia Principle People learn more deeply from words and graphics than
from words alone.
Near Transfer Tasks Tasks that require the learner to apply a well-known pro-
cedure in the same way as it was learned. For example,
how to access your email, how to complete a routine
customer order. See also procedures.
Operational Goals Bottom-line indicators of organizational success such as
increased sales, decreased product errors, or increased
customer satisfaction.
Organizational Graphics Visuals used to show qualitative relationships among
lesson topics or concepts. For example, a tree diagram.
Pedagogical Agent See agents.
Performance Analysis Research to determine that training will support orga-
nizational goals and that e-learning is the best delivery
solution.
Perform Programs Lessons designed primarily to build job-specific skills.
Personalization Principle People learn more deeply from multimedia lessons
when learners experience heightened social presence,
as when a conversational script or learning agents are
included.
Polite Speech Narration that includes courteous phrases.
Power Law of Practice Learners become more proficient at a task the more
they practice, although the improvement occurs at a
logarithmic rate. Greatest improvements occur during
initial practice, with diminishing improvements over time.
Practice Structured opportunities for the learner to engage with
the content by responding to a question or taking an
action to solve a problem. Also called interaction.
455.
438 Glossar y
Pretraining Principle People learn more deeply when lessons present key
concepts prior to presenting the processes or procedures
related to those concepts.
Principle-Based Lessons Lessons based on guidelines that must be adapted to
various job situations. These lessons teach strategic
knowledge. For example, how to close a sale, how to
design a web page. See also strategic knowledge or far
transfer.
Procedural Lessons Lessons designed to teach step-by-step skills that are per-
formed the same way each time. See also near transfer.
Process Lesson content that refers to a flow of events such as in a
business or scientific process. For example, how new staff
are hired, how lightning is formed.
Probability A statistic indicating the chances that differences between
the mean scores of the experimental and control groups
occurred by chance alone, in other words are not real
differences.
Problem-Based Learning A type of collaborative process in which groups define
(PBL) and research learning issues based on their discussion of a
case problem.
Program Control A condition under which the topics, sequencing,
instructional methods, and pacing are managed by
the instructional environment and not the learner.
Instructor-led sessions generally are presented under
program control. Also called instructional control.
Contrast with learner control.
Receptive Instruction An instructional architecture that primarily presents
information without explicit guidance to the learner for
how to process it. Also called the show-and-tell method.
See also inform programs.
Redundant Onscreen Onscreen text that contains the same words as
Text corresponding audio narration.
456.
Glossar y 439
Redundancy Principle People learn more deeply from a multimedia lesson
when graphics are explained by audio narration alone,
rather than audio narration and onscreen text. Some
exceptions to the redundancy principle involve screens
with no visuals or when learners are not native speakers
of the course language.
Regurgitative Interactions Practice questions that require learners to repeat content
provided in the lesson. Will not generally lead to deep
understanding.
Rehearsal Active processing of information in working memory,
including mentally organizing the material. Effective
rehearsal results in integration of new content with exist-
ing knowledge structures.
Relational Graphics Visuals used to summarize quantitative relationships such
as bar charts and pie graphs.
Representational Graphics Visuals used to show what an objective looks like, such as
a computer screen or a piece of equipment.
Retrieval Transferring information stored in long-term memory
to working memory after the learning event. Also called
retrieving process.
Response Strengthening A learning metaphor that focuses on strengthening or
weakening of associations based on rewards or punish-
ments provided during the learning event. Is the basis of
directive instructional architectures.
Rollover A technique in which new content appears on the screen
when the learner’s mouse contacts on-screen objects. For
example, when you place the mouse cursor over an on-
screen icon, the name or function of the icon appear in a
small text box. Also called a mouse-over.
Seductive Details Text or graphics added to a lesson in order to increase
the learner’s interest, but which is not essential to the
learning objective.
457.
440 Glossar y
Segmenting Principle People learn more deeply when content is broken into
small chunks and learners can control the rate at which
they access the chunks. A good strategy for managing com-
plex content that imposes considerable essential processing.
Selecting Process A cognitive process in which the learner pays attention to
relevant material in the lesson.
Self-Explanation Questions An instructional technique designed to promote processing
of worked examples in which the learner responds to ques-
tions asking about worked-out steps in a worked example.
Sensory Memory Part of the cognitive system that briefly stores visual
information received by the eyes and auditory informa-
tion received by the ears.
Shared Control A form of adaptive control in which the program recom-
mends several tasks based on learner performance and
the learners select which tasks they prefer.
Signaling An instructional technique used to draw attention to
critical elements of the instruction. Common techniques
include use of arrows, circles, bolding of text, or empha-
sis in narration.
Simulation An interactive artificial environment in which features in
the environment behave similarly to real-world events.
Simulations may be conceptual, such as a simulation
of genetic inheritance, or operational, such as a flight
simulator.
Social Presence The extent to which a delivery medium can communi-
cate face-to-face human interactions, including speech,
body language, emotions, etc.
Social Software Computer facilities that allow individuals to correspond
or collaborate with others. Some examples include wikis,
blogs, discussion boards, and online conferencing.
Static Adaptive Control A form of learner control based on a one-time assessment
of learner skills followed by branching to needed topics
458.
Glossar y 441
or lessons, such as in a pretest. Contrast with dynamic
adaptive control.
Statistical Significance A measure of the probability that the differences in the
outcome results between the test and control groups are
real and are not a chance difference.
Storyboard A layout that outlines the content and instructional
methods of a lesson, typically used for preview purposes
before programming.
Strategic Knowledge Guidelines that help in problem solving or completion of
tasks that require judgment and reflection. For example,
developing a sales proposal or writing an analytic report.
See also far transfer.
Structure-Emphasizing Worked examples that vary their cover stories to help
Examples learners acquire the principles or deep structure of the
content. Useful for far transfer learning.
Structured Controversy A structured collaborative learning structure involving
argumentation and synthesis of perspectives.
Summative Evaluation Evaluation of the impact of the courseware conducted at
the end of the project; may include cost-benefit analysis.
Surface Emphasizing Worked examples that use similar cover stories to
Examples illustrate a task. Useful for near but not far transfer
learning. Contrast with structure-emphasizing examples.
Surface Features The cover story of an example. A series of examples on
calculation of correlations that all use data about rain and
crop growth all have similar surface features. See also var-
ied context examples.
Synchronous Opportunities for learners and/or instructors to interact
Collaboration with each other via computer at the same time.
Synchronous e-Learning Electronic delivery of instructor-led training available
to geographically dispersed learners at the same time.
Delivered through specialized software such as Webex,
Elluminate, and Adobe Acrobat Professional Connect
459.
442 Glossar y
(Breeze). Synchronous sessions can be recorded and
accessed for asynchronous review after the event. Also
called virtual classrooms.
Task Analysis Research to define the knowledge and skills to be
included in training, based on observations of perfor-
mance and interviews of performers.
Technophile An individual or group that is enamored with techno-
logical features and may overload training with more
sensory stimuli than learners can process.
Technostic An individual or group that fails to exploit the potential
of a new learning technology by transferring familiar
instructional techniques from older media to new tech-
nology with little or no adaptation. For example, books
transferred to screens.
Transfer Application of previously learned knowledge and skills
to new situations encountered after the learning event.
Relies on retrieval of new knowledge and skills from
long-term memory during performance.
Training Wheels A technique introduced by John Carroll in which learn-
ers work with software simulations that are initially of
limited functionality and progress to higher-fidelity
simulations as they master lower-level skills.
Transfer Appropriate Activities that require the learners to perform during
Interactions training as they would on the job. For example, when
learning a new computer system, learners practice with
case examples and software interfaces that are identical or
very similar to the job. See encoding specificity.
Transformational Visuals used to show changes in time or space, such as
Graphics a weather cycle diagram or an animated illustration of a
computer procedure.
Treatment A variable or factor incorporated in an experimental les-
son to determine its impact on learners.
460.
Glossar y 443
Twitch Games Online games that rely on fast and accurate motor
responses on a game device such as a joy stick for success.
Various arcade games are typical examples.
Varied Context Examples A series of examples with different surface features but
that illustrate the same principles. A series of examples
illustrating correlations use rainfall and crop growth, age
and weight, and practice time and speed. See also deep
structure.
Virtual Classroom See synchronous e-learning.
Visible Author A personal style of writing in which the authors reveal
information about themselves or about personal perspec-
tives regarding the content.
Visual Channel Part of the human memory system that processes
information received through the eyes and mentally
represented in pictorial form.
Wikis Websites that allow visitors to edit the contents. Can be
controlled for editing/viewing by a small group or by all.
Worked Example Step-by-step demonstration of how to solve a problem or
accomplish a task.
Working Memory Part of the cognitive system in which the learner actively
(consciously) processes incoming information from the
environment and retrieves information from long-term
memory. Working memory has two channels (visual and
auditory) and is limited in capacity.
462.
L I ST O F TA B L E S A N D F I G U R E S
Introduction
Table I.1 A Preview of Chapters 2
Chapter 1
Figure 1.1 Percentage Training Hours Delivered by Classroom and Technology 8
Figure 1.2 Dollars Invested in U.S. Workforce Learning 9
Figure 1.3 A Screen Capture from an Asynchronous Excel Lesson 12
Figure 1.4 A Screen Capture from a Virtual Classroom Excel Lesson 12
Figure 1.5 Alignment of e-Learning with Operational Outcomes 14
Table 1.1 Five Types of Content in e-Learning 15
Table 1.2 Inform and Preform e-Learning Goals 17
Figure 1.6 Far Transfer Course on Loan Analysis 18
445
463.
446 L i s t o f Ta b l e s a n d F i g u r e s
Figure 1.7 Electronic Distance Learning vs. Face-to-Face Instruction: Histogram
of Effects 21
Table 1.3 Three e-Learning Architectures 27
Chapter 2
Table 2.1 Three Metaphors of Learning 34
Figure 2.1 Cognitive Theory of Multimedia Learning 35
Figure 2.2 Visual Cues Help Learners Attend to Important Elements of the
Lesson 38
Figure 2.3 Screens from Lightning Lesson with Integrated Text and
Graphics (A) and Separated Text and Graphics (B) 40
Table 2.2 Three Types of Research 43
Figure 2.4 Standard Deviation and Effect Size from Two Lessons 47
Chapter 3
Figure 3.1 A Screen from Ben’s First Draft of the Database Course 54
Figure 3.2 A Revision of Figure 3.1 with Visuals Added 56
Figure 3.3 A Decorative Graphic That Does Not Improve Learning 57
Table 3.1 An Organizational Graphic of Graphic Types 59
Table 3.2 Graphics to Teach Content Types 61
Figure 3.4 A Transformation Visual of an Excel Screen Projected Through
Application Sharing in Synchronous e-Learning 62
Figure 3.5 A Transformational Graphic Illustrating Process of AIDS
Infection 62
Figure 3.6 An Organizational Graphic of Coaching Topics 63
Figure 3.7 The Graphic Interface Provides Resources for Researching a Bank
Loan Applicant 64
Figure 3.8 How a Bicycle Pump Works Explained with Words Alone 66
Figure 3.9 How a Bicycle Pump Works Explained with Words and
Graphics 67
464.
L i st o f Ta b l e s a n d F i g u r e s 447
Figure 3.10 Learning Is Better from Words Plus Graphics Than from Words
Alone 67
Figure 3.11 A Series of Static Visuals to Teach How Lightning Forms 71
Chapter 4
Figure 4.1 Ben’s First Draft Storyboards 79
Figure 4.2 A Screen Rollover Integrates Text Below Section 1 of Graphic 81
Figure 4.3 Text and Graphic Separated on Scrolling Screen 82
Figure 4.4 Text and Graphic Visible Together on a Scrolling Screen 83
Figure 4.5 Ineffective (A) and Effective (B) Placement of Feedback 84
Figure 4.6 Separating Exercise Directions from Application Screen Adds
Extraneous Memory Load 85
Figure 4.7 Text Placed at Bottom of Screen (A) vs. Next to Visual (B) 86
Figure 4.8 Narration Is Presented Separately from Animation 88
Figure 4.9 Screens from Lightning Lesson with Integrated Text and
Graphics (A) and Separated Text and Graphics (B) 91
Figure 4.10 Learning Is Better from Integrated Text and Graphics Than from
Separated Text and Graphics 92
Figure 4.11 Learning Is Better from Integrated Audio and Graphics Than from
Separated Audio and Graphics 94
Chapter 5
Figure 5.1 Visual Described by On-Screen Text 101
Figure 5.2 Audio Explains the Animated Demonstration of the Telephone
System 102
Figure 5.3 Visual Described by Audio Narration 103
Figure 5.4 Practice Directions Provided in On-Screen Text in Virtual Classroom
Session 104
Figure 5.5 Overloading of Visual Channel with Presentation of Written Text
and Graphics 106
465.
448 L i s t o f Ta b l e s a n d F i g u r e s
Figure 5.6 Balancing Content Across Visual and Auditory Channels with
Presentation of Narration and Graphics 107
Figure 5.7 Screens from Lightning Lesson Explained with Audio Narration 108
Figure 5.8 Screens from Lightning Lesson Explained with On-Screen Text 109
Figure 5.9 Better Learning When Visuals Are Explained with Audio Narration 110
Figure 5.10 Responses to Questions in Audio Narration (A) or in On-Screen
Text (B) 111
Chapter 6
Figure 6.1 Visual Described by On-Screen Text and Narration 118
Figure 6.2 Graphics Explained Using Identical Text and Audio Narration 120
Figure 6.3 Graphics Explained Using Audio Alone 120
Figure 6.4 Overloading of Visual Channel with Graphics Explained by Words in
Audio and Written Text 122
Figure 6.5 Better Learning When Visuals Are Explained by Audio Alone 123
Figure 6.6 When No Visuals Are Present, Content Can Be Presented with Text
and Redundant Narration 126
Figure 6.7 Visual Explained by On-Screen Text When Audio Off Is Selected 130
Chapter 7
Figure 7.1 A Screen to Add Interest to the Database Lesson 134
Figure 7.2 Sounds of Explosion and Bullets Added to Narration of On-Screen
Text 136
Figure 7.3 Learners Can Select Music During Course Introduction 137
Figure 7.4 Learning Is Better When Sounds and Music Are Excluded 140
Figure 7.5 Interesting But Unrelated Historical Information Should Be
Excluded 141
Figure 7.6 Interesting But Unrelated Graphics Added to Lightning Lesson 144
Figure 7.7 Text on History of Databases Added to Lesson 146
Figure 7.8 Extensive Text Elaborates on Database Concepts 147
466.
L i st o f Ta b l e s a n d F i g u r e s 449
Figure 7.9 Lean Text and Relevant Visual Explains Database Concepts 147
Figure 7.10 Learning Is Better When Non-Essential Text Is Excluded 149
Chapter 8
Figure 8.1 An Informal Approach Uses an Agent and Conversational
Language 158
Figure 8.2 A Formal Approach Omits the Agent and Drops First- and
Second-Person Language 159
Figure 8.3 Passive Voice Leads to a Formal Tone in the Lesson 161
Figure 8.4 Use of Second Person and Informal Language Lead to a
Conversational Tone in the Lesson 161
Figure 8.5 How the Presence or Absence of Social Cues Affects Learning 163
Figure 8.6 Formal vs. Informal Lesson Introductions Compared in Research
Study 164
Figure 8.7 Better Learning from Personalized Narration 164
Figure 8.8 On-Screen Coach Used to Give Reading Comprehension
Demonstrations 168
Figure 8.9 Herman the Bug Used in Design-A-Plant Instructional Game 169
Figure 8.10 The General Character Plays No Instructional Role So Is Not
an Agent 173
Figure 8.11 Invisible (A) vs. Visible (B) Author in Summaries of Mayer’s Research 174
Figure 8.12 The Instructor Makes Himself Visible by Typing His Favorite Brand
in the Direct Message Window 175
Figure 8.13 The Instructor Remains Invisible to the Learners 176
Chapter 9
Figure 9.1 Two Organizational Sequences for the Database Lesson 184
Figure 9.2 Screens from Lightning Lesson 187
Figure 9.3 Cutting and Pasting Text in MSWord Is a Simple Task 188
Figure 9.4 Constructing a Formula in Excel Is a Complex Task 188
467.
450 L i s t o f Ta b l e s a n d F i g u r e s
Figure 9.5 Adding a Continue Button Allows Learners to Progress at Their
Own Rate 189
Figure 9.6 Pretraining Illustrates the Parts and Functions of the Virtual
Classroom Interface 191
Figure 9.7 Pretraining Teaches Formula Format Before Procedure 192
Figure 9.8 Part of a Multimedia Presentation on How Brakes Work 194
Figure 9.9 Pretraining on How Brakes Work 194
Figure 9.10 Pretraining Version Resulted in Better Learning 195
Chapter 10
Figure 10.1 A Worked Example of a Probability Problem 203
Figure 10.2 A Worked Example from a Database Lesson 204
Table 10.1 Worked Example Problem Pairs Result in Faster Learning and
Performance 205
Figure 10.3 Fading from a Full Worked Example to a Practice Problem 208
Figure 10.4 A Faded Worked Probability Problem 208
Figure 10.5 Faded Examples Result in Better Learning Than Problem-Example
Pairs 210
Figure 10.6 A Self-Explanation Question on First Solution Step 211
Figure 10.7 Worked Examples with Self-Explanation Questions Result in Better
Learning Than Worked Examples Without Questions 211
Figure 10.8 A Worked Example Step with a Relevant Visual 213
Figure 10.9 A Worked Example Step Without a Relevant Visual 214
Figure 10.10 A Worked Example with Steps Integrated into Visual 215
Figure 10.11 Varied Context Worked Examples Resulted in More Correct
Discrimination of Test Type 222
Figure 10.12 Alternative Placement of Negotiation Strategy Examples in Three
Lessons 224
Figure 10.13 Best Learning from Active Comparisons of Examples 225
468.
L i st o f Ta b l e s a n d F i g u r e s 451
Chapter 11
Figure 11.1 A Jeopardy Game Design for the Database Lesson 232
Figure 11.2 This Multiple-Choice Question Requires the Learner to Recognize
the Definition of a Field 234
Figure 11.3 This Multiple-Choice Question Requires the Learner to Apply the
Concept of a Field to an Example 234
Table 11.1 Interactions for Five Types of Content in e-Learning 237
Figure 11.4 This Feedback Tells the Learner That His or Her Response Is
Incorrect 238
Figure 11.5 This Feedback Tells the Learner That His or Her Response Is
Incorrect and Provides an Explanation 239
Figure 11.6 Better Learning from Explanatory Feedback 240
Figure 11.7 A Multiple-Select Question and Its Feedback 242
Figure 11.8 Better Learning from e-Learning with Interactions 243
Figure 11.9 The Power Law of Practice: Speed Increases with More Practice 244
Table 11.2 Better Learning with More Practice 245
Figure 11.10 Best Learning on Delayed Test from Spaced Readings 247
Chapter 12
Table 12.1 Online Facilities for Social Learning 259
Figure 12.1 Synchronous Collaborative Learning with Chat, Audio, Whiteboard
in Breakout Room 261
Figure 12.2 Asynchronous Collaborative Learning Using a Wiki 261
Figure 12.3 Asynchronous Collaborative Learning Using a Discussion Board 262
Table 12.2 CSCL Factors That Make a Difference 266
Figure 12.4 A Graphical Interface to Capture Group Problem-Solving
Processes 273
Figure 12.5 Structured Argumentation Collaborative Learning Structure 279
Figure 12.6 A Case Problem Used in PBL 281
469.
452 L i s t o f Ta b l e s a n d F i g u r e s
Figure 12.7 A Patient History from a PBL Case 282
Figure 12.8 Asynchronous Access to Experts During PBL Lesson 283
Chapter 13
Figure 13.1 Navigational Elements Designed for High Learner Control 290
Figure 13.2 A Lesson with Multiple Navigational Control Elements 293
Table 13.1 Common Navigational Techniques Used in Asynchronous
e-Learning 294
Figure 13.3 A Rollover Explains Screen Functionality 295
Figure 13.4 Low-Prior-Knowledge Students Learn Least Under Learner
Control 300
Table 13.2 Test Scores of High and Low Metacognitive Learners Studying Under
Learner or Program Control 301
Figure 13.5 Default Navigation Options That Bypass Practice (Version 1)
Compared to Those That Lead to Practice (Version 2) 302
Figure 13.6 Four Forms of Adaptive Control 304
Figure 13.7 Three Map Layouts 309
Chapter 14
Figure 14.1 A Website Promoting Critical Thinking Skills Training 319
Table 14.1 Three Types of Thinking-Skills Training Programs 322
Figure 14.2 The Learner Moves Relevant Symptoms into the Evidence Table 325
Figure 14.3 The Learner Orders Diagnostic Tests 325
Figure 14.4 The Learners Compare Their Evidence to an Expert List 326
Figure 14.5 The Learner Can Access Many Resources While Analyzing a Loan
Request 327
Figure 14.6 The Learner Can Review the Loan Analysis Process 328
Figure 14.7 Acceleration of Expertise Using Sherlock 331
Figure 14.8 Better Learning from Case-Based Learning 333
470.
L i st o f Ta b l e s a n d F i g u r e s 453
Figure 14.9 Different Problem-Solving Activities in Novice and Expert
Mathematicians 335
Figure 14.10 Reading Comprehension Skills Modeled 336
Figure 14.11 Reading Comprehension Skills Practiced 337
Chapter 15
Figure 15.1 Sales of Video and Computer Game Types 348
Figure 15.2 Simulation of Laws of Genetics 350
Figure 15.3 Game Based on Simulation of Laws of Genetics 351
Figure 15.4 A Simulation for Commercial Loan Analysis 352
Figure 15.5 The Flip-Flop Game Interface 353
Figure 15.6 Target Practice in the America’s Army Game 356
Figure 15.7 Features That Players Did or Did Not Like in America’s Army
Game 356
Figure 15.8 Players Recognized More Game-Relevant Information Than
Game-Irrelevant Information 359
Table 15.1 Techniques for Guidance in Games and Simulations 361
Figure 15.9 Better Learning from Explanatory Feedback 364
Figure 15.10 Simulation Interface for Ideal Gas Laws That Combines Both Laws
(High Complexity) and Uses Concrete Representations of Variables
(Weights and Flames) 369
Figure 15.11 Worst Learning from Complex Simulation Interface That Used
Abstract Symbols 370
Figure 15.12 This Visual Aid Helped Learners Identify Geological Features in a
Geology Simulation Game 373
Chapter 16
Table 16.1 Summary of Research Results from the Eight Multimedia
Principles 383
471.
454 L i s t o f Ta b l e s a n d F i g u r e s
Exhibit 16.1 A Summary of e-Learning Guidelines 385
Figure 16.1 Content Outline of Example and Counter-Example Database
Lessons 389
Figure 16.2 Screen Explaining One-to-Many Relationships in Counter-
Example 390
Figure 16.3 Screen Explaining One-to-Many Relationships in the Example 390
Figure 16.4 Violation of Contiguity in the Counter-Example 391
Figure 16.5 Feedback Offers an Explanation in the Example 392
Figure 16.6 An Example from the Counter-Example Lesson 392
Figure 16.7 An Example from the Example Lesson 393
Figure 16.8 Violation of Coherence in the Counter-Example 394
Figure 16.9 Content Outline of Synchronous Excel Lesson 394
Figure 16.10 Introduction to Synchronous Excel Lesson 395
Figure 16.11 Adaptive Control in Synchronous Excel Lesson 396
Figure 16.12 Faded Worked Example 397
Figure 16.13 Manager Assigns Case to Student Loan Analyst 398
Figure 16.14 The Simulation Offers Access to Case Data 399
Figure 16.15 Help from an Agent Offers Advice and Access to Lessons 400
Figure 16.16 Learners Can View Their Steps Taken 400
472.
NAME INDEX
A Bernard, R. M., 20 Chandler, P., 69, 90, 92, 124, 190,
Betrancourt, M., 70 194, 214, 307
ACME 360 Podcast Series (ACT)
blocking process used in, Bizo, L. A., 277 ChanLin, L., 70
86–87t Boire, M., 93 Chenge, J.C.Y., 332
Abrami, P. C., 263, 265, 268, 276 Boruch, R., 44 Churchill, E., 168, 170
Aidman, E., 69 Bove, W., 66, 149 Clark, R., 14, 42, 208, 227
Alexander, P. A., 45 Bower, G., 90 Clark, R. C., 13, 15, 27, 42, 60,
Anderson, J. R., 202 237, 307
Brave, S., 166
Anderson, R. B., 66, 93, 94 Clark, R. E., 20
Brown, G. D., 247
Asberg, K., 235, 250 Cohen, J., 48
Brown, P., 167
Atkinson, R. K., 166, 169, 170, 172, Collins, H., 167
Bryman, A., 66, 149
203, 208, 209, 210, 211, 216 Cooper, G. A., 205
Butcher, K. R., 145
Ayres, P., 90 Cooper, M., 92
Azevedo, R., 338 C Corbalan, G., 306
Callaway, C. B., 170 Craig, S. D., 107, 123, 171
B Campbell, J., 70, 165, 270, 271 Crossman, E.R.F.W., 244
Baggett, P., 93 Carlson, R. A., 244 Cuban, L., 32
Bahrick, H. P., 246 Carpenter, P. A., 92 Cunnington, J.P.W., 297
Bandura, A., 240 Carroll, J. M., 370 Cushing, J. R., 20
Beck, I., 162, 173 Carstens, A., 348
Beck, J., 348 Cassell, J., 168, 170 D
Belanich, J., 355, 358 Cate, C., 70 d’Apollonia, S., 263, 265, 268, 276,
Bell, B. S., 305 Chamberlain, A., 268, 278 278
455
473.
456 Name Index
Davidson, J. W., 235 Gosen, J., 354 Klein, J. D., 269, 270
Debowski, S., 240 Guerrera, C., 330 Koenig, A., 50
Dempster, A., 212 Kozlowski, S.W.J., 305
Derry, S. J., 216 H Krapp, A., 152
De Wever, B., 274, 275, 276 Hall, V. C., 297 Kriz, S., 70
Dewey, J., 138, 142 Hall, W. E., 20 Kucan, L., 162
Dillon, A., 20 Harp, S. F., 142, 143, 144, 150 Kumta, S. M., 332
Dixon, N. M., 297 Hays, R. T., 354, 355 Kwinn, A., 13, 307
Dixon, P., 202 Hegarty, M., 70, 92
Dolezalek, H., 262 Heiser, J., 123, 143, 148 L
Dow, G., 110, 111, 191, 307 Herl, H. E., 107 Laffey, J., 269, 283
Driscoll, D. M., 107, 123, 171 Hidi, S., 151, 152 Lajoie, S. P., 324, 330, 338
Duncker, K., 220 Hill, L., 235, 250 Lavigne, N. C., 330
Dwyer, N., 145, 272, 273 Hmelo-Silver, C. E., 281 Leader, L. R., 245, 298
Hodges, A., 282 Leahy, 214
E Holyoak, K. J., 220 Lee, C. B., 269, 283
Ebbinghaus, N., 246 Homer, B. C., 368 Lee, H., 368
Eggan, G., 330 Howe, M.J.A., 235 Lee, S., 301
Ehrenfeucht, A., 93 Hugge, S., 139, 250 Lee, Y.H.K., 301
Epstein, W., 297 Hung, L. K., 332 Lefevre, J. A., 202
Ericsson, K. A., 235, 250 Hurley, E. A., 268, 278 Lepper, M. R., 355
Ettinger, M., 212 Leritz, L. E., 320, 321, 323
Eva, K. W., 297 Lesgold, A., 330
I
Lester, J., 107, 168, 169, 170, 171
F Inglese, T., 175, 177
Leutner, D., 364
Issenberg, S. B., 347, 354, 363
Farmer, L., 165 Levin, J., 44
Farrell, R., 202 Levinson, S. C., 167
Fennell, S., 165 J Loewenstein, J., 223
Filak, A. T., 73 Jackson, J., 150, 151, 307, 369 Lonn, S., 123, 143, 148
Fitzgerald, P. J., 170 Johnson, D. W., 279, 280 Lorch, E. P., 308
Fleiszer, D. M., 338 Johnson, L., 167 Lorch, R. F., Jr., 308
Fletcher, J. D., 68 Johnson, R. T., 279, 280 Lou, Y., 263, 265, 268, 276, 278
Jonassen, D. H., 42, 45, 269, 283 Low, R., 110
G Jones, B., 282 Lyons, C., 42, 60
Gabbard, R., 20 Jones, E.E.K., 245, 298
Joseph, S., 272, 273
Gallini, J. K., 66, 69 M
Garner, R., 135, 152 Ju, E., 357, 371
Malone, T. W., 355
Gay, G., 300, 301 Just, M. A., 92
Mars, R., 66, 90, 149
Gentner, D., 223 Mathias, A., 194, 195
Gholson, B., 107, 123, 171 K Mautone, P. D., 150, 166, 373
Gick, M. L., 220 Kalyuga, S., 69s, 124, 151 Mayer, R. E., 33, 42, 45, 48, 66,
Gillingham, M., 135, 152 Katz, S., 330 68, 69, 70, 90, 93, 94, 107,
Gilmore, R. O., 244 Keane, D. R., 297 110, 111, 123, 124, 127, 128,
Gilroy, L., 140 Kenz, I., 139, 250 133, 138, 139, 142, 143, 144,
148, 149, 150, 162, 163, 165,
Ginns, P., 112 Kester, L., 306, 368, 375 166, 167, 168, 169, 171, 172,
Glenberg, A. M., 297 Kidd, G., 69 174, 175, 176, 177, 190, 194,
Gordon, D. L., 347, 354, 363 Kintsch, W., 247 195, 213, 231, 240, 243, 278,
474.
Name Index 457
307, 309, 323, 329, 360, 364, Phye, G. D., 44 Schoenfeld, A., 334, 335
366, 369, 373, 383, 384 Pink, D. H., 317 Scott, G., 320, 321, 323
Mayer, S., 70, 110, 111, 190, 307 Plant, E. A., 235, 250 Seabrook, R., 247
McGaghie, W. C., 347, 354, 363 Plass, J. L., 368 Shapiro, A. M., 310
McGovern, L., 308 Pollock, E., 194 Shavelson, R. J., 42
McKeown, M. G., 162, 173 Potelle, H., 309, 310 Shaw, E., 167
Medina, R., 272, 273 Prensky, M., 348, 349, 360 Short, J., 73
Merrill, M. M., 166, 169, 172, 203, Prevost, S., 168, 170 Sibley, D. E., 355, 358
208, 209, 210, 211 Prichard, J. S., 277 Sims, V., 93
Moore, D. G., 235 Prothero, W., 373 Skolmoski, P., 308, 310
Moreno, R., 66, 68, 90, 93, 107, Psang, P. L., 332 Slavin, R. E., 268, 278
110, 123, 124, 127, 128, 133,
138, 139, 150, 163, 165, 168, Sloboda, J. A., 235
169, 171, 172, 239, 240, 243, R Sobko, K., 166
363, 364, 366 Randel, J. M., 354 Solity, J. E., 247
Morris, B. A., 354 Ransdell, S. E., 140 Spires, H., 107, 168, 169, 171
Morris, C., 297 Rao, G., 330 Sratford, R. J., 277
Mosteller, F., 44 Rawson, K. A., 247 Stasser, G., 270, 271
Mousavi, S., 110 Reed, S. K., 212 Steinberg, E. R., 299
Moust, J.H.C., 281 Reeves, B., 166 Steinhoff, K., 90
Mumford, M. D., 320, 321, 323 Reiter, H. I., 297 Stone, N. J., 297
Munsie, S. D., 330 Renkl, A., 203, 208, 209, 210, 211 Sugrue, B., 9, 16
Renninger, K. A., 151, 152 Sullivan, H., 269, 270
N Reynolds, R. E., 308, 310 Sullivan, H. J., 245, 298, 302
Nakamura, C., 324 Ricer, R. E., 73 Sullivan, J., 168, 170
Nass, C., 166 Rieber, L. P., 352, 365, 366 Suthers, D., 272, 273
Neiderhauser, D. S., 308, 310 Rigotti, F., 175, 177 Svetcov, D., 137
Nguyen, F., 14, 42, 208, 227 Ritchey, K., 308 Sweller, J., 42, 69, 92, 110, 124,
194, 205, 208, 214, 227
Niemi, C., 107 Rivera, R. J., 9, 16
Sword, W., 282
Nilsson**, 309 Rizzo, P., 167
Nolen, S., 173, 174, 176 Robinson, D. H., 44
Norman, G. R., 297, 368 Rosenbaum, D. A., 244 T
Nussbaum, E. M., 275, 276 Rothen, W., 303
Tallent-Runnels, M. K., 20
Rouet, J. F., 309, 310
Tapangco, L., 66, 149
O Tennyson, C. L., 303
Olin, K., 107 S Tennyson, R. D., 303
Ollershaw, A., 69 Sahiba, S., 167 Thompson, L., 223
O’Neil, H. F., 107 Salden, R.J.C.M., 304 Thurman, R. A., 107
Orvis, K. L., 355, 358 Salmen, D. J., 308, 310 Tierney, P., 92
Salomon, G., 329 Tobias, S., 68
Sanchez, C. A., 145, 151 Towne, L., 42
P Sandora, C., 162 Towns, S. G., 170
Paas, F., 304 Sanocki, T., 297 Tribble, K., 365, 366
Paas, F.G.W.C., 92, 222 Sauers, R., 202 Tzeng, S. C., 365, 366
Parkhurst, 145 Scalese, R. J., 347, 354, 363
Paxton, R., 173, 174, 176, 177 Schmidt, H. E., 281
Perkins, D. N., 329 Schnackenberg, H. L., 245, 298, U
Petrusa, E. R., 347, 354s, 363 302 Uribe, D., 269, 270
475.
458 Name Index
V W Winne, P. H., 45
Vagge, S., 93 Wagner, C., 357, 371 Wood, R. E., 240
Valaitis, R. K., 282 Walczyk, J. J., 297 Worthy, J., 162, 173
Valcke, M., 274, 275 Wang, N., 167
Van Eyke, R., 358 Washbush, J., 354 Y
Van Merrienboer, J.J.G., 92, 222, Wetzel, C. D., 354 Yang, C.-C., 269, 283
306, 368, 375 Wetzell, K., 194, 195 Young, J. D., 301
Van Winckle, M., 274, 275 White, C., 135, 152
Vatrapu, R., 272 Whitehill, B. V., 354
Voerman, J. L., 170 Wiley, J., 145, 151, 278
Voss, J. F., 278 Wilkinson, A. C., 297
476.
SUBJECT INDEX
Note: Pagenumbers followed by fig indicates figure; t, table; e, exhibit.
A Arousal theory, 138 design dilemma/resolution on
Asynchronous e-learning using, 100–101fig, 113–114
Accelerate Expertise (loan analysis
e-lesson), 327–328fig, 333 access to experts during PBL learning research on
lesson, 283fig corresponding graphics
Active processing learning principle, with, 93
36 common navigational
techniques used in, 294t learning research on omitting
Adaptive control redundant text and just using,
adaptive advisement vs., example of CSCL, 261fig
123fig
305–306 guidelines for database lesson,
learning research on
described, 303 389fig–394
personalized, 164fig
four formats for, 303–304fig multiple navigational control
modality principle on using,
elements used in, 293fig
program control vs. dynamic, 304 101–114
screen capture from Excel,
shared, 306 by on-screen pedagogical agents,
12fig
Adaptive instruction, 23 171–173
simulation course for loan
AIDS infection e-lesson, 62fig personalization of, 166–167
analysis, 398fig–401
America’s Army game, 355–356fig polite speech used in,
visible authors used in,
166–167
Animations 175fig–176fig
presenting words as speech,
narration presented separately See also E-learning
101–103
from, 88fig Audio narration
redundancy principle on using
static illustration versus, 69–72 avoiding e-lessons with either (not both) text or,
Argumentation, 279 extraneous, 135–137fig 117–130fig
459
477.
460 Subject Index
research on learning from Automatic skills, 246 Cognitive resource management,
graphics used with, 94fig Automaticity learning, 246 36–37
research on learning when visuals Cognitive skills, 320
have, 107–112, 110fig See also Thinking skills
research on modality effect, B Cognitive task analysis, 339
111–112 Bicycle pump e-lesson Cognitive theory
special situations for adding text breaking down into segments, on impact of conversational style,
to, 125–126fig 185 162–163
summary of guidelines for using screen using both words and on limitations of working
visual and, 386e graphics, 67fig memory, 138
synchronizing graphics with, BioWorld (multimedia of multimedia learning, 36fig
86–89 environment), 324–326fig on visual and auditory processing
voice quality of, 166 Blogs, 259t channels, 105–106
weeding the, 133–134 Boyles Law, 369–370fig Coherence principle
worked examples using, 214–215 Brakes (how they work) e-lesson applied to practice, 250
See also Sound effects; Words/ part of presentation on, 195fig design dilemma/resolution on
images/visual design applying, 134–135, 151–152
pretraining example on, 195fig
Audio screen examples on extraneous audio, 135–140fig
Breakout rooms, 259t, 261fig
adding interest to database on extraneous graphics, 140–145
lesson, 134fig Briefings (or inform programs),
17t–19 on extraneous words, 145–150
balancing visual and auditory
channels, 107fig Buttons (navigational), 294t introduction to, 133–134
content presented with both text summary of research results from,
and audio, 126fig 383t
explaining animated demo C what we don’t know about
of telephone system, 102fig– coherence, 150–151
Calibration accuracy
103 Collaborative learning. See Computer-
definition of, 296
graphics explaining using supported collaborative
learner research on poor, 297 learning (CSCL)
identical text and, 120fig
measuring, 296 Computer-based training (CBT)
graphics explaining using only,
practice and examples to improve, described, 19
120fig
297
using icons to separate graphics media comparison research on,
Cambridge Handbook of Multimedia 20–21fig
and, 87–88fig
Learning (Mayer), 45
learners can select music during U.S. Army Media Comparison
CD-ROMs Study on, 19–20
course intro, 137fig
audio explaining demo of See also E-learning
lightning lesson with audio
telephone system, 102fig–103
narration, 108fig–109fig Computer-supported collaborative
development decisions on using, learning (CSCL)
overloading visual channel with
16
both text and, 122fig collaborative group techniques
e-learning delivery using, 7, 8, 10 and, 278–283fig
practice directions provided in
on-screen text, 104fig visual described by audio collaborative structures and
narration, 103fig outcomes of, 278
sounds of explosion/bullets added
to narration, 136fig Channels. See Learning channels described, 259–262
visual described by audio Charles Law, 369–370fig design dilemma/resolution on
narration, 103fig Chats, 259t applying, 258, 284–285
worked examples using, 215fig Cognitive load, 39 example of asynchronous, 261fig
Auditory/verbal processing Cognitive processes example of synchronous, 261fig
cognitive theory on channels for, four principles of learning and, factors making a difference in,
105–106 36 264–269
example of balancing visual and, role of memory in, 36fig group roles and assignments in,
107fig three important learning, 36 274–276
478.
Subject Index 461
individual vs. group outcomes placing words near corresponding Deep structure, 220
from, 263–264 graphics, 80–86fig Default settings, 302fig–303
introduction to, 257–258 psychological reasons for, 89–90 Deliberate practice, 235
online facilities for social research on learning from audio Delivery platforms
learning, 259t–260t used with graphics, 94fig
CD-ROMs, 7, 8, 10, 16
problem-solving learning summary of research results from,
outcomes with, 269–270 383t as environment factor, 26
software representations synchronizing spoken words with Internet, 7, 8, 10, 16
supporting, 272–273 corresponding graphics, 86–89 Intranet, 7, 8, 10, 16
summary of factors which can what we don’t know about, 93–94 as redundancy issue, 129
promote, 283–284 Conversational style Demonstrations, 218
summary of guidelines for, 387e benefits of using, 160 Dependent measures, 44
team-building skills and outcomes learning research on use of, Design
of, 276–278 163–165 guidelines for far-transfer
types of, 262–263 screen example of, 161fig learning, 219–226
virtual vs. face-to-face group See also Personalization principle guidelines for near transfer
decisions using, 270–271 Corrective (or explanatory) feedback, learning, 218, 226
Concept map, 309fig–311 238–242fig summary of guidelines for
Concepts content Course maps, 309fig–311 e-learning, 385e–403
described, 60, 237t Courseware. See E-courseware tips for feedback, 241–242
graphics used to teach, 60, 61t Creativity training tips for self-explanation
pretraining for learning key, cognitive techniques used for, 323 questions, 212
191–196 debate over effectiveness of, 321 tips on practice, 248
Content See also Multimedia principles
what kinds of programs work best
both text and audio to present, for, 321–322t (Mayer’s); Words/images/visual
126fig design
Critical thinking
defining e-learning, 14–15 Design dilemmas/resolutions
job-specific training on, 329–339
five types of, 15t, 60, 61t, 237t applying computer-supported
website on training for, 319fig
graphics used to teach, 60–62fig collaborative learning (CSCL),
workforce training to build,
particularly suited to animation, 323–329 258, 284–285
70, 72 on using audio, 100–101fig,
See also Problem solving; Think-
as redundancy issue, 128 ing skills 113–114
varied context worked examples balancing use of technology in
to present, 223–225 D training, 48–49
words/images/visual design to Database e-lesson on building thinking skills,
teach, 36, 53–74 318–319, 340–341
audio to add interest to, 134fig
Content sequencing, 292 on creating Thrifty Savings and
Database Jeopardy, 232fig
Contiguity principle Loan training program, 32–33
extensive text elaborating
applied to practice, 249–250 using either (not both) audio or
concepts of, 147fig
applied to worked example, text, 118–119, 129–130fig
guidelines for asynchronous,
215–216 on using examples, 202, 227
389fig–394
common violations of, 80–85 organizational sequences for on games and simulations,
design dilemmas/resolutions on segmenting, 184fig 346–347, 376
applying, 78–79, 94–95 screen examples of, 390fig–393fig on learner controls through
learning research on presenting navigational elements,
segmenting, 184–185, 196–197
printed words near correspond- 290–291, 312
text on history of databases, 146fig
ing graphics, 90–92fig related to practice, 232fig–233,
worked example from, 204fig 252
learning research on presenting
spoken words with Decision making, 270–271 on segmenting database lesson,
corresponding graphics, 93 Decorative graphics, 58, 59t 184–185, 196–197
479.
462 Subject Index
on storyboard use of text and guidelines for, 385e–403 for using audio and visual modes,
graphics, 78–79, 94–95 increasing use of, 8–10fig 386e
taking informal and personal learning through, 28 for building thinking skills, 388e
approach, 158–160, 178 media comparison research on for collaboration in Internet/
on using words, phrases, visuals, benefits of, 19–21fig Intranet e-learning, 387e
54fig–55, 73 pitfalls of, 24–25 for learner control/navigation
on weeding materials that can practice in context of, 231–252 principles, 387e
hurt learning, 134–135, for simulations and games, 388e
151–152 predictions on the next
generation of, 401–403 summary on three types of, 385e
Design-A-Plant (e-learning game)
problem solving (guided synchronous Excel, 394fig–397
explanation of responses as part discovery), 385e for teaching job tasks, 386e–387e
of, 366–367
self-study versus virtual classroom, for visual mode only, 385e
explanatory feedback in, 363– 11–13
364fig See also Multimedia principles
show-and-tell (receptive) type (Mayer’s)
Herman the Bug agent used in, of, 385e
169fig, 170, 171 e-Learning Guild conference
tell-and-do (directive) type of, 385e (2006), 347
learning benefits of practicing,
243 three design architectures for, E-learning pitfalls
8, 27t, 28
Directive (tell-and-do) e-learning 1: losing sight of the job, 24
unique characteristics of, 22–24
architecture of, 8, 27t 2: media abuse, 24–25
See also Asynchronous e-learn-
described, 385e E-lesson screens. See Screen examples
ing; Computer-based training
interactivity of, 27–28 (CBT) E-lessons
Discussion board, 259fig, 262fig E-learning architectures, 26–27t directing selection of important
Disruption learning interference, information, 38
E-learning characteristics
142 practice with feedback, 22 learner preference for specific fea-
Distraction learning interference, tures of, 297–298
simulations and games, 23–24
142 learning research on three ver-
social software and collaboration, sions of, 224fig–225fig
Dual channels learning principle, 22–23
36 managing limited capacity in
tailored instruction, 23 working memory, 38–39
Dynamic adaptive control, 303,
304fig E-learning checklists, 49–50
methods for integration process,
E-learning content. See Content 36, 39–40fig
E E-learning development methods for retrieval and transfer
defining e-learning content, 14–15t in long-term memory, 41
E-courseware
defining instructional methods standard deviation and effect size
applying multimedia principles and media elements, 16 examples from, 47fig
to evaluate, 382–384
delivery platforms and software summary of learning processes
assessment of, 25–28 shape instruction, 16 used in, 41–42
See also E-lessons performance analysis, 14 transformation of words/pictures
E-courseware assessment summary of systematic process into knowledge, 36fig, 37
of e-learning architectures, for, 13–14fig visual cues used in, 38fig
26–27t See also Multimedia principles See also E-courseware; Multimedia
of interactivity, 27–28 E-learning goals principles (Mayer’s); specific
of learner differences, 26 inform and perform, 17t–19, 17t e-lessons
of learning environment, 26 near versus far transfer perform, Educational Psychology Review, 45
of training goals, 25 17–19 Effect size, 47fig–48
E-learning E-learning guidelines Email, 259t
assessment courseware used for, asynchronous database, Encoding specificity principle, 218,
25–28 389fig–394 236
described, 7–8, 10–11 asynchronous simulation course Entertainment Software Association
development process of, 13–16 for loan analysis, 398fig–401 (2006 report), 347–348
480.
Subject Index 463
Environment psychological reasons to avoid, G
accelerate expertise case-based 142–143
Game realism, 355–356fig
loan analysis, 327fig–328fig Extraneous processing, 36, 90
Games/simulations
BioWorld multimedia, 324–326fig Extraneous words
America’s Army, 355–356fig
learning, 26 avoiding e-lessons with,
145–147fig balancing motivation and
Sherlock multimedia, 330–331fig learning in, 355–357
Essential cognitive processing learning research on omitting,
148–150 case for increasing use of,
described, 36–37, 183–184 347–352
psychological reasons to avoid,
role of segmenting in, 189 debate over effectiveness of teach-
148
Evidence-based practice, 42–43 ing with, 352–355
Examples. See Screen examples; F definitions of, 349–352
Worked examples design dilemma/resolution
Face-to-face group decisions,
Excel e-lessons regarding, 346–347, 376
270–271
adaptive control in synchronous, Design-A-Plant, 169, 170, 171,
Face-to-face instruction
396fig 243, 363–364fig
histogram of effects of, 21fig
directive architecture of, 27–28 as e-learning characteristic, 23–24
media comparison studies on,
guidelines for synchronous, e-learning use of, 23–24
19–21
394fig–397 Herman the Bug character of,
Facts content
introduction to synchronous, 169fig–170, 171
argumentation supporting,
395fig Hunger in the Stahl, 363,
278–279
screen capture from asynchronous, 364–365
described, 60, 237t
12fig Indiana Jones, 357
graphics used to teach, 60, 61t
screen capture from virtual instructional support of, 371–373
classroom, 12fig Fading
Jeopardy, 41, 232fig
segmented, 186, 188fig, description and examples of,
learning research on, 354–355,
207–208fig, 251
unsegmented, 189fig 358–359fig
learning research on benefits of,
visuals/graphics used to teach Oregon Trail Game, 353–354
209
content, 62fig physics, 365–366
worked example, 397fig
Expert problem-solving principles of using, 357–373
Far-transfer learning
comparing math problem- scales of video and, 348fig
solving of novice vs., 335fig deep versus surface features of,
219–220 summary of guidelines for, 388e
providing examples of, 336fig– techniques for guidance in,
337 definition of, 218
361t–362t
Expertise reversal effect, 207 design to support, 221
what we don’t know about,
Explanatory feedback loan analysis course, 18fig
374–376
learning research on game, perform goals for, 17–19
Games/simulations principles
363–366 psychology of, 219
1. match game types to learning
providing, 238–242fig simulations designed to build,
goals, 357–358
Extraneous audio 350–351
2. making learning essential to
avoiding e-lessons with, worked examples facilitating,
progress, 358–360
135–137fig 221–225
3. build in guidance, 361t–366
learning research on omitting, Feedback. See Learner feedback
4. promote reflection on correct
138–140fig Fetal Alcohol Spectrum Disorder
answers, 366–367
(FASD) e-lesson, 282fig–283fig
psychological reasons to avoid, 5. manage complexity, 367–373
137–138 Flip-flop game interface, 353fig
Games/simulations screen examples
Extraneous graphics Formal e-lesson style
America’s Army, 356fig
avoiding e-lessons with, 140– examples of, 159fig, 161fig
flip-flop game interface, 353fig
141fig research study comparison of
informal and, 164fig game based on simulation of laws
learning research on omitting,
of genetics, 351fig
143–145 Formative evaluation, 43
481.
464 Subject Index
simulation of laws of genetics, using legend to indicate parts of collaborative structures and, 278
350fig graphic, 85–86 decision making, 270–271
Generative processing, 37 placing words near corresponding described, 263
Generic advisement, 305–306 graphics, 80–86fig optimizing, 268–269
Genetics game/simulations, 350fig– presentation of exercise directions, problem-based learning (PBL),
352 84–85fig 274–275, 280–283fig
Graphics screen rollover integrating text team-building skills, 276–278
using audio with corresponding, and graphics, 81fig
Guided discovery (problem solving)
93, 94fig separation of text and graphics e-learning
avoiding extraneous, 140–145 on scrolling screens, 81–83fig
architecture of, 27t, 28
design dilemma case on using, synchronizing audio and
described, 385e
54fig–55, 73 graphics, 86–94fig
Guided tours (navigational), 294t
as lesson interfaces, 64fig Graphics/visual examples
organizational graphic of types adding interest to database lesson,
of, 59t 134fig
H
redundancy principle on using balancing auditory and visual
either (not both) audio or text channels, 107fig Handbook of Educational Psychology
with, 117–130fig (Alexander & Winne), 45
described by on-screen text and
research on learning using words narration, 118fig Handbook of Research on Educational
and, 68fig Communications and
displaying captions at bottom of
Technology (Jonassen), 45
selecting ones that support screens, 86fig
learning, 58–60 Herman-the Bug (pedagogical
of graphic that does not improve
agent), 169fig–170, 171
to show relationships, 63–64 learning, 57fig
Hunger in the Stahl (e-learning
static illustrations versus graphics explained using audio game), 363, 364–365
animations, 69–72 alone, 120fig
summary of guidelines for using graphics explained using identical
audio and, 386e text/audio, 120fig
I
summary of guidelines for using on how a bicycle pump works
only, 385e–386e with words and, 67fig Icons, 87–88fig
supporting games/simulations interesting but unrelated Images. See Graphics; Words/images/
instructions, 373fig graphics, 144 visuals design
synchronizing audio with, 86–89 Independent variable, 44
interesting but unrelated
to teach content types, 60–62fig information, 141fig Indiana Jones game, 357
as topic organizers, 63fig overloading visual channel, Individual CSCL outcomes
unresolved issues around, 72–73 106fig, 122fig described, 263
ways that learning is promoted placing words near corresponding optimizing, 265, 268
through, 60–64 graphics, 86fig Industry Report (2006), 8, 9, 60
weeding, 133–134 presentation of exercise Inform goals
directions, 85fig described, 17t
worked example step with
relevant, 213fig–214 of revision with added, 56fig of e-courseware, 25
See also Visual/pictorial screen rollover integrating text Inform programs (or briefings), 17t
processing; Words/images/ and graphics, 81fig
Information delivery view, 162
visual design separation of text and graphics on Information-acquisition learning
Graphics for Learning (Clark & scrolling screens, 83fig metaphor, 34t
Lyons), 60 synchronizing audio and Instructional control, 292
Graphics-words alignment graphics, 94fig
Instructional methods
design dilemma on, 78–79, worked example step with
definition of, 16
94–95 relevant, 213fig
games/simulations, 371–373
displaying captions at bottom of Group CSCL outcomes
screens, 85, 86fig how they affect learning, 37–42
collaborative group techniques
learner feedback screens, 83–84fig and, 278–283fig Integration process, 36, 39–40fig
482.
Subject Index 465
Interactions K Learner feedback
definition of, 233 Knowledge contiguity principle applied to
evaluation of thinking process screen display of, 83, 84fig
integration of words/pictures
during, 332 into, 36, 39–40fig formative and summative
learning research on learning evaluation, 43
transformation of words/pictures
through, 243fig into, 36fig, 37 learning research on game
tips for applying multimedia explanatory, 363–366
See also Learning
principles to, 250 providing explanatory,
Knowledge-construction learning 238–242fig
transfer appropriate, 236–237
cognitive science principles of, 35 tips for designing, 241–242
Interactivity of lessons, 27–28
metaphor, 34t–35 Learners
Interface complexity, 369–371fig
Internet delivery achieving near transfer, 217–226
described, 7, 8, 10 course intro music selected by,
L 137fig
e-learning development
decisions on, 16 Learner choices expertise reversal effect on novice,
assessing effectiveness of, 207
summary of guidelines for
collaborative e-learning, 387e 295–296 instructional decisions made by,
calibration accuracy of, 296–297 295–298
Interpretive graphics, 58, 59t
correlations between learning learning styles hypothesis on,
Intranet delivery
and, 297–298 121–122
described, 7, 8, 10
psychological reasons for poor, multimedia principle applied to
e-learning development decisions novice, 68–69
298
on, 16
Learner control novice, 68–69, 207, 335fig
summary of guidelines for
adaptive, 303–306 preference for specific e-lesson
collaborative e-learning, 387e
described, 289–290 features, 297–298
J design dilemma/resolution related Learning
to, 290–291, 312 balancing motivation and game-
Jeopardy (game), 41, 232fig based, 355–357
four principles for, 299–311
Job performance cognitive theory of multimedia,
instructional decisions made by
adapting practice to requirements 36fig
learners and, 295–298
of, 242–248 coherence principle on material
learning research on benefits of,
designing practice that mirrors, that can hurt, 133–152
301–302
236–242 computer-supported collaborative
navigational guidelines for,
See also Workforce training learning (CSCL), 257–285
307–311
Job tasks e-learning, 28
pacing, 292, 307, 368–369
adjusting practice based on, encoding specificity and, 218
popularity of, 295
245–246 far-transfer, 17–19, 18fig, 218,
program control versus, 292
summary of guidelines for 219–221, 226, 350–351
teaching, 386e–387e three types of, 292–295fig
game/simulation features leading
Job-specific training what we don’t know about, 311 to, 359–360
Internet vs. face-to-face, 332– Learner control principles information delivery view of, 162
333fig 1. give experienced learners media comparison studies on,
learning research on, 329–333fig control, 299–302 19–21
learning research on using, 329–333 2. make important instructional near transfer, 17–19, 217–218,
events the default, 302fig–303 226
psychological reasons for,
328–329 3. consider adaptive control, using on-screen coaches to
303–306 promote, 167–173fig
teaching thinking skills by using,
324–328 4. give pacing control, 307 online facilities for social,
thinking skills principles for, Learner differences 259t–260t
333–339 e-courseware and, 26 problem-based learning (PBL),
See also Workforce training as redundancy issue, 128 274–275, 280–283fig
483.
466 Subject Index
social cues and impact on, on integrated versus separated 2. promoting self-explanations of
162–163fig text and graphics, 92fig worked-out steps, 209–211
transfer principle of, 36 on job-specific training, 3. supplementing worked exam-
what we don’t know about, 48 329–333fig ples with explanations, 212
See also Knowledge on learner control benefits, 4. applying multimedia principles
Learning channels 301–302 to examples, 213–217
balancing visual and auditory, 107fig on learning benefits of 5. support learning transfer,
interactions, 243fig 217–226
cognitive theory on, 105–106
on modality effect, 111–112 overview of, 206–207
dual channels learning principle
on, 36 on omitting extraneous audio, Life of a Miserable Stomach e-lesson,
138–140fig 281fig
learning styles hypothesis on,
121–123 on omitting extraneous graphics, Lightning e-lesson screens
143–145 breaking down into segment,
overloading visual, 106fig, 122fig
on omitting extraneous words, 186, 187fig
Learning environment, 26
148–150 environmental sounds added
Learning metaphors to, 139
on omitting redundant on-screen
information-acquisition, 34t text, 123fig explained with audio narration,
knowledge-construction, 34t–35 on on-screen pedagogical agents 108fig–109fig
response-strengthening, 33–34t impact on learning, 170–171 with integrated/separated text
Learning processes on poor calibration accuracy by and graphics, 40fig, 91fig
how e-lessons affect, 37–41 learners, 297 interesting but unrelated graphics
managing limited cognitive on pretraining impact on added, 144fig
resources during, 36–37 learning, 194–197 series of static visuals on lightning
principles of, 35–36 on problem solving, 269, 272 formation, 70, 71fig
three metaphors for, 33–35 on problem-based learning Limited capacity learning principle, 36
Learning research (PBL), 274–275 Links (navigational), 294t, 308
on active comparisons of worked on using spoken rather than LISP programming tutorial, 202
examples, 224fig–225fig printed text, 107–112, 110fig Loan analysis e-lesson
on benefits of fading, 209 on virtual vs. face-to-face group far-transfer learning in, 18fig
decisions, 270–271
on benefits of program control, guidelines for asynchronous loan
300fig–301t on visible authors, 177 analysis, 398fig–401
on benefits of segmenting lessons, on words alone and words plus learner can access loan request
191–192 graphics, 67fig analysis resources, 327fig
on benefits of self-explanation See also Research learner can review loan analysis
questions, 210–211fig Learning styles hypothesis, 121–122 process, 328fig
on benefits of worked examples, Learning support access, 293 Long-term memory
205 Leveraging practice principles cognitive processes and role of,
on computer-based training 1. mirroring the job, 236–237t 35fig, 37
(CBT), 20–21fig 2. providing explanatory feed- integration of words/pictures
on conversational style, 163–165 back, 238fig–242 into, 36, 39–40fig
on delayed test from spaced read- 3. adapting practice to job methods for retrieval and transfer
ings, 247fig performance requirements, in, 41
on different team goal assignments, 242–248 transformation of words/pictures
275–276 4. applying multimedia into, 36fig, 37
on explanatory feedback, 240 principles, 249–250
on game explanatory feedback, 5. transition from examples to M
363–366 practice gradually, 251–252
Leveraging worked examples Media
on games/simulations, 354–355,
358–359fig 1. transition from worked comparison research on, 19–21fig
on graphics used with audio, example to problems via defining elements of, 16
94fig fading, 207–209 pitfall of abusing, 24–25
484.
Subject Index 467
Memory decorative graphic that does not Navigational elements
cognitive process and role of, improve learning, 57fig asynchronous e-learning
36fig, 37 design dilemmas/resolutions on commonly used, 294t
encoding specificity to retrieve applying, 54fig–55, 73 design dilemma/resolution related
information from, 218, 236 on including both words and to, 290–291, 312
working, 36fig, 37–39, 90, 138 graphics, 56–60 learner control through,
Menus (navigational), 294t learning research on supporting 289–290, 307–311
use of words and pictures, learner vs. program vs.
Message boards, 259t, 262fig
66–68fig instructional, 292
Metacognition skills
psychological reasons for the, lesson with multiple, 293fig
definition of, 320–321 65–66
setting default options for,
hand metaphor of, 329 revision with visuals added, 56fig 302fig–303
teaching, 334–335fig selecting graphics that support Navigational learner control
training programs to increase, learning, 58–59t guidelines
322t, 323 summary of research results from, use course maps, 309fig–311
Metaskills, 320 383t
use headings and introductory
The Miserable Life of a Stomach Multimedia principles (Mayer’s) statements, 307–308
e-lesson, 281fig applied to evaluating e-course-
use links sparingly, 308
Modality principle ware, 382–384
provide basic navigation options,
applied to pedagogical agent applied to practice, 249–250
311
sound making, 168–173 applied to worked examples,
Near transfer learning
applied to practice, 249 213–216
definition of, 217–218
applied to worked examples, coherence, 133–152, 250, 383t
214–215fig design to support, 218
contiguity, 80–96, 215–216,
design dilemmas/resolutions on 249–250, 383t perform goals related to, 17–19
applying, 100–101fig, 113–114 modality, 99–114, 214–215, 249, psychology of, 218
learning research on using 383t tips for design of, 226
spoken instead of printed text, multimedia, 56fig–68fig, 213– worked examples facilitating,
107–111 214fig, 383t 221–225
limitations to the, 103–105 personalization, 157–178, 383t The New Virtual Classroom (Clark &
presenting words as speech pretraining, 192–198, 383t Kwinn), 307
(audio), 101–103fig Novice learners
redundancy, 117–130fig,
psychological reasons for the, 214–215, 249, 383t comparing math problem-solving
105–107fig of expert vs., 335fig
segmenting, 184–192, 197–198,
recent reviews of research on 216, 383t expertise reversal effect on, 207
effect of, 111–112
summary of research results from, multimedia principle applied to,
summary of research results from, 383t 68–69
383t
See also Design; E-learning
what we don’t know about, 113 development; E-learning
when to apply the, 112–113 guidelines; E-lessons O
Motivation Music On-screen coaches (pedagogical
balancing game-based learning learning research on omitting agents)
and, 355–357 extraneous, 138–140fig described, 168fig–170
as problem solving success psychological reasons to avoid exploring the learning use of,
factor, 320 extraneous, 137–138 167
Mouse-overs (navigational), 294t selected by learners during course modality effect of realistic sounds
MSWord e-lesson, 186, 188fig intro, 137fig made by, 171–173
Multimedia principle realistic vs. cartoon-like, 171
applied to novices, 68–69 N student learning impact by,
applied to worked examples, Narration. See Audio narration 170–171
213–214fig Online conferencing, 259t
National Research Council, 246
485.
468 Subject Index
Online learning games. See Games/ psychological reasons for using Probability problem
simulations visible author, 176–177 faded worked, 208fig
Oregon Trail Game, 353–354 summary of research results from, worked example of, 203fig
Organizational graphics, 58, 59t 383t Problem solving
what we don’t know about with different collaboration
personalization, 177–178 interfaces, 272
P See also Conversational style factors leading to successful, 320
Pacing Personalized instruction, 303 graphical interface on group,
learner control, 292, 307 Physics game, 365–366 273fig
managing game/simulation, Pop-ups (navigational), 294t job-specific training on, 329–339
368–369 Power law of practice, 244fig predictions for e-learning training
Patient history (PBL case), 282fig Practice on, 402–403
Pedagogical agents calibration accuracy improvement team using chat vs. individual
described, 168–170 through, 297 solutions, 269
exploring the learning use of, in context of e-learning, See also Critical thinking;
167 233–234fig Thinking skills
human-looking versus cartoon- deliberate, 235 Problem solving (guided discovery)
like, 171 design dilemma/resolution related e-learning, 27t, 28, 385e
modality effects of realist sounds to, 232–233, 252 Problem-based learning (PBL),
made by, 171–173 how to leverage, 236–252 274–275, 280–283fig
student learning impact by, multiple-choice questions, 234fig Procedure content
170–171 paradox of, 234–236 described, 60, 237t
Peedy (pedagogical agent), 169–170 power law of, 244fig graphics used to teach, 60, 61t
Perform goals tips on designing, 248 Process content
described, 17t what we don’t know about, described, 60, 237t
of e-courseware, 25 251–252 graphics used to teach, 60, 61t
near versus far transfer, 17–19 Practice formats Program control
Perform programs, 17t interactions, 233, 236–237, instructional events set on
Performance analysis, 14 243fig, 250 default, 302fig–303
Personalization principle regurgitative, 233–234 learner control vs., 292
using conversational instead of Practice problem learning research on benefits of,
formal style, 160–162fig expertise reversal effect of using, 300fig–301t
design dilemma/resolution by 207
applying, 158–160, 178 fading from worked example to, R
using effect on-screen coaches to 208fig Reading comprehension e-lesson,
promote learning, 167–173fig learning research on use of, 210fig 336fig, 337fig
introduction to, 157–158 Pretraining principle Receptive (show-and-tell) e-learning
learning research on using description and purpose of, 192 architecture of, 8, 27t
conversational style, 163–165 examples of, 192fig described, 385e
learning research on using visible learning research for providing Redundancy effect, 124
author, 177 pretraining, 194–197 Redundancy principle
making author visible to promote psychological reasons for, 189 adding on-screen text to
learning, 173–176fig
summary of research results from, narration in special situations,
promoting personalization 383t 125–126fig
through polite speech,
what we don’t know about, 197 applied to practice, 249
166–167
Principle content applied to worked examples,
promoting personalization 214–215fig
through voice quality, 166 described, 60
graphics used to teach, 60, 61t design dilemma/resolutions
psychological reasons for, applying, 118–119,
162–163fig Probability, 47
129–130fig
486.
Subject Index 469
do not add text to narrated Excel e-lessons, 12fig, 62fig, varied context, 222fig
graphics, 119–120fig 188fig, 395e, 396e Wiki, 261fig
introduction to, 117–118 faded worked example, 397fig See also Audio screen examples;
learning research on including feedback, 239fig, 242fig Graphics/visual examples;
redundant on-screen text, Fetal Alcohol Spectrum Disorder Text screen examples; Worked
127–128 (FASD), 282fig–283fig examples
learning research on omitting formal approach to e-lesson, Seduction learning interference, 142
redundant on-screen text, 159fig Seductive details, 135
123fig formal style, 159fig, 161fig Segmenting principle
psychological reasons for, 121–123 game based on simulation of laws applied to worked example, 216
psychological reasons for of genetics, 351fig
exceptions to, 126–127 breaking down lesson into bite-
group problem-solving processes, size segments, 185–188fig
summary of research results from, 273fig
383t definition of, 186
Herman the Bug used in game, design dilemma/resolution on
what we don’t know about 169fig
redundancy, 128–129 applying, 184–185, 197–198
how brakes work, 195fig, 196fig learning research on benefits of,
Regurgitative interactions, 233–234 instructor remains invisible to 191–192
Relational graphics, 58, 59t learners, 176fig organizational sequences for data-
Representational graphics, 58, 59t invisible vs. visible author, 174fig base lesson, 184fig
Research learner can access resources for psychological reasons for,
clinical trials, 43t, 44–45 loan request analysis, 327fig 189–191fig
controlled studies, 43t, 44 learner can review loan analysis summary of research results from,
evidence-based practice of, 42–43 process, 328fig 383t
identifying relevant, 45–46 learner moves relevant symptoms what we don’t know about, 197
informal studies, 43t into evidence table, 325fig Self-explanation questions
three types of, 43t learner orders diagnostic tests, described, 210
325fig
See also Learning research learning research on benefits of,
learners compare their evidence 210–211fig
Research statistics to expert list, 326fig
effect size, 47–48 supplementing worked examples
lightning e-lesson, 40fig, 70, with, 212
interpreting, 46–48 71fig, 91fig, 108fig–109fig,
tips for designing, 212
probability, 47 139, 187fig
Shared control, 306
standard deviation and effect size loan analysis e-lesson, 18fig,
examples, 47fig 328fig, 398fig, 399fig–400fig Sherlock (multimedia environment),
330–331fig
Response-strengthening learning MSWord e-lesson, 188fig
metaphor, 33–34t Show-and-tell (receptive) e-learning,
multiple navigational control
8, 27t, 385e
Review of Educational Research, 45 elements, 293fig
SICUN training, 338
Rollover (navigational), 295fig multiple-choice questions, 234fig
Simulations. See Games/simulations
navigational elements designed
for learner control, 290fig Social cues, 162–163fig
S Social software
on-screen coach giving reading
Screen examples comprehension demo, 168fig collaboration through, 22–23
AIDS infection e-lesson, 62fig pretraining, 192fig emergence of, 257–258
America’s Army game, 356fig reading comprehension skills online facilities using, 259t–260t
breakout room, 261fig modeling, 336fig Software
conversational style, 161fig reading comprehension skills e-learning development decisions
database e-lesson, 390fig–391fig, practiced, 337fig on using, 16
392fig–393fig segmenting e-lesson, 187fig, social, 22–23, 257–258, 259t–260t
discussion board, 262fig 188fig Sound effects
example of a non-agent character, simulation of laws of genetics, avoiding e-lessons with
173fig 350fig extraneous, 135–137
487.
470 Subject Index
explosion and bullets, 136fig weeding, 133–134 2. make thinking processes
learner research on omitting words alone design, 54fig–55, explicit, 333–337
extraneous, 138–140fig 67fig, 73 3. define job-specific problem-
learners selected music during See also Words/images/visual solving processes, 338–339
course intro, 137fig design Training. See Workforce training
psychological reasons to avoid Text screen examples “Training wheel” principle, 368
extraneous, 137–138 adding interest to database lesson, Transfer appropriate interactions,
See also Audio narration 134fig 236–237
Split attention, 90 context presented with both text Transfer learning
Spoken words. See Audio narration and audio, 126fig near, 17–19, 217–218, 226
Standard deviation, 47fig design dilemma case on using principle of, 36
Static adaptive control, 303, 304fig words alone, 54fig–55, 73 worked examples facilitating,
Static illustrations displaying captions at bottom of 221–226
screens, 85, 86fig Transformational graphics, 58, 59t
animations versus, 69–72
extensive text elaborates on Tumor problem, 220
separation of narration and,
database concepts, 147fig
88–89
graphics explaining using identi-
Storyboards design dilemma, 78–79
cal audio and, 120fig U
Structure emphasizing examples, 222 U.S. Army Media Comparison
how a bicycle pump works, 67fig
Structured argumentation, 279fig Study (1947), 19–20
lean text/relevant visual explain-
Structured controversy, 278–280 ing database concepts, 147fig User modeling, 303
Summative evaluation, 43 overloading visual channel with
Surface emphasizing examples, 222 both audio and, 122fig V
Synchronous e-learning text on history of databases added Virtual classroom
example of CSCL, 261fig to lesson, 146fig comparing self-study to, 11–13
Excel Screen visual example of, Thinking skills screen capture example of, 12fig
62fig bottom line on teaching,
Virtual group decisions, 270–271
guidelines for Excel, 394fig–397 339–340
Visible authors
visible authors applied to, described, 320–321
definition of, 173
175fig–176fig design dilemma/resolution
regarding, 318–319, 340–341 examples of, 174fig–175
goal of building, 317–318 learning research on use of, 177
T psychological reasons for using,
learning research on job-specific
Team-building skills, 276–278 problem-solving training, 176–177
“Technophiles,” 24–25 329–333 synchronous and asynchronous
“Technostics,” 25 metacognition, 320–321, 322t, application of, 175fig–176fig
Telephone e-lesson screens, audio 323, 329, 334–335fig Visual/pictorial processing
explaining demo of telephone principles for building, 323–339 cognitive theory on channels for,
system, 102fig–103 psychological reasons for job- 105–106
Tell-and-do (directive) e-learning, 8, specific training for, 328–329 example of balancing auditory
27t, 385e summary of guidelines for and, 107fig
Text teaching, 388e example of screens overloading,
aligning graphics and, 78–95 training to increase creativity and, 106fig, 122fig
avoiding extraneous, 145–150 321–323 See also Graphics
learning research on omitting what we don’t know about Voice quality, 166
redundant, 123fig teaching, 340
redundancy principle on using See also Critical thinking;
Problem solving
W
either (not both) audio or,
117–130fig Thinking skills principles Weeding, 133–134
special situations for using 1. use job-specific cases, Wikis, 259t, 261fig
narration and, 125–126 324–333 Words alone design
488.
Subject Index 471
design dilemma case on using, modality principle applied to, transition to practice from, 251
54fig–55, 73 99–114 varied context, 223–225fig
on how a bicycle pump works multimedia principle applied to, what we don’t know about,
using, 67fig 56fig–74 226–227
research on learning through, redundancy principle applied to, See also Screen examples
68fig 117–130fig
Workforce training
Words as speech. See Audio narration tips on worked example,
for building critical thinking
Words-graphics alignment 216–217
skills, 323–328
design dilemma on, 78–79, weeding, 133–134
computer-supported collaborative
94–95 See also Audio narration; Design; learning (CSCL), 257–285
displaying captions at bottom of Graphics; Text
on creativity, 321–323
screens, 85, 86fig Worked examples
delivery media used for, 7, 8
learner feedback screens, 83–84fig applying Mayer’s multimedia
dollars invested in, 9fig
using legend to indicate parts of principles to, 213–216
Internet vs. face-to-face,
graphic, 85–86 calibration accuracy improvement
332–333fig
placing words near corresponding through, 297
predictions on next generation of,
graphics, 80–86fig definition and examples of,
401–403
presentation of exercise 203–204fig
trends in classroom and technol-
directions, 84–85fig demonstration types of, 218
ogy used in, 8fig
screen rollover integrating text design dilemma/resolution on
See also Job performance; Job-
and graphics, 81fig applying, 202, 227
specific training
separation of text and graphics on facilitating transfer learning,
Working memory
scrolling screens, 81–83fig 221–226
cognitive processes and role of,
synchronizing spoken words with faded, 207–208fig, 251, 397fig
36fig, 37
graphics, 86–94fig how they work, 204
cognitive theory on limitations
Words/images/visual design learning benefits of, 202–203 of, 138
cognitive identification/ learning research on, 205t managing limited capacity in,
organization/integration of, 36 learning research on comparisons 38–39
contiguity principle applied to, of, 224fig–225fig split attention using limited, 90
80–96 leveraging, 206–226
design dilemma regarding use of,
of probability problem, 203fig
54–55
problem with ignored, 205–206
learning research on learning
through well-designed, 53–55 tips for design of, 216–217
490.
ABOUT THE AUTHORS
RUTH COLVIN CLARK, ED.D., has focused her professional efforts
on bridging the gap between academic research on instructional meth-
ods and application of that research by training and performance support
professionals in corporate and government organizations. Dr. Clark has
developed a number of seminars and has written six books, including The
New Virtual Classroom, Building Expertise, and Efficiency in Learning, that
translate important research programs into practitioner guidelines.
A science undergraduate, she completed her doctorate in instructional
psychology/educational technology in 1988 at the University of Southern
California. Dr. Clark is a past president of the International Society of Per-
formance Improvement and a member of the American Educational Research
Association. She was honored with the 2006 Thomas F. Gilbert Distin-
guished Professional Achievement Award by the International Society for
Performance Improvement and is an invited Training Legend Speaker at the
ASTD 2007 International Conference. Dr. Clark is currently a dual resident
of Southwest Colorado and Phoenix, Arizona, and divides her professional
time among speaking, teaching, and writing. For more information, consult
her website at www.clarktraining.com.
RICHARD E. MAYER is professor of psychology at the University of
California, Santa Barbara (UCSB), where he has served since 1975. His
research interests are in educational and cognitive psychology, with a cur-
rent focus on multimedia learning and computer-supported learning. He is
past-president of the Division of Educational Psychology of the American
Psychological Association, former editor of the Educational Psychologist,
and former co-editor of Instructional Science, former chair of the UCSB
Department of Psychology, vice president of the American Educational
Research Association, and the year 2000 recipient of the E. L. Thorndike
Award for career achievement in educational psychology. He was ranked
473
491.
474 e-Learning and the Science of Instruction
number one as the most productive educational psychologist for the latest
ten-year period in Contemporary Educational Psychology. He is the author
of eighteen books and more than 250 articles and chapters, including
Multimedia Learning (2001), The Cambridge Handbook of Multimedia
Learning (editor, 2005), and Learning and Instruction (2nd ed.) (2008).
492.
HOW TO USETHE CD-ROM
System Requirements
PC with Microsoft Windows 98SE or later
Mac with Apple OS version 8.6 or later
Using the CD with Windows
To view the items located on the CD, follow these steps:
1. Insert the CD into your computer’s CD-ROM drive.
2. A window appears with the following options:
Contents: Allows you to view the files included on the CD-ROM.
Software: Allows you to install useful software from the CD-ROM.
Links: Displays a hyperlinked page of websites.
Author: Displays a page with information about the Author(s).
Contact Us: Displays a page with information on contacting the
publisher or author.
Help: Displays a page with information on using the CD.
Exit: Closes the interface window.
If you do not have autorun enabled, or if the autorun window does not
appear, follow these steps to access the CD:
1. Click Start → Run.
2. In the dialog box that appears, type d:<>start.exe, where d is the
letter of your CD-ROM drive. This brings up the autorun window
described in the preceding set of steps.
3. Choose the desired option from the menu. (See Step 2 in the
preceding list for a description of these options.)
475
493.
476 e-Learning and the Science of Instruction
In Case of Trouble
If you experience difficulty using the CD-ROM, please follow these steps:
1. Make sure your hardware and systems configurations conform to the
systems requirements noted under “System Requirements” above.
2. Review the installation procedure for your type of hardware and
operating system.
It is possible to reinstall the software if necessary.
To speak with someone in Product Technical Support, call 800–762–2974
or 317–572–3994 M–F 8:30 a.m. – 5:00 p.m. EST. You can also get support
and contact Product Technical Support through our website at www.wiley.
com/techsupport.
Before calling or writing, please have the following information available:
• Type of computer and operating system
• Any error messages displayed
• Complete description of the problem.
It is best if you are sitting at your computer when making the call.
494.
Pfeiffer Publications Guide
Thisguide is designed to familiarize you with the various types of Pfeiffer publications. The
formats section describes the various types of products that we publish; the methodologies
section describes the many different ways that content might be provided within a product.
We also provide a list of the topic areas in which we publish.
FORMATS
In addition to its extensive book-publishing program, Pfeiffer offers content in an array of
formats, from fieldbooks for the practitioner to complete, ready-to-use training packages that
support group learning.
FIELDBOOK Designed to provide information and guidance to practitioners in the midst of
action. Most fieldbooks are companions to another, sometimes earlier, work, from which its ideas
are derived; the fieldbook makes practical what was theoretical in the original text. Fieldbooks
can certainly be read from cover to cover. More likely, though, you'll find yourself bouncing
around following a particular theme, or dipping in as the mood, and the situation, dictate.
HANDBOOK A contributed volume of work on a single topic, comprising an eclectic mix of
ideas, case studies, and best practices sourced by practitioners and experts in the field.
An editor or team of editors usually is appointed to seek out contributors and to evaluate
content for relevance to the topic. Think of a handbook not as a ready-to-eat meal, but as a
cookbook of ingredients that enables you to create the most fitting experience for the occasion.
RESOURCE Materials designed to support group learning. They come in many forms: a
complete, ready-to-use exercise (such as a game); a comprehensive resource on one topic (such
as conflict management) containing a variety of methods and approaches; or a collection of
like-minded activities (such as icebreakers) on multiple subjects and situations.
TRAINING PACKAGE An entire, ready-to-use learning program that focuses on a particu-
lar topic or skill. All packages comprise a guide for the facilitator/trainer and a workbook for the
participants. Some packages are supported with additional media—such as video—or learning
aids, instruments, or other devices to help participants understand concepts or practice and
develop skills.
• Facilitator/trainer's guide Contains an introduction to the program, advice on how to
organize and facilitate the learning event, and step-by-step instructor notes. The guide also
contains copies of presentation materials—handouts, presentations, and overhead designs,
for example—used in the program.
495.
• Participant's workbookContains exercises and reading materials that support the learning
goal and serves as a valuable reference and support guide for participants in the weeks
and months that follow the learning event. Typically, each participant will require his or
her own workbook.
ELECTRONIC CD-ROMs and web-based products transform static Pfeiffer content into
dynamic, interactive experiences. Designed to take advantage of the searchability, automation,
and ease-of-use that technology provides, our e-products bring convenience and immediate
accessibility to your workspace.
METHODOLOGIES
CASE STUDY A presentation, in narrative form, of an actual event that has occurred inside an
organization. Case studies are not prescriptive, nor are they used to prove a point; they are designed
to develop critical analysis and decision-making skills. A case study has a specific time frame, speci-
fies a sequence of events, is narrative in structure, and contains a plot structure—an issue (what
should be/have been done?). Use case studies when the goal is to enable participants to apply
previously learned theories to the circumstances in the case, decide what is pertinent, identify the
real issues, decide what should have been done, and develop a plan of action.
ENERGIZER A short activity that develops readiness for the next session or learning event.
Energizers are most commonly used after a break or lunch to stimulate or refocus the group. Many
involve some form of physical activity, so they are a useful way to counter post-lunch lethargy. Other
uses include transitioning from one topic to another, where “mental” distancing is important.
EXPERIENTIAL LEARNING ACTIVITY (ELA) A facilitator-led intervention that moves
participants through the learning cycle from experience to application (also known as a Struc-
tured Experience). ELAs are carefully thought-out designs in which there is a definite learning
purpose and intended outcome. Each step—everything that participants do during the activ-
ity—facilitates the accomplishment of the stated goal. Each ELA includes complete instructions
for facilitating the intervention and a clear statement of goals, suggested group size and timing,
materials required, an explanation of the process, and, where appropriate, possible variations
to the activity. (For more detail on Experiential Learning Activities, see the Introduction to the
Reference Guide to Handbooks and Annuals, 1999 edition, Pfeiffer, San Francisco.)
GAME A group activity that has the purpose of fostering team spirit and togetherness in
addition to the achievement of a pre-stated goal. Usually contrived—undertaking a desert
496.
expedition, for example—thistype of learning method offers an engaging means for participants
to demonstrate and practice business and interpersonal skills. Games are effective for team
building and personal development mainly because the goal is subordinate to the process—the
means through which participants reach decisions, collaborate, communicate, and generate trust
and understanding. Games often engage teams in “friendly” competition.
ICEBREAKER A (usually) short activity designed to help participants overcome initial anxi-
ety in a training session and/or to acquaint the participants with one another. An icebreaker
can be a fun activity or can be tied to specific topics or training goals. While a useful tool in
itself, the icebreaker comes into its own in situations where tension or resistance exists within
a group.
INSTRUMENT A device used to assess, appraise, evaluate, describe, classify, and summarize
various aspects of human behavior. The term used to describe an instrument depends primar-
ily on its format and purpose. These terms include survey, questionnaire, inventory, diagnostic,
survey, and poll. Some uses of instruments include providing instrumental feedback to group
members, studying here-and-now processes or functioning within a group, manipulating
group composition, and evaluating outcomes of training and other interventions.
Instruments are popular in the training and HR field because, in general, more growth can
occur if an individual is provided with a method for focusing specifically on his or her own
behavior. Instruments also are used to obtain information that will serve as a basis for change
and to assist in workforce planning efforts.
Paper-and-pencil tests still dominate the instrument landscape with a typical package
comprising a facilitator's guide, which offers advice on administering the instrument and
interpreting the collected data, and an initial set of instruments. Additional instruments are
available separately. Pfeiffer, though, is investing heavily in e-instruments. Electronic instru-
mentation provides effortless distribution and, for larger groups particularly, offers advantages
over paper-and-pencil tests in the time it takes to analyze data and provide feedback.
LECTURETTE A short talk that provides an explanation of a principle, model, or process that
is pertinent to the participants' current learning needs. A lecturette is intended to establish a
common language bond between the trainer and the participants by providing a mutual frame
of reference. Use a lecturette as an introduction to a group activity or event, as an interjection
during an event, or as a handout.
MODEL A graphic depiction of a system or process and the relationship among its elements.
Models provide a frame of reference and something more tangible, and more easily remembered,
than a verbal explanation. They also give participants something to “go on,” enabling them to
497.
track their ownprogress as they experience the dynamics, processes, and relationships being
depicted in the model.
ROLE PLAY A technique in which people assume a role in a situation/scenario: a cus-
tomer service rep in an angry-customer exchange, for example. The way in which the role is
approached is then discussed and feedback is offered. The role play is often repeated using a
different approach and/or incorporating changes made based on feedback received. In other
words, role playing is a spontaneous interaction involving realistic behavior under artificial (and
safe) conditions.
SIMULATION A methodology for understanding the interrelationships among components
of a system or process. Simulations differ from games in that they test or use a model that
depicts or mirrors some aspect of reality in form, if not necessarily in content. Learning occurs
by studying the effects of change on one or more factors of the model. Simulations are com-
monly used to test hypotheses about what happens in a system—often referred to as “what if?”
analysis—or to examine best-case/worst-case scenarios.
THEORY A presentation of an idea from a conjectural perspective. Theories are useful because
they encourage us to examine behavior and phenomena through a different lens.
TOPICS
The twin goals of providing effective and practical solutions for workforce training and organi-
zation development and meeting the educational needs of training and human resource profes-
sionals shape Pfeiffer's publishing program. Core topics include the following:
Leadership & Management
Communication & Presentation
Coaching & Mentoring
Training & Development
e-Learning
Teams & Collaboration
OD & Strategic Planning
Human Resources
Consulting