Recommended
PPTX
PPTX
Phy cc 10 17-12-unit 5b_help_session_pub
ODP
PPT
Homeroom check in 10-22-2012
DOCX
PPTX
PDF
PDF
Help! my sql server log file is too big!!! tech republic
PPTX
PURPOSIVE SAMPLING IN EDUCATIONAL RESEARCH RACHITHRA RK.pptx
PDF
IMANI Africa files RTI request seeking full disclosure on 2026 SIM registrati...
PDF
Unit-III pdf (Basic listening Skill, Effective Writing Communication & Writin...
PPTX
Introduction-to-Anatomy-and-Physiology.pptx
PDF
Biology Practical Class 12th 2025 PDF(2)-2-52.pdf
PDF
DHA/HAAD/MOH/DOH OPTOMETRY MCQ PYQ. .pdf
PPTX
Nursing Unit Management, patient care unit, physical layout of nursing unit,t...
PPTX
3 G8_Q3_L3_ (Cartoon as Representation in Opinion Editorial Article).pptx
PDF
Scalable-MADDPG-Based Cooperative Target Invasion for a Multi-USV System.pdf
PPTX
Planning Assessment for Outcome-based Education
PDF
Toward Massive, Ultrareliable, and Low-Latency Wireless Communication With Sh...
PPTX
How to Configure Push & Pull Rule in Odoo 18 Inventory
PDF
Projecte de la porta de la classe de primer A: Mar i cel.
PPTX
AN EXTREMELY BORING GENERAL QUIZ FOR UG.pptx
PPTX
TAMIS & TEMS - HOW, WHY and THE STEPS IN PROCTOLOGY
PDF
Projecte de la porta d'i5B: Els animals marins
PPTX
How to Manage Package Reservation in Odoo 18 Inventory
PPTX
THEORIES OF GROWTH AND DEVELOPMENT..pptx
PPTX
ATTENTION -PART 2.pptx Shilpa Hotakar for I semester BSc students
PPTX
10-12-2025 Francois Staring How can Researchers and Initial Teacher Educators...
PDF
2024 Trend Updates: What Really Works In SEO & Content Marketing
PDF
Storytelling For The Web: Integrate Storytelling in your Design Process
More Related Content
PPTX
PPTX
Phy cc 10 17-12-unit 5b_help_session_pub
ODP
PPT
Homeroom check in 10-22-2012
DOCX
PPTX
PDF
PDF
Help! my sql server log file is too big!!! tech republic
Recently uploaded
PPTX
PURPOSIVE SAMPLING IN EDUCATIONAL RESEARCH RACHITHRA RK.pptx
PDF
IMANI Africa files RTI request seeking full disclosure on 2026 SIM registrati...
PDF
Unit-III pdf (Basic listening Skill, Effective Writing Communication & Writin...
PPTX
Introduction-to-Anatomy-and-Physiology.pptx
PDF
Biology Practical Class 12th 2025 PDF(2)-2-52.pdf
PDF
DHA/HAAD/MOH/DOH OPTOMETRY MCQ PYQ. .pdf
PPTX
Nursing Unit Management, patient care unit, physical layout of nursing unit,t...
PPTX
3 G8_Q3_L3_ (Cartoon as Representation in Opinion Editorial Article).pptx
PDF
Scalable-MADDPG-Based Cooperative Target Invasion for a Multi-USV System.pdf
PPTX
Planning Assessment for Outcome-based Education
PDF
Toward Massive, Ultrareliable, and Low-Latency Wireless Communication With Sh...
PPTX
How to Configure Push & Pull Rule in Odoo 18 Inventory
PDF
Projecte de la porta de la classe de primer A: Mar i cel.
PPTX
AN EXTREMELY BORING GENERAL QUIZ FOR UG.pptx
PPTX
TAMIS & TEMS - HOW, WHY and THE STEPS IN PROCTOLOGY
PDF
Projecte de la porta d'i5B: Els animals marins
PPTX
How to Manage Package Reservation in Odoo 18 Inventory
PPTX
THEORIES OF GROWTH AND DEVELOPMENT..pptx
PPTX
ATTENTION -PART 2.pptx Shilpa Hotakar for I semester BSc students
PPTX
10-12-2025 Francois Staring How can Researchers and Initial Teacher Educators...
Featured
PDF
2024 Trend Updates: What Really Works In SEO & Content Marketing
PDF
Storytelling For The Web: Integrate Storytelling in your Design Process
PDF
Artificial Intelligence, Data and Competition – SCHREPEL – June 2024 OECD dis...
PDF
How to Leverage AI to Boost Employee Wellness - Lydia Di Francesco - SocialHR...
PDF
2024 State of Marketing Report – by Hubspot
PDF
Everything You Need To Know About ChatGPT
PDF
Product Design Trends in 2024 | Teenage Engineerings
PDF
How Race, Age and Gender Shape Attitudes Towards Mental Health
PDF
AI Trends in Creative Operations 2024 by Artwork Flow.pdf
PDF
PDF
PEPSICO Presentation to CAGNY Conference Feb 2024
PDF
Content Methodology: A Best Practices Report (Webinar)
PPTX
How to Prepare For a Successful Job Search for 2024
PDF
Social Media Marketing Trends 2024 // The Global Indie Insights
PDF
Trends In Paid Search: Navigating The Digital Landscape In 2024
PDF
5 Public speaking tips from TED - Visualized summary
PDF
ChatGPT and the Future of Work - Clark Boyd
PDF
Getting into the tech field. what next
PDF
Google's Just Not That Into You: Understanding Core Updates & Search Intent
PDF
How to have difficult conversations
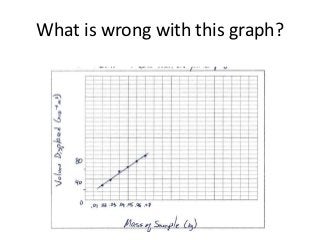
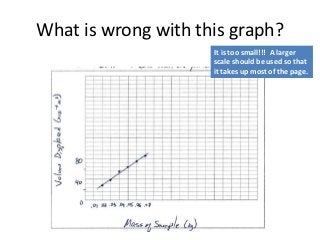
Graphs and how to make them right!!! 1. 2. 3. What is wrong with this graph?
It is too small!!! A larger
scale should be used so that
it takes up most of the page.
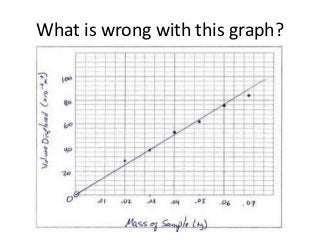
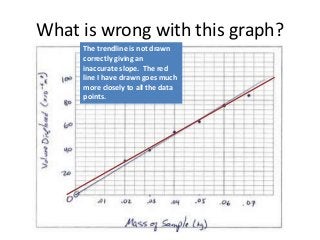
4. 5. What is wrong with this graph?
The trendline is not drawn
correctly giving an
inaccurate slope. The red
line I have drawn goes much
more closely to all the data
points.
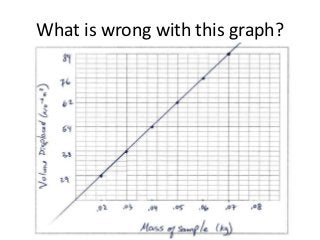
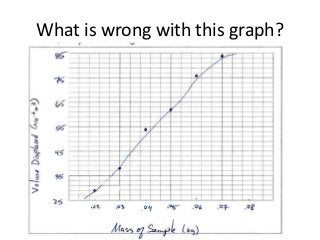
6. 7. What is wrong with this graph?
The scale is wrong on the y-axis.
From point A to point B, there is
a change of 9 (because 38-29=9)
but from point B to point C
there is a change of 6 (because
54-38=6).
• C
• B
• A
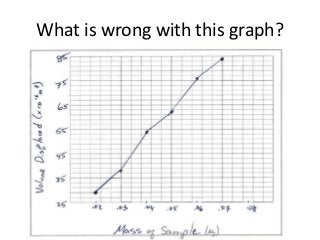
8. 9. What is wrong with this graph?
We need one straight
trendline. It is not connect-
the-dots!
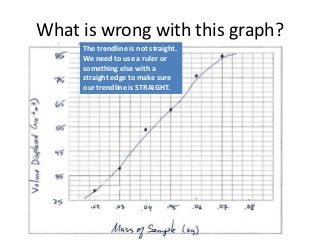
10. 11. What is wrong with this graph?
The trendline is not straight.
We need to use a ruler or
something else with a
straight edge to make sure
our trendline is STRAIGHT.
12. Resources
• For more information, check out:
http://jacobsphysics.blogspot.com/2011/06/b
ad-graphs-common-mistakes-on-data.html
• And check out:
http://jacobsphysics.blogspot.com/2011/06/b
ad-graphs-part-ii-dont-force-best-fit.html