Horizon V2 Issue 1
•
1 like•277 views

Agneya\'s Renewable Energy sector Newsletter

Recommended
Recommended
More Related Content
What's hot
What's hot (13)
Viewers also liked
Viewers also liked (7)
Similar to Horizon V2 Issue 1
Similar to Horizon V2 Issue 1 (20)
More from Agneya Carbon Ventures Private Limited
More from Agneya Carbon Ventures Private Limited (17)
Horizon V2 Issue 1
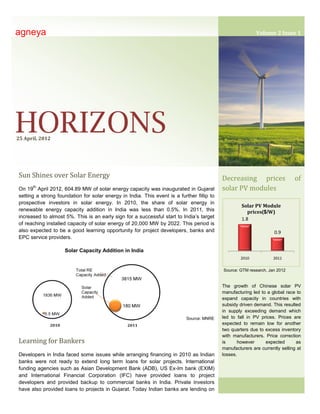
- 1. agneya Volume 2 Issue 1 HORIZONS 25 April, 2012 Sun Shines over Solar Energy Decreasing prices of th On 19 April 2012, 604.89 MW of solar energy capacity was inaugurated in Gujarat solar PV modules setting a strong foundation for solar energy in India. This event is a further fillip to prospective investors in solar energy. In 2010, the share of solar energy in Solar PV Module renewable energy capacity addition in India was less than 0.5%. In 2011, this prices($/W) increased to almost 5%. This is an early sign for a successful start to India’s target 1.8 of reaching installed capacity of solar energy of 20,000 MW by 2022. This period is also expected to be a good learning opportunity for project developers, banks and 0.9 EPC service providers. Solar Capacity Addition in India 2010 2011 Source: GTM research, Jan 2012 The growth of Chinese solar PV manufacturing led to a global race to expand capacity in countries with subsidy driven demand. This resulted in supply exceeding demand which Source: MNRE led to fall in PV prices. Prices are expected to remain low for another two quarters due to excess inventory with manufacturers. Price correction Learning for Bankers is however expected as manufacturers are currently selling at Developers in India faced some issues while arranging financing in 2010 as Indian losses. banks were not ready to extend long term loans for solar projects. International funding agencies such as Asian Development Bank (ADB), US Ex-Im bank (EXIM) and International Financial Corporation (IFC) have provided loans to project developers and provided backup to commercial banks in India. Private investors have also provided loans to projects in Gujarat. Today Indian banks are lending on asasd
- 2. 2 Increasing efficiency of solar modules Company Country Capacity (MW) Suntech China 2,400 JA Solar China 2,100 Trina China 1,900 Yingli China 1,700 Motech Solar Taiwan 1,500 Gintech Taiwan 1,500 Canadian China 1,300 Solar Neo Solar Taiwan 1,300 Power Hanwha Solar China 1,100 One JinkoSolar China 1,100 Source: Energy Trend 600MW Solar Farm at Patan, Gujarat Number of players in manufacturing of solar PV the basis of asset financing at higher interest rates, making many projects components has increased over unviable. As more projects come online under Central and State schemes, Indian years. This is leading to Banks need to be encouraged to learn from their foreign counterparts on how to increasing standardization and address lending risks typical of renewable energy projects. commoditization of solar PV modules. This has pushed many players to spend more on R&D to Learning for Developers differentiate their product from Total investment in India (Billion $) competitors resulting in gradual During reverse bidding process in Jawaharlal Nehru National Solar Mission (JNNSM) Phase 4.2 increase in efficiencies of solar modules over the years. 1 Batch II, aggressive bidding led to the lowest bid of `7.49/unit while the highest Solar Close to Wind? successful bid was `9.44/unit. These bids are being considered unviable by some analysts. As bidding under Rajasthan Solar However developers like Solairedirect SA of Policy approaches, there are France who have quoted `7.49 /unit and Alex speculations as to whether price Green Energy of Kolkata who have quoted parity between solar and wind `7/unit in Orissa have expressed confidence 0.6 can be achieved in this process. in their ability to drive down costs over time The current tariff for wind in and hence prove their bids workable. Rajasthan is `4.69/unit but solar Investment rose 7 times in 2011 while 2010 2011 energy prices are also dropping capacity addition was 33 times that of 2010. significantly (lowest price under This can be attributed to falling prices of solar Source: Pew Charitable Trusts, US, JNNSM was `7.49/unit). With modules, movement up the learning curve for April 2012 improved technology and land developers as well as economies of scale. being made available by the Government at below-market rates, solar energy might get the Supportive Government Policies extra push to come close to wind energy. A critical factor for continuous growth of solar energy is continued government support in India through policy interventions. Sudden changes in the policy discourage investors hence it is essential that the government maintain its support and ensures clarity to prospective investors.
- 3. 3 REC Market in April 2012 REC Inventory REC Trade Clearing Price Buy Bids Sell Bids Volume Traded April 2012 ` per REC REC Inventory Apr 2012 IEX 2,201 RE Newsletter 237,100 105,844 62,277 Non-Solar PXIL 26,813 26,842 8,949 2,201 IEX 289 - - - Solar 71,226 PXIL 225 - - - 118,125 2012-13 REC Trading Kicks off to a Healthy Start 85,444 Trading at the start of the financial year (FY2012-13) saw significant increase in both volumes and prices over the opening trade of FY2011-12. The total traded volume 38,545 was 71,226 while the prices stabilized at `2,201 at both the exchanges. Overall, the Opening Issued Redeemed Balance opening trade this financial year was an improvement over last year. Source: REC Registry Total IEX & PXIL Non-solar REC Trade 250 3,500 206 3,000 200 172 200 2,500 150 Solar Makes an Entry 2,000 106 112 96 1,500 In a market dominated 100 71 traditionally by wind energy, solar 46 1,000 50 energy has tended to be 19 19 25 500 16 insignificant. That is beginning to - - change - three solar projects with May June July Aug Sept Oct Nov Dec Jan Feb Mar April a total capacity of 8 MW have 2011 2011 2011 2011 2011 2011 2011 2011 2012 2012 2012 2012 been registered at the REC Registry in April this year. While IEX and PXIL Whole Volume Trade Price at IEX Price at PXIL demand for solar REC had been seen at the power exchanges lack of supply of RECs has resulted in no trade taking place. Trading volumes at the beginning of this financial year have improved significantly With this registration, solar REC over April last year. This can be attributed to maturity of the REC market and growing trading is expected to start soon. confidence amongst market players.
- 4. Capacity Registered, MW 600 2500 4 500 State-wise Registered 2000 384 Capacity 2011-12 400 1500 300 273 287 271 State MW 1000 Haryana 9 200 188 172 149 158 J&K 18 Kerala 21 113 93 500 Uttarakhand 24 100 54 Madhya Pradesh 21 27 Punjab 46 0 0 Himachal Pradesh 35 Rajasthan 50 May June July Aug Sept Oct Nov Dec Jan Feb Mar Apr-12 Chhattisgarh 92 2011 2011 2011 2011 2011 2011 2011 2011 2012 2012 2012 Gujarat 211 Tamil Nadu 529 Maharashtra 542 Cum. Registered (RHS) Registered Uttar Pradesh 658 Total 2,255 In total, 54 MW of capacity was registered in April. With this addition, the capacity registered in the last 12 months, i.e May 2011 to April 2012 has touched 2,194 MW. Source-wise Registered Capacity 2011-12 Source MW Others 2 Solar PV - Small Hydro 139 Biomass 467 Bio-fuel cogen 606 Wind 1,041 Total 2,255 agneya Promoted by alumni of IIM Ahmedabad and IIM Bangalore, we at agneya work with Renewable Energy Generators to manage their REC accreditation, registration, issuances and trading. We also work with companies covered by the Renewable Purchase Obligation (RPO) on optimum ways to fulfill these obligations. agneya also provides services in the following areas – Renewable Energy Project Management – advising clients on the best possible portfolio of renewable energy (wind, solar, bio) across tariff regimes, technology options, electricity sales structuring and availing incentives like REC and GBI. Electricity Market Regulations – advising clients on regulatory aspects of electricity market, options for realizing the maximum value from their energy assets and minimizing costs related to regulatory compliance. Carbon & Energy – measuring carbon footprint, energy audits and current/future energy profiling to assess risks and opportunities related to energy security and climate change. Sustainability – building robust long term foundations for business i.e. managing economic, environmental and social aspects of business. These include water management, sustainability management and reporting. For further information on Renewable Energy Certificates or other services, please contact us at – E-mail – rahul@agneya.in | Phone – +91-20-41203800, +91-88 06 07 07 83 | Website – www.agneya.in