1. Radiation Dose and Image Optimization During
Computed Tomography Coronary Angiography
Yili Wang1, Barinder Dhillon1, Narinder Paul2
Introduction
Materials &
Methods
Results Discussion
Computed Tomography
Coronary Angiography
(CTCA) is the standard of
care for evaluation of the
coronary arteries in
patients with low to
intermediate risk of
coronary artery disease
(CAD), due to a high
negative predictive value.
CTCA requires optimal
contrast enhancement of
the coronary arteries.
However, there is concern
over the use of ionizing
radiation and potential
long-term health issues.
• Lungman® chest
phantom
• Toshiba Aquilion ONETM
320-MDCT Scanner
• Iodinated IV contrast
All scans used a CTCA
protocol; radiation dose
(CTDIvol and DLP) was
recorded.
1. Scan chest phantom at
different kV. Use mA
modulation to maintain
image noise (SD, HU).
2. Scan chest phantom at
different mA and fixed
80 kV.
3. Scan chest phantom at
different scan lengths.
4. Scan test tubes
containing 3 different
concentrations of
iodinated contrast at 3
different dilutions and
4 different kV settings
(Fig.1). Measure
Hounsfield Units (HU).
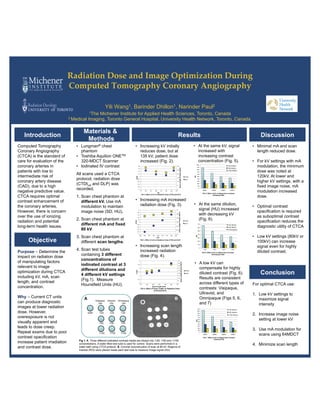
• Increasing kV initially
reduces dose, but at
135 kV, patient dose
increased (Fig. 2).
• Minimal mA and scan
length reduced dose.
• For kV settings with mA
modulation, the minimum
dose was noted at
120kV. At lower and
higher kV settings, with a
fixed image noise, mA
modulation increased
dose.
• Optimal contrast
opacification is required
as suboptimal contrast
opacification reduces the
diagnostic utility of CTCA
• Low kV settings (80kV or
100kV) can increase
signal even for highly
diluted contrast.
Conclusion
Objective
Purpose – Determine the
impact on radiation dose
of manipulating factors
relevant to image
optimization during CTCA
including kV, mA, scan
length, and contrast
concentration.
Why – Current CT units
can produce diagnostic
images at lower radiation
dose. However,
overexposure is not
visually apparent and
leads to dose creep.
Repeat exams due to poor
contrast opacification
increase patient irradiation
and contrast dose.
For optimal CTCA use:
1. Low kV settings to
maximize signal
intensity
2. Increase image noise
setting at lower kV
3. Use mA modulation for
scans using 64MDCT
4. Minimize scan length
1The Michener Institute for Applied Health Sciences, Toronto, Canada
2 Medical Imaging, Toronto General Hospital, University Health Network, Toronto, Canada.
• Increasing mA increased
radiation dose (Fig. 3).
• At the same kV, signal
increased with
increasing contrast
concentration (Fig. 5).
• A low kV can
compensate for highly
diluted contrast (Fig. 6).
Results are consistent
across different types of
contrasts: Visipaque,
Ultravist, and
Omnipaque (Figs 5, 6,
and 7)
• At the same dilution,
signal (HU) increased
with decreasing kV
(Fig. 6).
• Increasing scan length
increased radiation
dose (Fig. 4).
0
100
200
300
400
500
600
700
800
900
1000
80kV 100kV 120kV 135kV
HU
FIG 5. Effect of kV on Signal from Contrast
(Visipaque 320)
1/20 dilution
1/50 dilution
1/100 dilution
0
100
200
300
400
500
600
700
80kV 100kV 120kV 135kV
HU
FIG 6. Effect of kV on Signal from Contrast
(Omnipaque 240)
1/20 dilution
1/50 dilution
1/100 dilution
0
100
200
300
400
500
600
700
800
900
1000
1100
80kV 100kV 120kV 135kV
HU
FIG 7. Effect of kV on Signal from Contrast
(Ultravist 370)
1/20 dilution
1/50 dilution
1/100 dilution
Fig 1. A. Three different iodinated contrast media are diluted into 1/20, 1/50 and 1/100
concentrations. A water-filled test tube is used for control. Scans were performed in a
water bath using CTCA protocol. B. Coronal reconstruction of scan at 80 kV. Regions of
Interest (ROI) were placed inside each test tube to measure image signal (HU).
water 1/20 1/20 1/20
1/50 1/50 1/50
1/100 1/100 1/100
Visipaque
320
Ultravist
370
Omnipaque
240
A B
0
5
10
15
20
25
30
0
0.2
0.4
0.6
0.8
1
1.2
1.4
1.6
1.8
70 80 90 100 110 120 130 140
DoseLengthProduct(DLP)
CTDI
kV
FIG 2. Effect of kV on Radiation Dose (CTDI and DLP)
CTDI
DLP
21
22
23
24
25
26
27
0
0.2
0.4
0.6
0.8
1
1.2
1.4
1.6
1.8
2
145 150 155 160 165 170 175 180 185
DoseLengthProduct(DLP)
CTDI
mA
FIG 3. Effect of mA on Radiation Dose (CTDI and DLP)
CTDI
DLP
0
5
10
15
20
25
30
35
40
45
0
0.5
1
1.5
2
2.5
3
110 120 130 140 150 160 170
DoseLenghtProduct(DLP)
CTDI
Scan Length (mm)
FIG 4. Effect of Scan Length on Radiation Dose
(CTDI and DLP)
CTDI
DLP