More Related Content
Similar to DT Downtown (15)
DT Downtown
- 1. Blake Taylor Austin Board of REALTORS
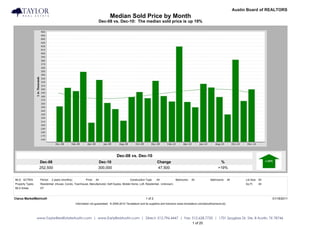
Median Sold Price by Month
Dec-08 vs. Dec-10: The median sold price is up 19%
Dec-08 vs. Dec-10
Dec-08 Dec-10 Change %
252,500 300,000 47,500 +19%
MLS: ACTRIS Period: 2 years (monthly) Price: All Construction Type: All Bedrooms: All Bathrooms: All Lot Size: All
Property Types: Residential: (House, Condo, Townhouse, Manufactured, Half Duplex, Mobile Home, Loft, Residential - Unknown) Sq Ft: All
MLS Areas: DT
Clarus MarketMetrics® 1 of 2 01/18/2011
Information not guaranteed. © 2009-2010 Terradatum and its suppliers and licensors (www.terradatum.com/about/licensors.td).
www.TaylorRealEstateAustin.com | www.EarlyBirdAustin.com | Direct: 512.796.4447 | Fax: 512.628.7720 | 1701 Spyglass Dr. Ste. 8 Austin, TX 78746
1 of 20
- 2. Blake Taylor Austin Board of REALTORS
Median Sold Price by Month
Dec-08 vs. Dec-10: The median sold price is up 19%
Time Period Median Price # Units Average DOM
Dec-10 300,000 19 96
Nov-10 267,500 12 119
Oct-10 382,500 8 74
Sep-10 229,890 13 106
Aug-10 278,450 16 57
Jul-10 305,092 15 70
Jun-10 315,196 18 100
May-10 250,000 25 115
Apr-10 264,800 15 114
Mar-10 419,450 20 122
Feb-10 266,000 8 50
Jan-10 281,140 6 127
Dec-09 323,750 8 59
Nov-09 275,195 14 91
Oct-09 292,500 18 140
Sep-09 278,500 20 62
Aug-09 212,500 14 57
Jul-09 245,000 13 85
Jun-09 262,000 13 91
May-09 326,250 13 56
Apr-09 207,000 4 69
Mar-09 348,750 4 107
Feb-09 295,000 7 126
Jan-09 304,200 5 77
Dec-08 252,500 4 88
Clarus MarketMetrics® 2 of 2 01/18/2011
Information not guaranteed. © 2009-2010 Terradatum and its suppliers and licensors (www.terradatum.com/about/licensors.td).
www.TaylorRealEstateAustin.com | www.EarlyBirdAustin.com | Direct: 512.796.4447 | Fax: 512.628.7720 | 1701 Spyglass Dr. Ste. 8 Austin, TX 78746
2 of 20
- 3. Blake Taylor Austin Board of REALTORS
Median For Sale vs. Median Sold
Dec-08 vs. Dec-10: The median price of for sale properties is down 13% and the median price of sold properties is up 19%
Dec-08 vs. Dec-10 Dec-08 vs. Dec-10
Dec-08 Dec-10 Change % Dec-08 Dec-10 Change %
425,000 370,000 -55,000 -13% 252,500 300,000 47,500 +19%
MLS: ACTRIS Period: 2 years (monthly) Price: All Construction Type: All Bedrooms: All Bathrooms: All Lot Size: All
Property Types: Residential: (House, Condo, Townhouse, Manufactured, Half Duplex, Mobile Home, Loft, Residential - Unknown) Sq Ft: All
MLS Areas: DT
Clarus MarketMetrics® 1 of 2 01/18/2011
Information not guaranteed. © 2009-2010 Terradatum and its suppliers and licensors (www.terradatum.com/about/licensors.td).
www.TaylorRealEstateAustin.com | www.EarlyBirdAustin.com | Direct: 512.796.4447 | Fax: 512.628.7720 | 1701 Spyglass Dr. Ste. 8 Austin, TX 78746
3 of 20
- 4. Blake Taylor Austin Board of REALTORS
Median For Sale vs. Median Sold
Dec-08 vs. Dec-10: The median price of for sale properties is down 13% and the median price of sold properties is up 19%
For Sale # Properties Sold # Properties Price
Time Period Median For Sale Median Sold Difference
Dec-10 370,000 145 300,000 19 -70,000
Nov-10 369,450 168 267,500 12 -101,950
Oct-10 360,000 187 382,500 8 22,500
Sep-10 332,250 206 229,890 13 -102,360
Aug-10 326,900 207 278,450 16 -48,450
Jul-10 325,000 226 305,092 15 -19,908
Jun-10 319,945 244 315,196 18 -4,749
May-10 325,000 220 250,000 25 -75,000
Apr-10 325,000 253 264,800 15 -60,200
Mar-10 354,450 244 419,450 20 65,000
Feb-10 367,000 228 266,000 8 -101,000
Jan-10 365,000 217 281,140 6 -83,860
Dec-09 385,000 217 323,750 8 -61,250
Nov-09 385,000 219 275,195 14 -109,805
Oct-09 372,400 238 292,500 18 -79,900
Sep-09 379,900 237 278,500 20 -101,400
Aug-09 372,450 248 212,500 14 -159,950
Jul-09 354,900 259 245,000 13 -109,900
Jun-09 357,975 254 262,000 13 -95,975
May-09 356,225 240 326,250 13 -29,975
Apr-09 378,450 250 207,000 4 -171,450
Mar-09 373,450 258 348,750 4 -24,700
Feb-09 384,990 231 295,000 7 -89,990
Jan-09 402,500 222 304,200 5 -98,300
Dec-08 425,000 235 252,500 4 -172,500
Clarus MarketMetrics® 2 of 2 01/18/2011
Information not guaranteed. © 2009-2010 Terradatum and its suppliers and licensors (www.terradatum.com/about/licensors.td).
www.TaylorRealEstateAustin.com | www.EarlyBirdAustin.com | Direct: 512.796.4447 | Fax: 512.628.7720 | 1701 Spyglass Dr. Ste. 8 Austin, TX 78746
4 of 20
- 5. Blake Taylor Austin Board of REALTORS
Sold Properties by Month
Dec-08 vs. Dec-10: The number of Sold properties is up 375%
Dec-08 vs. Dec-10
Dec-08 Dec-10 Change %
4 19 15 +375%
MLS: ACTRIS Period: 2 years (monthly) Price: All Construction Type: All Bedrooms: All Bathrooms: All Lot Size: All
Property Types: Residential: (House, Condo, Townhouse, Manufactured, Half Duplex, Mobile Home, Loft, Residential - Unknown) Sq Ft: All
MLS Areas: DT
Clarus MarketMetrics® 1 of 2 01/18/2011
Information not guaranteed. © 2009-2010 Terradatum and its suppliers and licensors (www.terradatum.com/about/licensors.td).
www.TaylorRealEstateAustin.com | www.EarlyBirdAustin.com | Direct: 512.796.4447 | Fax: 512.628.7720 | 1701 Spyglass Dr. Ste. 8 Austin, TX 78746
5 of 20
- 6. Blake Taylor Austin Board of REALTORS
Sold Properties by Month
Dec-08 vs. Dec-10: The number of Sold properties is up 375%
Full Market Bank Properties Non-Bank Properties
Time Period # Properties Median Price Average DOM # Properties % Bank Median Price # Properties % Non-Bank Median Price
Dec-10 19 300,000 96 1 5.3 180,200 18 94.7 301,500
Nov-10 12 267,500 119 0 12 100.0 267,500
Oct-10 8 382,500 74 0 8 100.0 382,500
Sep-10 13 229,890 106 2 15.4 158,076 11 84.6 235,000
Aug-10 16 278,450 57 1 6.2 310,000 15 93.8 274,900
Jul-10 15 305,092 70 0 15 100.0 305,092
Jun-10 18 315,196 100 2 11.1 298,000 16 88.9 315,196
May-10 25 250,000 115 1 4.0 187,000 24 96.0 259,000
Apr-10 15 264,800 114 1 6.7 101,000 14 93.3 277,400
Mar-10 20 419,450 122 2 10.0 201,750 18 90.0 445,000
Feb-10 8 266,000 50 0 8 100.0 266,000
Jan-10 6 281,140 127 1 16.7 266,000 5 83.3 296,280
Dec-09 8 323,750 59 0 8 100.0 323,750
Nov-09 14 275,195 91 1 7.1 291,000 13 92.9 272,000
Oct-09 18 292,500 140 3 16.7 327,400 15 83.3 290,000
Sep-09 20 278,500 62 0 20 100.0 278,500
Aug-09 14 212,500 57 1 7.1 220,000 13 92.9 212,500
Jul-09 13 245,000 85 0 13 100.0 245,000
Jun-09 13 262,000 91 1 7.7 198,000 12 92.3 296,000
May-09 13 326,250 56 0 13 100.0 326,250
Apr-09 4 207,000 69 2 50.0 207,000 2 50.0 242,500
Mar-09 4 348,750 107 0 4 100.0 348,750
Feb-09 7 295,000 126 0 7 100.0 295,000
Jan-09 5 304,200 77 0 5 100.0 304,200
Dec-08 4 252,500 88 0 4 100.0 252,500
Clarus MarketMetrics® 2 of 2 01/18/2011
Information not guaranteed. © 2009-2010 Terradatum and its suppliers and licensors (www.terradatum.com/about/licensors.td).
www.TaylorRealEstateAustin.com | www.EarlyBirdAustin.com | Direct: 512.796.4447 | Fax: 512.628.7720 | 1701 Spyglass Dr. Ste. 8 Austin, TX 78746
6 of 20
- 7. Blake Taylor Austin Board of REALTORS
Under Contract Properties by Month
Dec-08 vs. Dec-10: The number of Under Contract properties is up 260%
Dec-08 vs. Dec-10
Dec-08 Dec-10 Change %
5 18 13 +260%
MLS: ACTRIS Period: 2 years (monthly) Price: All Construction Type: All Bedrooms: All Bathrooms: All Lot Size: All
Property Types: Residential: (House, Condo, Townhouse, Manufactured, Half Duplex, Mobile Home, Loft, Residential - Unknown) Sq Ft: All
MLS Areas: DT
Clarus MarketMetrics® 1 of 2 01/18/2011
Information not guaranteed. © 2009-2010 Terradatum and its suppliers and licensors (www.terradatum.com/about/licensors.td).
www.TaylorRealEstateAustin.com | www.EarlyBirdAustin.com | Direct: 512.796.4447 | Fax: 512.628.7720 | 1701 Spyglass Dr. Ste. 8 Austin, TX 78746
7 of 20
- 8. Blake Taylor Austin Board of REALTORS
Under Contract Properties by Month
Dec-08 vs. Dec-10: The number of Under Contract properties is up 260%
Full Market Bank Properties Non-Bank Properties
Time Period # Properties Median Price Average DOM # Properties % Bank Median Price # Properties % Non-Bank Median Price
Dec-10 18 307,000 150 0 18 100.0 307,000
Nov-10 12 352,000 104 1 8.3 169,900 11 91.7 385,000
Oct-10 13 275,000 123 0 13 100.0 275,000
Sep-10 9 275,000 71 3 33.3 179,900 6 66.7 312,250
Aug-10 16 292,450 64 2 12.5 266,200 14 87.5 292,450
Jul-10 16 288,700 87 0 16 100.0 288,700
Jun-10 28 252,450 69 2 7.1 145,200 26 92.9 272,400
May-10 10 499,750 118 0 10 100.0 499,750
Apr-10 29 275,000 114 1 3.5 184,900 28 96.5 277,450
Mar-10 20 344,950 121 1 5.0 531,900 19 95.0 339,900
Feb-10 17 275,000 88 1 5.9 180,000 16 94.1 282,450
Jan-10 8 305,000 59 2 25.0 192,450 6 75.0 330,000
Dec-09 5 249,900 112 0 5 100.0 249,900
Nov-09 7 309,900 82 0 7 100.0 309,900
Oct-09 16 342,200 129 2 12.5 323,500 14 87.5 342,200
Sep-09 17 279,990 82 3 17.6 240,000 14 82.3 285,995
Aug-09 20 301,700 80 1 5.0 204,500 19 95.0 314,900
Jul-09 15 215,000 60 0 15 100.0 215,000
Jun-09 7 320,000 160 0 7 100.0 320,000
May-09 16 348,200 63 0 16 100.0 348,200
Apr-09 14 267,350 60 0 14 100.0 267,350
Mar-09 4 235,500 50 2 50.0 207,950 2 50.0 309,500
Feb-09 8 282,000 109 1 12.5 217,900 7 87.5 295,000
Jan-09 3 350,000 105 0 3 100.0 350,000
Dec-08 5 449,000 69 0 5 100.0 449,000
Clarus MarketMetrics® 2 of 2 01/18/2011
Information not guaranteed. © 2009-2010 Terradatum and its suppliers and licensors (www.terradatum.com/about/licensors.td).
www.TaylorRealEstateAustin.com | www.EarlyBirdAustin.com | Direct: 512.796.4447 | Fax: 512.628.7720 | 1701 Spyglass Dr. Ste. 8 Austin, TX 78746
8 of 20
- 9. Blake Taylor Austin Board of REALTORS
New Properties by Month
Dec-08 vs. Dec-10: The number of New properties is down 52%
Dec-08 vs. Dec-10
Dec-08 Dec-10 Change %
33 16 -17 -52%
MLS: ACTRIS Period: 2 years (monthly) Price: All Construction Type: All Bedrooms: All Bathrooms: All Lot Size: All
Property Types: Residential: (House, Condo, Townhouse, Manufactured, Half Duplex, Mobile Home, Loft, Residential - Unknown) Sq Ft: All
MLS Areas: DT
Clarus MarketMetrics® 1 of 2 01/18/2011
Information not guaranteed. © 2009-2010 Terradatum and its suppliers and licensors (www.terradatum.com/about/licensors.td).
www.TaylorRealEstateAustin.com | www.EarlyBirdAustin.com | Direct: 512.796.4447 | Fax: 512.628.7720 | 1701 Spyglass Dr. Ste. 8 Austin, TX 78746
9 of 20
- 10. Blake Taylor Austin Board of REALTORS
New Properties by Month
Dec-08 vs. Dec-10: The number of New properties is down 52%
Full Market Bank Properties Non-Bank Properties
Time Period # Properties Median Price # Properties % Bank Median Price # Properties % Non-Bank Median Price
Dec-10 16 367,000 0 16 100.0 367,000
Nov-10 18 351,950 0 18 100.0 351,950
Oct-10 26 379,500 0 26 100.0 379,500
Sep-10 27 379,900 1 3.7 169,900 26 96.3 389,450
Aug-10 30 368,500 2 6.7 266,200 28 93.3 369,450
Jul-10 42 325,950 1 2.4 189,900 41 97.6 326,900
Jun-10 63 289,900 2 3.2 154,900 61 96.8 299,000
May-10 43 349,900 1 2.3 332,500 42 97.7 352,400
Apr-10 50 262,500 0 50 100.0 262,500
Mar-10 46 312,450 2 4.3 191,950 44 95.7 322,450
Feb-10 41 339,900 0 41 100.0 339,900
Jan-10 39 309,900 0 39 100.0 309,900
Dec-09 26 327,500 1 3.9 99,900 25 96.2 330,000
Nov-09 31 399,900 1 3.2 531,900 30 96.8 372,850
Oct-09 50 317,000 4 8.0 237,750 46 92.0 321,750
Sep-09 33 299,000 1 3.0 99,899 32 97.0 322,850
Aug-09 32 349,750 3 9.4 314,900 29 90.6 365,000
Jul-09 42 294,300 2 4.8 237,250 40 95.2 302,475
Jun-09 52 349,700 2 3.9 441,750 50 96.2 348,750
May-09 44 326,950 1 2.3 240,000 43 97.7 328,900
Apr-09 38 309,700 1 2.6 195,000 37 97.4 319,500
Mar-09 54 335,548 1 1.9 193,900 53 98.2 345,000
Feb-09 40 334,750 2 5.0 222,000 38 95.0 345,750
Jan-09 41 350,000 1 2.4 199,900 40 97.6 350,000
Dec-08 33 372,000 1 3.0 217,900 32 97.0 374,500
Clarus MarketMetrics® 2 of 2 01/18/2011
Information not guaranteed. © 2009-2010 Terradatum and its suppliers and licensors (www.terradatum.com/about/licensors.td).
www.TaylorRealEstateAustin.com | www.EarlyBirdAustin.com | Direct: 512.796.4447 | Fax: 512.628.7720 | 1701 Spyglass Dr. Ste. 8 Austin, TX 78746
10 of 20
- 11. Blake Taylor Austin Board of REALTORS
For Sale Properties by Month
Dec-08 vs. Dec-10: The number of For Sale properties is down 38%
Dec-08 vs. Dec-10
Dec-08 Dec-10 Change %
235 145 -90 -38%
MLS: ACTRIS Period: 2 years (monthly) Price: All Construction Type: All Bedrooms: All Bathrooms: All Lot Size: All
Property Types: Residential: (House, Condo, Townhouse, Manufactured, Half Duplex, Mobile Home, Loft, Residential - Unknown) Sq Ft: All
MLS Areas: DT
Clarus MarketMetrics® 1 of 2 01/18/2011
Information not guaranteed. © 2009-2010 Terradatum and its suppliers and licensors (www.terradatum.com/about/licensors.td).
www.TaylorRealEstateAustin.com | www.EarlyBirdAustin.com | Direct: 512.796.4447 | Fax: 512.628.7720 | 1701 Spyglass Dr. Ste. 8 Austin, TX 78746
11 of 20
- 12. Blake Taylor Austin Board of REALTORS
For Sale Properties by Month
Dec-08 vs. Dec-10: The number of For Sale properties is down 38%
Full Market Bank Properties Non-Bank Properties
Time Period # Properties Median Price Average DOM # Properties % Bank Median Price # Properties % Non-Bank Median Price
Dec-10 145 370,000 152 1 0.7 199,000 144 99.3 370,000
Nov-10 168 369,450 160 2 1.2 184,450 166 98.8 369,950
Oct-10 187 360,000 166 2 1.1 184,450 185 98.9 368,000
Sep-10 206 332,250 168 5 2.4 179,900 201 97.6 347,500
Aug-10 207 326,900 172 7 3.4 199,000 200 96.6 332,200
Jul-10 226 325,000 171 5 2.2 189,900 221 97.8 325,000
Jun-10 244 319,945 162 6 2.5 185,200 238 97.5 322,450
May-10 220 325,000 176 5 2.3 199,000 215 97.7 325,000
Apr-10 253 325,000 209 5 2.0 190,500 248 98.0 329,750
Mar-10 244 354,450 213 6 2.5 194,750 238 97.5 361,750
Feb-10 228 367,000 221 5 2.2 190,500 223 97.8 369,900
Jan-10 217 365,000 226 7 3.2 190,500 210 96.8 377,450
Dec-09 217 385,000 232 7 3.2 190,500 210 96.8 396,250
Nov-09 219 385,000 229 7 3.2 220,000 212 96.8 392,000
Oct-09 238 372,400 221 9 3.8 285,000 229 96.2 385,000
Sep-09 237 379,900 229 8 3.4 277,450 229 96.6 385,000
Aug-09 248 372,450 223 8 3.2 277,450 240 96.8 379,900
Jul-09 259 354,900 221 6 2.3 255,000 253 97.7 359,900
Jun-09 254 357,975 238 5 2.0 240,000 249 98.0 359,900
May-09 240 356,225 241 3 1.2 199,900 237 98.8 359,900
Apr-09 250 378,450 231 2 0.8 197,450 248 99.2 380,950
Mar-09 258 373,450 221 3 1.2 199,900 255 98.8 377,000
Feb-09 231 384,990 236 5 2.2 222,000 226 97.8 399,450
Jan-09 222 402,500 246 3 1.4 217,900 219 98.7 410,000
Dec-08 235 425,000 257 3 1.3 222,000 232 98.7 434,250
Clarus MarketMetrics® 2 of 2 01/18/2011
Information not guaranteed. © 2009-2010 Terradatum and its suppliers and licensors (www.terradatum.com/about/licensors.td).
www.TaylorRealEstateAustin.com | www.EarlyBirdAustin.com | Direct: 512.796.4447 | Fax: 512.628.7720 | 1701 Spyglass Dr. Ste. 8 Austin, TX 78746
12 of 20
- 13. Blake Taylor Austin Board of REALTORS
Expired Properties by Month
Dec-08 vs. Dec-10: The number of Expired properties is down 39%
Dec-08 vs. Dec-10
Dec-08 Dec-10 Change %
49 30 -19 -39%
MLS: ACTRIS Period: 2 years (monthly) Price: All Construction Type: All Bedrooms: All Bathrooms: All Lot Size: All
Property Types: Residential: (House, Condo, Townhouse, Manufactured, Half Duplex, Mobile Home, Loft, Residential - Unknown) Sq Ft: All
MLS Areas: DT
Clarus MarketMetrics® 1 of 2 01/18/2011
Information not guaranteed. © 2009-2010 Terradatum and its suppliers and licensors (www.terradatum.com/about/licensors.td).
www.TaylorRealEstateAustin.com | www.EarlyBirdAustin.com | Direct: 512.796.4447 | Fax: 512.628.7720 | 1701 Spyglass Dr. Ste. 8 Austin, TX 78746
13 of 20
- 14. Blake Taylor Austin Board of REALTORS
Expired Properties by Month
Dec-08 vs. Dec-10: The number of Expired properties is down 39%
Full Market Bank Properties Non-Bank Properties
Time Period # Properties Median Price Average DOM # Properties % Bank Median Price # Properties % Non-Bank Median Price
Dec-10 30 433,500 160 0 30 100.0 433,500
Nov-10 27 369,000 150 0 27 100.0 369,000
Oct-10 24 347,450 155 0 24 100.0 347,450
Sep-10 36 322,500 135 0 36 100.0 322,500
Aug-10 12 333,750 184 1 8.3 332,500 11 91.7 335,000
Jul-10 33 349,777 119 0 33 100.0 349,777
Jun-10 32 471,750 123 0 32 100.0 471,750
May-10 29 315,000 122 1 3.5 220,000 28 96.5 322,500
Apr-10 47 485,000 336 0 47 100.0 485,000
Mar-10 21 449,900 120 0 21 100.0 449,900
Feb-10 13 405,000 135 0 13 100.0 405,000
Jan-10 22 329,450 159 0 22 100.0 329,450
Dec-09 34 372,450 160 0 34 100.0 372,450
Nov-09 21 349,990 104 1 4.8 499,900 20 95.2 339,445
Oct-09 34 384,200 137 1 2.9 314,900 33 97.1 398,500
Sep-09 32 381,950 211 0 32 100.0 381,950
Aug-09 24 330,950 137 0 24 100.0 330,950
Jul-09 28 339,950 170 1 3.6 270,000 27 96.4 350,000
Jun-09 30 325,000 196 1 3.3 199,900 29 96.7 330,000
May-09 22 339,950 130 0 22 100.0 339,950
Apr-09 40 370,250 128 0 40 100.0 370,250
Mar-09 42 317,848 94 0 42 100.0 317,848
Feb-09 19 384,990 117 2 10.5 222,000 17 89.5 399,000
Jan-09 28 477,300 177 0 28 100.0 477,300
Dec-08 49 449,999 212 1 2.0 349,900 48 98.0 452,500
Clarus MarketMetrics® 2 of 2 01/18/2011
Information not guaranteed. © 2009-2010 Terradatum and its suppliers and licensors (www.terradatum.com/about/licensors.td).
www.TaylorRealEstateAustin.com | www.EarlyBirdAustin.com | Direct: 512.796.4447 | Fax: 512.628.7720 | 1701 Spyglass Dr. Ste. 8 Austin, TX 78746
14 of 20
- 15. Blake Taylor Austin Board of REALTORS
Supply & Demand by Month
Dec-08 vs. Dec-10: The number of for sale properties is down 38% and the number of sold properties is up 375%
Dec-08 vs. Dec-10 Dec-08 vs. Dec-10
Dec-08 Dec-10 Change % Dec-08 Dec-10 Change %
235 145 -90 -38% 4 19 15 +375%
MLS: ACTRIS Period: 2 years (monthly) Price: All Construction Type: All Bedrooms: All Bathrooms: All Lot Size: All
Property Types: Residential: (House, Condo, Townhouse, Manufactured, Half Duplex, Mobile Home, Loft, Residential - Unknown) Sq Ft: All
MLS Areas: DT
Clarus MarketMetrics® 1 of 2 01/18/2011
Information not guaranteed. © 2009-2010 Terradatum and its suppliers and licensors (www.terradatum.com/about/licensors.td).
www.TaylorRealEstateAustin.com | www.EarlyBirdAustin.com | Direct: 512.796.4447 | Fax: 512.628.7720 | 1701 Spyglass Dr. Ste. 8 Austin, TX 78746
15 of 20
- 16. Blake Taylor Austin Board of REALTORS
Supply & Demand by Month
Dec-08 vs. Dec-10: The number of for sale properties is down 38% and the number of sold properties is up 375%
# Properties Average DOM # Properties Average DOM
Time Period For Sale For Sale Sold Sold
Dec-10 145 152 19 96
Nov-10 168 160 12 119
Oct-10 187 166 8 74
Sep-10 206 168 13 106
Aug-10 207 172 16 57
Jul-10 226 171 15 70
Jun-10 244 162 18 100
May-10 220 176 25 115
Apr-10 253 209 15 114
Mar-10 244 213 20 122
Feb-10 228 221 8 50
Jan-10 217 226 6 127
Dec-09 217 232 8 59
Nov-09 219 229 14 91
Oct-09 238 221 18 140
Sep-09 237 229 20 62
Aug-09 248 223 14 57
Jul-09 259 221 13 85
Jun-09 254 238 13 91
May-09 240 241 13 56
Apr-09 250 231 4 69
Mar-09 258 221 4 107
Feb-09 231 236 7 126
Jan-09 222 246 5 77
Dec-08 235 257 4 88
Clarus MarketMetrics® 2 of 2 01/18/2011
Information not guaranteed. © 2009-2010 Terradatum and its suppliers and licensors (www.terradatum.com/about/licensors.td).
www.TaylorRealEstateAustin.com | www.EarlyBirdAustin.com | Direct: 512.796.4447 | Fax: 512.628.7720 | 1701 Spyglass Dr. Ste. 8 Austin, TX 78746
16 of 20
- 17. Blake Taylor Austin Board of REALTORS
The Average Days on Market by Month
Dec-08 vs. Dec-10: The average days on market is up 118%
Dec-08 vs. Dec-10
Dec-08 Dec-10 Change %
69 150 81 +118%
MLS: ACTRIS Period: 2 years (monthly) Price: All Construction Type: All Bedrooms: All Bathrooms: All Lot Size: All
Property Types: Residential: (House, Condo, Townhouse, Manufactured, Half Duplex, Mobile Home, Loft, Residential - Unknown) Sq Ft: All
MLS Areas: DT
Clarus MarketMetrics® 1 of 2 01/18/2011
Information not guaranteed. © 2009-2010 Terradatum and its suppliers and licensors (www.terradatum.com/about/licensors.td).
www.TaylorRealEstateAustin.com | www.EarlyBirdAustin.com | Direct: 512.796.4447 | Fax: 512.628.7720 | 1701 Spyglass Dr. Ste. 8 Austin, TX 78746
17 of 20
- 18. Blake Taylor Austin Board of REALTORS
The Average Days on Market by Month
Dec-08 vs. Dec-10: The average days on market is up 118%
Time Period Average DOM # UC Units
Dec-10 150 18
Nov-10 104 12
Oct-10 123 13
Sep-10 71 9
Aug-10 64 16
Jul-10 87 16
Jun-10 69 28
May-10 118 10
Apr-10 114 29
Mar-10 121 20
Feb-10 88 17
Jan-10 59 8
Dec-09 112 5
Nov-09 82 7
Oct-09 129 16
Sep-09 82 17
Aug-09 80 20
Jul-09 60 15
Jun-09 160 7
May-09 63 16
Apr-09 60 14
Mar-09 50 4
Feb-09 109 8
Jan-09 105 3
Dec-08 69 5
Clarus MarketMetrics® 2 of 2 01/18/2011
Information not guaranteed. © 2009-2010 Terradatum and its suppliers and licensors (www.terradatum.com/about/licensors.td).
www.TaylorRealEstateAustin.com | www.EarlyBirdAustin.com | Direct: 512.796.4447 | Fax: 512.628.7720 | 1701 Spyglass Dr. Ste. 8 Austin, TX 78746
18 of 20
- 19. Blake Taylor Austin Board of REALTORS
Months Supply of Inventory
Dec-08 vs. Dec-10: The average months supply of inventory is down 85%
Dec-08 vs. Dec-10
Dec-08 Dec-10 Change %
36.2 5.4 -30.8 -85%
MLS: ACTRIS Period: 2 years (monthly) Price: All Construction Type: All Bedrooms: All Bathrooms: All Lot Size: All
Property Types: Residential: (House, Condo, Townhouse, Manufactured, Half Duplex, Mobile Home, Loft, Residential - Unknown) Sq Ft: All
MLS Areas: DT
Clarus MarketMetrics® 1 of 2 01/18/2011
Information not guaranteed. © 2009-2010 Terradatum and its suppliers and licensors (www.terradatum.com/about/licensors.td).
www.TaylorRealEstateAustin.com | www.EarlyBirdAustin.com | Direct: 512.796.4447 | Fax: 512.628.7720 | 1701 Spyglass Dr. Ste. 8 Austin, TX 78746
19 of 20
- 20. Blake Taylor Austin Board of REALTORS
Months Supply of Inventory
Dec-08 vs. Dec-10: The average months supply of inventory is down 85%
# Units For Sale # UC Units UC Average
Time Period Last Day of Month During Month MSI DOM
Dec-10 97 18 5.4 150
Nov-10 129 12 10.8 104
Oct-10 150 13 11.5 123
Sep-10 161 9 17.9 71
Aug-10 179 16 11.2 64
Jul-10 177 16 11.1 87
Jun-10 184 28 6.6 69
May-10 181 10 18.1 118
Apr-10 177 29 6.1 114
Mar-10 203 20 10.2 121
Feb-10 198 17 11.6 88
Jan-10 187 8 23.4 59
Dec-09 178 5 35.6 112
Nov-09 191 7 27.3 82
Oct-09 188 16 11.8 129
Sep-09 188 17 11.1 82
Aug-09 204 20 10.2 80
Jul-09 216 15 14.4 60
Jun-09 217 7 31.0 160
May-09 202 16 12.6 63
Apr-09 196 14 14.0 60
Mar-09 212 4 53.0 50
Feb-09 204 8 25.5 109
Jan-09 191 3 63.7 105
Dec-08 181 5 36.2 69
Clarus MarketMetrics® 2 of 2 01/18/2011
Information not guaranteed. © 2009-2010 Terradatum and its suppliers and licensors (www.terradatum.com/about/licensors.td).
www.TaylorRealEstateAustin.com | www.EarlyBirdAustin.com | Direct: 512.796.4447 | Fax: 512.628.7720 | 1701 Spyglass Dr. Ste. 8 Austin, TX 78746
20 of 20