More Related Content
Similar to 1 a, nw hills, highland park, cat mountain (12)
1 a, nw hills, highland park, cat mountain
- 1. Blake Taylor Taylor Real Estate
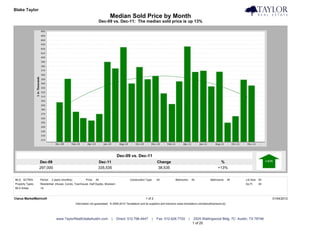
Median Sold Price by Month
Dec-09 vs. Dec-11: The median sold price is up 13%
Dec-09 vs. Dec-11
Dec-09 Dec-11 Change %
297,000 335,535 38,535 +13%
MLS: ACTRIS Period: 2 years (monthly) Price: All Construction Type: All Bedrooms: All Bathrooms: All Lot Size: All
Property Types: Residential: (House, Condo, Townhouse, Half Duplex, Modular) Sq Ft: All
MLS Areas: 1A
Clarus MarketMetrics® 1 of 2 01/04/2012
Information not guaranteed. © 2009-2010 Terradatum and its suppliers and licensors (www.terradatum.com/about/licensors.td).
www.TaylorRealEstateAustin.com | Direct: 512.796.4447 | Fax: 512.628.7720 | 2525 Wallingwood Bldg. 7C Austin, TX 78746
1 of 20
- 2. Blake Taylor Taylor Real Estate
Median Sold Price by Month
Dec-09 vs. Dec-11: The median sold price is up 13%
Time Period Median Price # Units Average DOM
Dec-11 335,535 31 49
Nov-11 349,000 25 53
Oct-11 264,950 20 41
Sep-11 250,000 30 80
Aug-11 367,250 24 79
Jul-11 333,500 45 87
Jun-11 369,500 45 55
May-11 366,750 36 54
Apr-11 425,444 30 53
Mar-11 345,000 33 101
Feb-11 293,000 26 59
Jan-11 317,500 18 86
Dec-10 357,635 24 79
Nov-10 350,000 23 62
Oct-10 378,000 24 66
Sep-10 340,200 20 57
Aug-10 423,750 32 83
Jul-10 374,750 28 55
Jun-10 390,000 37 55
May-10 270,000 25 49
Apr-10 255,000 37 67
Mar-10 260,650 35 65
Feb-10 275,000 25 68
Jan-10 351,000 13 49
Dec-09 297,000 20 85
Clarus MarketMetrics® 2 of 2 01/04/2012
Information not guaranteed. © 2009-2010 Terradatum and its suppliers and licensors (www.terradatum.com/about/licensors.td).
www.TaylorRealEstateAustin.com | Direct: 512.796.4447 | Fax: 512.628.7720 | 2525 Wallingwood Bldg. 7C Austin, TX 78746
2 of 20
- 3. Blake Taylor Taylor Real Estate
Median For Sale vs. Median Sold
Dec-09 vs. Dec-11: The median price of for sale properties is down 14% and the median price of sold properties is up 13%
Dec-09 vs. Dec-11 Dec-09 vs. Dec-11
Dec-09 Dec-11 Change % Dec-09 Dec-11 Change %
325,000 279,000 -46,000 -14% 297,000 335,535 38,535 +13%
MLS: ACTRIS Period: 2 years (monthly) Price: All Construction Type: All Bedrooms: All Bathrooms: All Lot Size: All
Property Types: Residential: (House, Condo, Townhouse, Half Duplex, Modular) Sq Ft: All
MLS Areas: 1A
Clarus MarketMetrics® 1 of 2 01/04/2012
Information not guaranteed. © 2009-2010 Terradatum and its suppliers and licensors (www.terradatum.com/about/licensors.td).
www.TaylorRealEstateAustin.com | Direct: 512.796.4447 | Fax: 512.628.7720 | 2525 Wallingwood Bldg. 7C Austin, TX 78746
3 of 20
- 4. Blake Taylor Taylor Real Estate
Median For Sale vs. Median Sold
Dec-09 vs. Dec-11: The median price of for sale properties is down 14% and the median price of sold properties is up 13%
For Sale # Properties Sold # Properties Price
Time Period Median For Sale Median Sold Difference
Dec-11 279,000 129 335,535 31 56,535
Nov-11 360,000 159 349,000 25 -11,000
Oct-11 300,000 170 264,950 20 -35,050
Sep-11 347,450 176 250,000 30 -97,450
Aug-11 282,000 192 367,250 24 85,250
Jul-11 299,500 209 333,500 45 34,000
Jun-11 329,000 239 369,500 45 40,500
May-11 345,000 247 366,750 36 21,750
Apr-11 329,000 233 425,444 30 96,444
Mar-11 339,950 204 345,000 33 5,050
Feb-11 337,450 172 293,000 26 -44,450
Jan-11 307,000 177 317,500 18 10,500
Dec-10 325,000 197 357,635 24 32,635
Nov-10 342,450 244 350,000 23 7,550
Oct-10 349,900 258 378,000 24 28,100
Sep-10 355,000 265 340,200 20 -14,800
Aug-10 349,900 259 423,750 32 73,850
Jul-10 354,000 275 374,750 28 20,750
Jun-10 359,450 258 390,000 37 30,550
May-10 364,900 249 270,000 25 -94,900
Apr-10 374,450 238 255,000 37 -119,450
Mar-10 312,495 208 260,650 35 -51,845
Feb-10 264,900 171 275,000 25 10,100
Jan-10 262,450 166 351,000 13 88,550
Dec-09 325,000 167 297,000 20 -28,000
Clarus MarketMetrics® 2 of 2 01/04/2012
Information not guaranteed. © 2009-2010 Terradatum and its suppliers and licensors (www.terradatum.com/about/licensors.td).
www.TaylorRealEstateAustin.com | Direct: 512.796.4447 | Fax: 512.628.7720 | 2525 Wallingwood Bldg. 7C Austin, TX 78746
4 of 20
- 5. Blake Taylor Taylor Real Estate
Sold Properties by Month
Dec-09 vs. Dec-11: The number of Sold properties is up 55%
Dec-09 vs. Dec-11
Dec-09 Dec-11 Change %
20 31 11 +55%
MLS: ACTRIS Period: 2 years (monthly) Price: All Construction Type: All Bedrooms: All Bathrooms: All Lot Size: All
Property Types: Residential: (House, Condo, Townhouse, Half Duplex, Modular) Sq Ft: All
MLS Areas: 1A
Clarus MarketMetrics® 1 of 2 01/04/2012
Information not guaranteed. © 2009-2010 Terradatum and its suppliers and licensors (www.terradatum.com/about/licensors.td).
www.TaylorRealEstateAustin.com | Direct: 512.796.4447 | Fax: 512.628.7720 | 2525 Wallingwood Bldg. 7C Austin, TX 78746
5 of 20
- 6. Blake Taylor Taylor Real Estate
Sold Properties by Month
Dec-09 vs. Dec-11: The number of Sold properties is up 55%
Full Market Bank Properties Non-Bank Properties
Time Period # Properties Median Price Average DOM # Properties % Bank Median Price # Properties % Non-Bank Median Price
Dec-11 31 335,535 49 1 3.2 136,000 30 96.8 345,268
Nov-11 25 349,000 53 0 25 100.0 349,000
Oct-11 20 264,950 41 1 5.0 73,000 19 95.0 279,900
Sep-11 30 250,000 80 2 6.7 208,350 28 93.3 250,000
Aug-11 24 367,250 79 1 4.2 338,000 23 95.8 370,000
Jul-11 45 333,500 87 4 8.9 113,825 41 91.1 336,500
Jun-11 45 369,500 55 1 2.2 346,900 44 97.8 372,886
May-11 36 366,750 54 0 36 100.0 366,750
Apr-11 30 425,444 53 1 3.3 112,000 29 96.7 435,000
Mar-11 33 345,000 101 4 12.1 123,750 29 87.9 374,800
Feb-11 26 293,000 59 1 3.9 300,000 25 96.2 286,000
Jan-11 18 317,500 86 1 5.6 151,330 17 94.4 320,000
Dec-10 24 357,635 79 0 24 100.0 357,635
Nov-10 23 350,000 62 1 4.3 147,000 22 95.7 350,000
Oct-10 24 378,000 66 0 24 100.0 378,000
Sep-10 20 340,200 57 0 20 100.0 340,200
Aug-10 32 423,750 83 0 32 100.0 423,750
Jul-10 28 374,750 55 0 28 100.0 374,750
Jun-10 37 390,000 55 2 5.4 414,200 35 94.6 390,000
May-10 25 270,000 49 0 25 100.0 270,000
Apr-10 37 255,000 67 1 2.7 84,900 36 97.3 282,000
Mar-10 35 260,650 65 0 35 100.0 260,650
Feb-10 25 275,000 68 1 4.0 106,000 24 96.0 282,000
Jan-10 13 351,000 49 1 7.7 351,000 12 92.3 367,500
Dec-09 20 297,000 85 1 5.0 245,500 19 95.0 310,000
Clarus MarketMetrics® 2 of 2 01/04/2012
Information not guaranteed. © 2009-2010 Terradatum and its suppliers and licensors (www.terradatum.com/about/licensors.td).
www.TaylorRealEstateAustin.com | Direct: 512.796.4447 | Fax: 512.628.7720 | 2525 Wallingwood Bldg. 7C Austin, TX 78746
6 of 20
- 7. Blake Taylor Taylor Real Estate
Under Contract Properties by Month
Dec-09 vs. Dec-11: The number of Under Contract properties is up 69%
Dec-09 vs. Dec-11
Dec-09 Dec-11 Change %
16 27 11 +69%
MLS: ACTRIS Period: 2 years (monthly) Price: All Construction Type: All Bedrooms: All Bathrooms: All Lot Size: All
Property Types: Residential: (House, Condo, Townhouse, Half Duplex, Modular) Sq Ft: All
MLS Areas: 1A
Clarus MarketMetrics® 1 of 2 01/04/2012
Information not guaranteed. © 2009-2010 Terradatum and its suppliers and licensors (www.terradatum.com/about/licensors.td).
www.TaylorRealEstateAustin.com | Direct: 512.796.4447 | Fax: 512.628.7720 | 2525 Wallingwood Bldg. 7C Austin, TX 78746
7 of 20
- 8. Blake Taylor Taylor Real Estate
Under Contract Properties by Month
Dec-09 vs. Dec-11: The number of Under Contract properties is up 69%
Full Market Bank Properties Non-Bank Properties
Time Period # Properties Median Price Average DOM # Properties % Bank Median Price # Properties % Non-Bank Median Price
Dec-11 27 329,000 53 1 3.7 82,500 26 96.3 339,000
Nov-11 33 399,000 54 1 3.0 300,000 32 97.0 399,000
Oct-11 25 349,900 42 1 4.0 142,500 24 96.0 349,950
Sep-11 23 299,000 49 1 4.3 112,000 22 95.7 322,000
Aug-11 25 219,900 83 3 12.0 89,900 22 88.0 221,350
Jul-11 41 330,000 85 1 2.4 349,900 40 97.6 327,500
Jun-11 40 347,450 76 2 5.0 114,950 38 95.0 354,450
May-11 44 394,500 57 3 6.8 159,900 41 93.2 459,000
Apr-11 32 334,950 50 0 32 100.0 334,950
Mar-11 35 435,000 57 1 2.9 110,000 34 97.1 439,500
Feb-11 31 354,000 74 4 12.9 121,950 27 87.1 368,000
Jan-11 21 325,900 84 1 4.8 307,000 20 95.2 350,450
Dec-10 20 282,000 82 1 5.0 149,900 19 95.0 325,000
Nov-10 24 348,750 75 0 24 100.0 348,750
Oct-10 24 349,900 76 1 4.2 147,000 23 95.8 349,900
Sep-10 21 365,000 63 0 21 100.0 365,000
Aug-10 19 399,000 67 0 19 100.0 399,000
Jul-10 32 392,000 65 0 32 100.0 392,000
Jun-10 28 367,000 82 0 28 100.0 367,000
May-10 32 394,700 38 1 3.1 324,900 31 96.9 399,900
Apr-10 36 379,950 53 1 2.8 453,800 35 97.2 379,900
Mar-10 39 245,000 76 0 39 100.0 245,000
Feb-10 29 339,006 51 1 3.5 84,900 28 96.5 344,003
Jan-10 27 240,000 73 1 3.7 109,500 26 96.3 247,000
Dec-09 16 318,000 91 2 12.5 309,450 14 87.5 318,000
Clarus MarketMetrics® 2 of 2 01/04/2012
Information not guaranteed. © 2009-2010 Terradatum and its suppliers and licensors (www.terradatum.com/about/licensors.td).
www.TaylorRealEstateAustin.com | Direct: 512.796.4447 | Fax: 512.628.7720 | 2525 Wallingwood Bldg. 7C Austin, TX 78746
8 of 20
- 9. Blake Taylor Taylor Real Estate
New Properties by Month
Dec-09 vs. Dec-11: The number of New properties is up 4%
Dec-09 vs. Dec-11
Dec-09 Dec-11 Change %
24 25 1 +4%
MLS: ACTRIS Period: 2 years (monthly) Price: All Construction Type: All Bedrooms: All Bathrooms: All Lot Size: All
Property Types: Residential: (House, Condo, Townhouse, Half Duplex, Modular) Sq Ft: All
MLS Areas: 1A
Clarus MarketMetrics® 1 of 2 01/04/2012
Information not guaranteed. © 2009-2010 Terradatum and its suppliers and licensors (www.terradatum.com/about/licensors.td).
www.TaylorRealEstateAustin.com | Direct: 512.796.4447 | Fax: 512.628.7720 | 2525 Wallingwood Bldg. 7C Austin, TX 78746
9 of 20
- 10. Blake Taylor Taylor Real Estate
New Properties by Month
Dec-09 vs. Dec-11: The number of New properties is up 4%
Full Market Bank Properties Non-Bank Properties
Time Period # Properties Median Price # Properties % Bank Median Price # Properties % Non-Bank Median Price
Dec-11 25 329,000 1 4.0 105,000 24 96.0 339,500
Nov-11 35 425,000 1 2.9 300,000 34 97.1 430,000
Oct-11 43 289,900 3 7.0 142,500 40 93.0 302,500
Sep-11 36 383,950 0 36 100.0 383,950
Aug-11 44 279,950 3 6.8 112,000 41 93.2 300,000
Jul-11 38 216,700 0 38 100.0 216,700
Jun-11 58 344,900 2 3.5 219,900 56 96.5 344,900
May-11 54 424,500 1 1.9 304,900 53 98.2 425,000
Apr-11 75 349,900 3 4.0 100,000 72 96.0 357,400
Mar-11 78 331,950 2 2.6 247,400 76 97.4 334,500
Feb-11 37 354,000 0 37 100.0 354,000
Jan-11 41 249,900 4 9.8 114,900 37 90.2 265,000
Dec-10 18 292,450 2 11.1 101,250 16 88.9 307,450
Nov-10 40 257,000 0 40 100.0 257,000
Oct-10 46 353,900 1 2.2 94,900 45 97.8 362,800
Sep-10 59 400,000 3 5.1 149,900 56 94.9 400,000
Aug-10 39 349,000 1 2.6 147,000 38 97.4 349,500
Jul-10 72 332,000 0 72 100.0 332,000
Jun-10 58 345,000 2 3.5 131,450 56 96.5 357,450
May-10 59 399,000 1 1.7 324,900 58 98.3 399,450
Apr-10 90 399,450 2 2.2 114,500 88 97.8 399,900
Mar-10 76 366,950 3 4.0 450,000 73 96.0 364,900
Feb-10 48 269,950 3 6.2 179,900 45 93.8 275,000
Jan-10 43 253,000 2 4.7 138,500 41 95.3 275,000
Dec-09 24 179,400 1 4.2 359,900 23 95.8 168,900
Clarus MarketMetrics® 2 of 2 01/04/2012
Information not guaranteed. © 2009-2010 Terradatum and its suppliers and licensors (www.terradatum.com/about/licensors.td).
www.TaylorRealEstateAustin.com | Direct: 512.796.4447 | Fax: 512.628.7720 | 2525 Wallingwood Bldg. 7C Austin, TX 78746
10 of 20
- 11. Blake Taylor Taylor Real Estate
For Sale Properties by Month
Dec-09 vs. Dec-11: The number of For Sale properties is down 23%
Dec-09 vs. Dec-11
Dec-09 Dec-11 Change %
167 129 -38 -23%
MLS: ACTRIS Period: 2 years (monthly) Price: All Construction Type: All Bedrooms: All Bathrooms: All Lot Size: All
Property Types: Residential: (House, Condo, Townhouse, Half Duplex, Modular) Sq Ft: All
MLS Areas: 1A
Clarus MarketMetrics® 1 of 2 01/04/2012
Information not guaranteed. © 2009-2010 Terradatum and its suppliers and licensors (www.terradatum.com/about/licensors.td).
www.TaylorRealEstateAustin.com | Direct: 512.796.4447 | Fax: 512.628.7720 | 2525 Wallingwood Bldg. 7C Austin, TX 78746
11 of 20
- 12. Blake Taylor Taylor Real Estate
For Sale Properties by Month
Dec-09 vs. Dec-11: The number of For Sale properties is down 23%
Full Market Bank Properties Non-Bank Properties
Time Period # Properties Median Price Average DOM # Properties % Bank Median Price # Properties % Non-Bank Median Price
Dec-11 129 279,000 104 7 5.4 105,000 122 94.6 287,000
Nov-11 159 360,000 102 7 4.4 124,900 152 95.6 364,500
Oct-11 170 300,000 99 7 4.1 124,900 163 95.9 315,000
Sep-11 176 347,450 97 5 2.8 112,000 171 97.2 350,000
Aug-11 192 282,000 101 9 4.7 100,000 183 95.3 299,000
Jul-11 209 299,500 100 7 3.4 100,000 202 96.7 304,500
Jun-11 239 329,000 98 9 3.8 104,900 230 96.2 336,750
May-11 247 345,000 93 10 4.0 114,900 237 96.0 354,900
Apr-11 233 329,000 88 9 3.9 104,900 224 96.1 339,950
Mar-11 204 339,950 93 7 3.4 110,000 197 96.6 349,000
Feb-11 172 337,450 110 9 5.2 104,900 163 94.8 349,000
Jan-11 177 307,000 114 10 5.7 107,450 167 94.3 325,000
Dec-10 197 325,000 115 7 3.5 110,000 190 96.5 337,450
Nov-10 244 342,450 106 5 2.0 149,900 239 98.0 347,500
Oct-10 258 349,900 104 7 2.7 147,000 251 97.3 350,000
Sep-10 265 355,000 101 7 2.6 147,000 258 97.4 359,000
Aug-10 259 349,900 99 8 3.1 144,950 251 96.9 350,000
Jul-10 275 354,000 88 7 2.5 142,900 268 97.5 359,000
Jun-10 258 359,450 90 8 3.1 150,450 250 96.9 369,450
May-10 249 364,900 83 8 3.2 171,900 241 96.8 375,000
Apr-10 238 374,450 73 9 3.8 179,900 229 96.2 379,900
Mar-10 208 312,495 88 8 3.9 243,450 200 96.2 317,000
Feb-10 171 264,900 99 6 3.5 160,950 165 96.5 275,000
Jan-10 166 262,450 108 4 2.4 138,500 162 97.6 274,992
Dec-09 167 325,000 124 4 2.4 211,450 163 97.6 325,000
Clarus MarketMetrics® 2 of 2 01/04/2012
Information not guaranteed. © 2009-2010 Terradatum and its suppliers and licensors (www.terradatum.com/about/licensors.td).
www.TaylorRealEstateAustin.com | Direct: 512.796.4447 | Fax: 512.628.7720 | 2525 Wallingwood Bldg. 7C Austin, TX 78746
12 of 20
- 13. Blake Taylor Taylor Real Estate
Expired Properties by Month
Dec-09 vs. Dec-11: The number of Expired properties is down 21%
Dec-09 vs. Dec-11
Dec-09 Dec-11 Change %
28 22 -6 -21%
MLS: ACTRIS Period: 2 years (monthly) Price: All Construction Type: All Bedrooms: All Bathrooms: All Lot Size: All
Property Types: Residential: (House, Condo, Townhouse, Half Duplex, Modular) Sq Ft: All
MLS Areas: 1A
Clarus MarketMetrics® 1 of 2 01/04/2012
Information not guaranteed. © 2009-2010 Terradatum and its suppliers and licensors (www.terradatum.com/about/licensors.td).
www.TaylorRealEstateAustin.com | Direct: 512.796.4447 | Fax: 512.628.7720 | 2525 Wallingwood Bldg. 7C Austin, TX 78746
13 of 20
- 14. Blake Taylor Taylor Real Estate
Expired Properties by Month
Dec-09 vs. Dec-11: The number of Expired properties is down 21%
Full Market Bank Properties Non-Bank Properties
Time Period # Properties Median Price Average DOM # Properties % Bank Median Price # Properties % Non-Bank Median Price
Dec-11 22 221,975 98 1 4.5 124,900 21 95.5 224,950
Nov-11 22 387,000 164 0 22 100.0 387,000
Oct-11 21 300,000 134 0 21 100.0 300,000
Sep-11 26 427,000 128 0 26 100.0 427,000
Aug-11 27 234,900 146 1 3.7 100,000 26 96.3 236,900
Jul-11 20 322,450 105 0 20 100.0 322,450
Jun-11 28 209,450 142 0 28 100.0 209,450
May-11 22 377,200 115 0 22 100.0 377,200
Apr-11 8 373,900 182 0 8 100.0 373,900
Mar-11 11 359,000 155 0 11 100.0 359,000
Feb-11 15 275,000 113 0 15 100.0 275,000
Jan-11 21 299,000 125 0 21 100.0 299,000
Dec-10 41 399,000 118 0 41 100.0 399,000
Nov-10 41 349,900 152 0 41 100.0 349,900
Oct-10 30 344,900 159 1 3.3 135,000 29 96.7 349,900
Sep-10 32 405,000 150 1 3.1 142,900 31 96.9 425,000
Aug-10 34 200,900 110 4 11.8 139,000 30 88.2 240,700
Jul-10 23 330,000 131 0 23 100.0 330,000
Jun-10 27 251,965 111 1 3.7 163,900 26 96.3 263,474
May-10 17 159,900 136 1 5.9 179,900 16 94.1 149,925
Apr-10 12 462,500 56 1 8.3 450,000 11 91.7 475,000
Mar-10 21 194,000 130 1 4.8 119,000 20 95.2 209,500
Feb-10 10 164,700 144 0 10 100.0 164,700
Jan-10 16 464,450 138 0 16 100.0 464,450
Dec-09 28 427,475 164 0 28 100.0 427,475
Clarus MarketMetrics® 2 of 2 01/04/2012
Information not guaranteed. © 2009-2010 Terradatum and its suppliers and licensors (www.terradatum.com/about/licensors.td).
www.TaylorRealEstateAustin.com | Direct: 512.796.4447 | Fax: 512.628.7720 | 2525 Wallingwood Bldg. 7C Austin, TX 78746
14 of 20
- 15. Blake Taylor Taylor Real Estate
Supply & Demand by Month
Dec-09 vs. Dec-11: The number of for sale properties is down 23% and the number of sold properties is up 55%
Dec-09 vs. Dec-11 Dec-09 vs. Dec-11
Dec-09 Dec-11 Change % Dec-09 Dec-11 Change %
167 129 -38 -23% 20 31 11 +55%
MLS: ACTRIS Period: 2 years (monthly) Price: All Construction Type: All Bedrooms: All Bathrooms: All Lot Size: All
Property Types: Residential: (House, Condo, Townhouse, Half Duplex, Modular) Sq Ft: All
MLS Areas: 1A
Clarus MarketMetrics® 1 of 2 01/04/2012
Information not guaranteed. © 2009-2010 Terradatum and its suppliers and licensors (www.terradatum.com/about/licensors.td).
www.TaylorRealEstateAustin.com | Direct: 512.796.4447 | Fax: 512.628.7720 | 2525 Wallingwood Bldg. 7C Austin, TX 78746
15 of 20
- 16. Blake Taylor Taylor Real Estate
Supply & Demand by Month
Dec-09 vs. Dec-11: The number of for sale properties is down 23% and the number of sold properties is up 55%
# Properties Average DOM # Properties Average DOM
Time Period For Sale For Sale Sold Sold
Dec-11 129 104 31 49
Nov-11 159 102 25 53
Oct-11 170 99 20 41
Sep-11 176 97 30 80
Aug-11 192 101 24 79
Jul-11 209 100 45 87
Jun-11 239 98 45 55
May-11 247 93 36 54
Apr-11 233 88 30 53
Mar-11 204 93 33 101
Feb-11 172 110 26 59
Jan-11 177 114 18 86
Dec-10 197 115 24 79
Nov-10 244 106 23 62
Oct-10 258 104 24 66
Sep-10 265 101 20 57
Aug-10 259 99 32 83
Jul-10 275 88 28 55
Jun-10 258 90 37 55
May-10 249 83 25 49
Apr-10 238 73 37 67
Mar-10 208 88 35 65
Feb-10 171 99 25 68
Jan-10 166 108 13 49
Dec-09 167 124 20 85
Clarus MarketMetrics® 2 of 2 01/04/2012
Information not guaranteed. © 2009-2010 Terradatum and its suppliers and licensors (www.terradatum.com/about/licensors.td).
www.TaylorRealEstateAustin.com | Direct: 512.796.4447 | Fax: 512.628.7720 | 2525 Wallingwood Bldg. 7C Austin, TX 78746
16 of 20
- 17. Blake Taylor Taylor Real Estate
The Average Days on Market by Month
Dec-09 vs. Dec-11: The average days on market is down 42%
Dec-09 vs. Dec-11
Dec-09 Dec-11 Change %
91 53 -38 -42%
MLS: ACTRIS Period: 2 years (monthly) Price: All Construction Type: All Bedrooms: All Bathrooms: All Lot Size: All
Property Types: Residential: (House, Condo, Townhouse, Half Duplex, Modular) Sq Ft: All
MLS Areas: 1A
Clarus MarketMetrics® 1 of 2 01/04/2012
Information not guaranteed. © 2009-2010 Terradatum and its suppliers and licensors (www.terradatum.com/about/licensors.td).
www.TaylorRealEstateAustin.com | Direct: 512.796.4447 | Fax: 512.628.7720 | 2525 Wallingwood Bldg. 7C Austin, TX 78746
17 of 20
- 18. Blake Taylor Taylor Real Estate
The Average Days on Market by Month
Dec-09 vs. Dec-11: The average days on market is down 42%
Time Period Average DOM # UC Units
Dec-11 53 27
Nov-11 54 33
Oct-11 42 25
Sep-11 49 23
Aug-11 83 25
Jul-11 85 41
Jun-11 76 40
May-11 57 44
Apr-11 50 32
Mar-11 57 35
Feb-11 74 31
Jan-11 84 21
Dec-10 82 20
Nov-10 75 24
Oct-10 76 24
Sep-10 63 21
Aug-10 67 19
Jul-10 65 32
Jun-10 82 28
May-10 38 32
Apr-10 53 36
Mar-10 76 39
Feb-10 51 29
Jan-10 73 27
Dec-09 91 16
Clarus MarketMetrics® 2 of 2 01/04/2012
Information not guaranteed. © 2009-2010 Terradatum and its suppliers and licensors (www.terradatum.com/about/licensors.td).
www.TaylorRealEstateAustin.com | Direct: 512.796.4447 | Fax: 512.628.7720 | 2525 Wallingwood Bldg. 7C Austin, TX 78746
18 of 20
- 19. Blake Taylor Taylor Real Estate
Months Supply of Inventory
Dec-09 vs. Dec-11: The average months supply of inventory is down 61%
Dec-09 vs. Dec-11
Dec-09 Dec-11 Change %
7.7 3.0 -4.7 -61%
MLS: ACTRIS Period: 2 years (monthly) Price: All Construction Type: All Bedrooms: All Bathrooms: All Lot Size: All
Property Types: Residential: (House, Condo, Townhouse, Half Duplex, Modular) Sq Ft: All
MLS Areas: 1A
Clarus MarketMetrics® 1 of 2 01/04/2012
Information not guaranteed. © 2009-2010 Terradatum and its suppliers and licensors (www.terradatum.com/about/licensors.td).
www.TaylorRealEstateAustin.com | Direct: 512.796.4447 | Fax: 512.628.7720 | 2525 Wallingwood Bldg. 7C Austin, TX 78746
19 of 20
- 20. Blake Taylor Taylor Real Estate
Months Supply of Inventory
Dec-09 vs. Dec-11: The average months supply of inventory is down 61%
# Units For Sale # UC Units UC Average
Time Period Last Day of Month During Month MSI DOM
Dec-11 80 27 3.0 53
Nov-11 104 33 3.2 54
Oct-11 124 25 5.0 42
Sep-11 127 23 5.5 49
Aug-11 140 25 5.6 83
Jul-11 148 41 3.6 85
Jun-11 171 40 4.3 76
May-11 181 44 4.1 57
Apr-11 193 32 6.0 50
Mar-11 158 35 4.5 57
Feb-11 126 31 4.1 74
Jan-11 135 21 6.4 84
Dec-10 136 20 6.8 82
Nov-10 179 24 7.5 75
Oct-10 204 24 8.5 76
Sep-10 212 21 10.1 63
Aug-10 206 19 10.8 67
Jul-10 220 32 6.9 65
Jun-10 203 28 7.2 82
May-10 200 32 6.2 38
Apr-10 190 36 5.3 53
Mar-10 148 39 3.8 76
Feb-10 132 29 4.6 51
Jan-10 123 27 4.6 73
Dec-09 123 16 7.7 91
Clarus MarketMetrics® 2 of 2 01/04/2012
Information not guaranteed. © 2009-2010 Terradatum and its suppliers and licensors (www.terradatum.com/about/licensors.td).
www.TaylorRealEstateAustin.com | Direct: 512.796.4447 | Fax: 512.628.7720 | 2525 Wallingwood Bldg. 7C Austin, TX 78746
20 of 20